JEPETTO User Guide
- Installation
- Enrichment analysis
- Topological analysis
- Other
Installation
System requirements
JEPETTO is platform independent and runs on Java virtual machine within the Cytoscape environment. It requires minimum 512MB RAM but 2GB RAM is recommended to work with larger networks (over 100 nodes).
To run it requires Java version 6 or higher (either OpenJDK or Oracle Java SE) and Cytoscape version 3.0 and higher.
How to enable JEPETTO in Cytoscape?
Open Application Manager in Cytoscape (Apps -> App Manager) and select JEPETTO from the list of plugins.

To start JEPETTO choose enrichment or topological analysis from Apps -> JEPETTO menu.

Enrichment analysis
Input
- choose enrichment analysis in the control panel
- select molecular interaction network
(default is STRING) - select gene ID format (default is HGNC)
- select the reference annotation database
(default is KEGG) - activate additional tissue-specific analysis if needed
- optionally, open advanced options to modify path expansion criteria
- to start the analysis either:
- insert list of genes (one gene ID per line) and
click "Use gene list" button or - select nodes in the active network window and
click "Use selected nodes" button
- insert list of genes (one gene ID per line) and
Results
The computations may take from a few seconds to a few minutes (for large gene sets or if tissue-specific analysis is enabled). When they are ready a new tab will appear in the Results Panel.

The ranking shows overlapping pathways/processes found in the reference database. They are sorted by the network based association score (XD-score) and a statistical significance of each overlap is given (q-value of the Fisher exact test adjusted for multiple testing using Benjamini and Hochberg procedure).
XD-score uses a random walk to score how close a pathway and the input gene set are in the molecular interaction network. It is relative to the background model (average distance between the input set and all pathways). Positive values of XD-score indicate a closer relationship than the average one, while negative values indicate a relationship more distant than the average.
The additional tabs contain mapping of the analysed gene set on the interaction network and a regression plot of the XD-score / q-value dependency (which shows the significance threshold for XD-score).
If tissue specific analysis was enabled, an extra tissue tab is shown with XD-scores for 60 human tissues. Each score is calculated with the molecular interaction network restricted to the specific tissue type.

Network view
To obtain the interaction network of the input gene set environment, choose a pathway/process and double click on it. The enriched network will be computed and shown in a new view window. The nodes are coloured as follows: query genes (grey), pathway genes (green), overlap between input and pathway (blue), pathway expansion (orange). The edges are coloured by type of the interaction: input set ↔ pathway (green), input set ↔ expansion (orange), others (grey).
If pathway expansion node is also in the input set, it will be shown as grey with an orange border. However, the border will be visible only when "Show graphics details" option from the "View" menu is enabled or when a user zooms in the network.

Warning: as path expansion is based on human protein-protein interaction network, for non-human gene sets the result might be meaningless (e.g. due to pathway rewiring in different organisms). Please interpret them with care.
Node details
Cytoscape table panel provides detailed information on each node: gene name, Ensembl ID in the interaction network and node type (gene set, overlap, pathway/process or added). The same information appears as a tooltip when mouse is moved over a node.


Topological analysis
Input
- choose topology analysis in the control panel
- select interaction network (default is large):
- large - 40k interactions from small-scale studies
(assembled from MIPS, DIP, BIND, HPRD and IntAct) - small - 5k interactions from proteome-scale studies (taken from the yeast 2-hybrid studies [Stelzl2005, Rual2005], to alleviate potential biases towards well-studied human proteins)
- large - 40k interactions from small-scale studies
- select gene ID format (default is HGNC)
- select the reference annotation database
(default is KEGG) - to start the analysis either:
- insert list of genes (one gene ID per line) and
click "Use gene list" button or - select nodes in the active network window and
click "Use selected nodes" button
- insert list of genes (one gene ID per line) and
Results
The computations should not take longer than 1 minute. When they are ready a new tab will appear in the "Results Panel".

The following average topological properties of the input gene set are measured: shortest path length (SPL), node betweenness centrality (NB), node degree (D), clustering coefficient (CC) and node eigenvector centrality (EC). They are compared to the properties of random interaction networks of the same size and the average properties in the entire interaction networks.
The second table lists closest biological mechanism found in the reference database sorted by the topological distance to the input set (measured as average normalised difference between the median values of all 5 properties).
The additional tabs contain mapping of the analysed gene set on the interaction network and a direct visual comparison of selected properties described below.
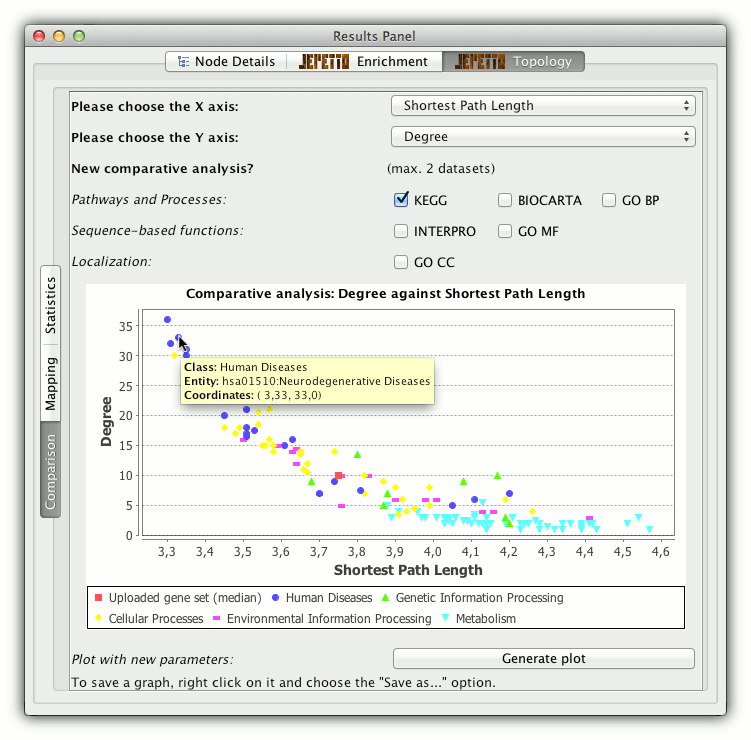
Comparative analysis
For more refined analysis of the topological similarity, two selected properties are plotted against each other and the input gene set is shown in relation to pathways and processes from the reference database. If KEGG is chosen as reference the biological mechanism are grouped into five classes and shown with different colours.
Advanced options
Path expansion criteria
The expansion algorithm chooses the pathway interaction partners that are strongly associated with the pathway nodes and increase the pathway compactness. In particular, the candidate node is accepted as strongly associated with the pathway of one of the following criteria is met:
- association threshold - a minimum ratio of interactions between the candidate node and the pathway vs interactions between the candidate and the rest of the network
- coverage threshold - a minimum ratio of pathway members connected to the candidate node
- triangle threshold - a minimum ratio of triangles between candidate node, a member of the pathway and another node connected to the pathway vs all such possible triangles
The thresholds can be set in the advanced options of the enrichment analysis. To obtain more significant (but smaller) expansion, increase the thresholds. To obtain larger expansion, decrease them.

Storing results
The "Save" button next to each results table stores the data on disk. Data are saved into a simple text file as tab-separated values. First row contains table headers.
Contact
If you have any question or comments about JEPETTO please contact us at jepetto.plugin@n.o.s.p.a.m.gmail.com.