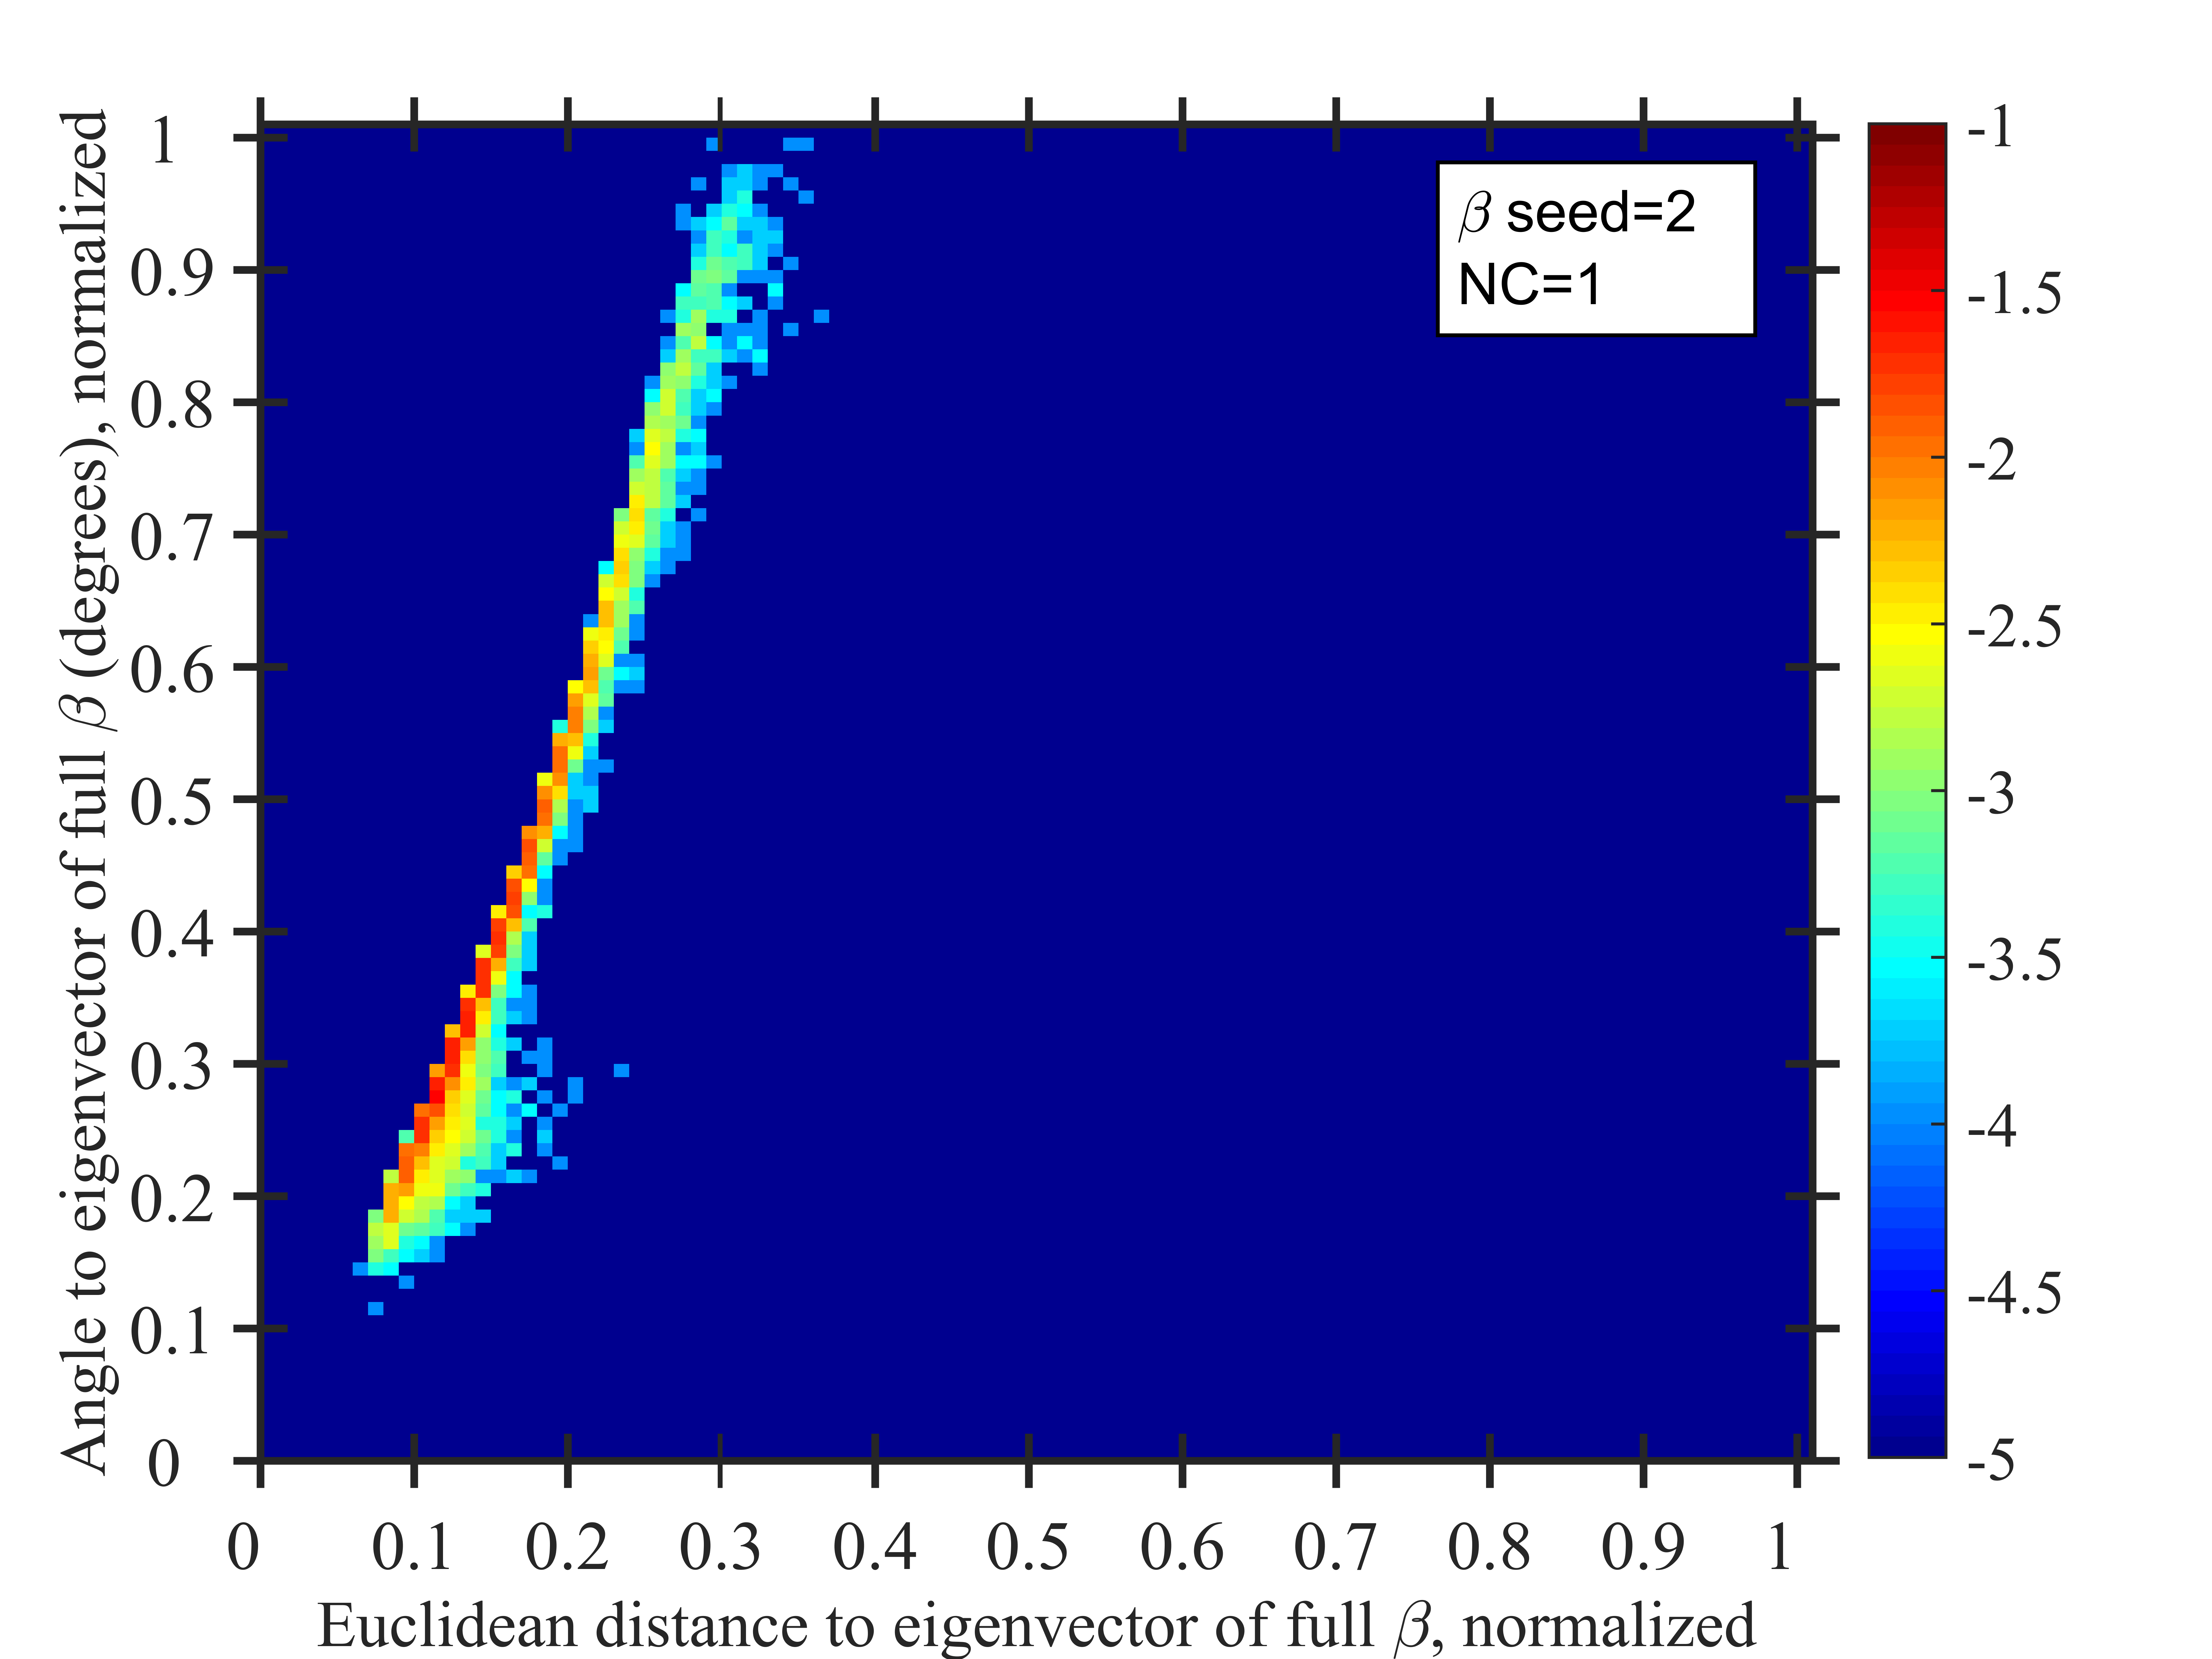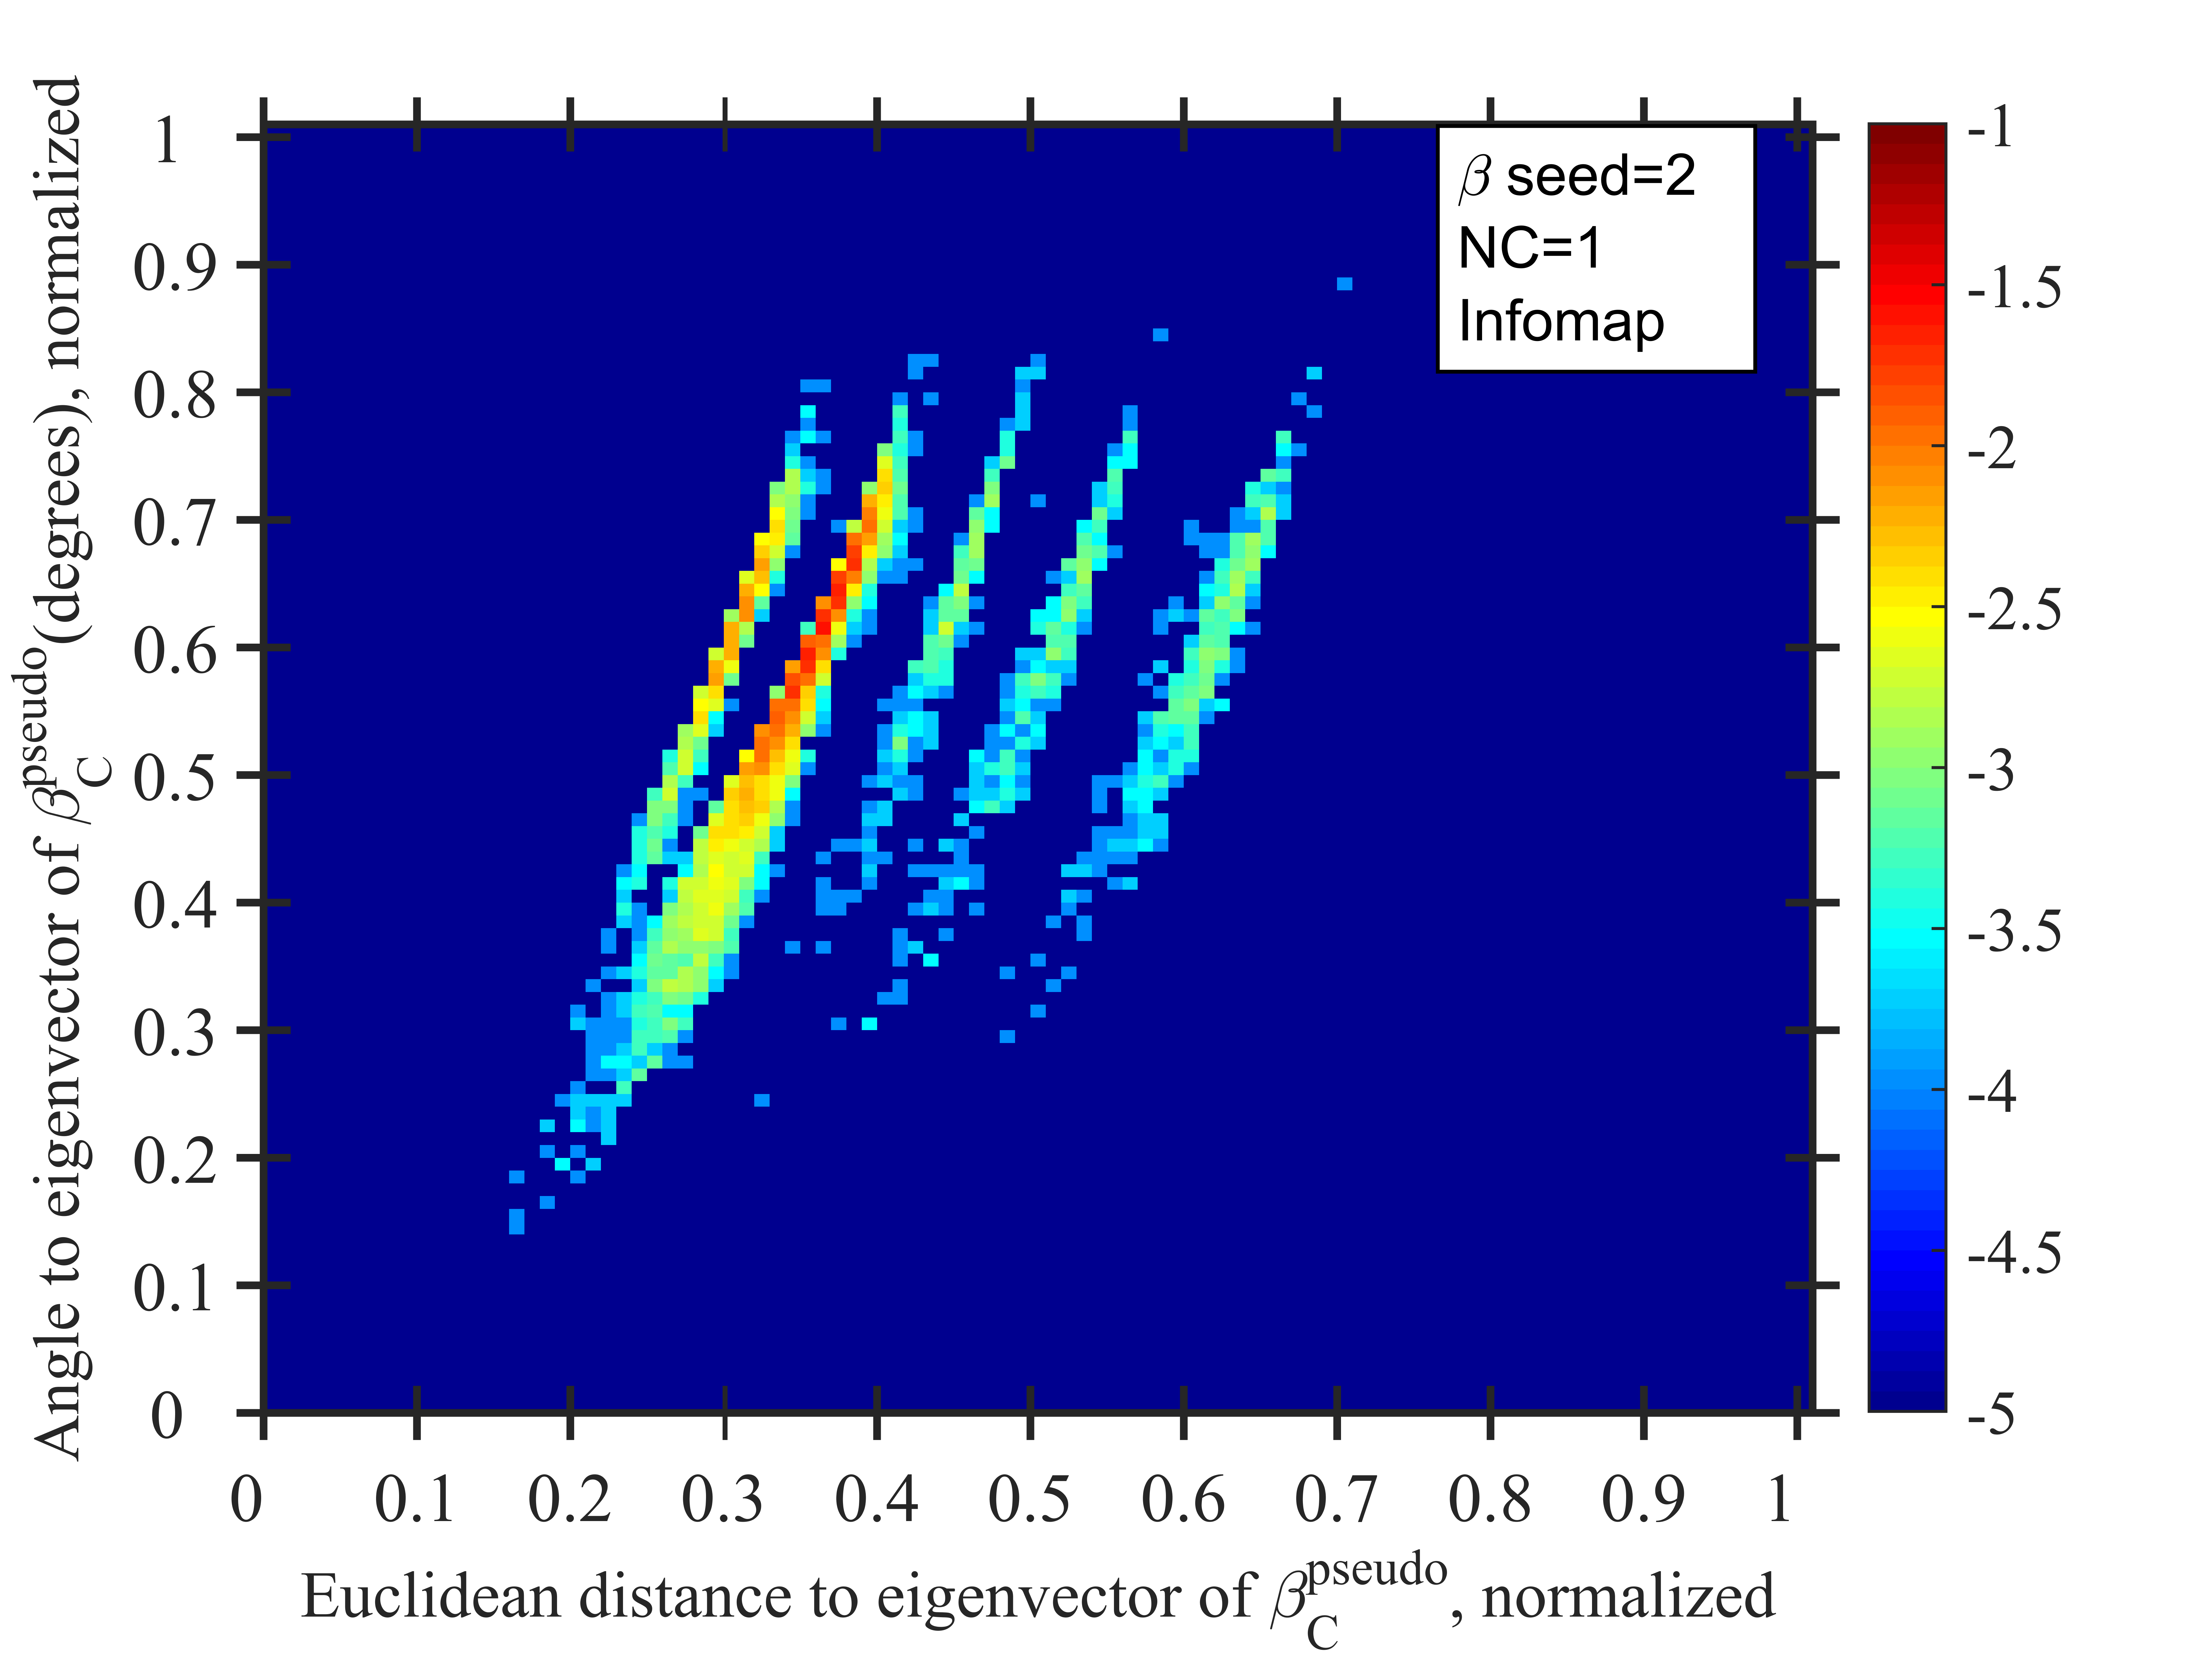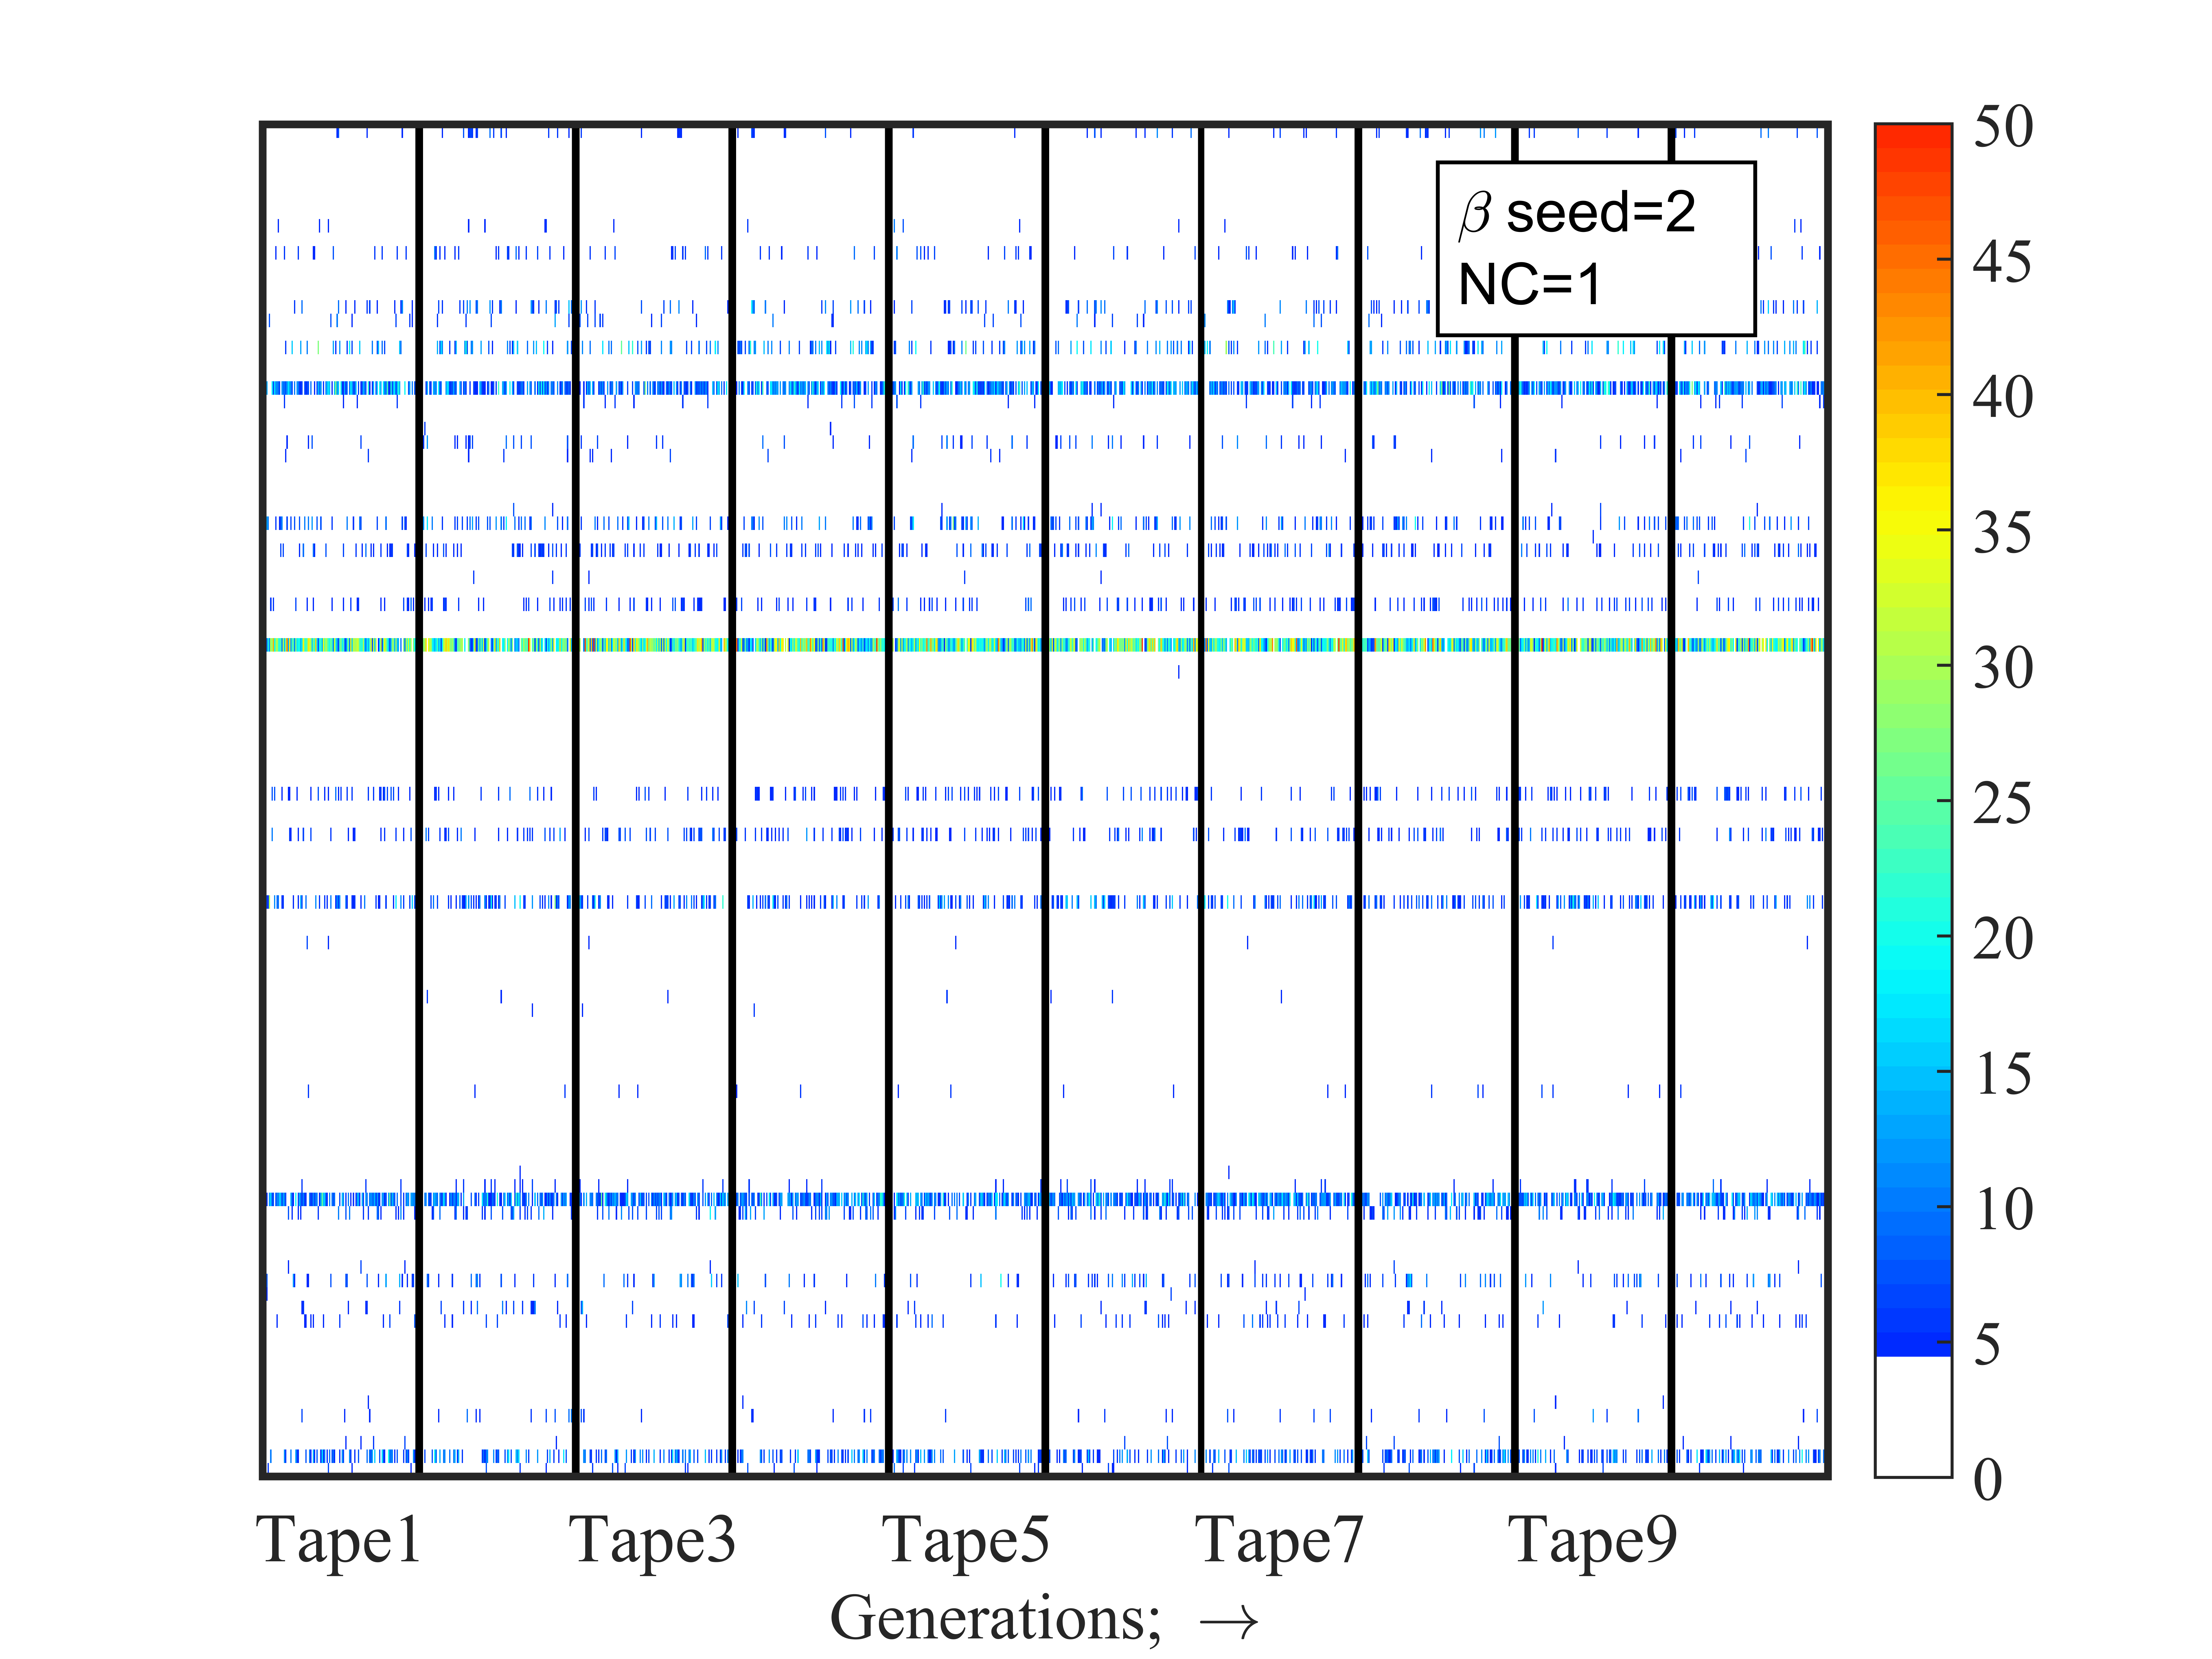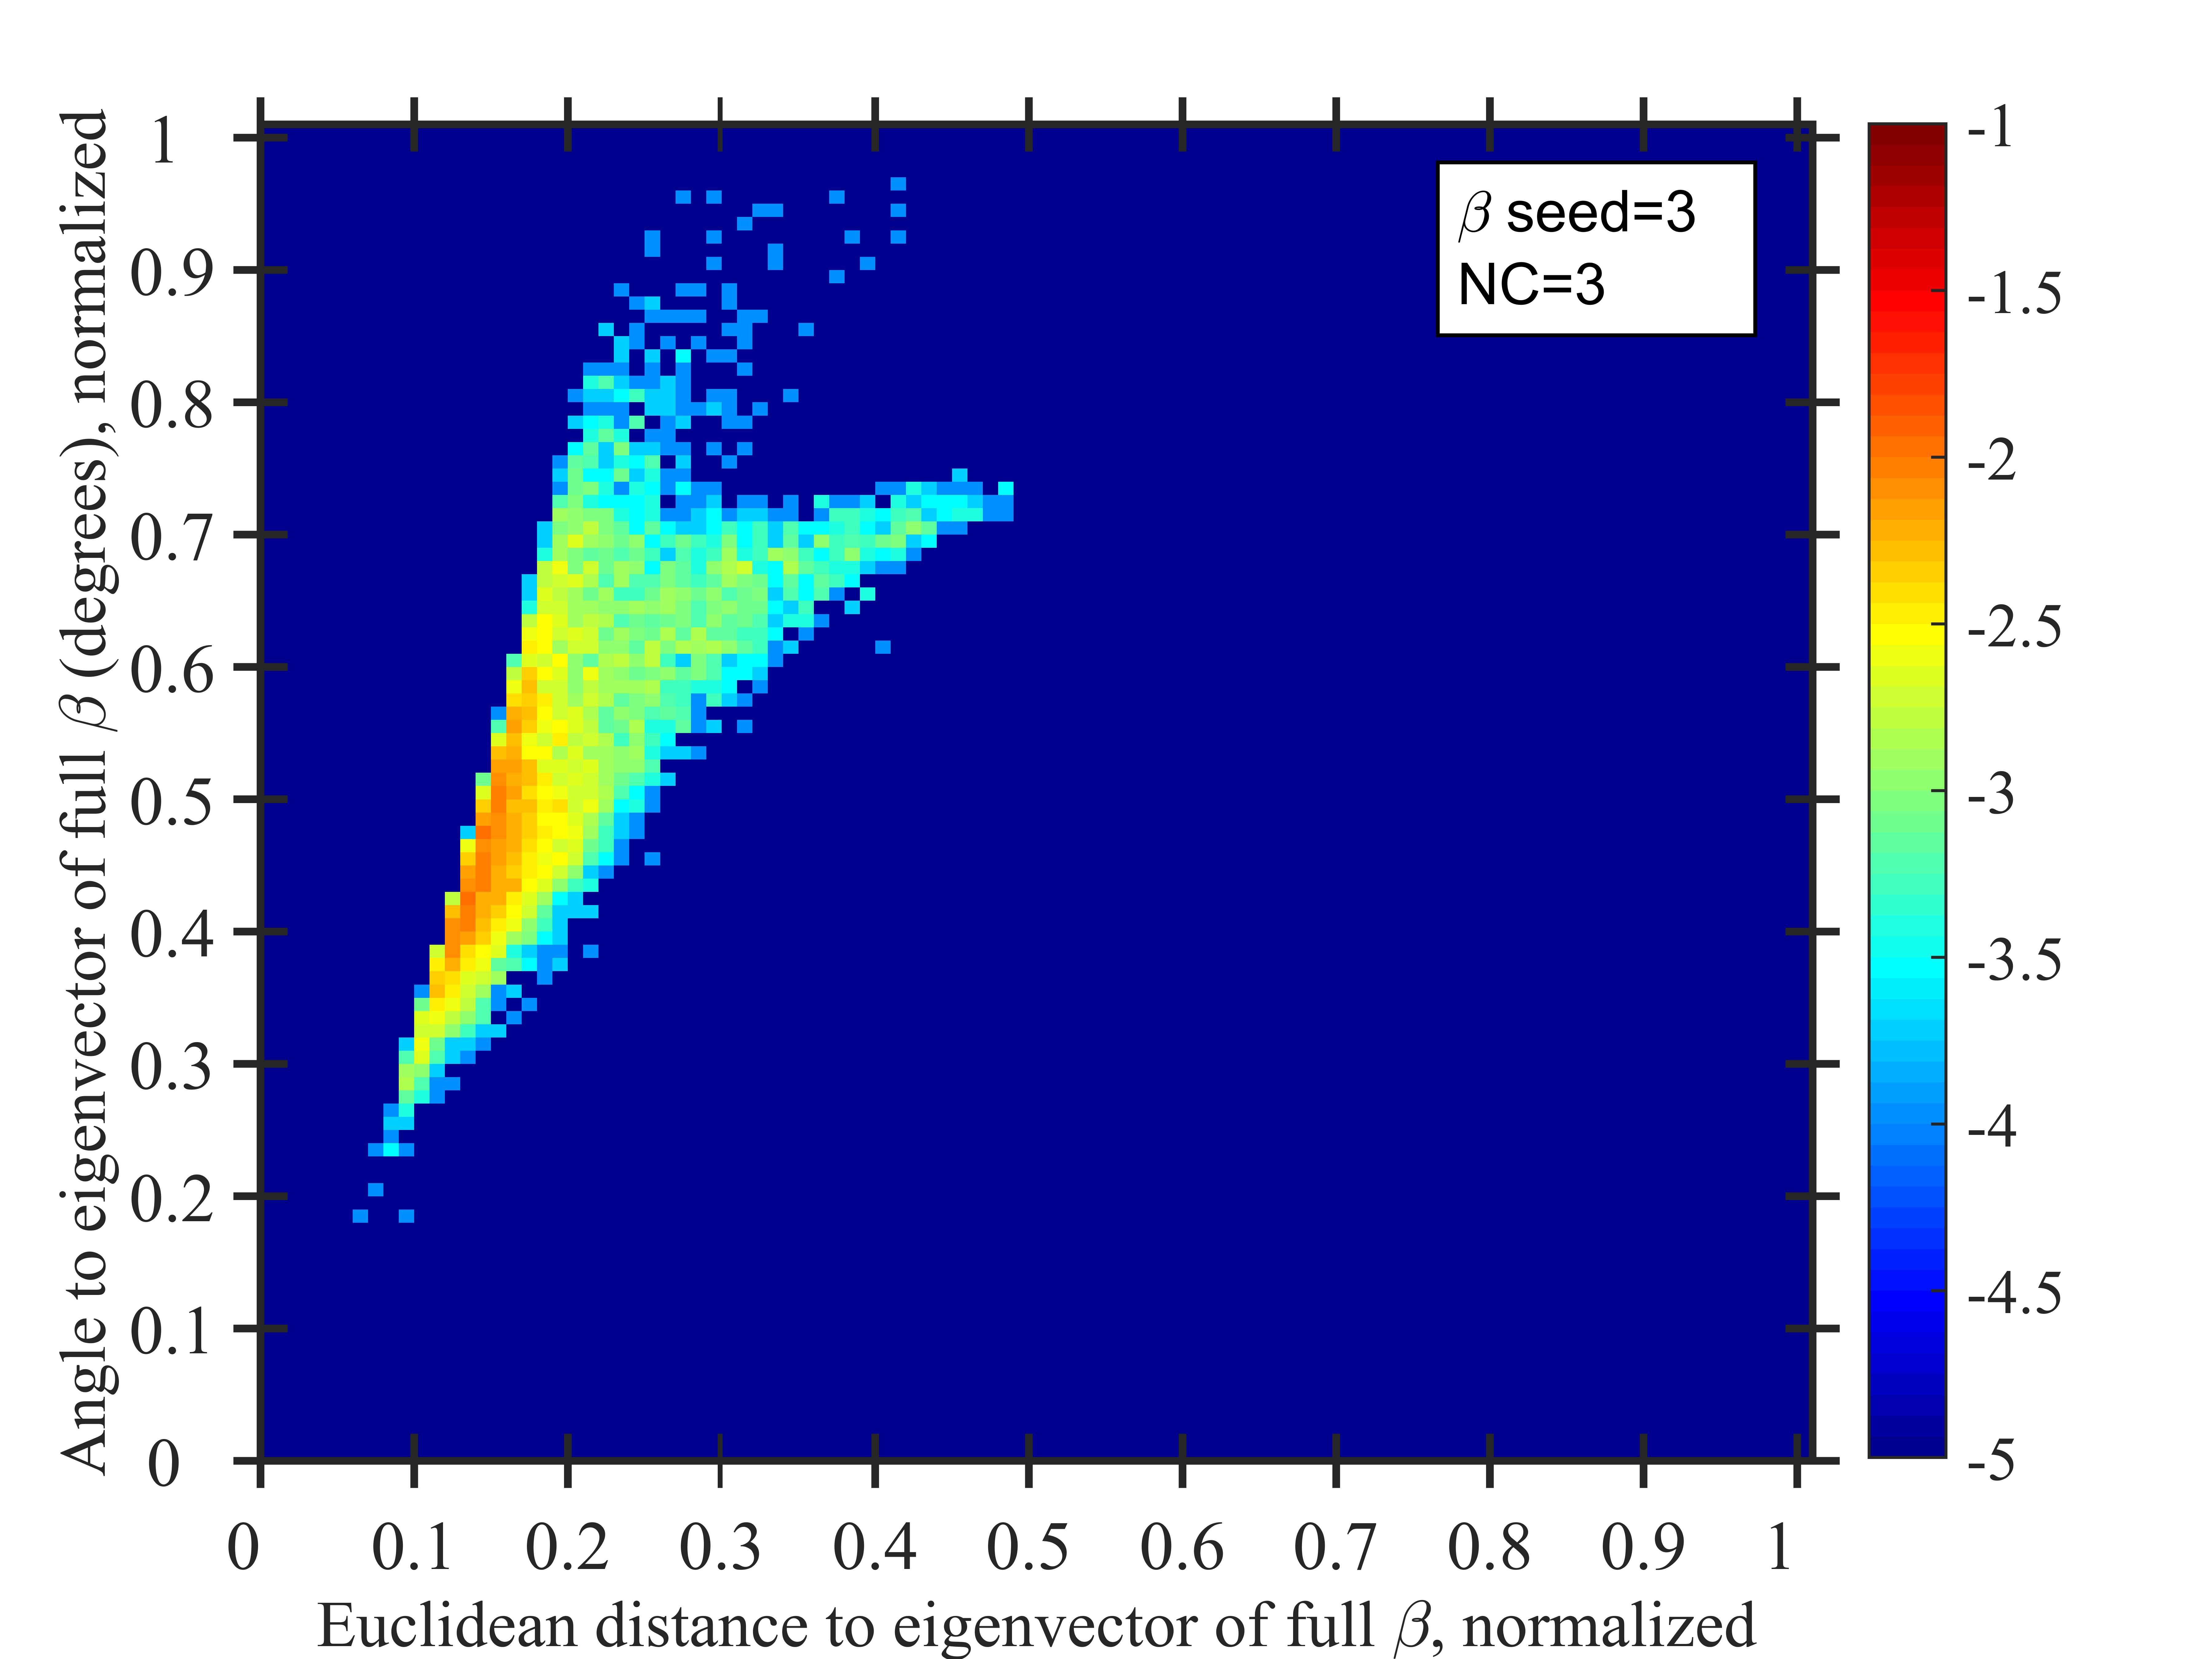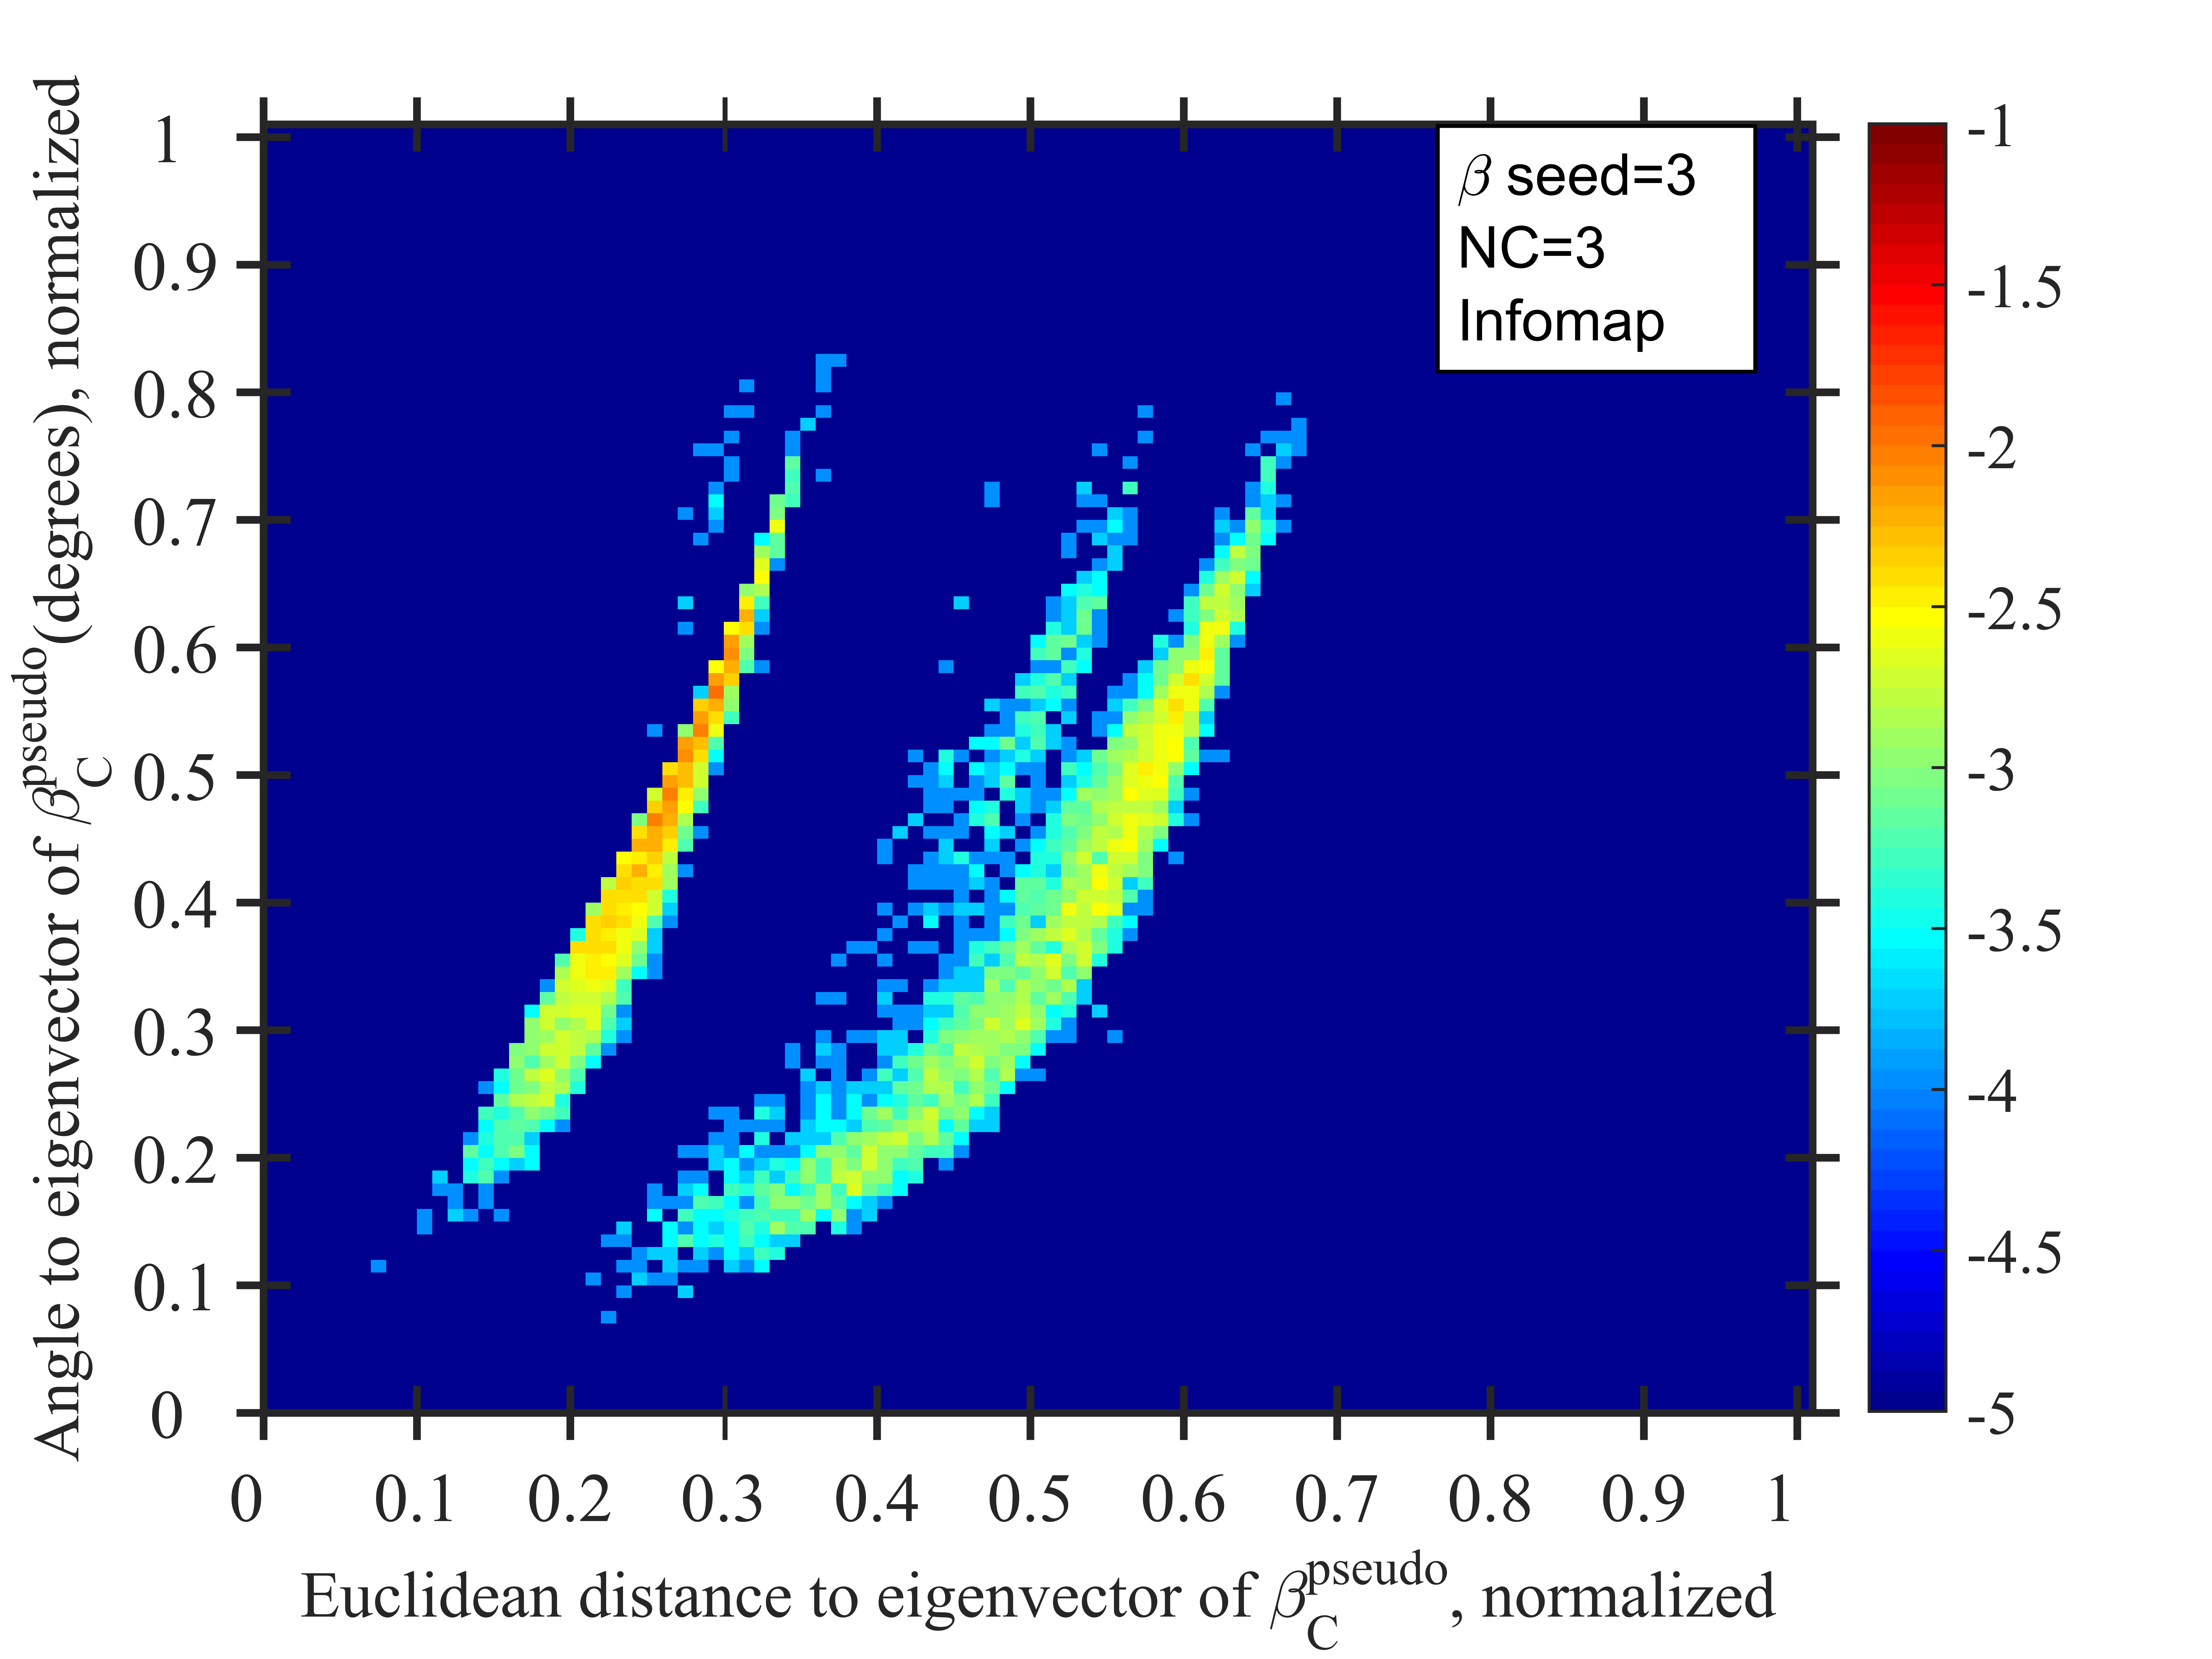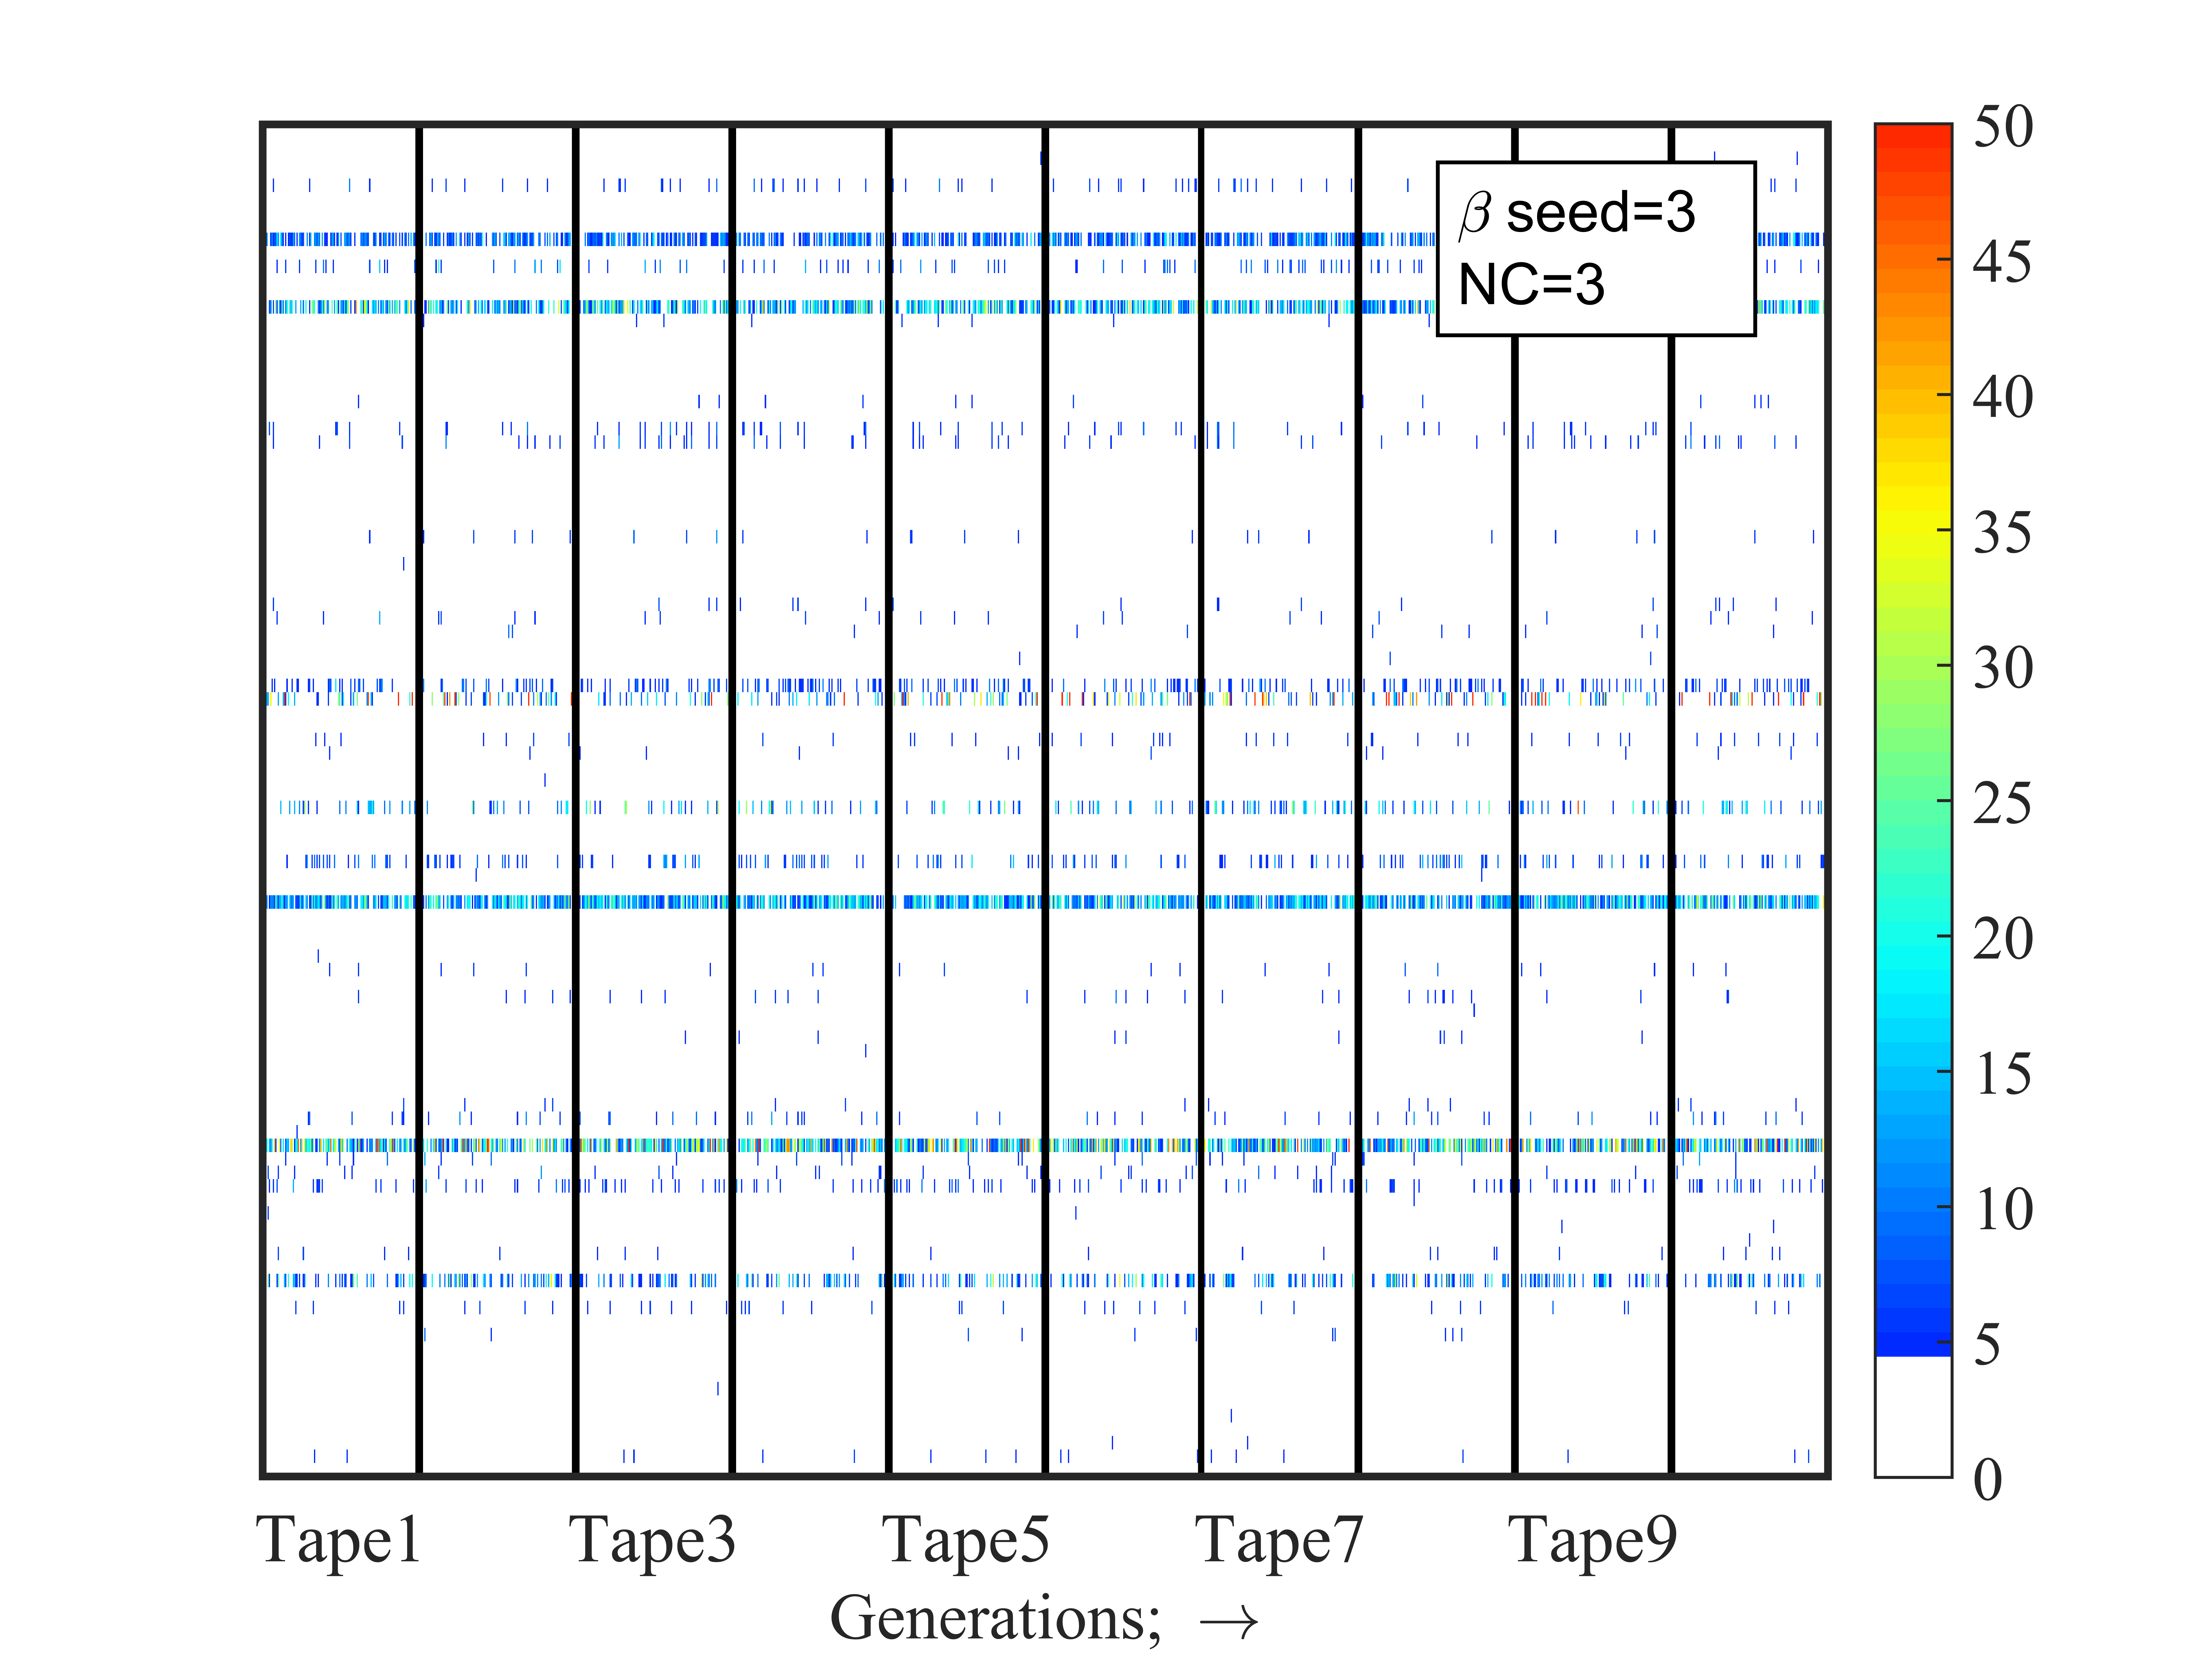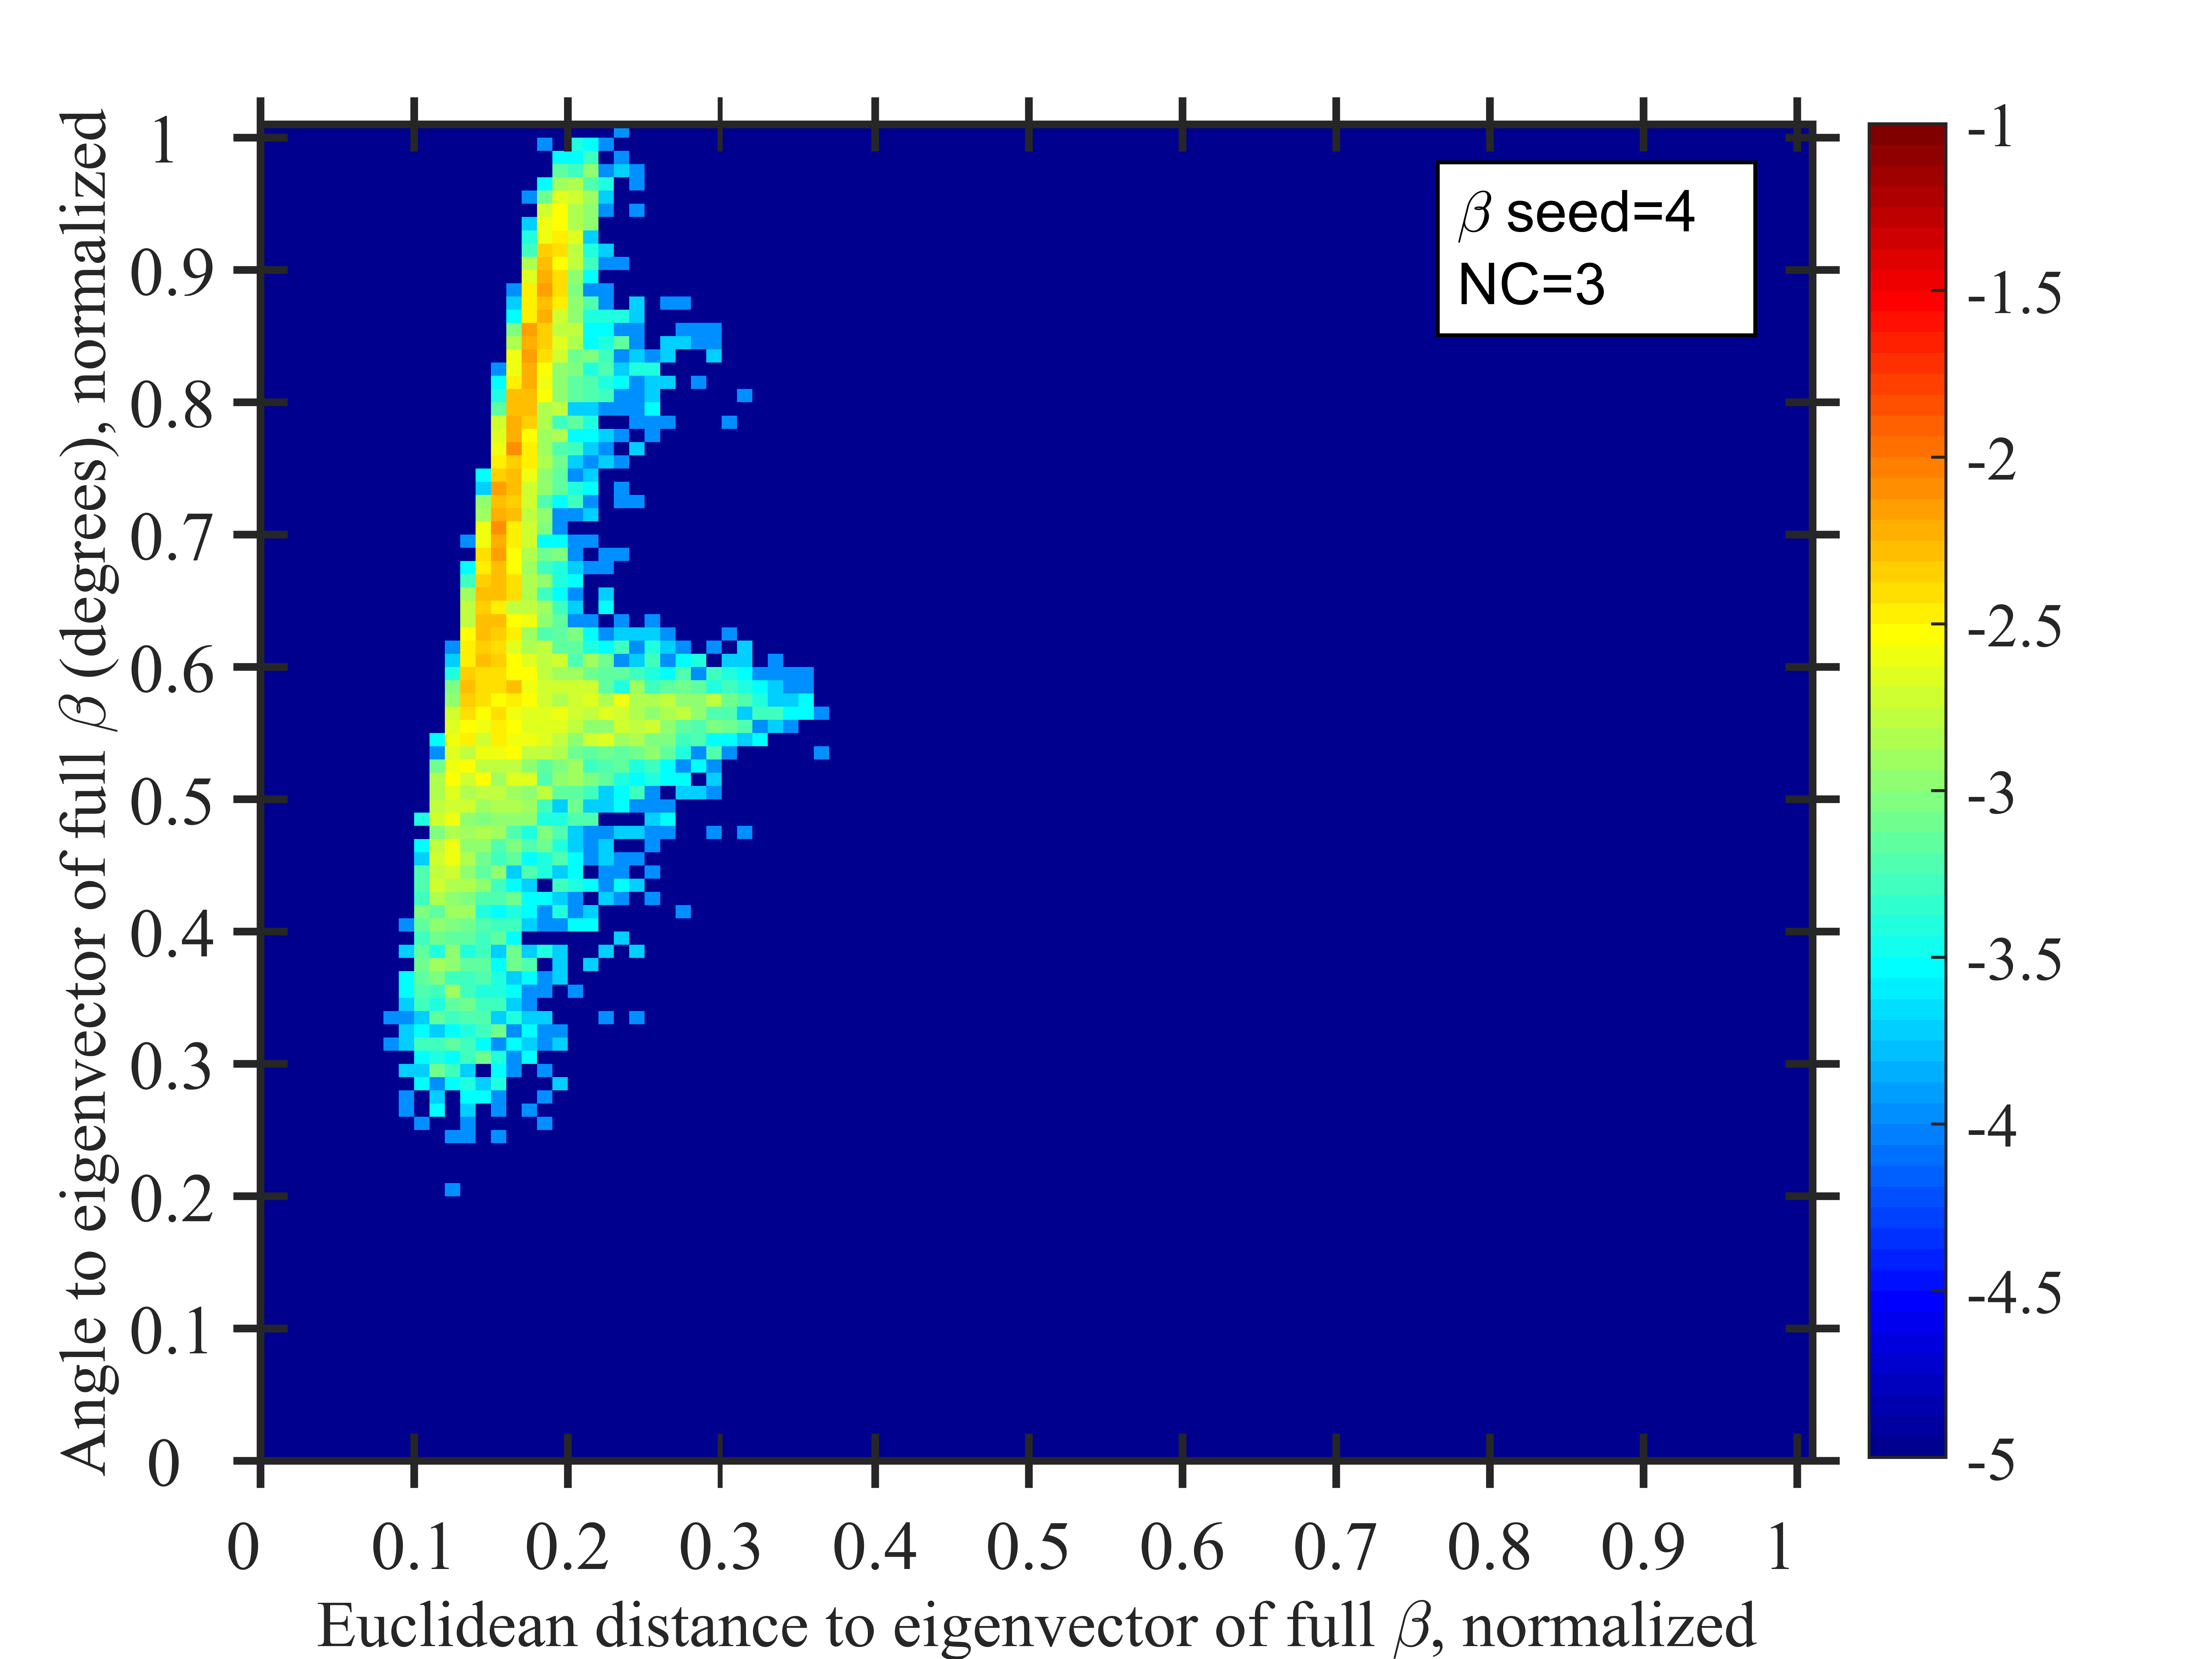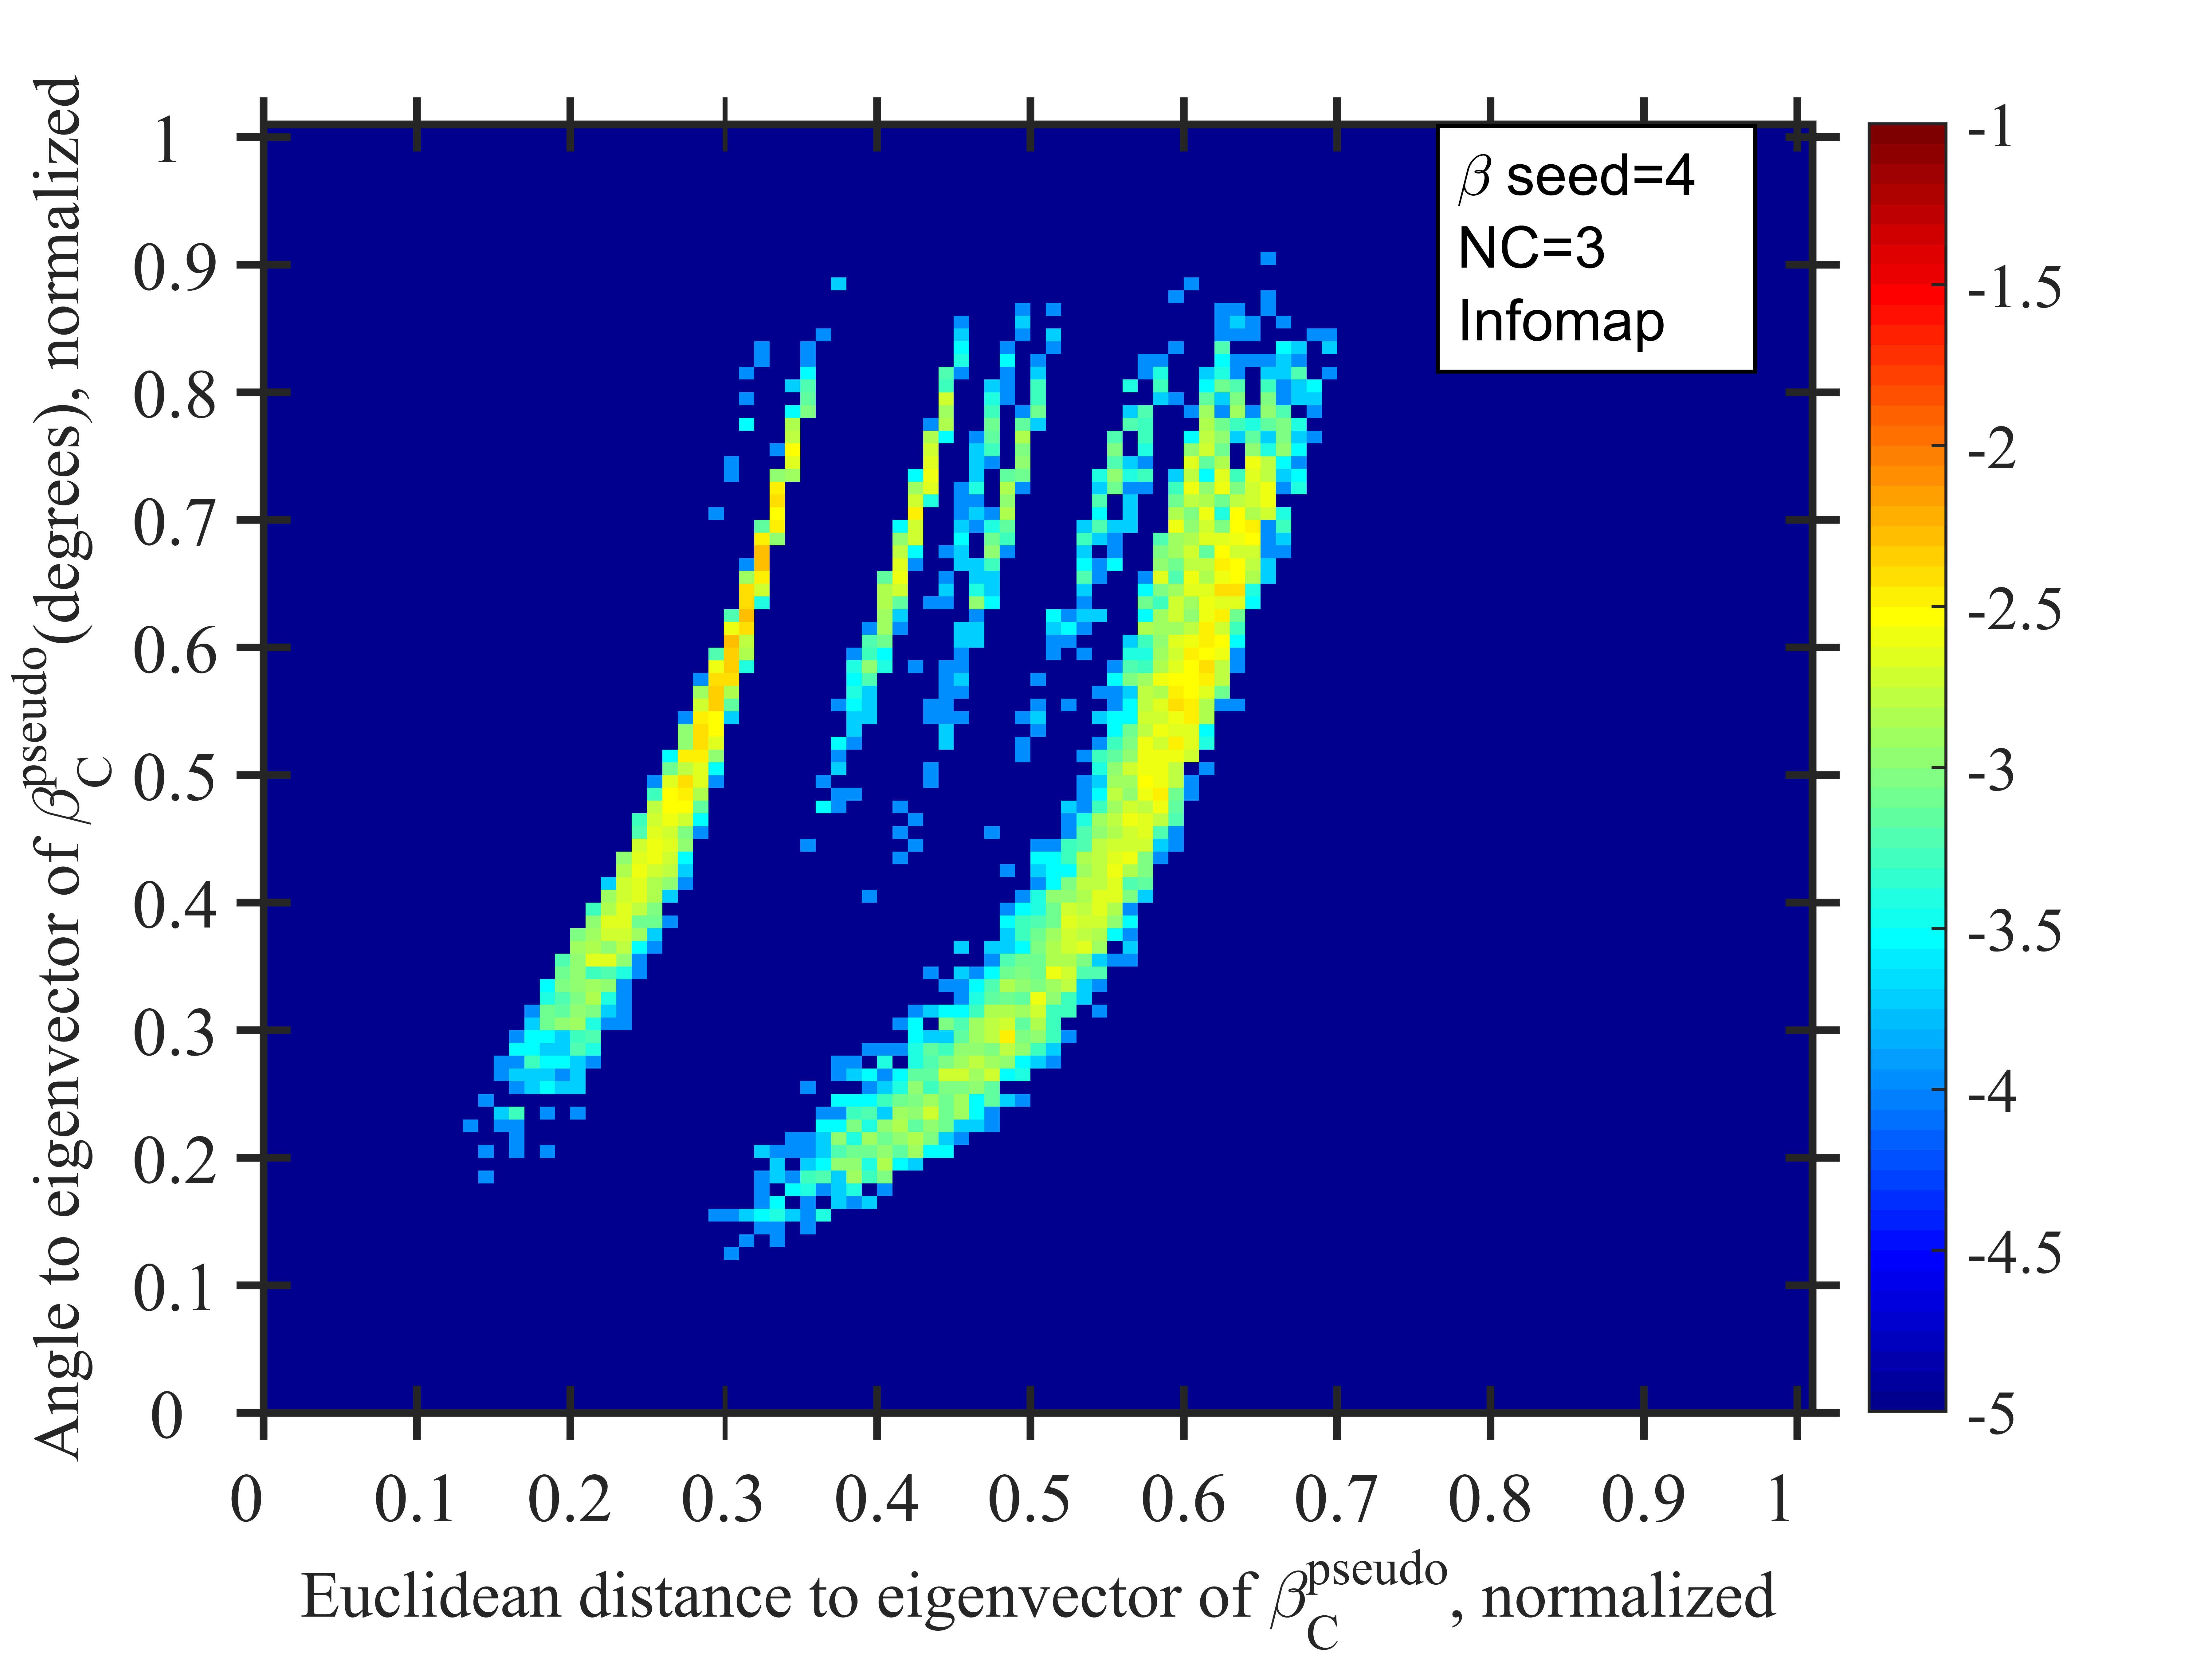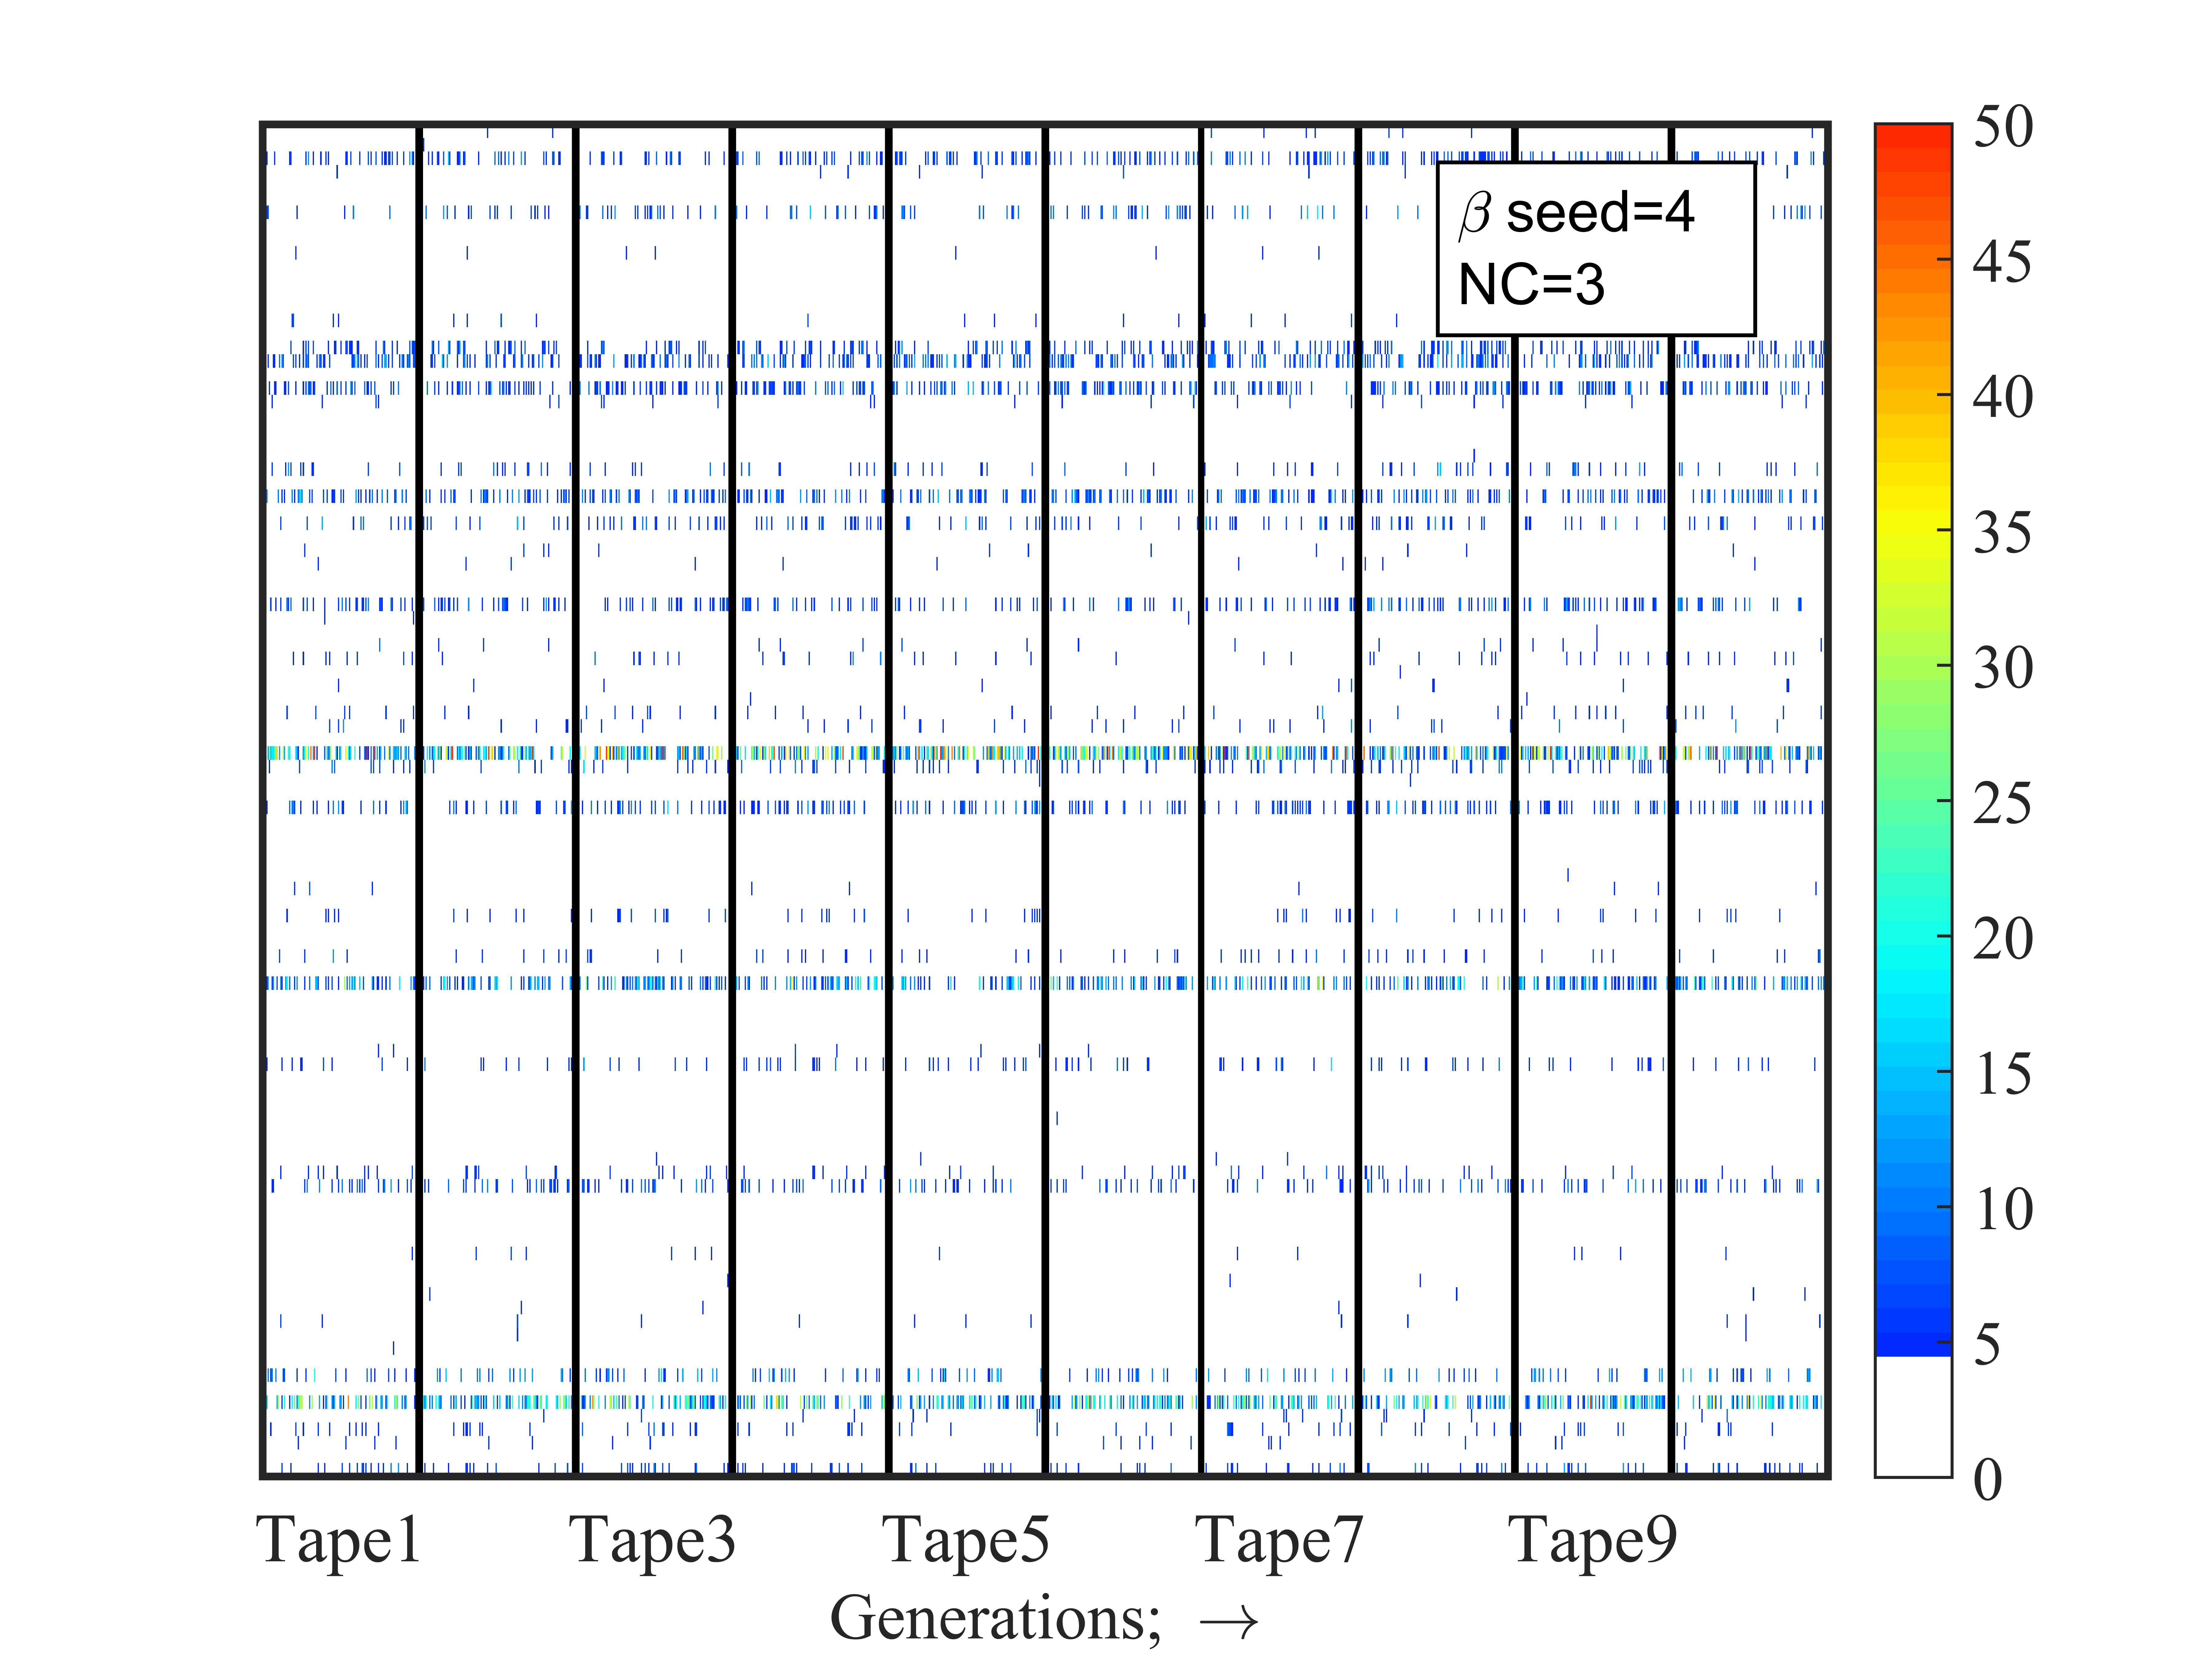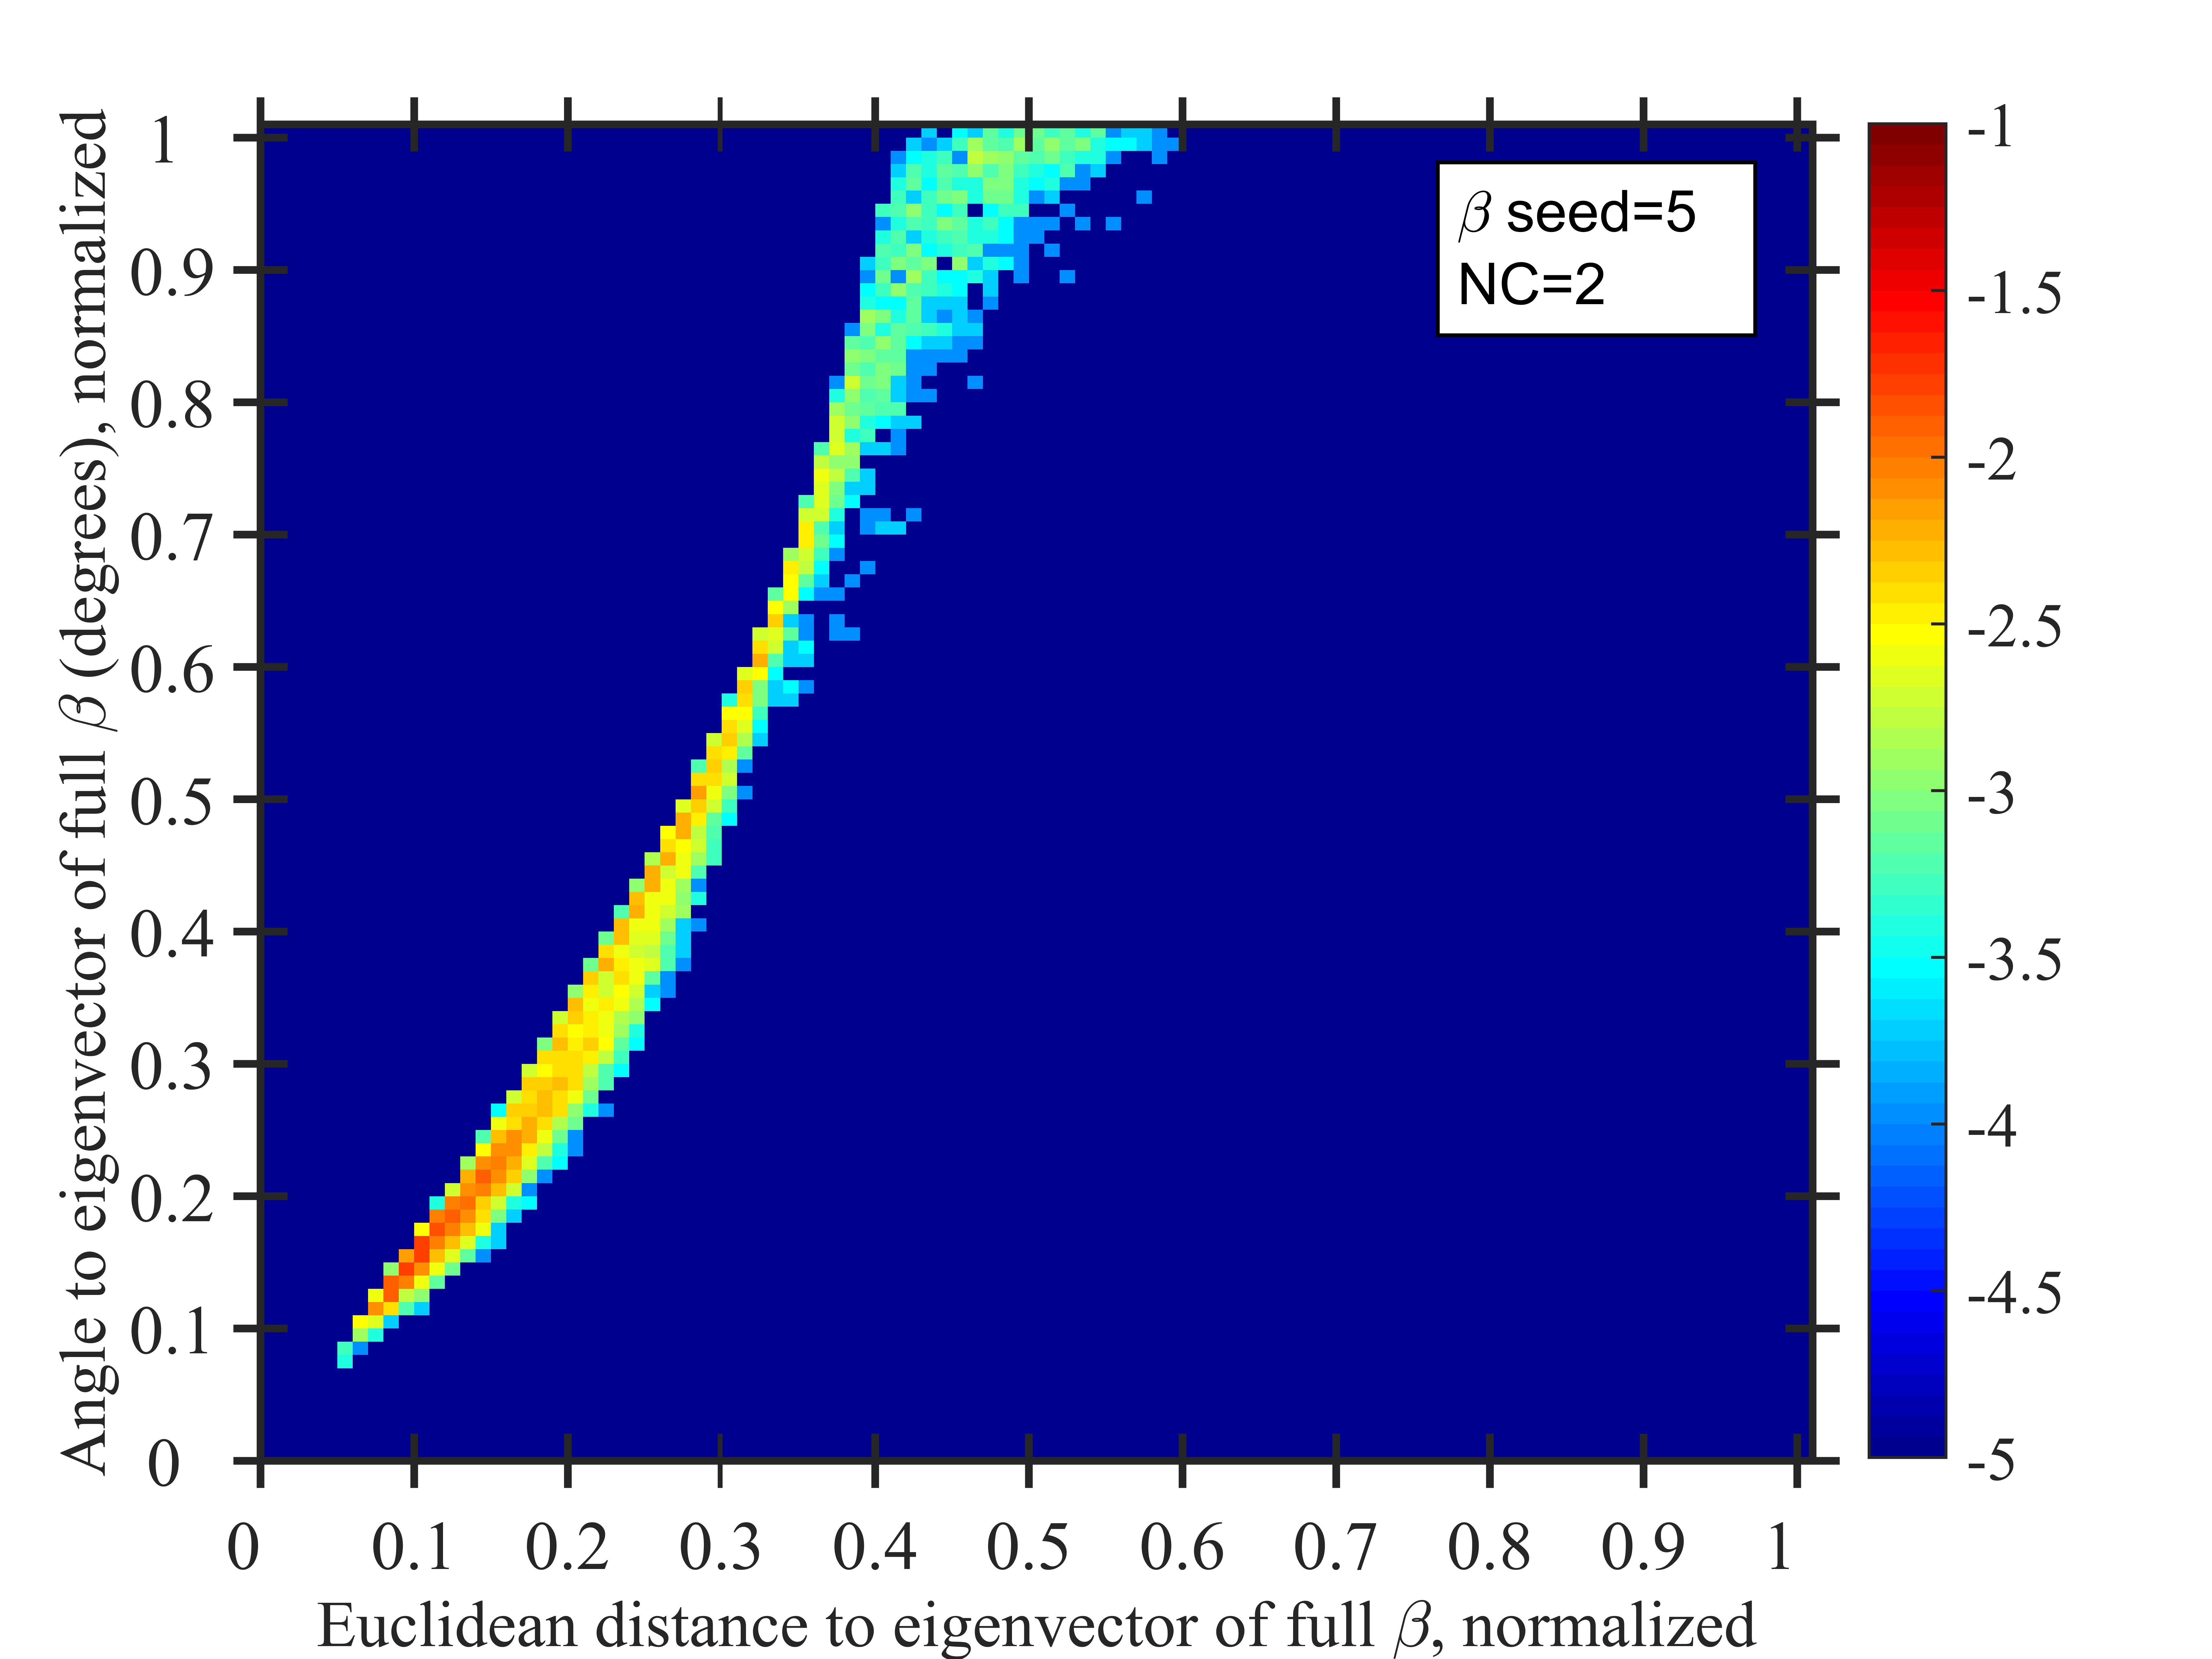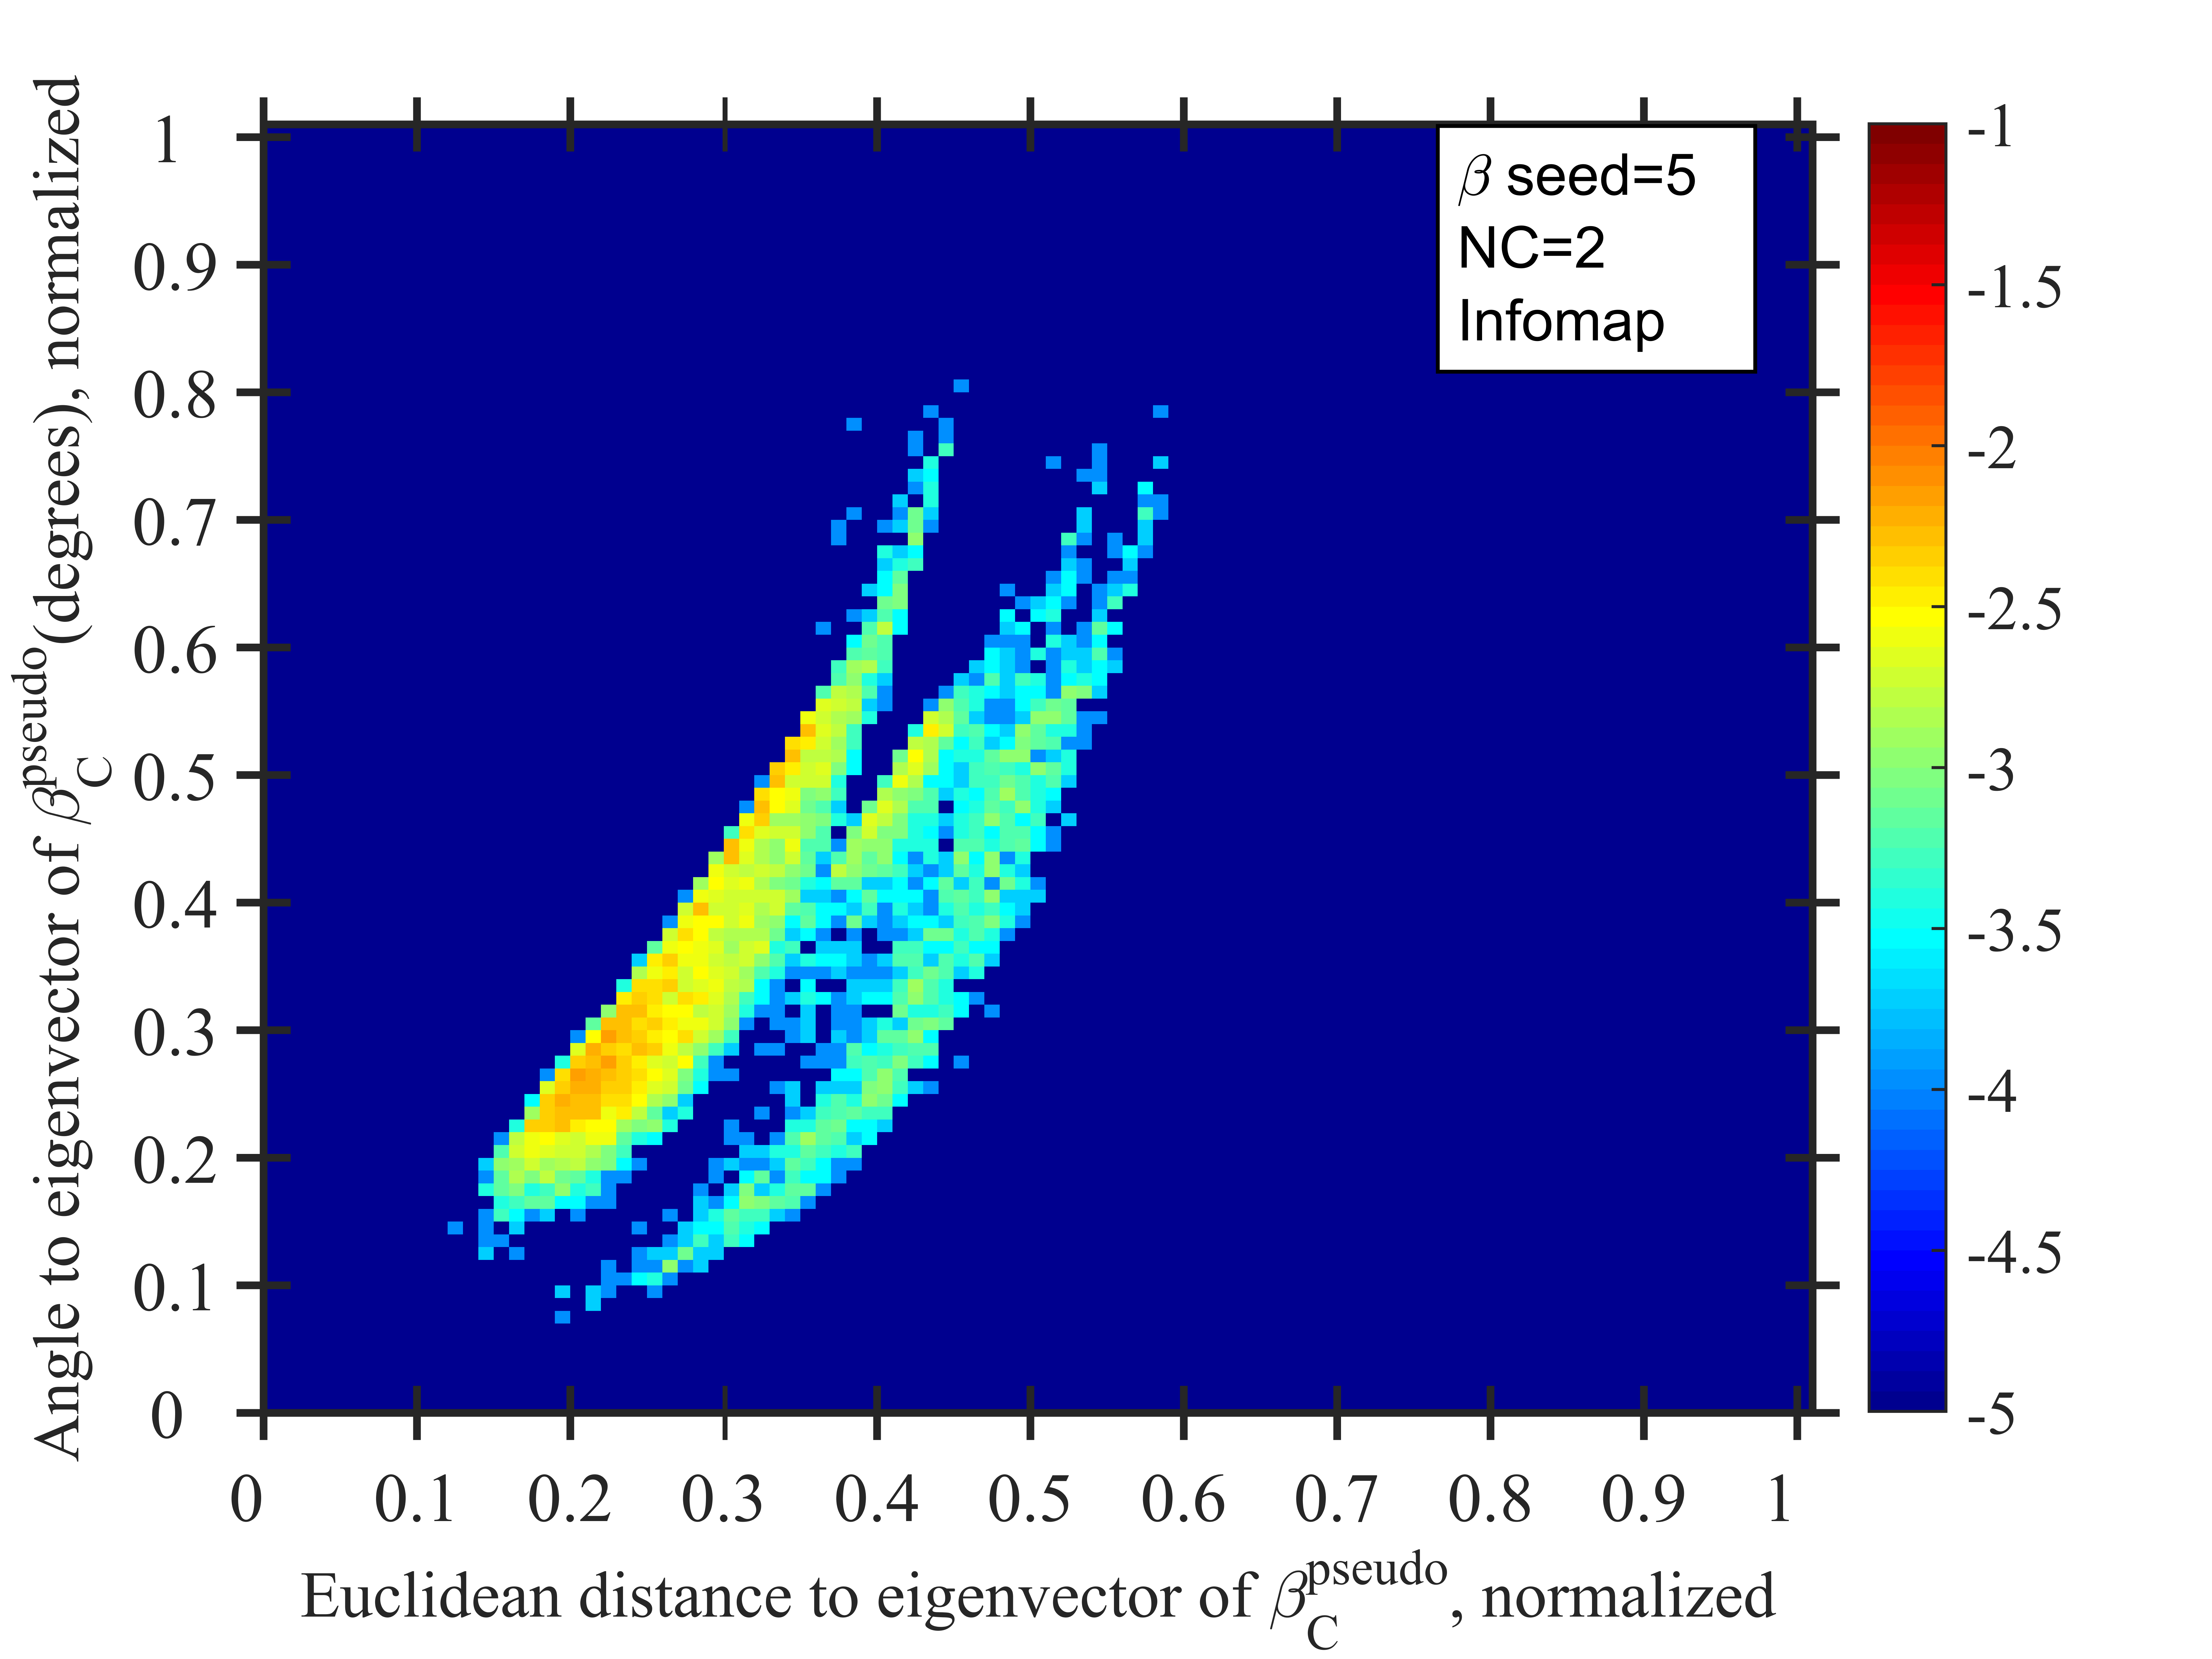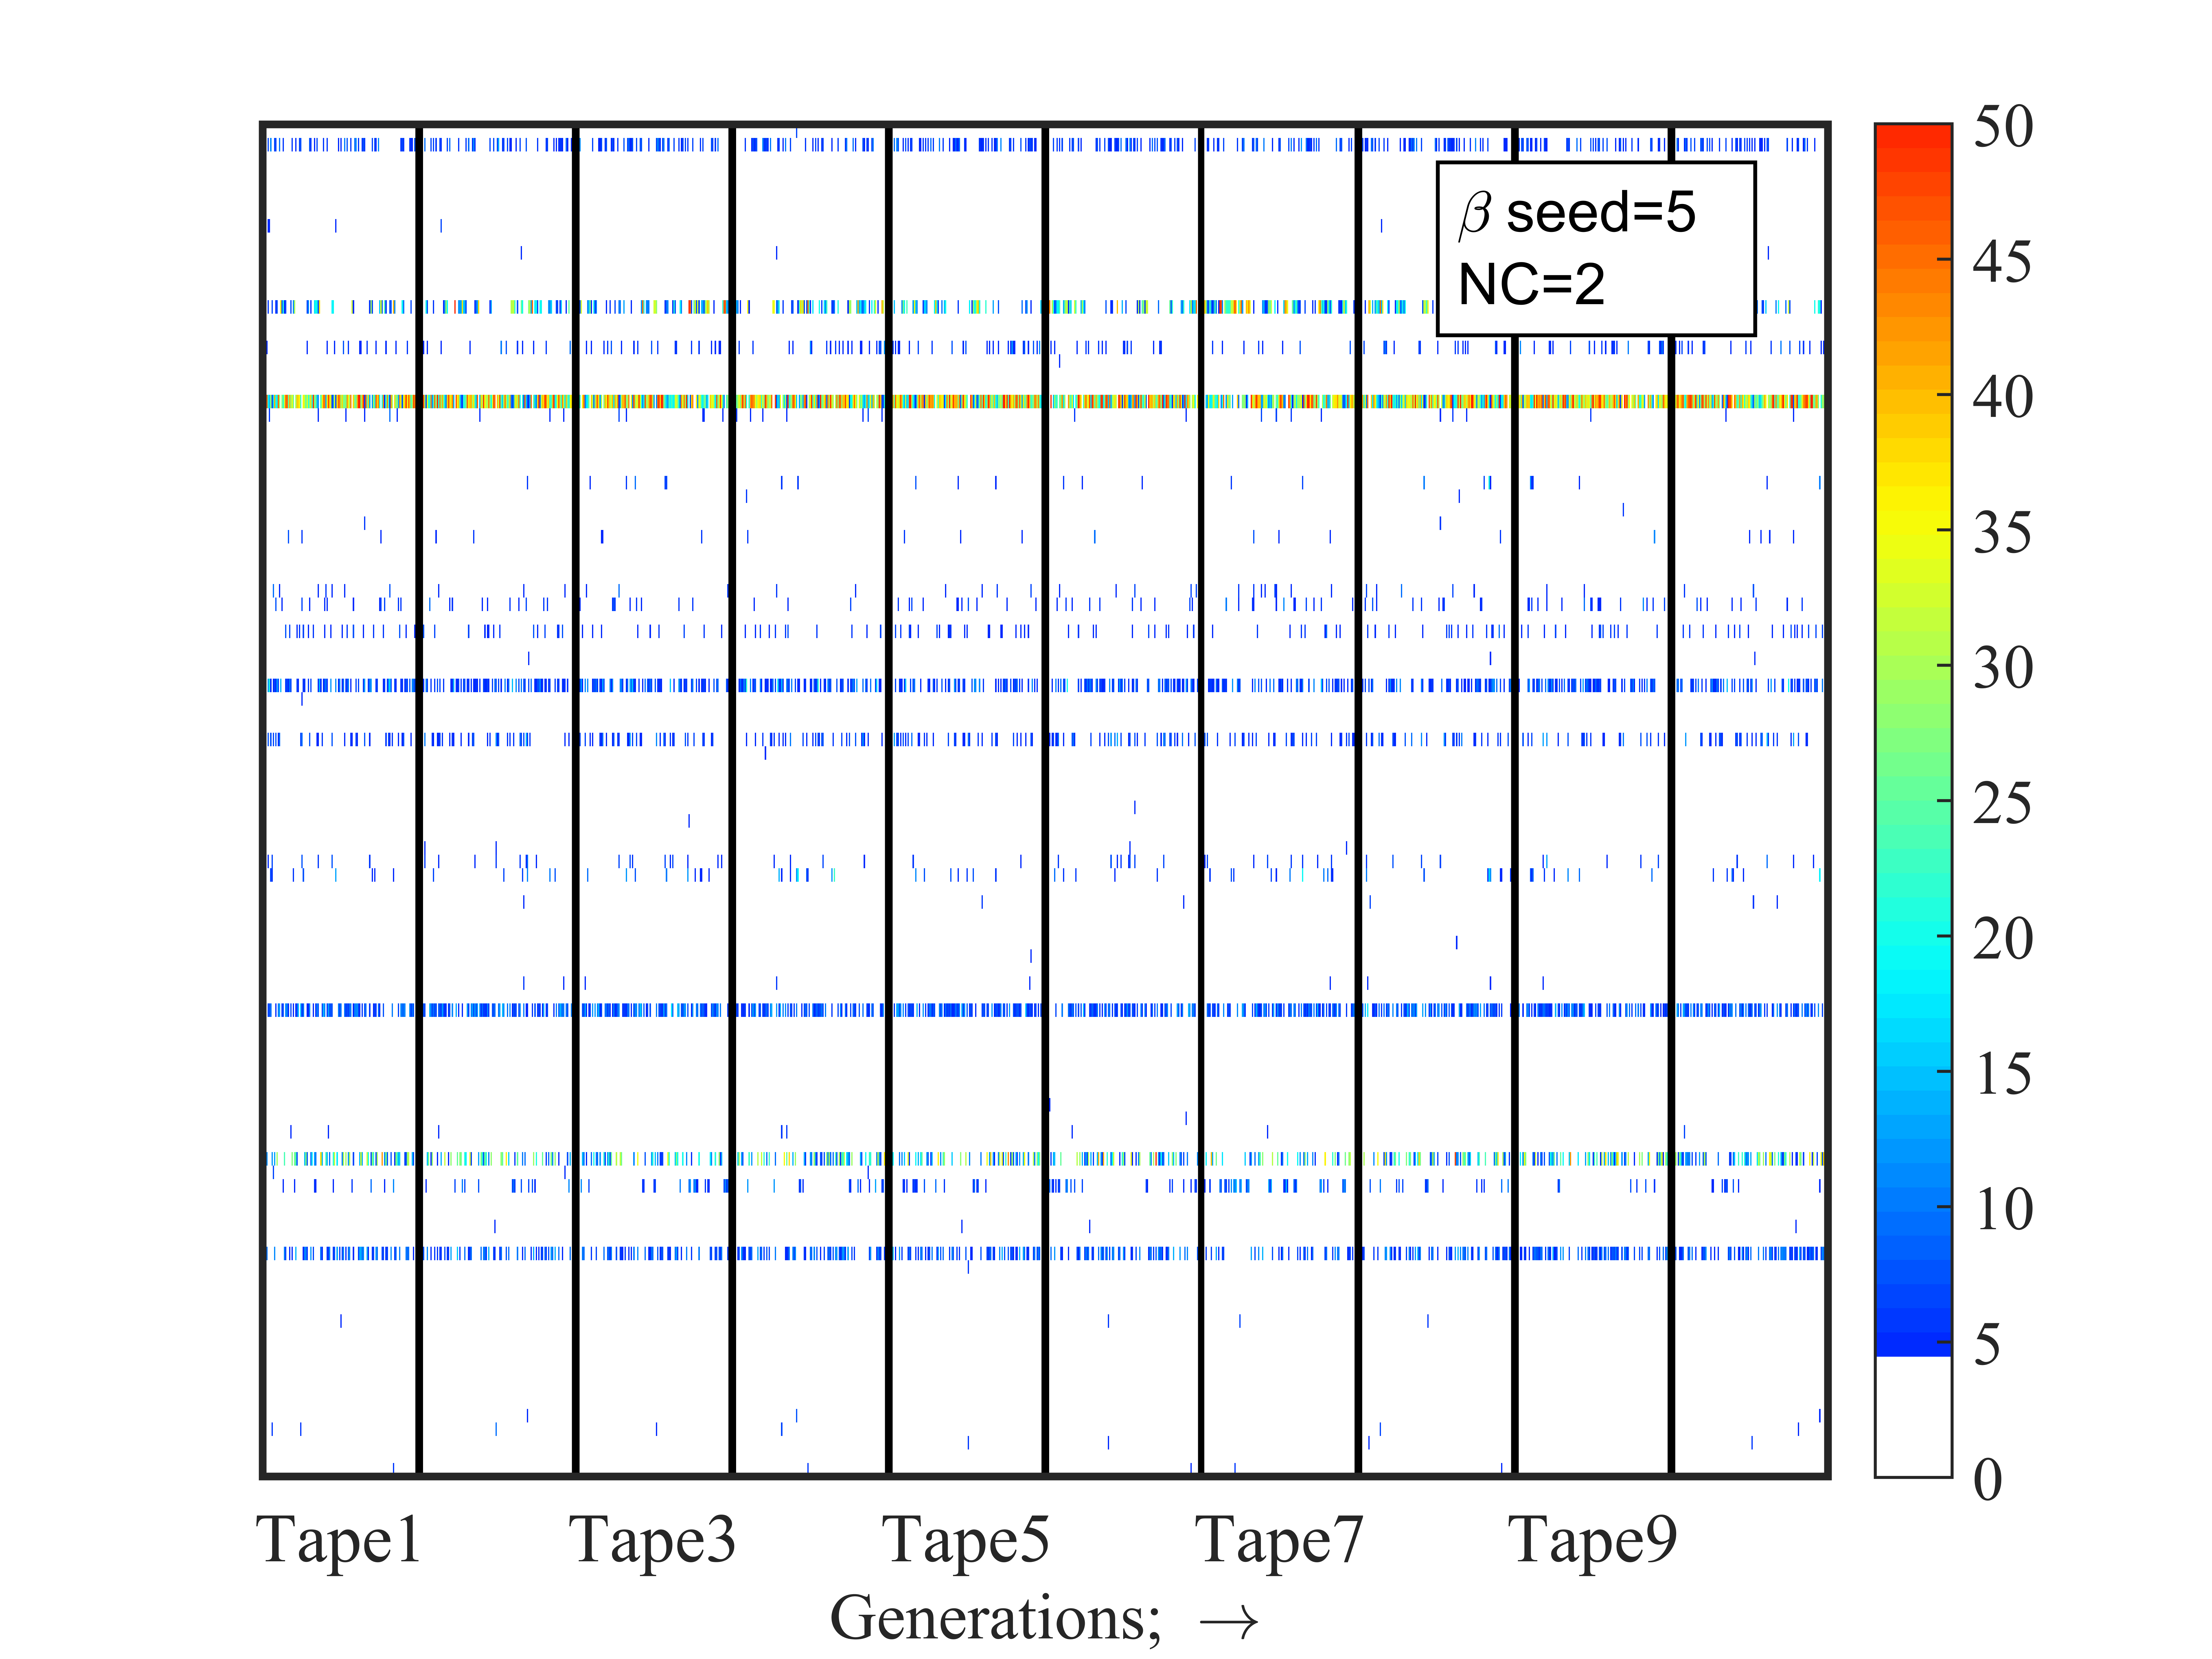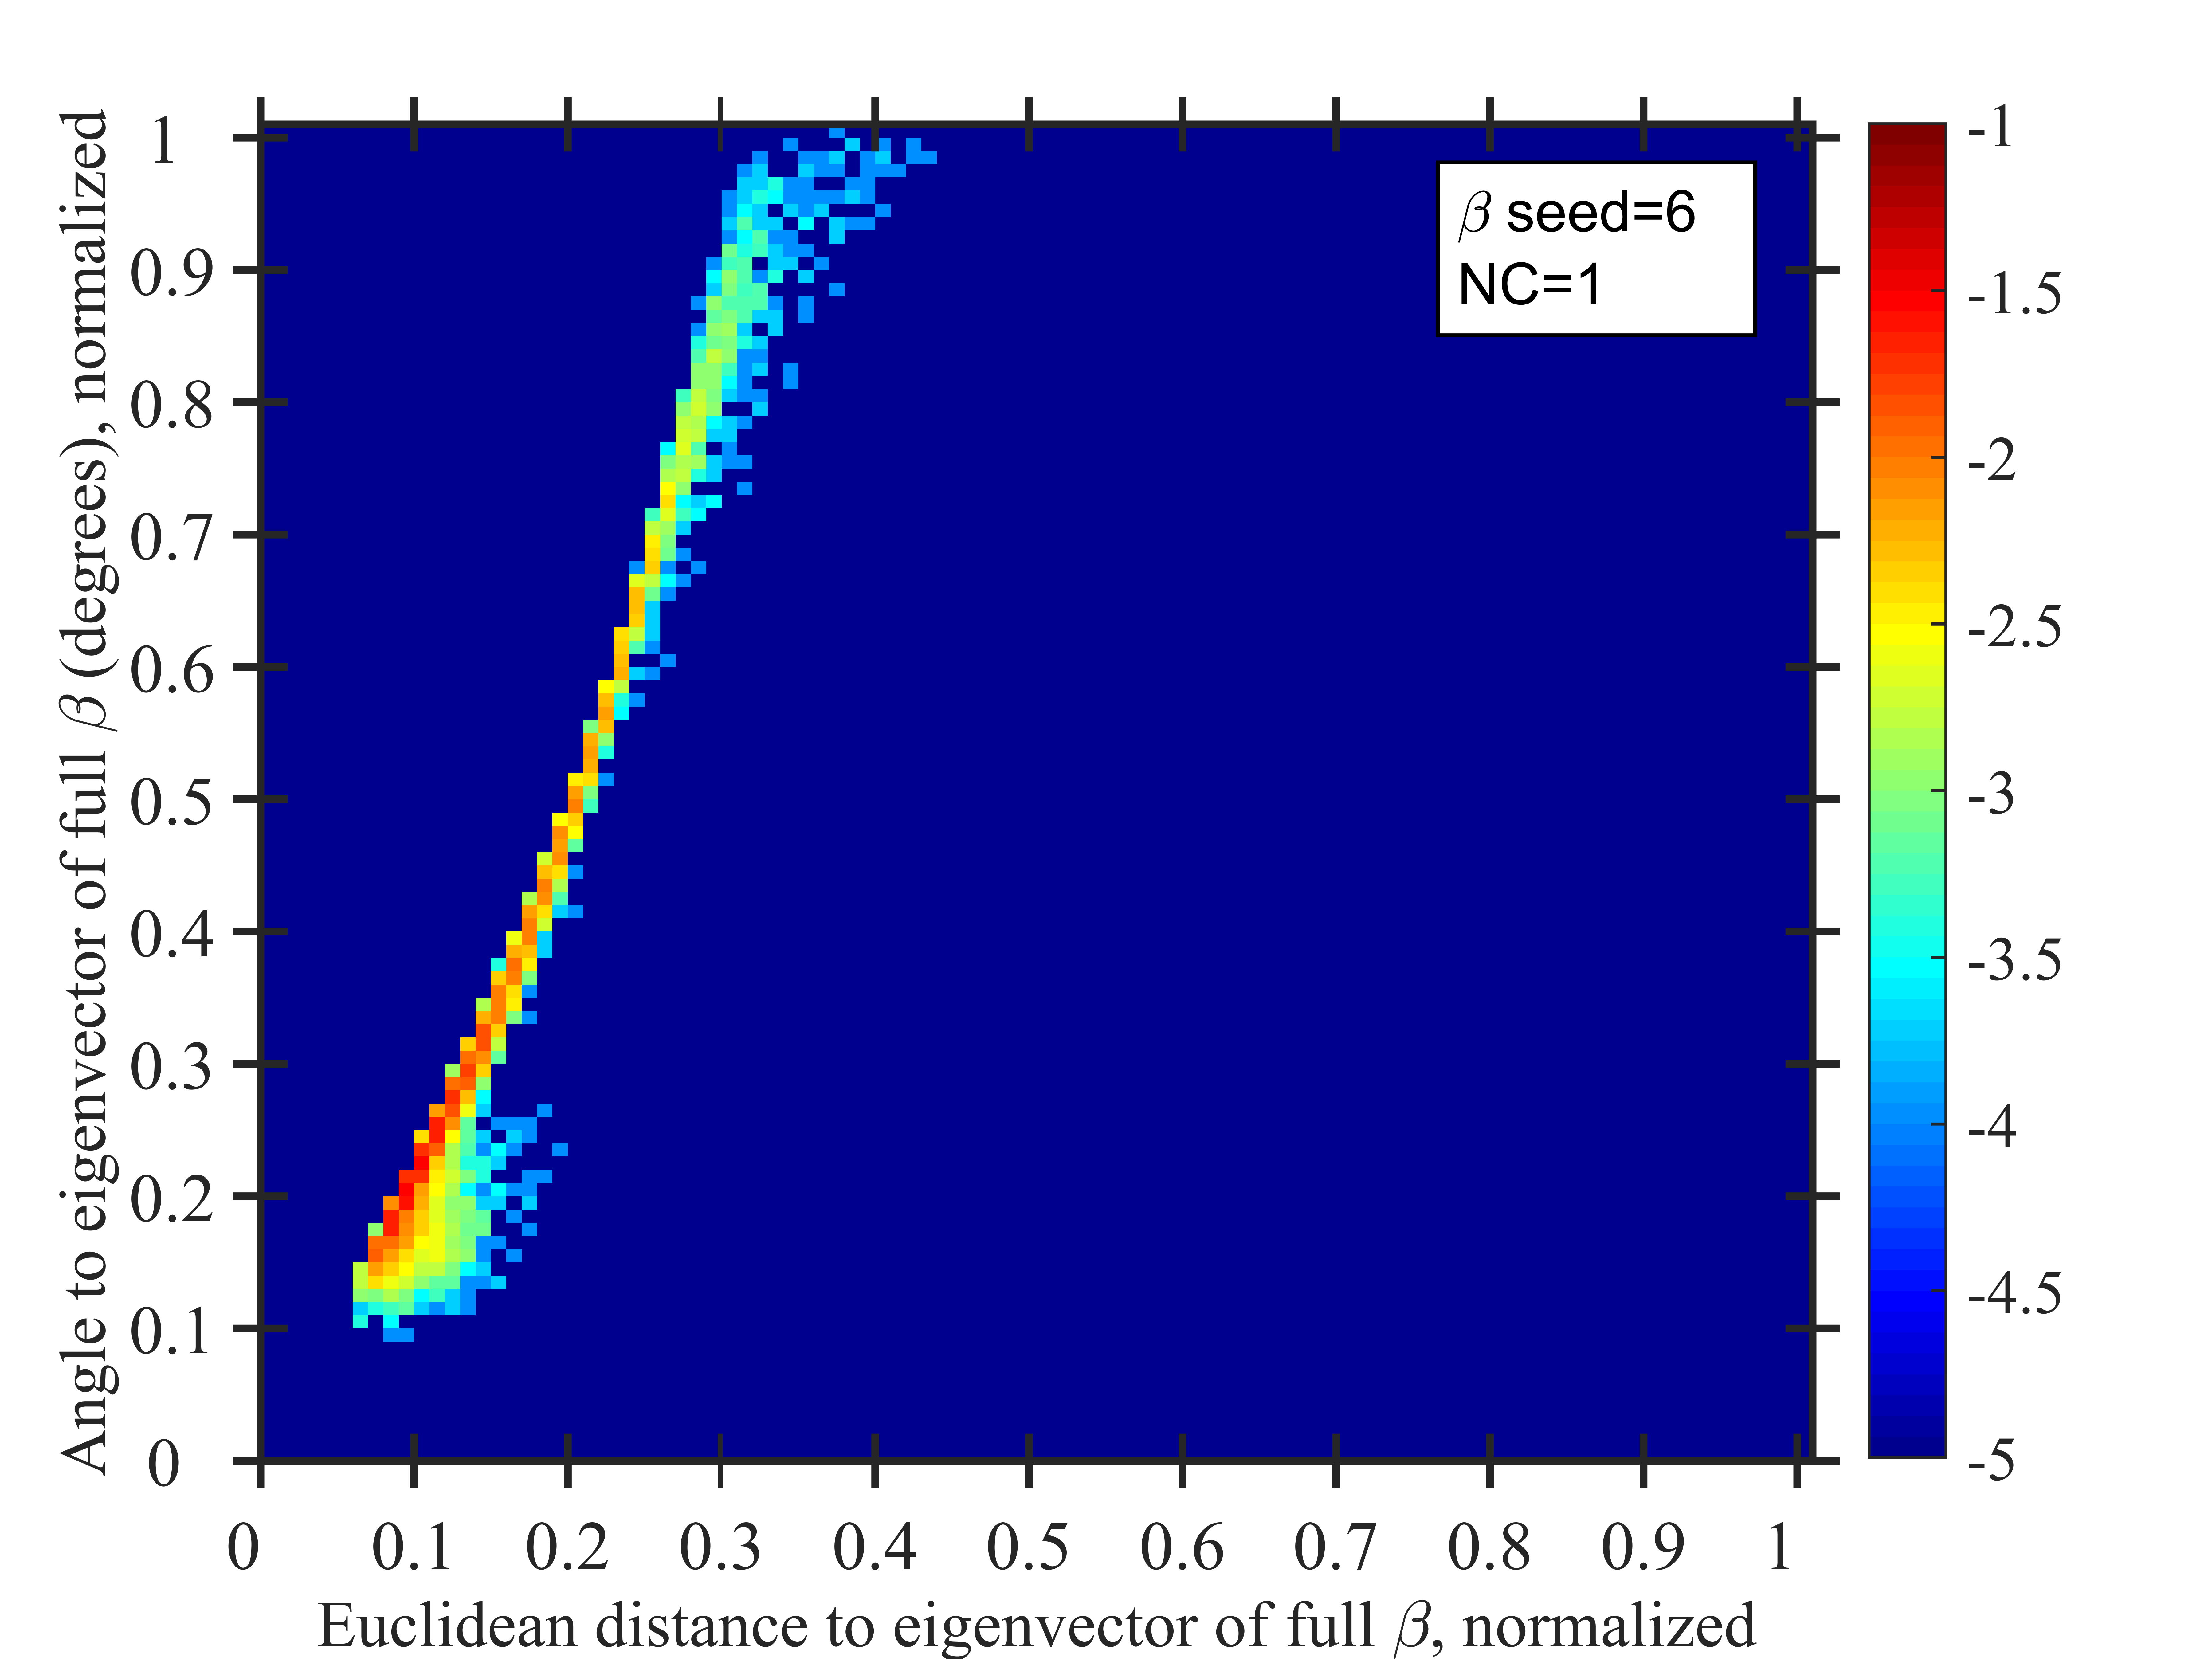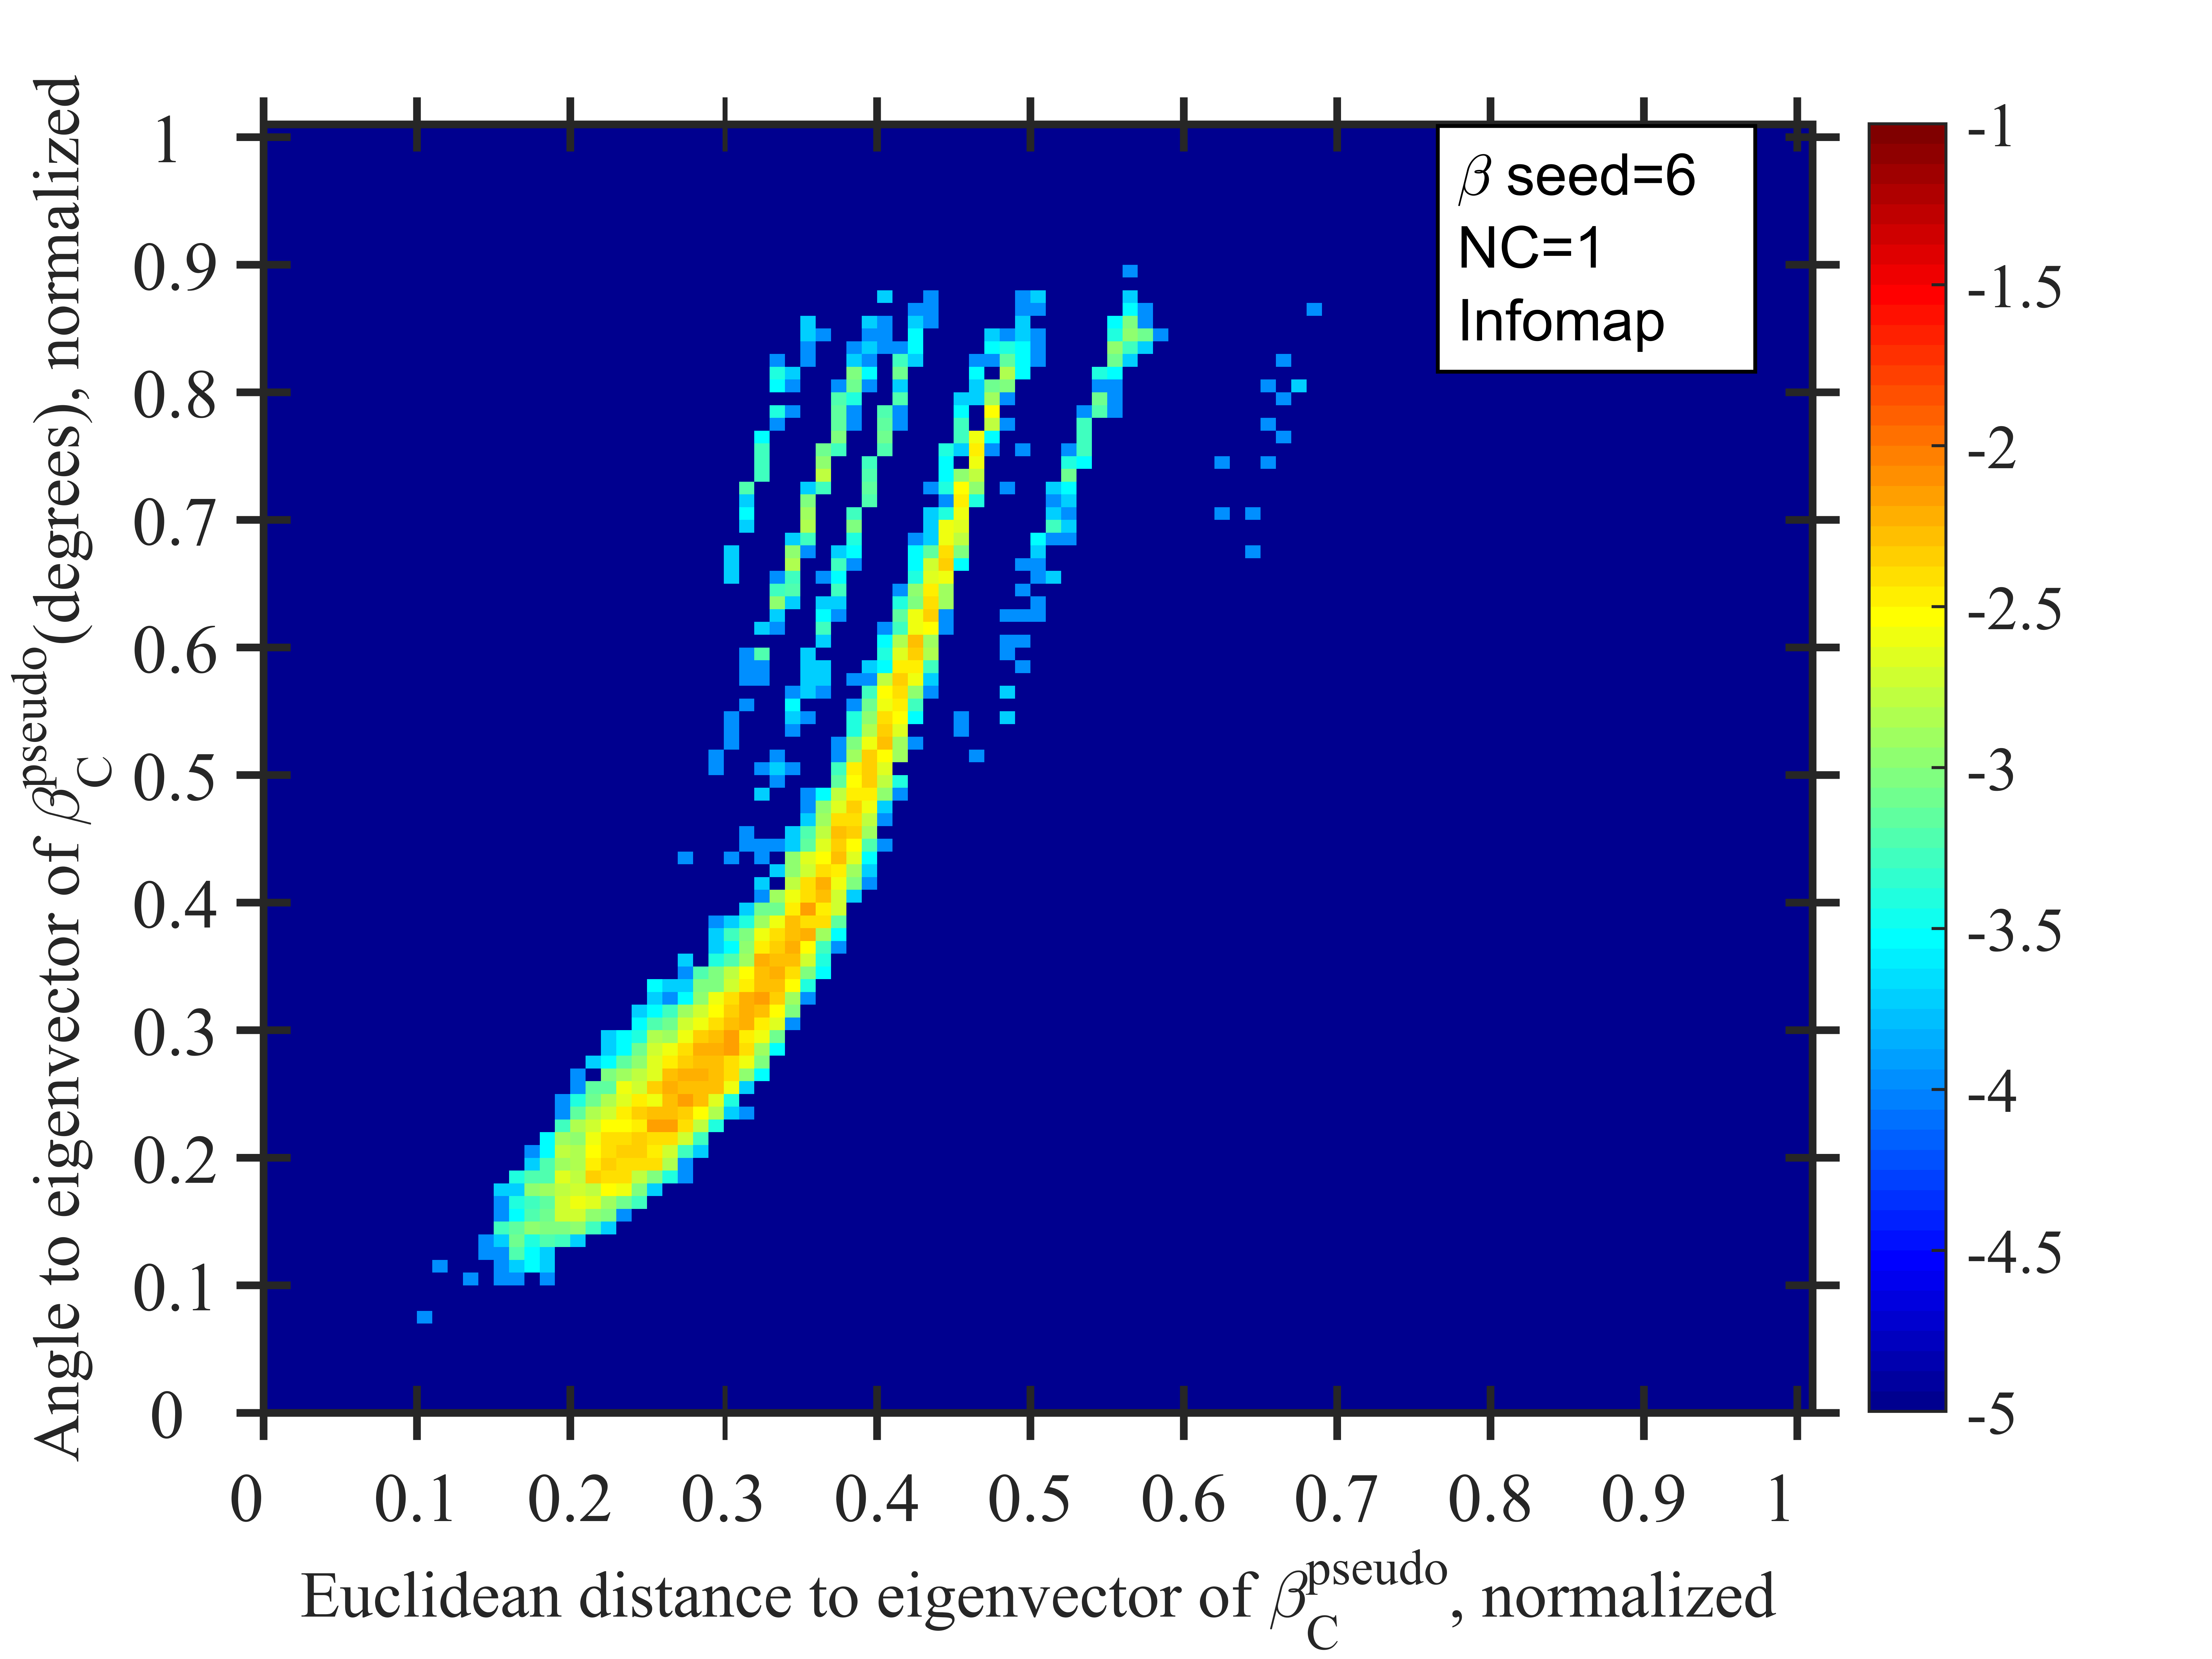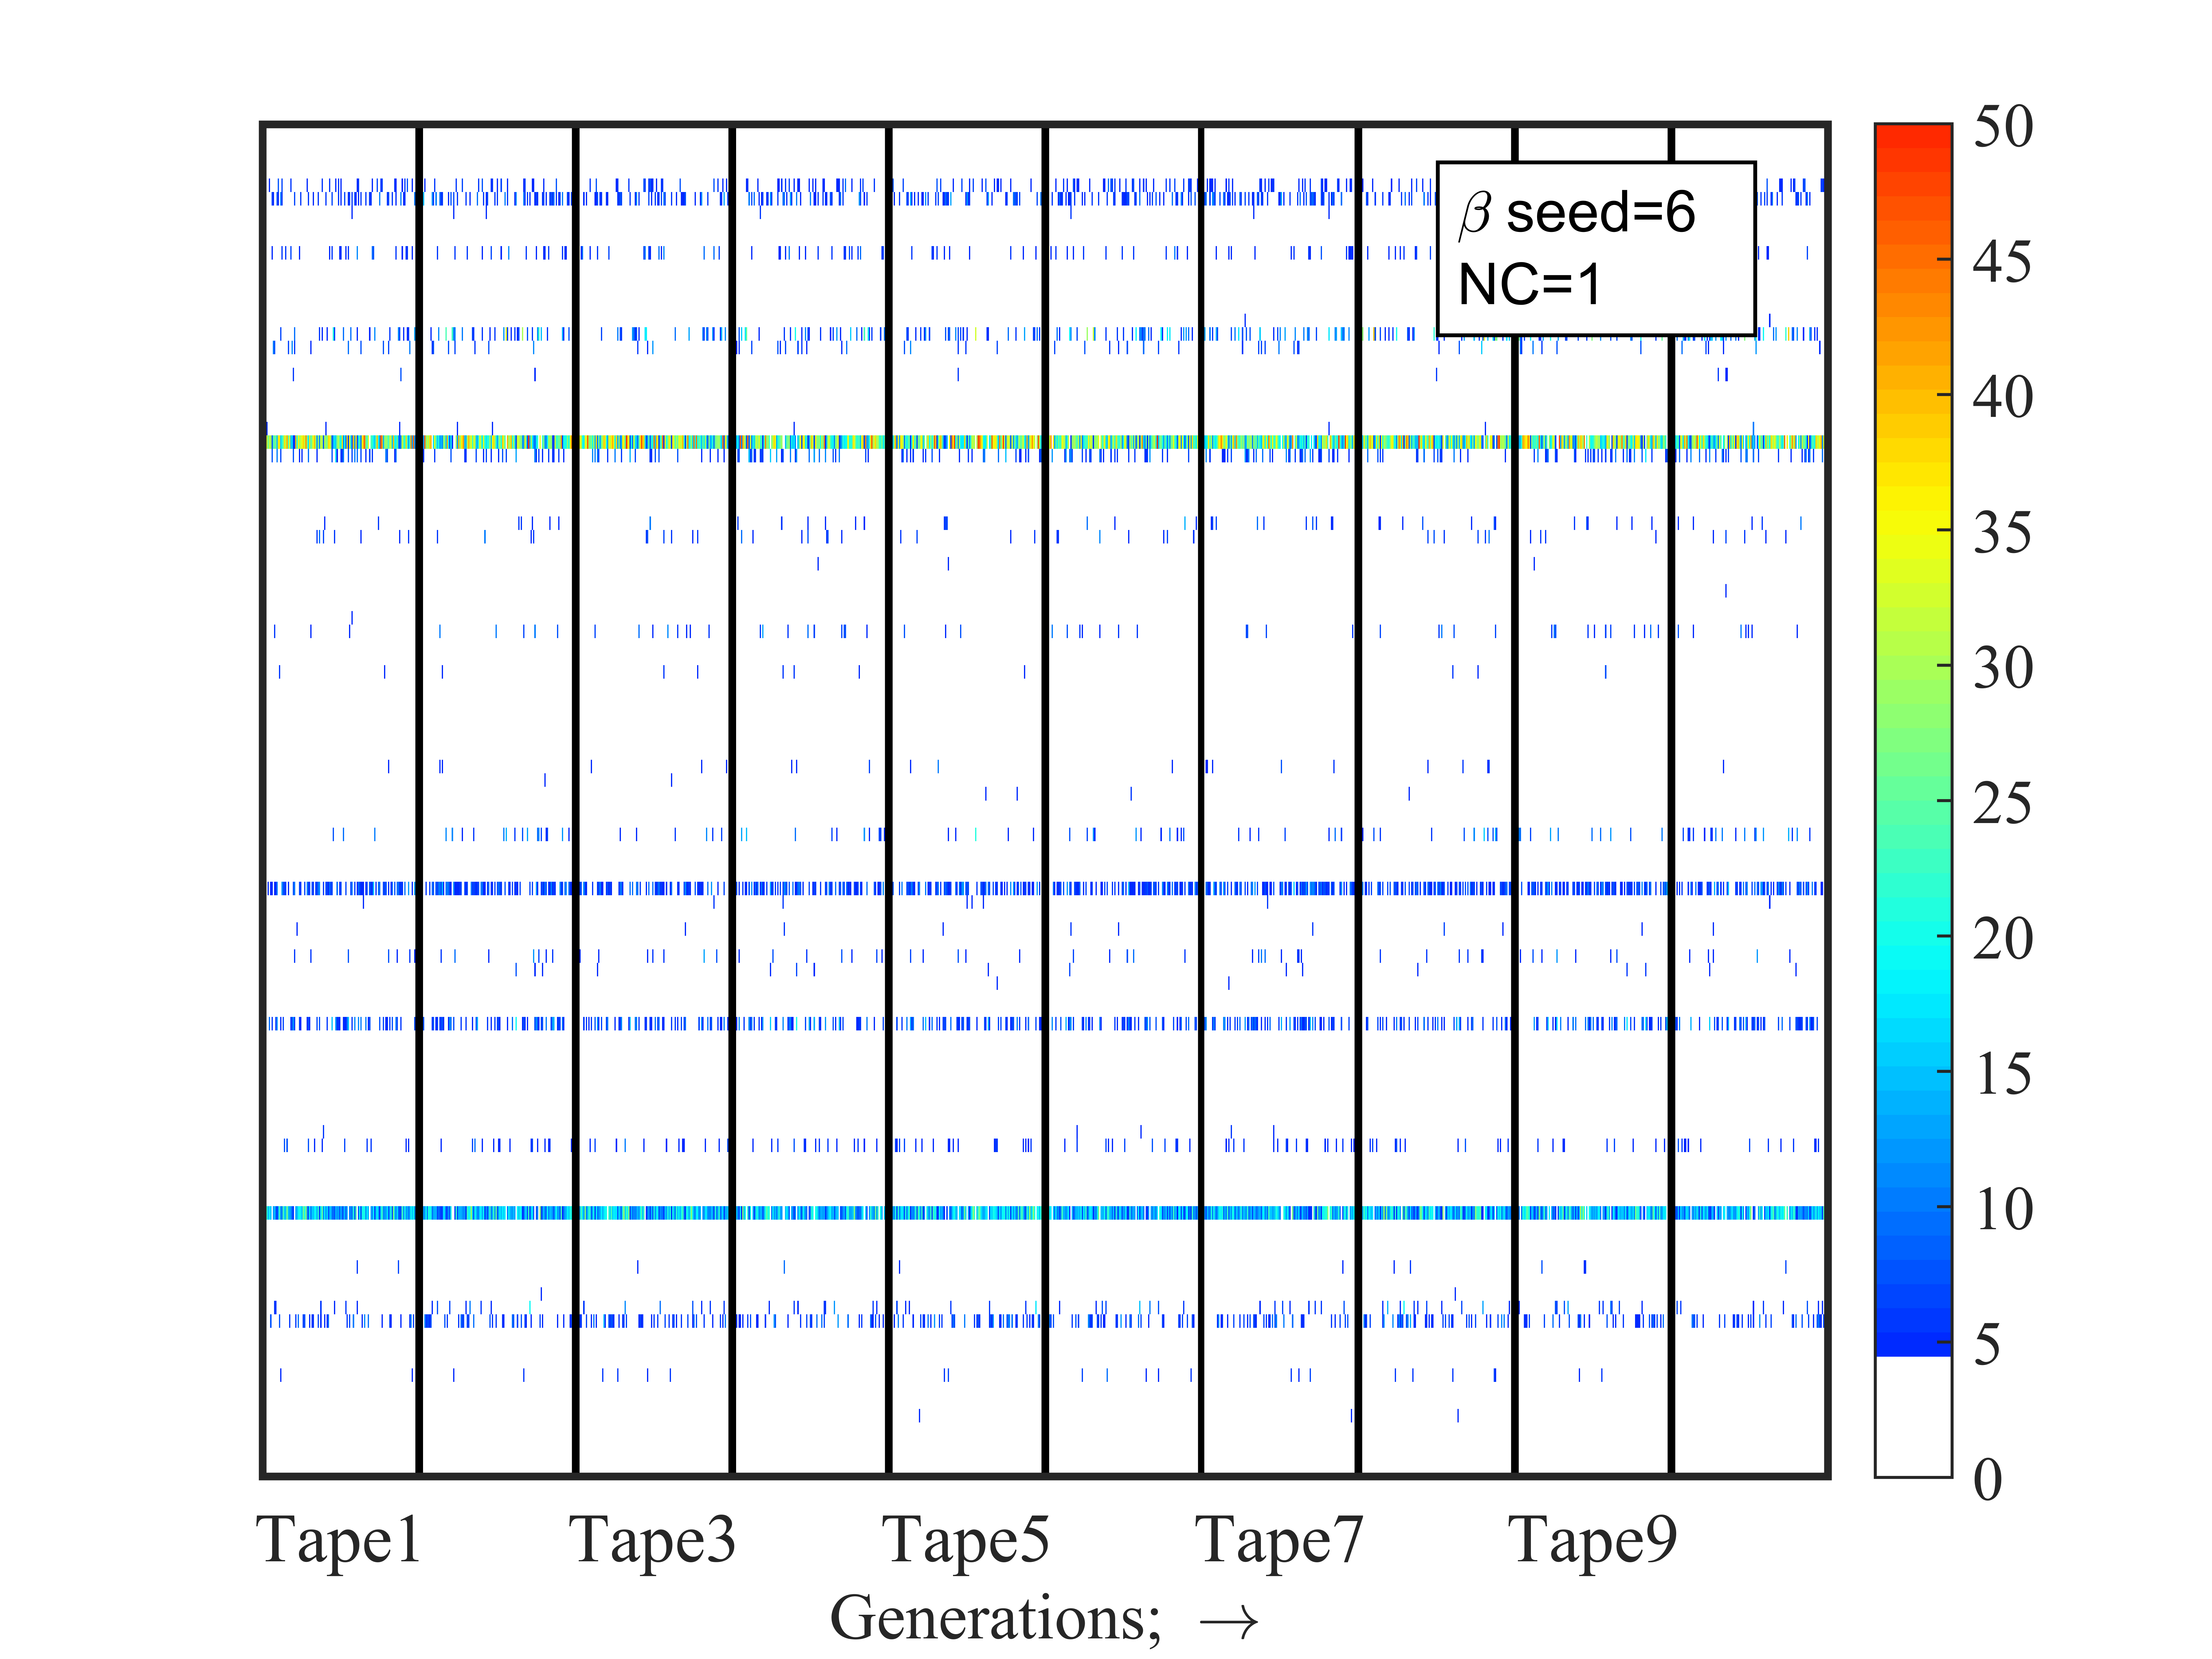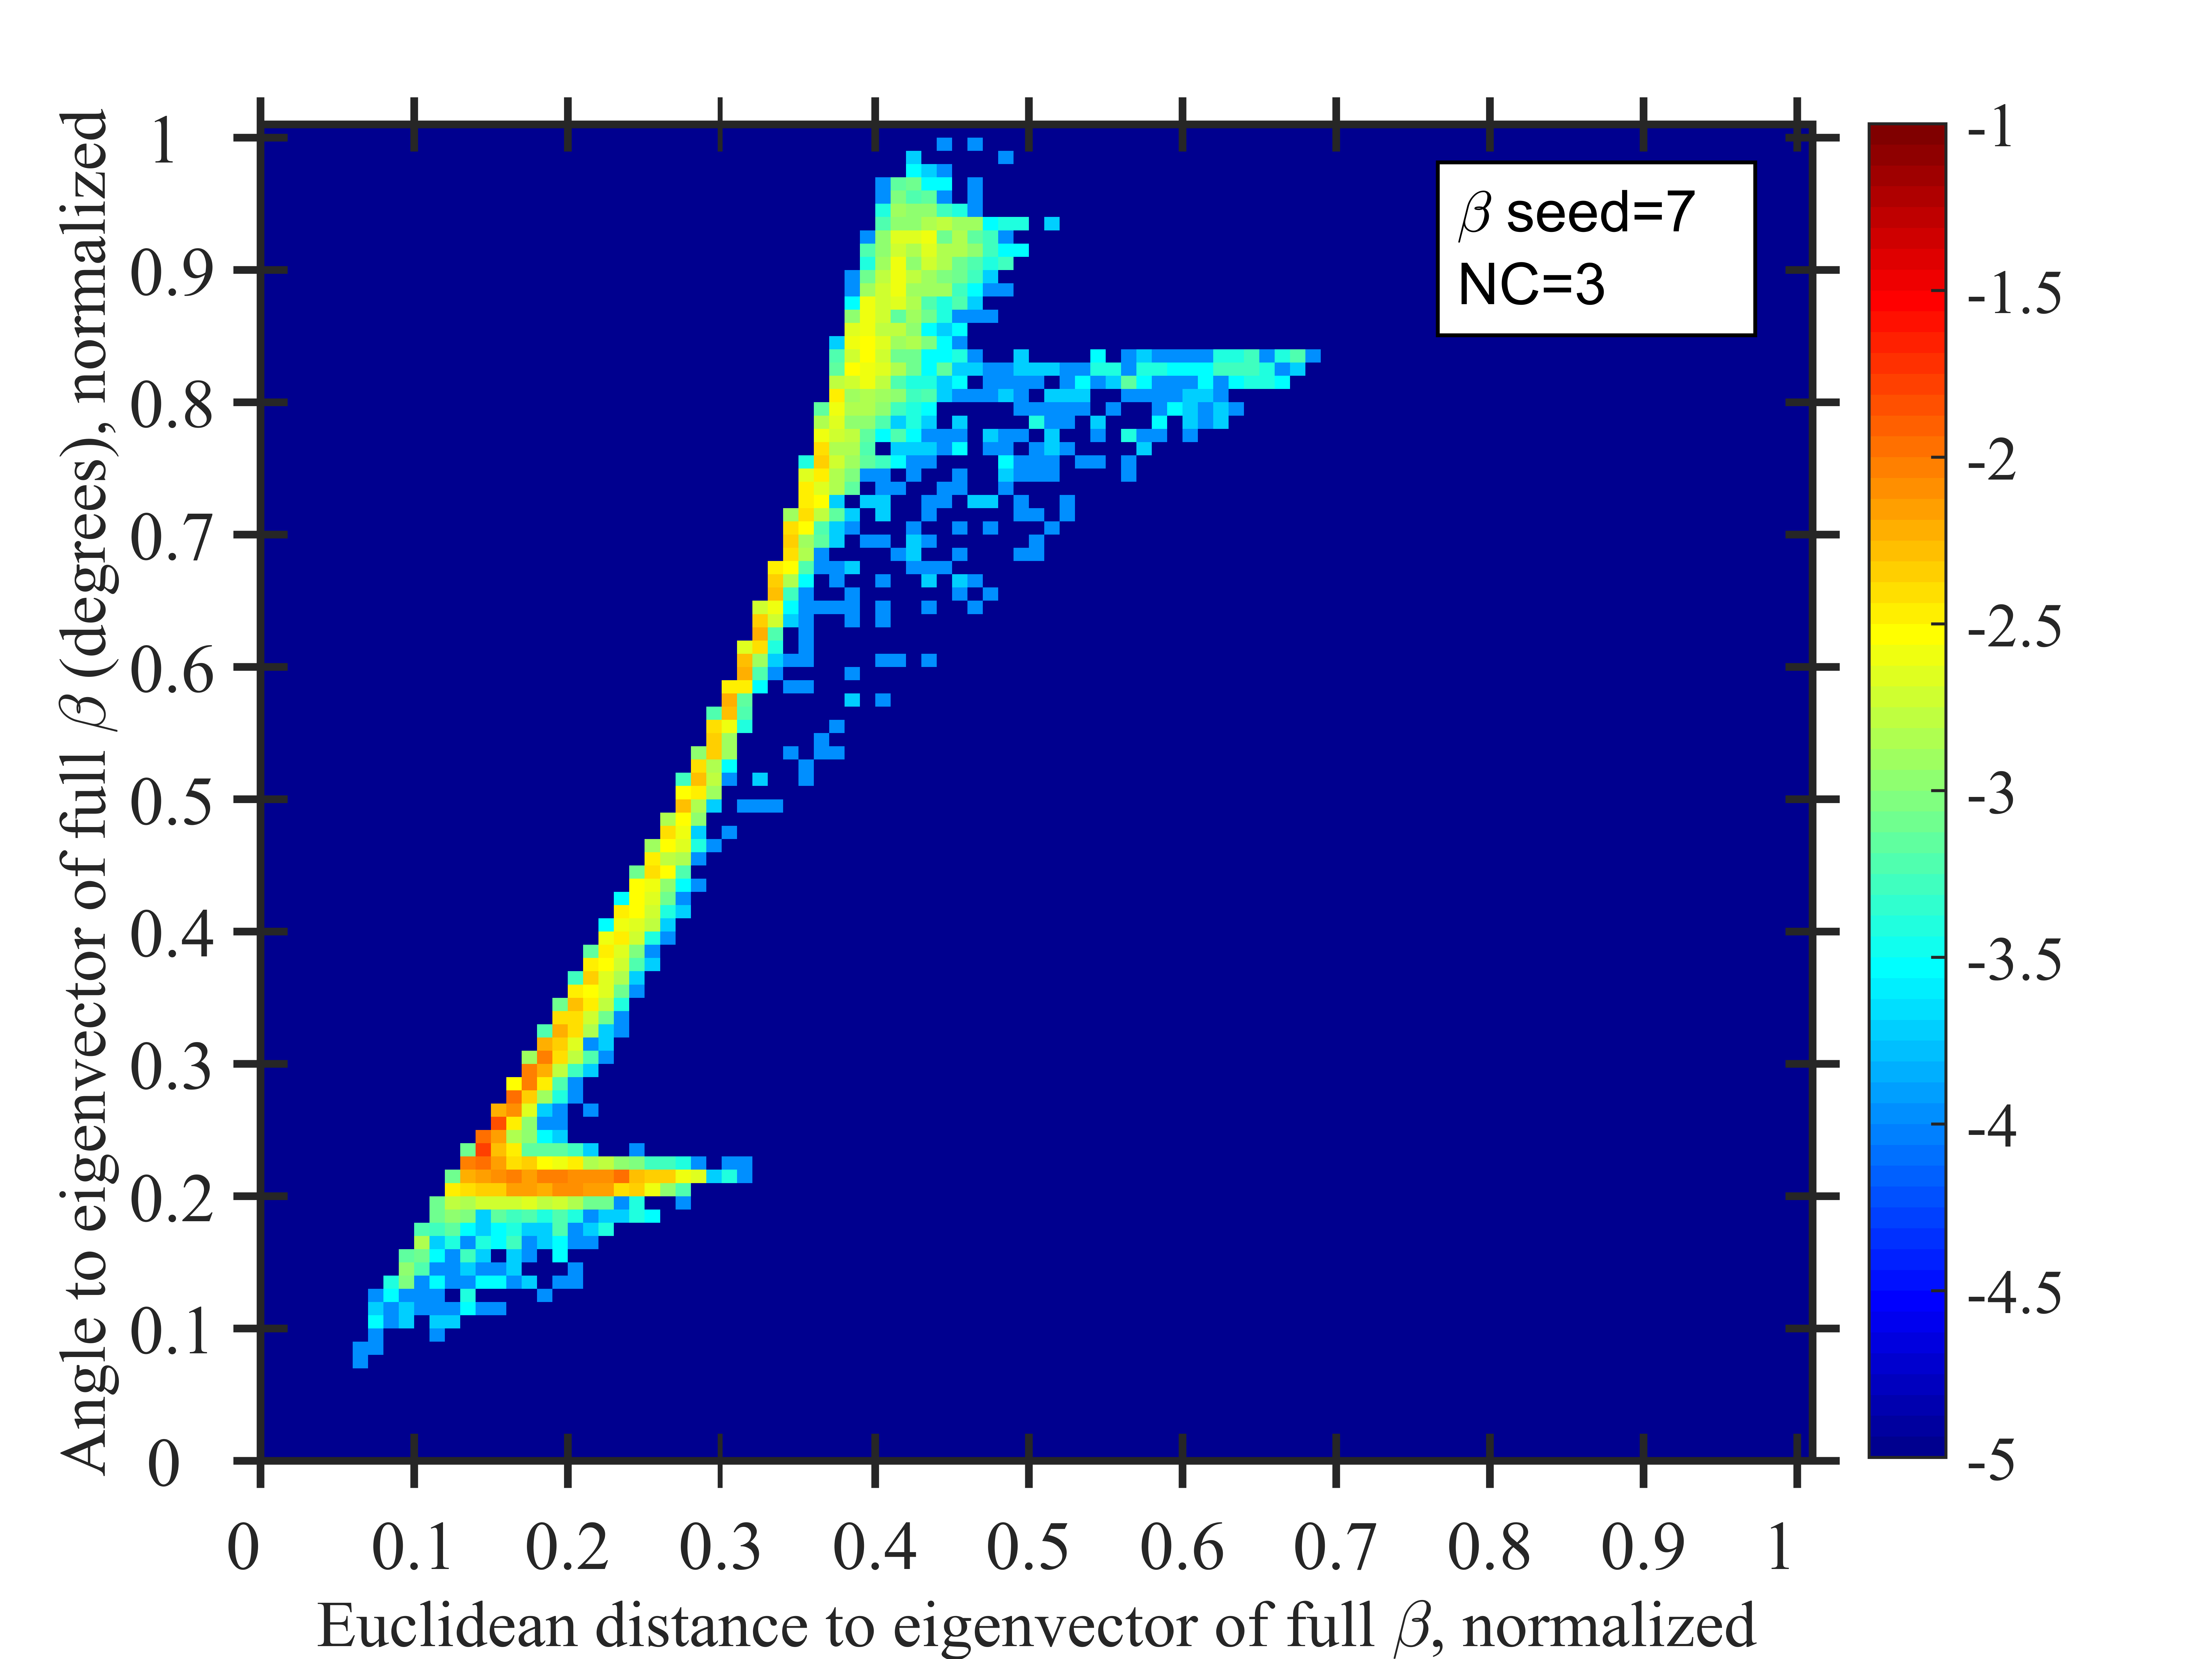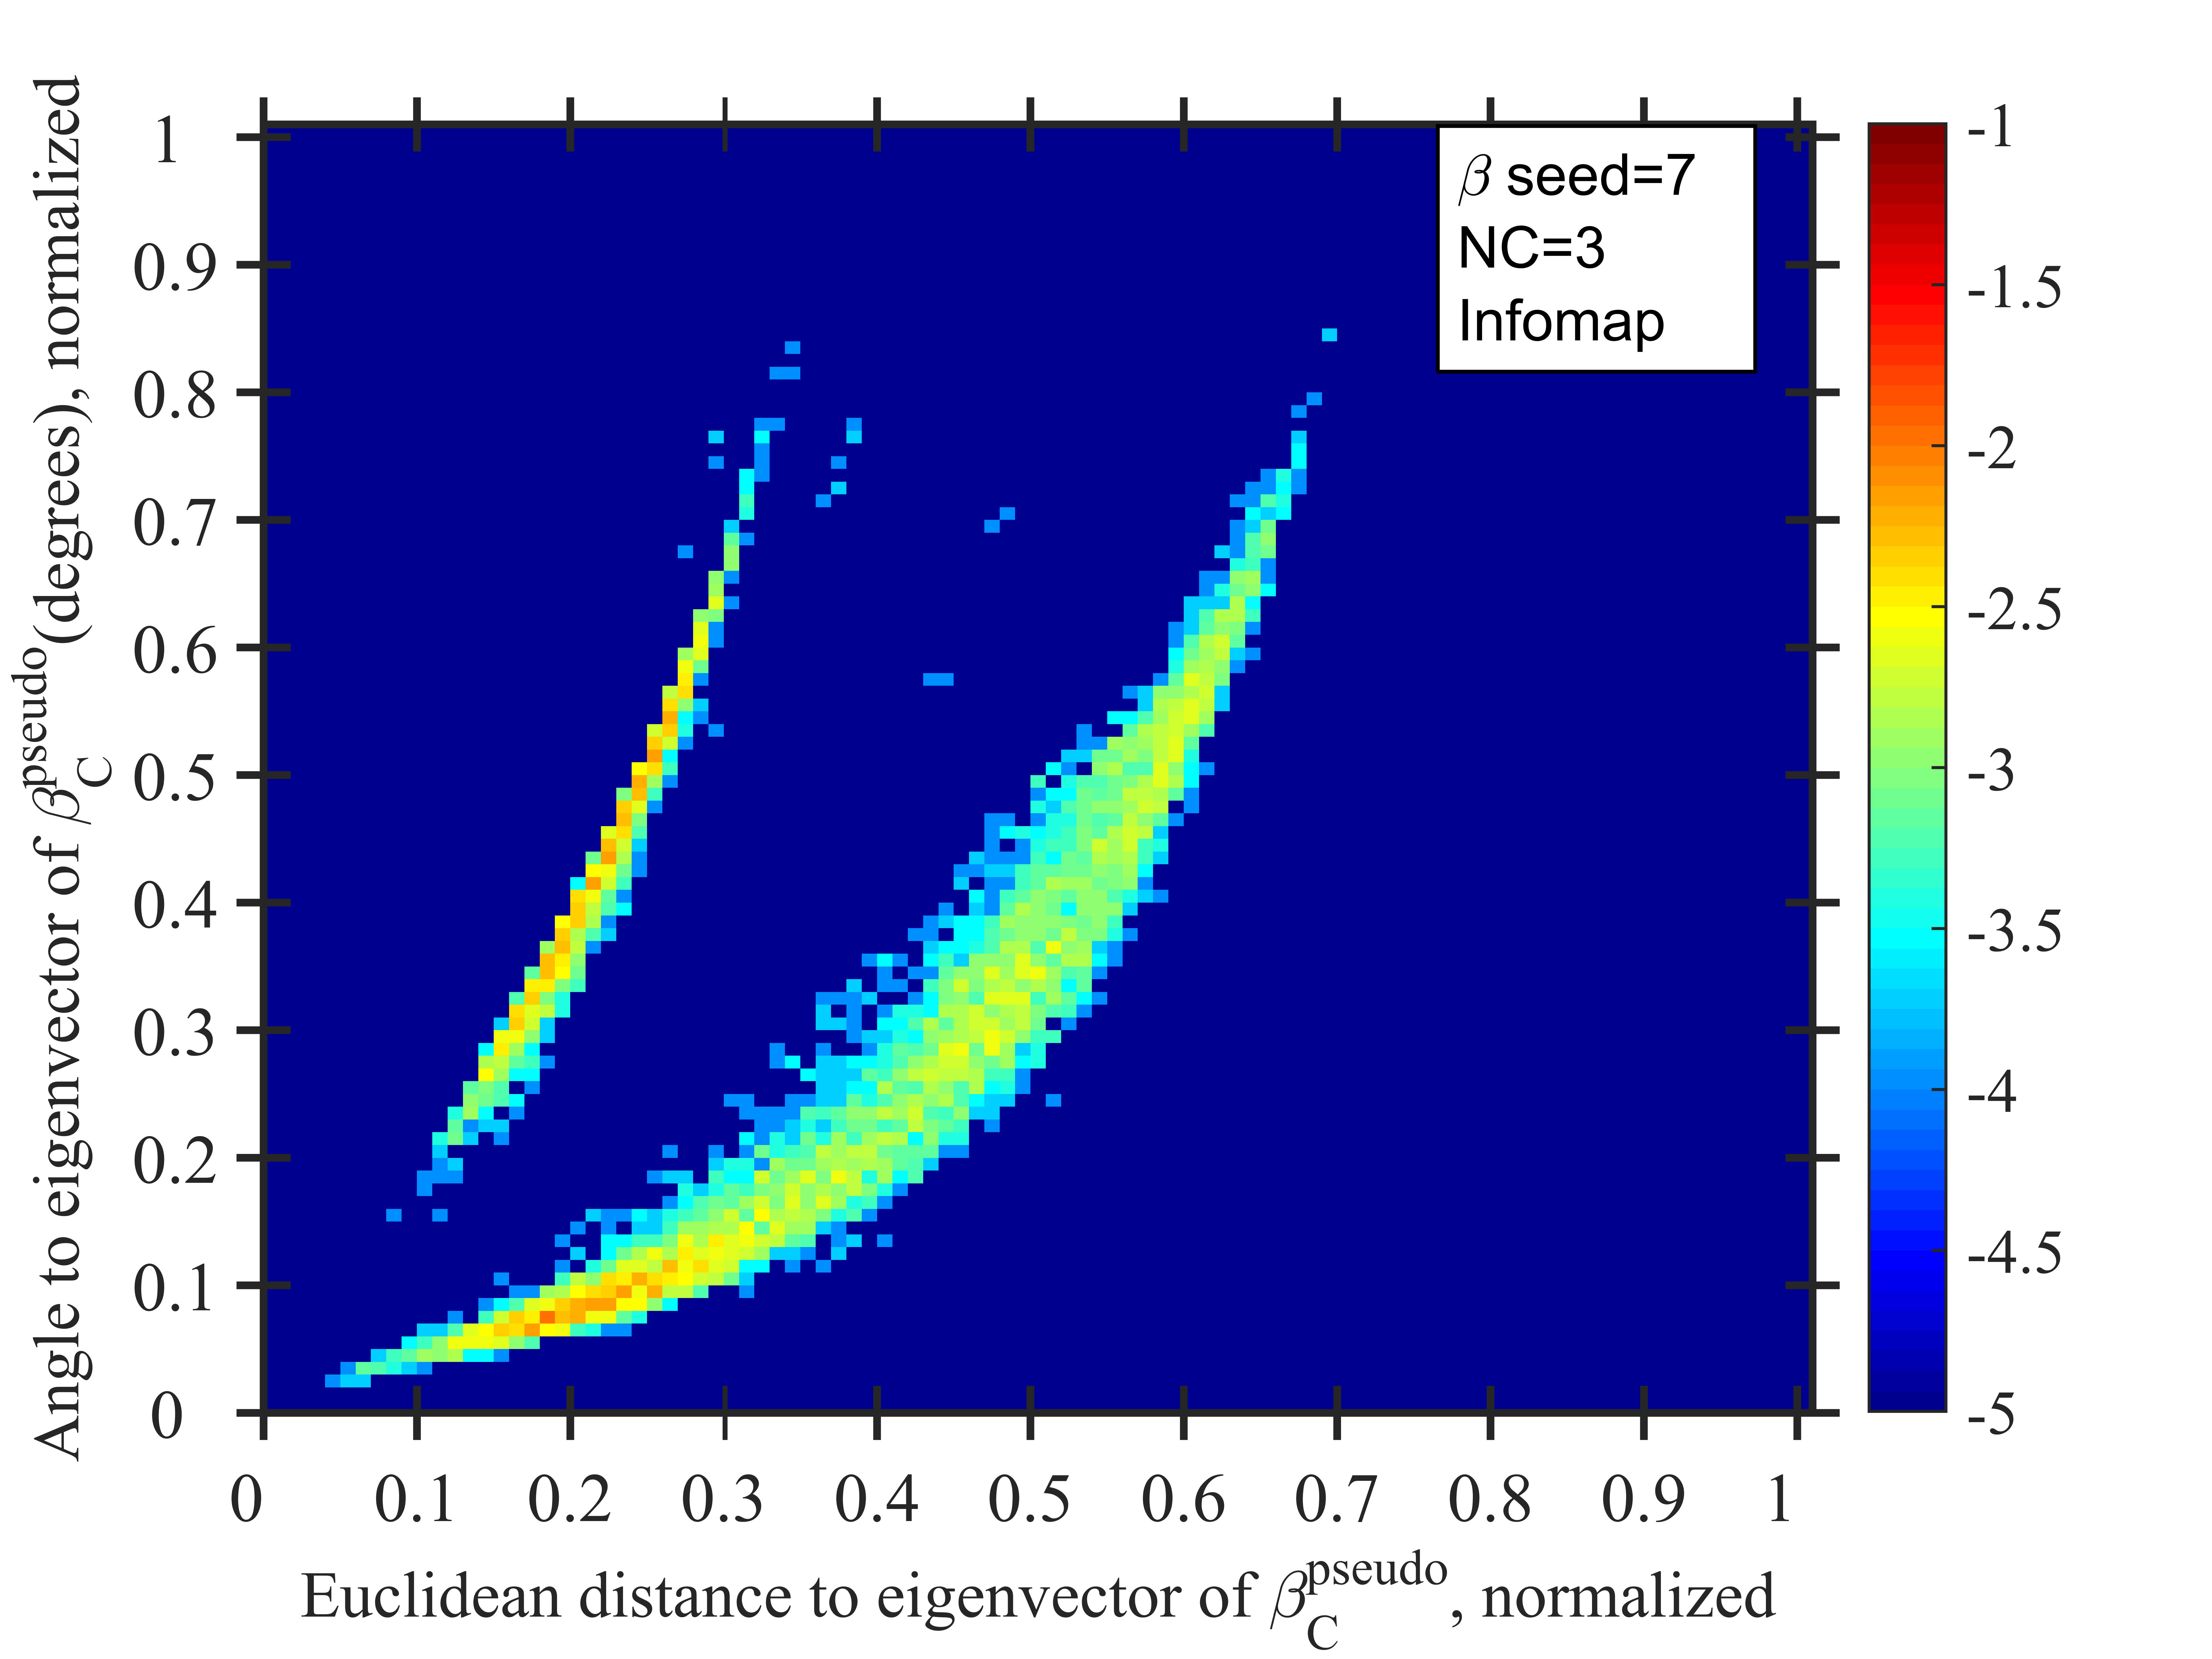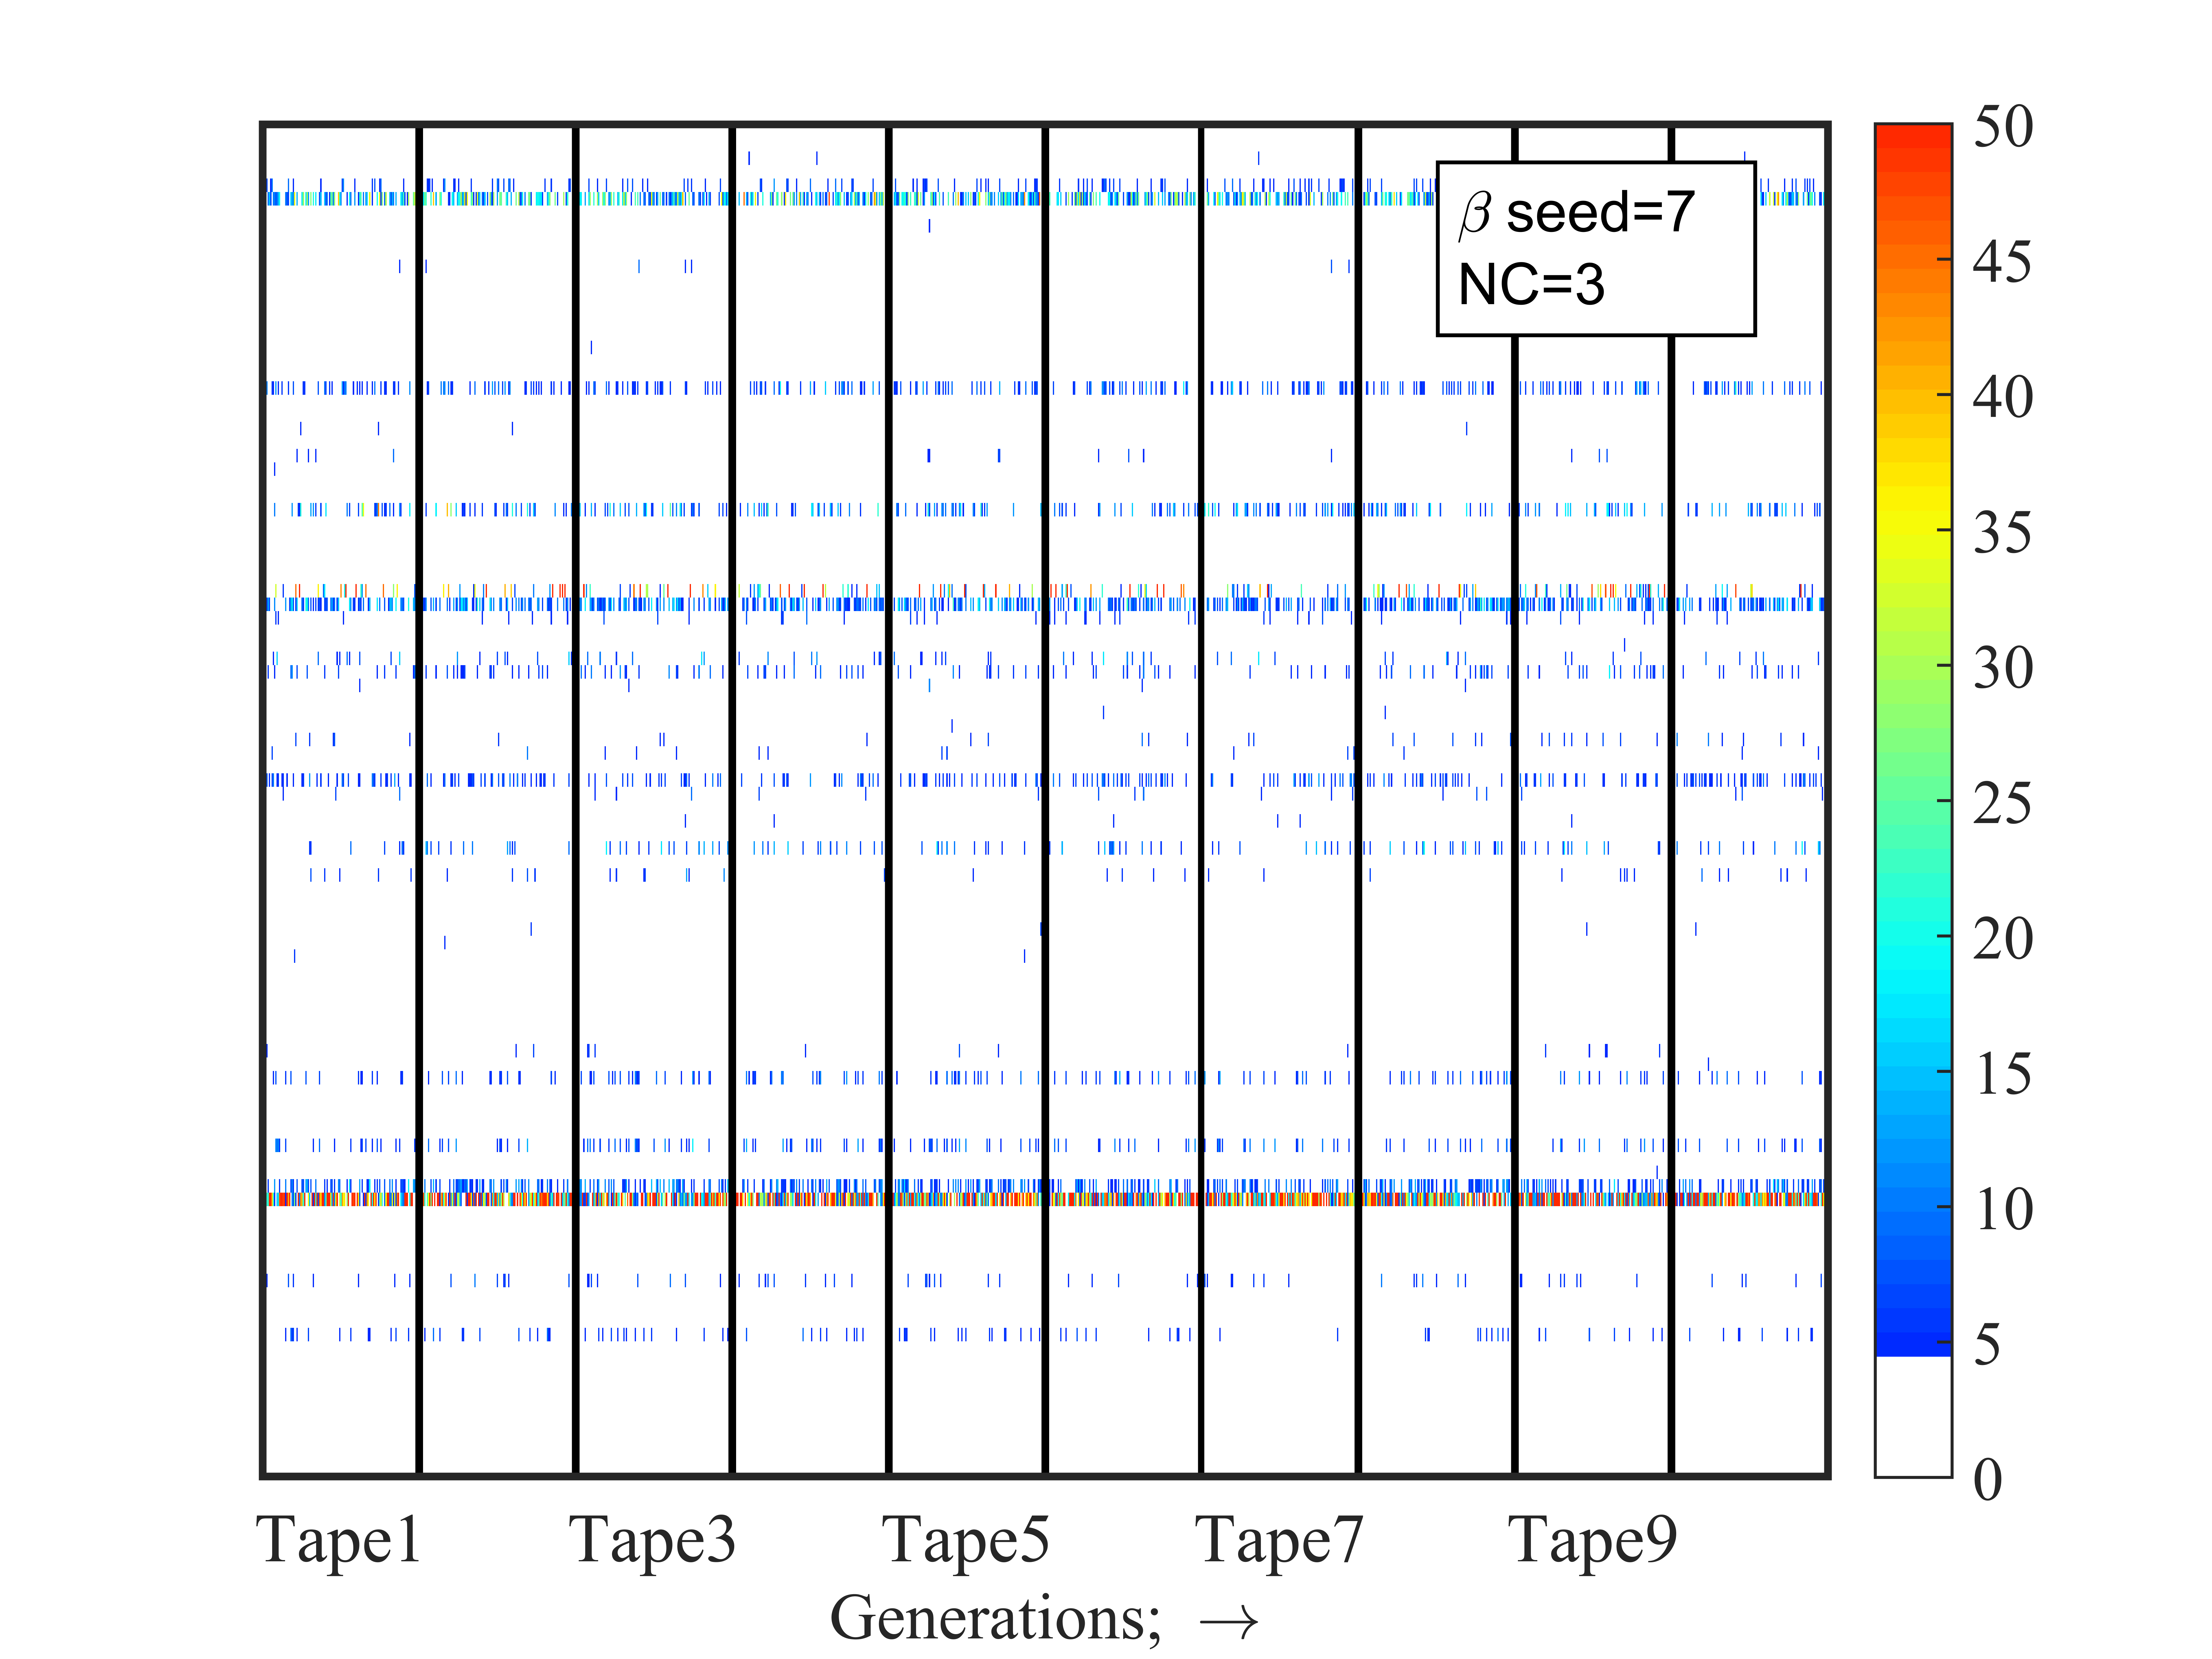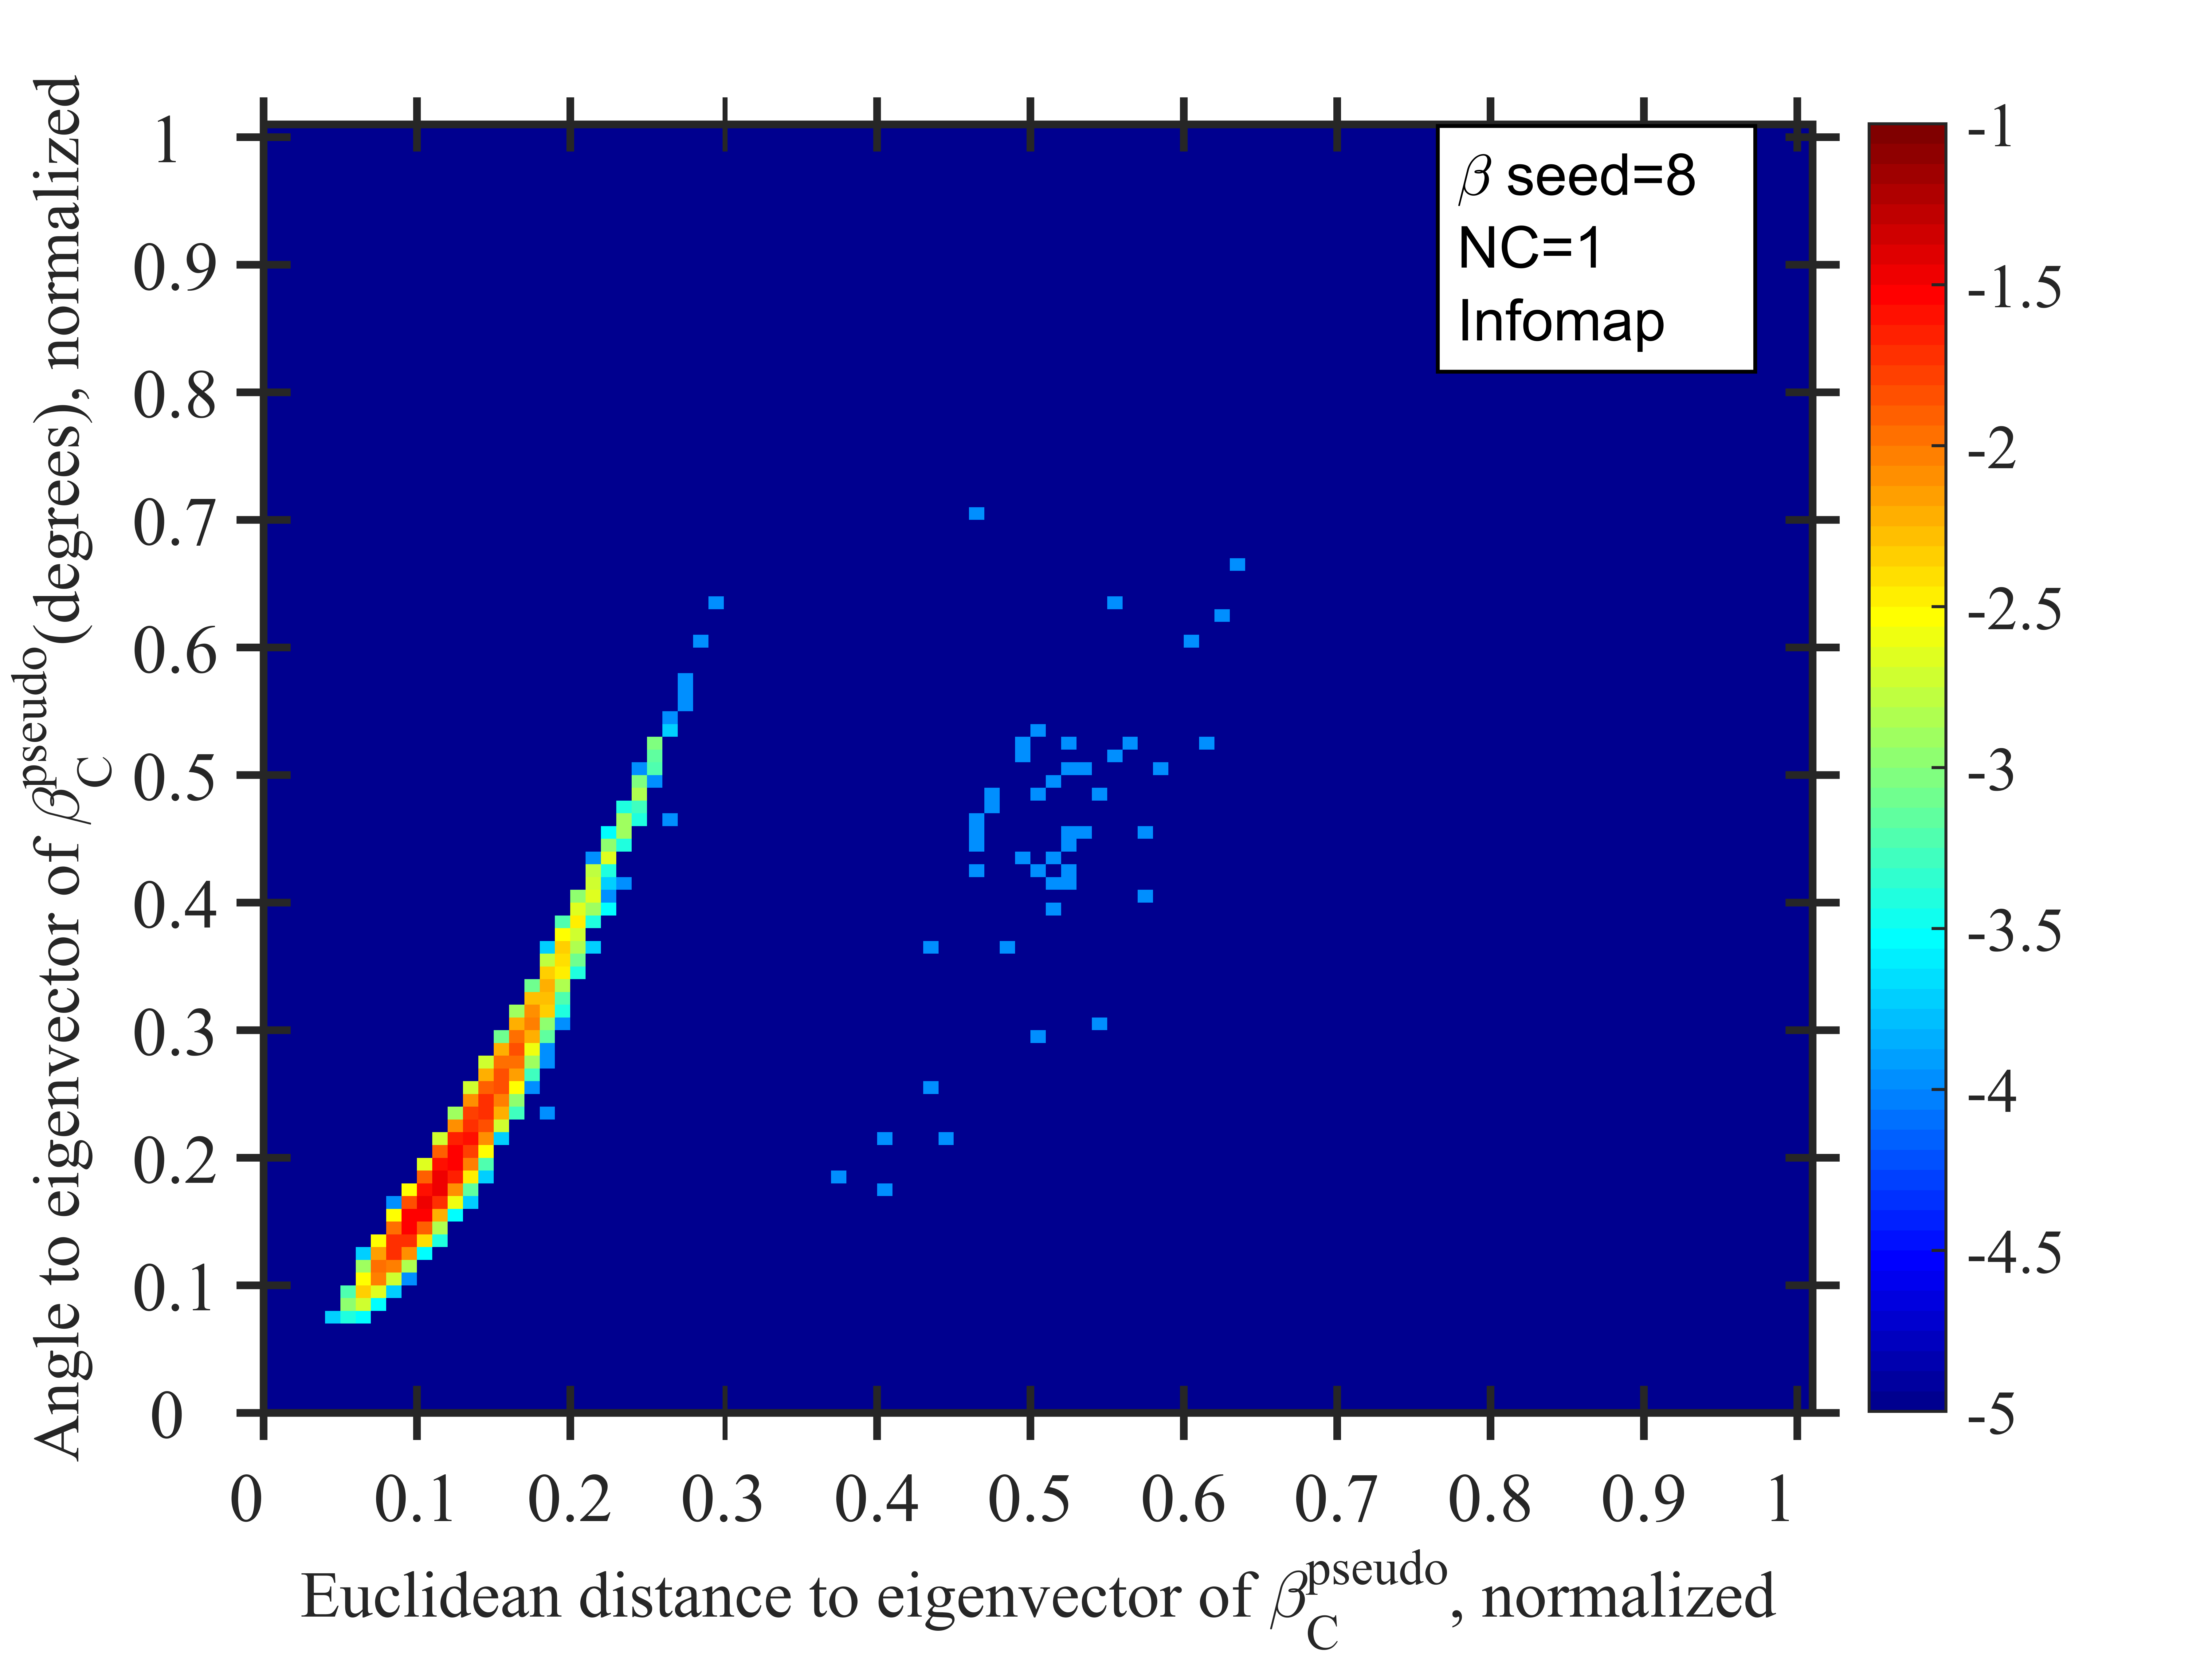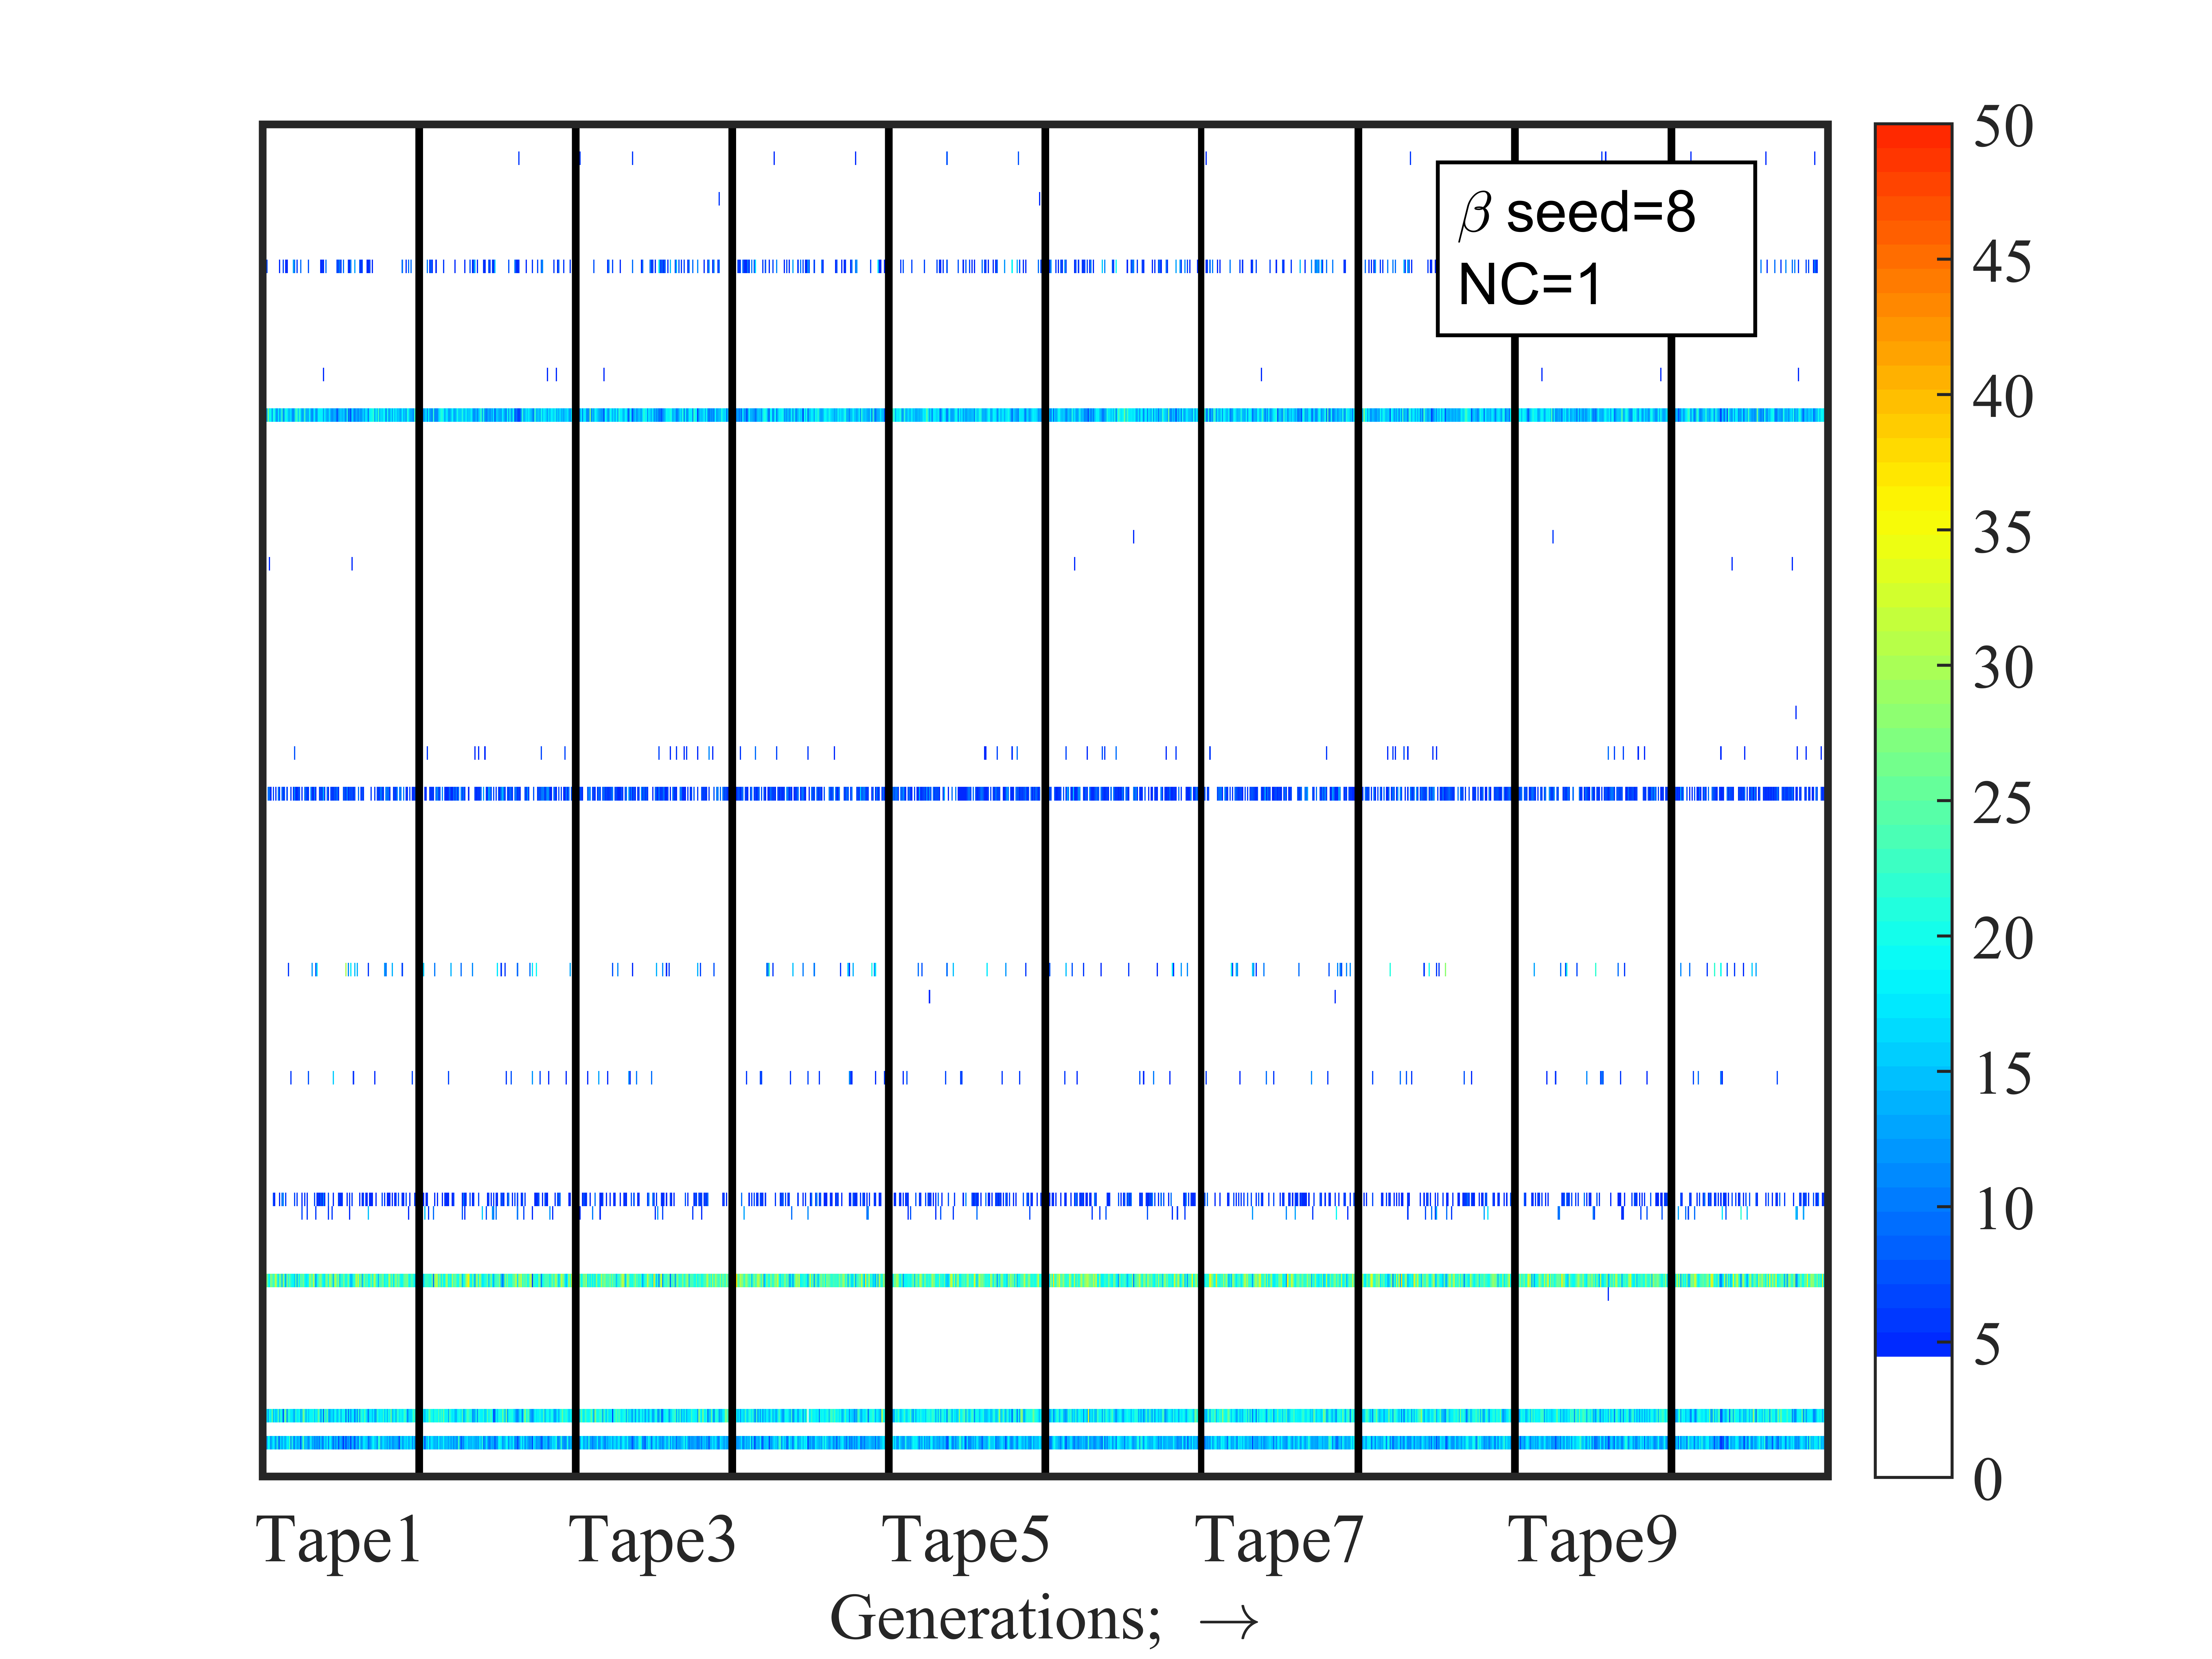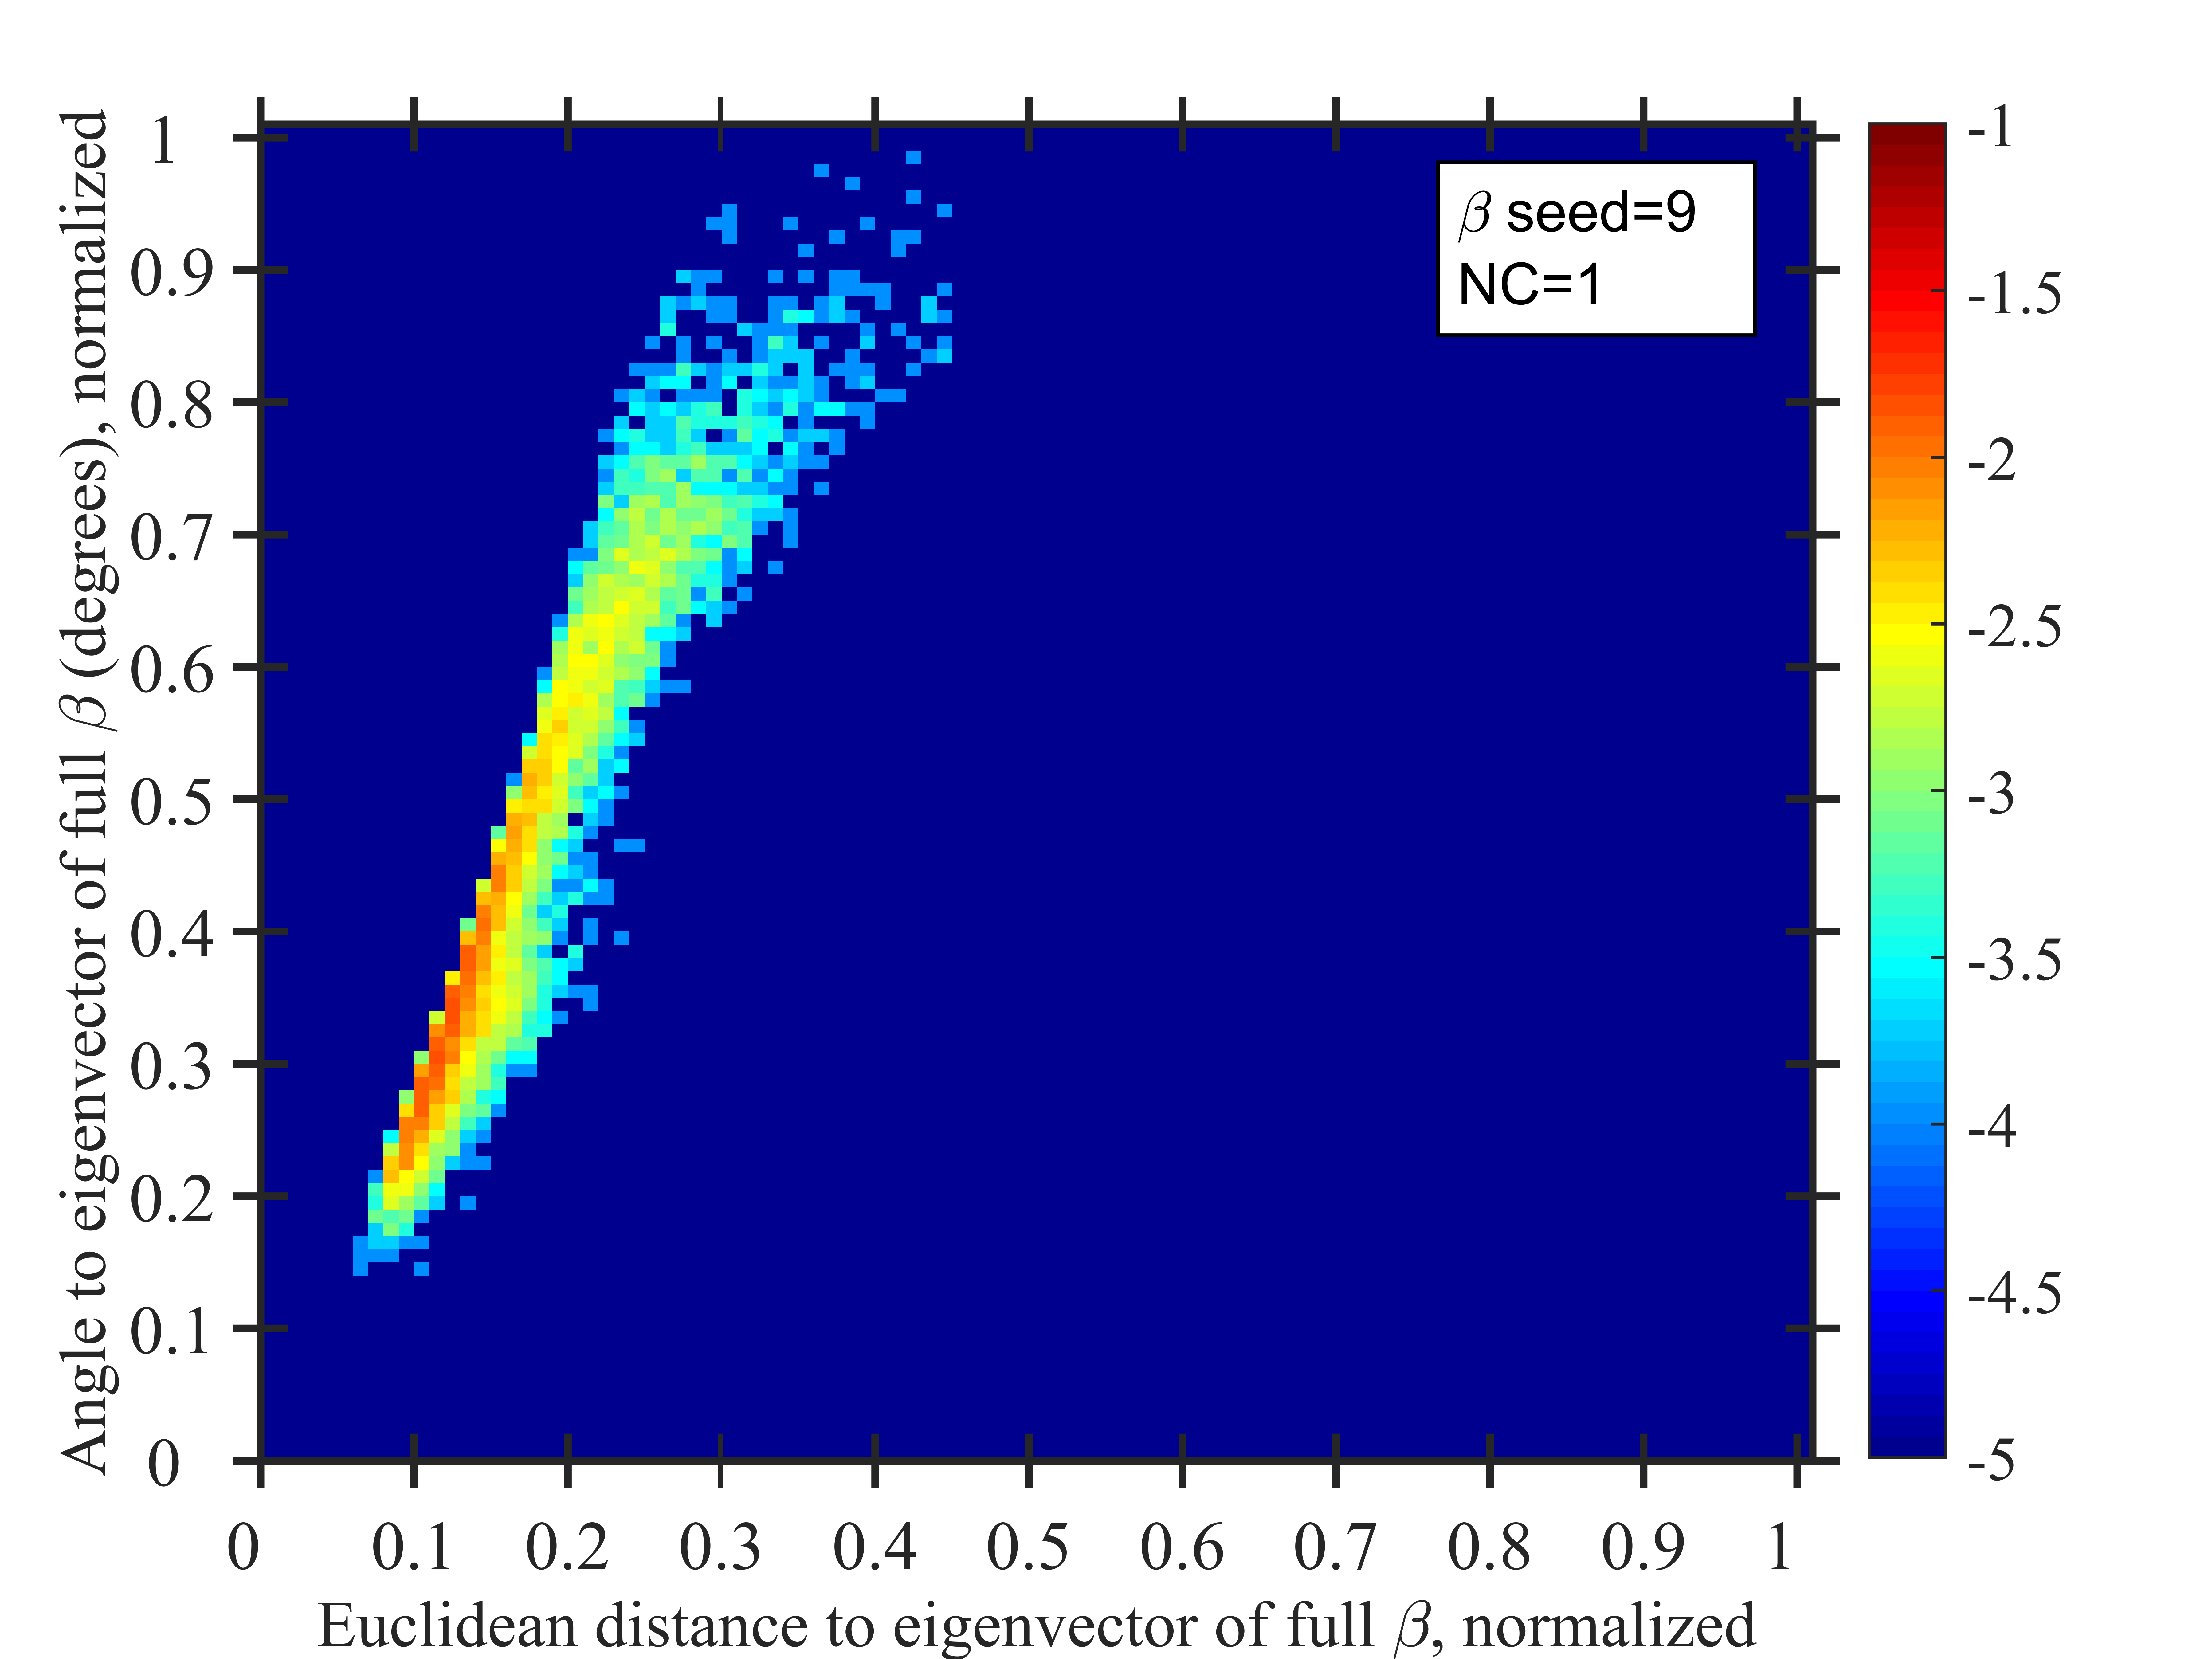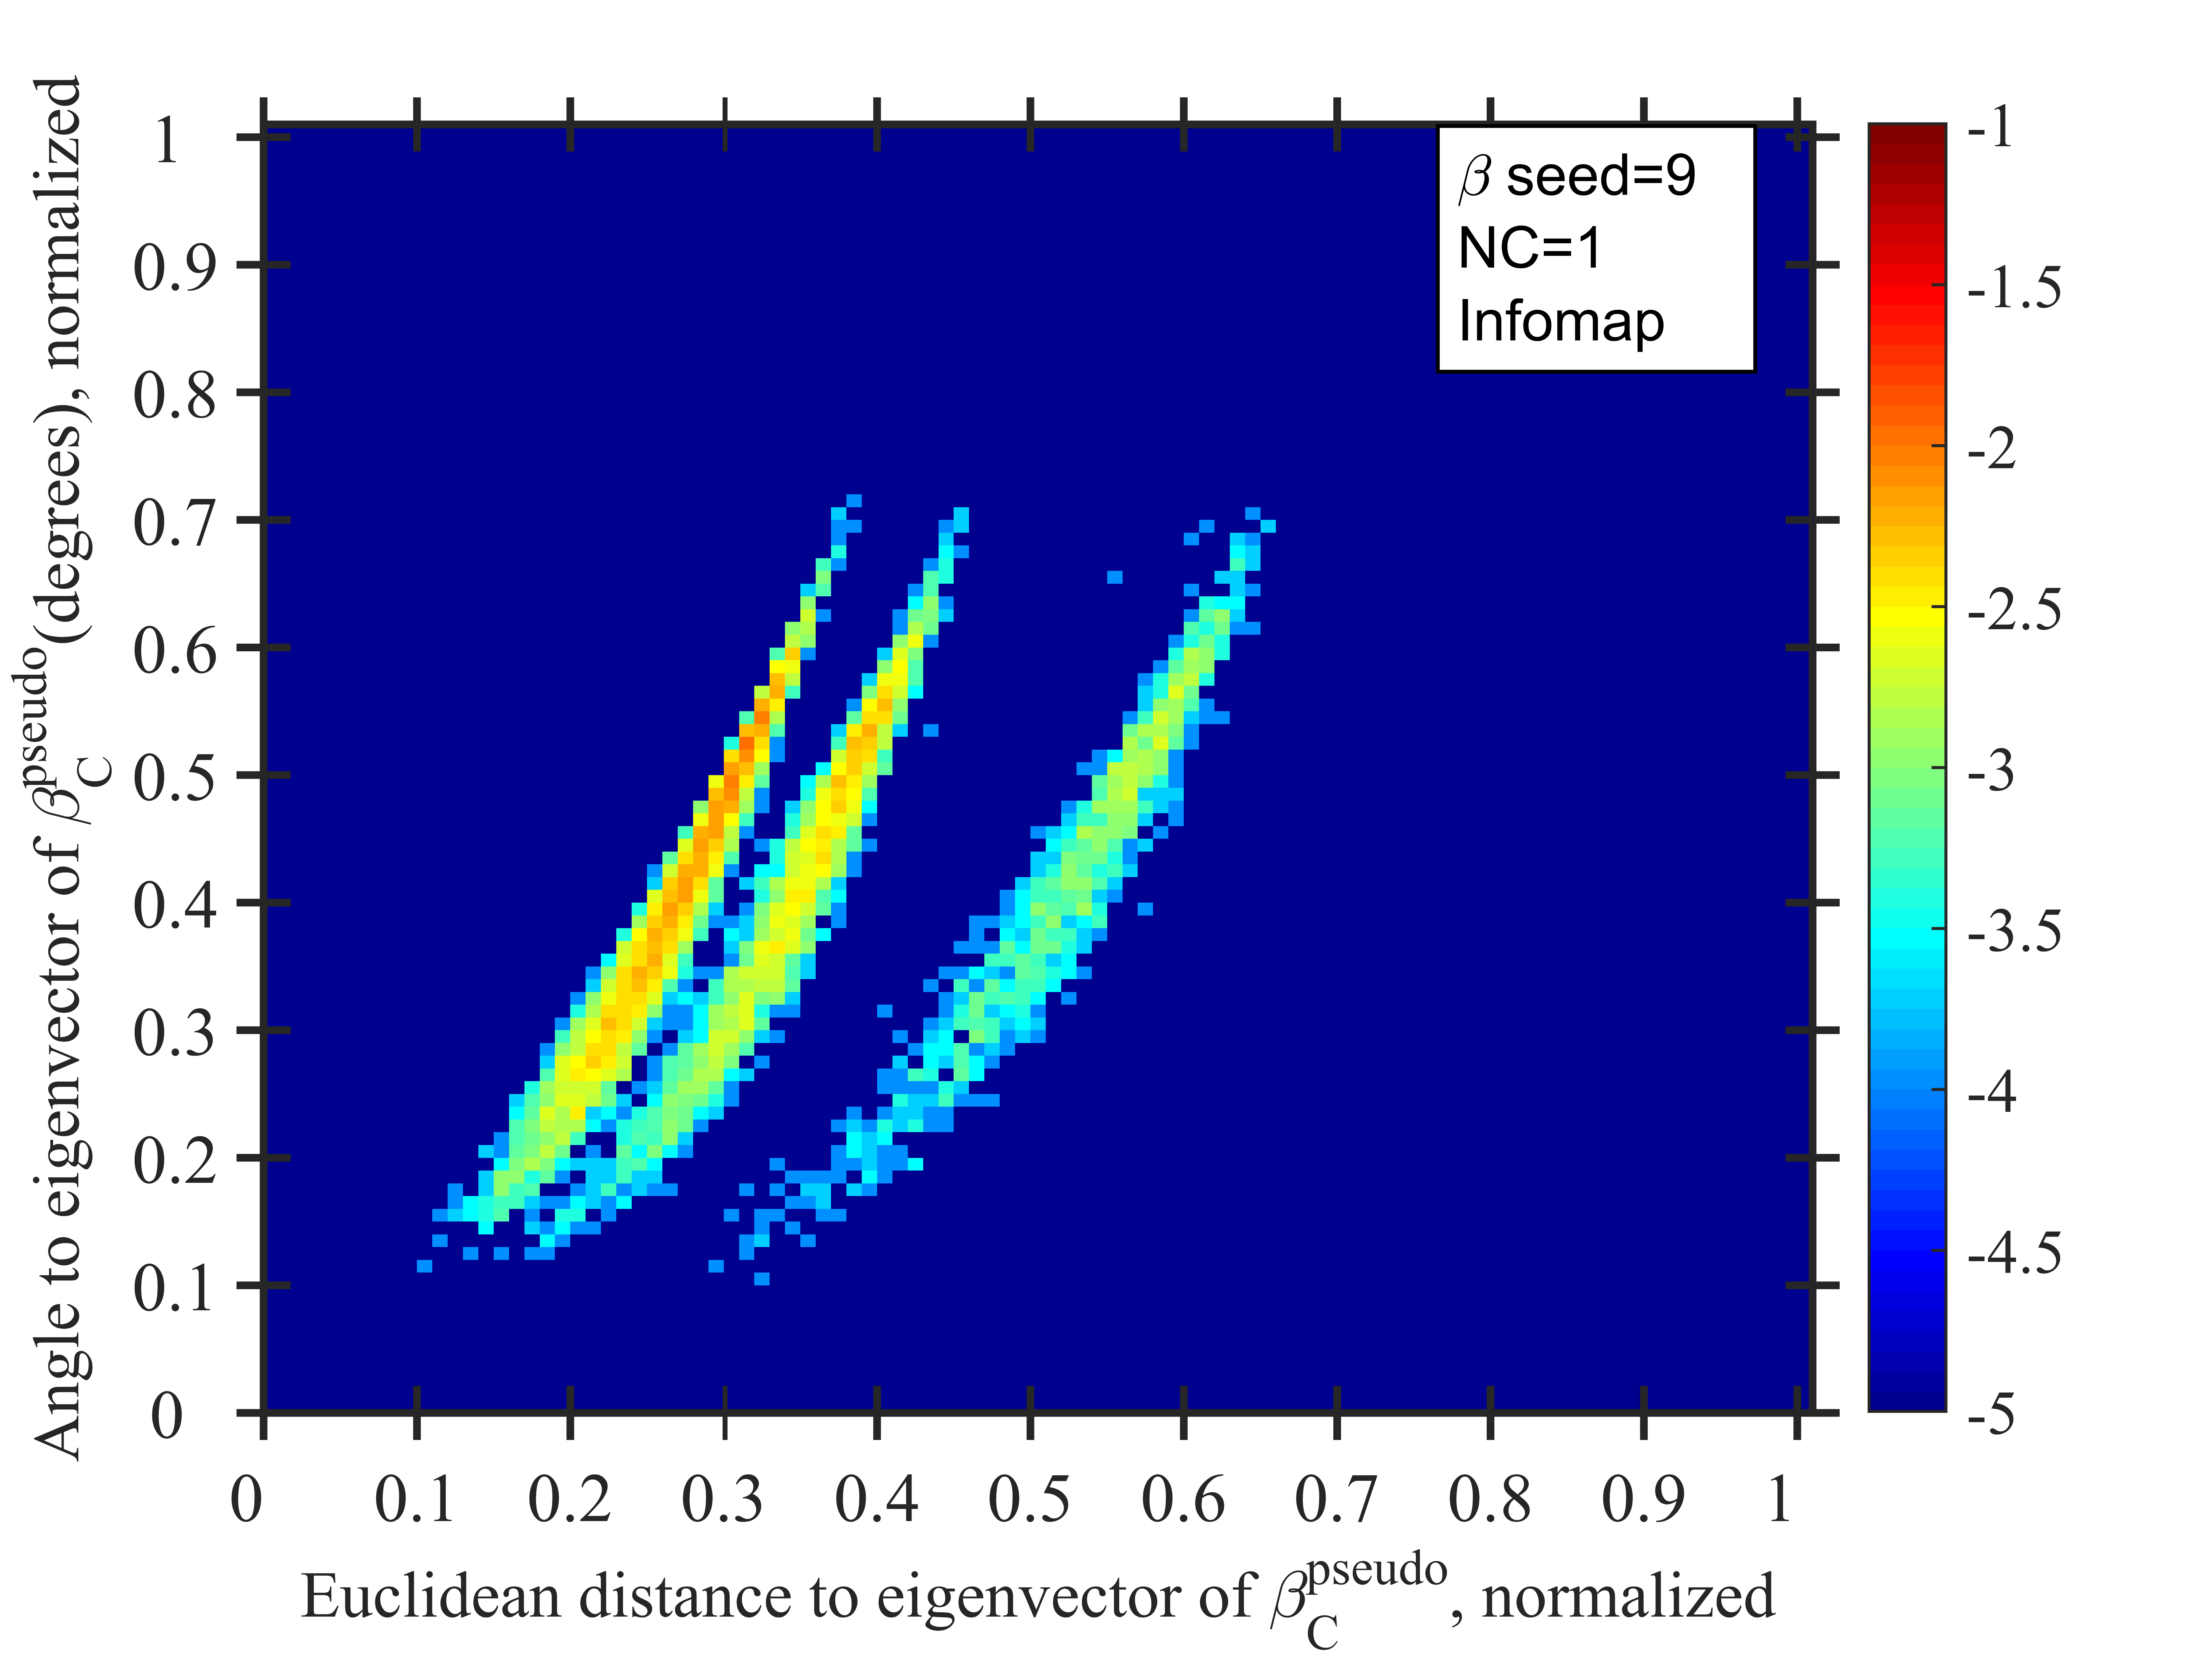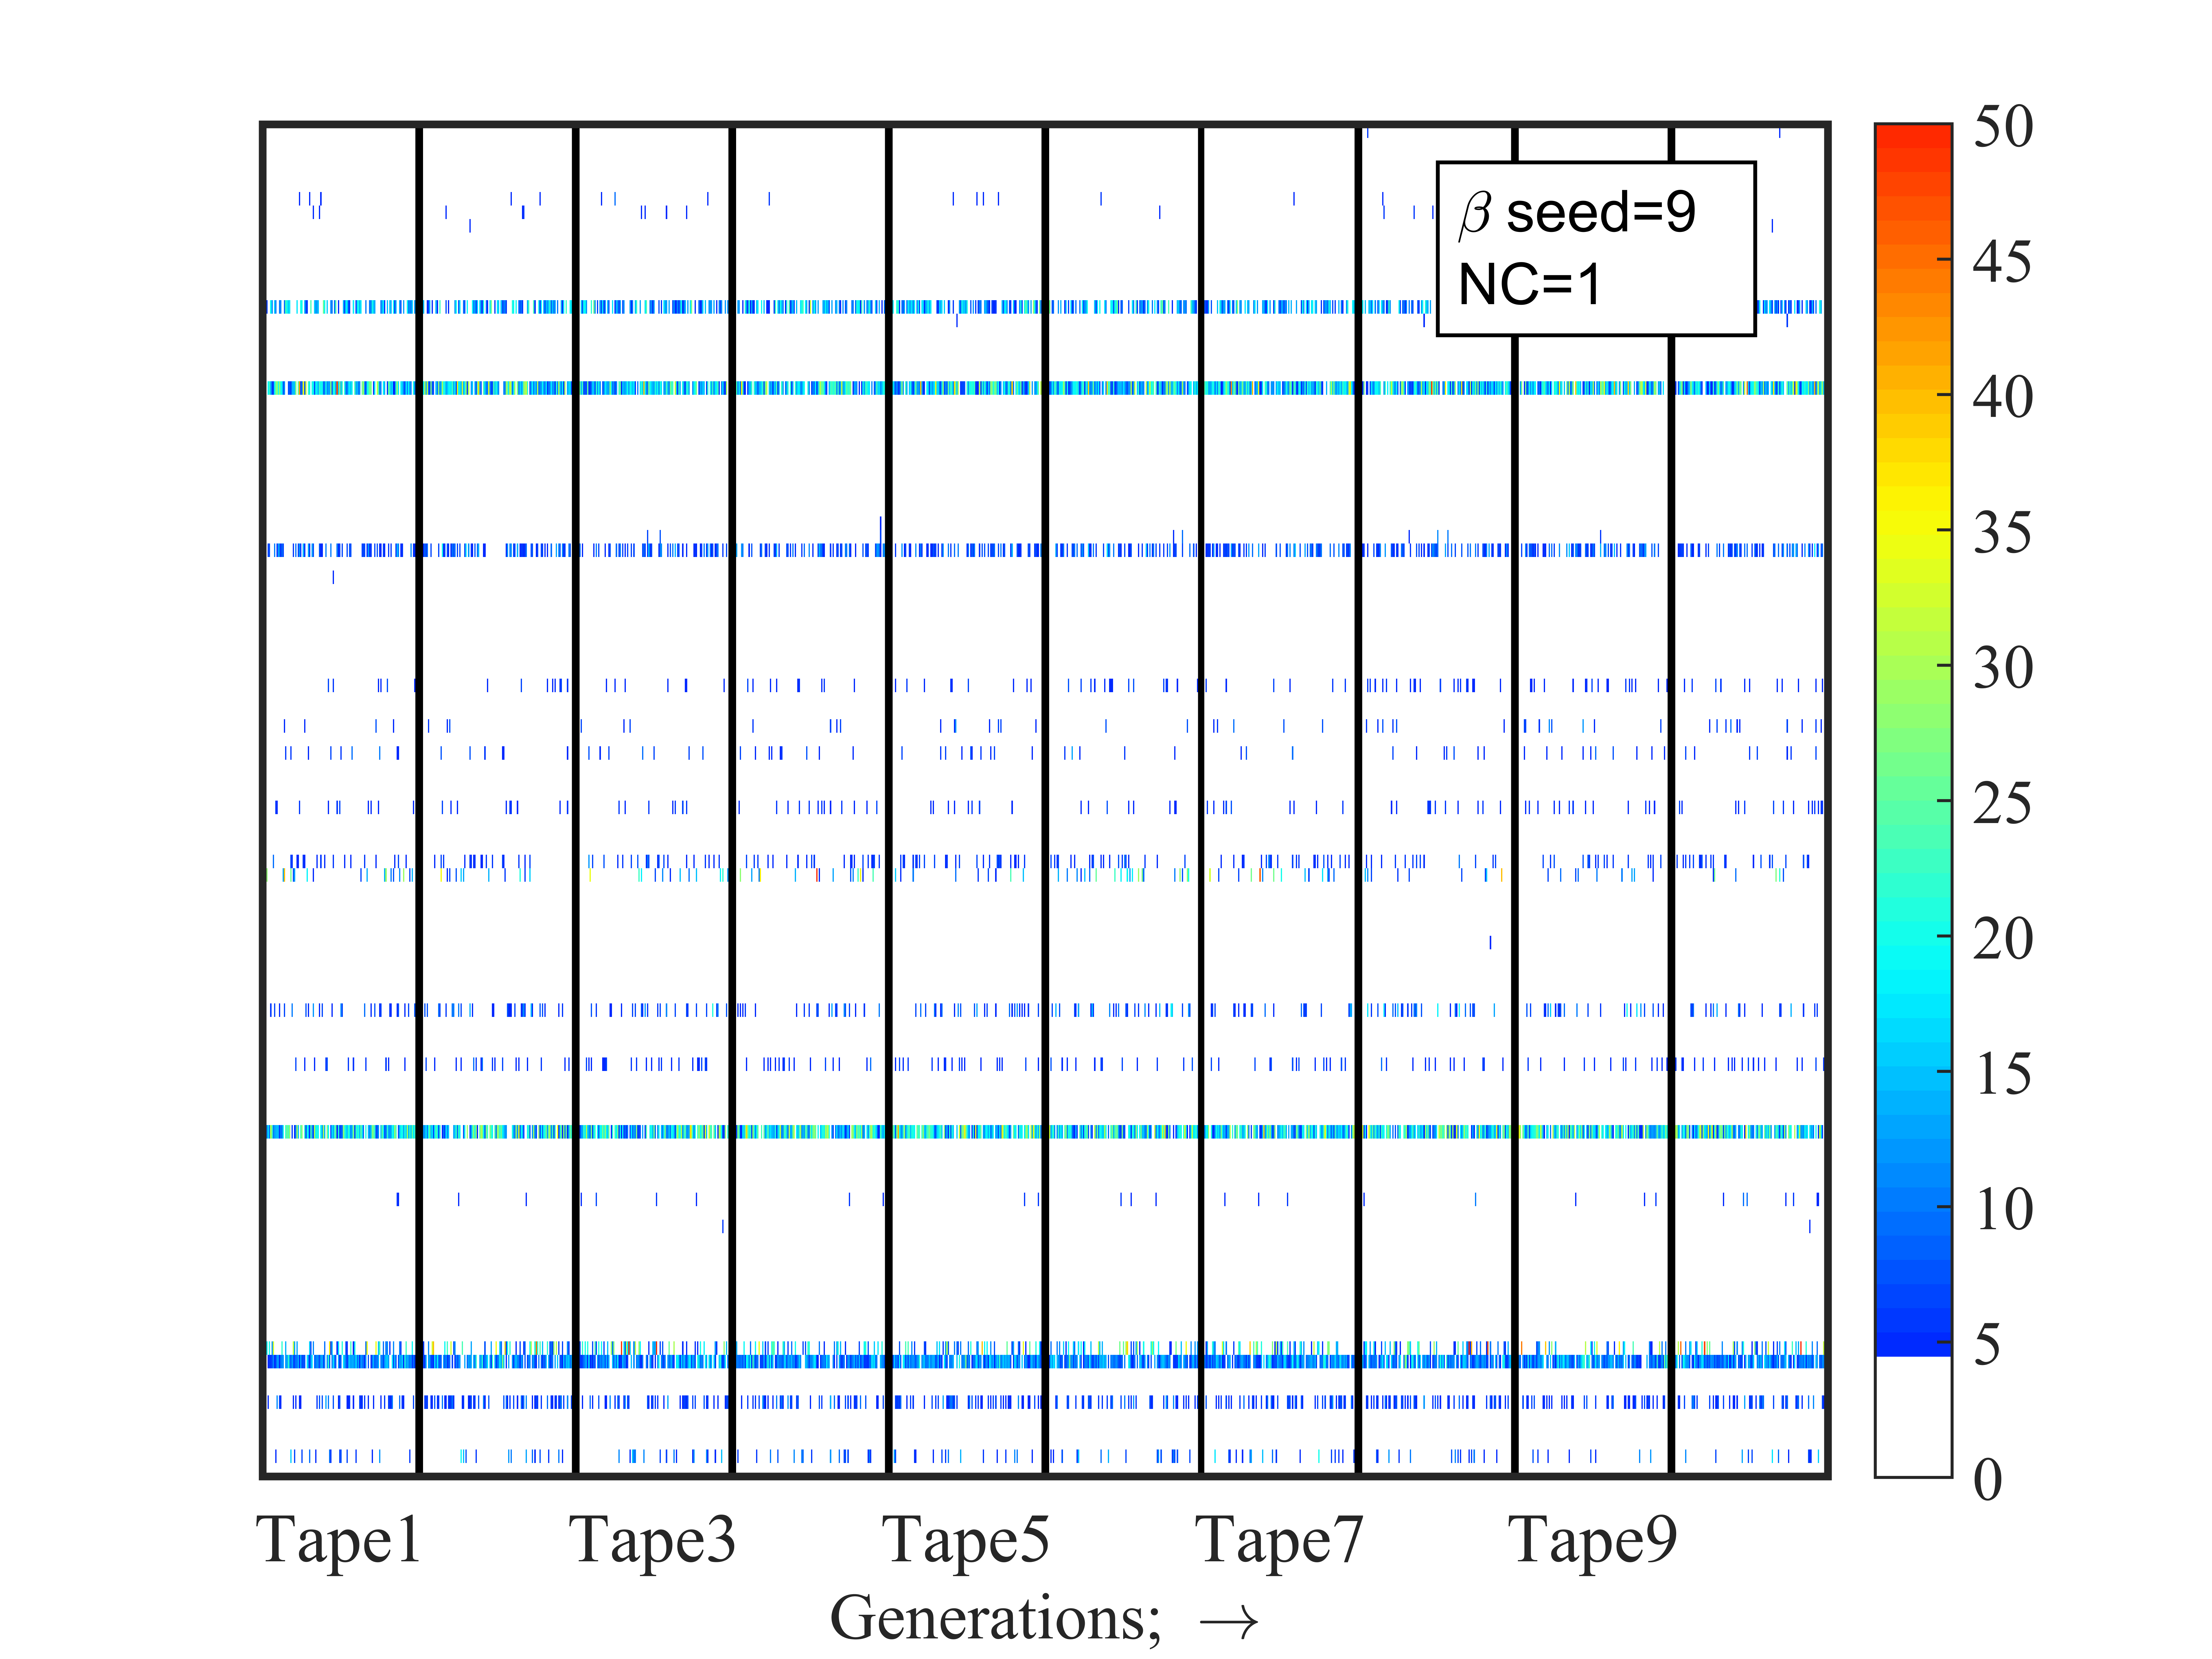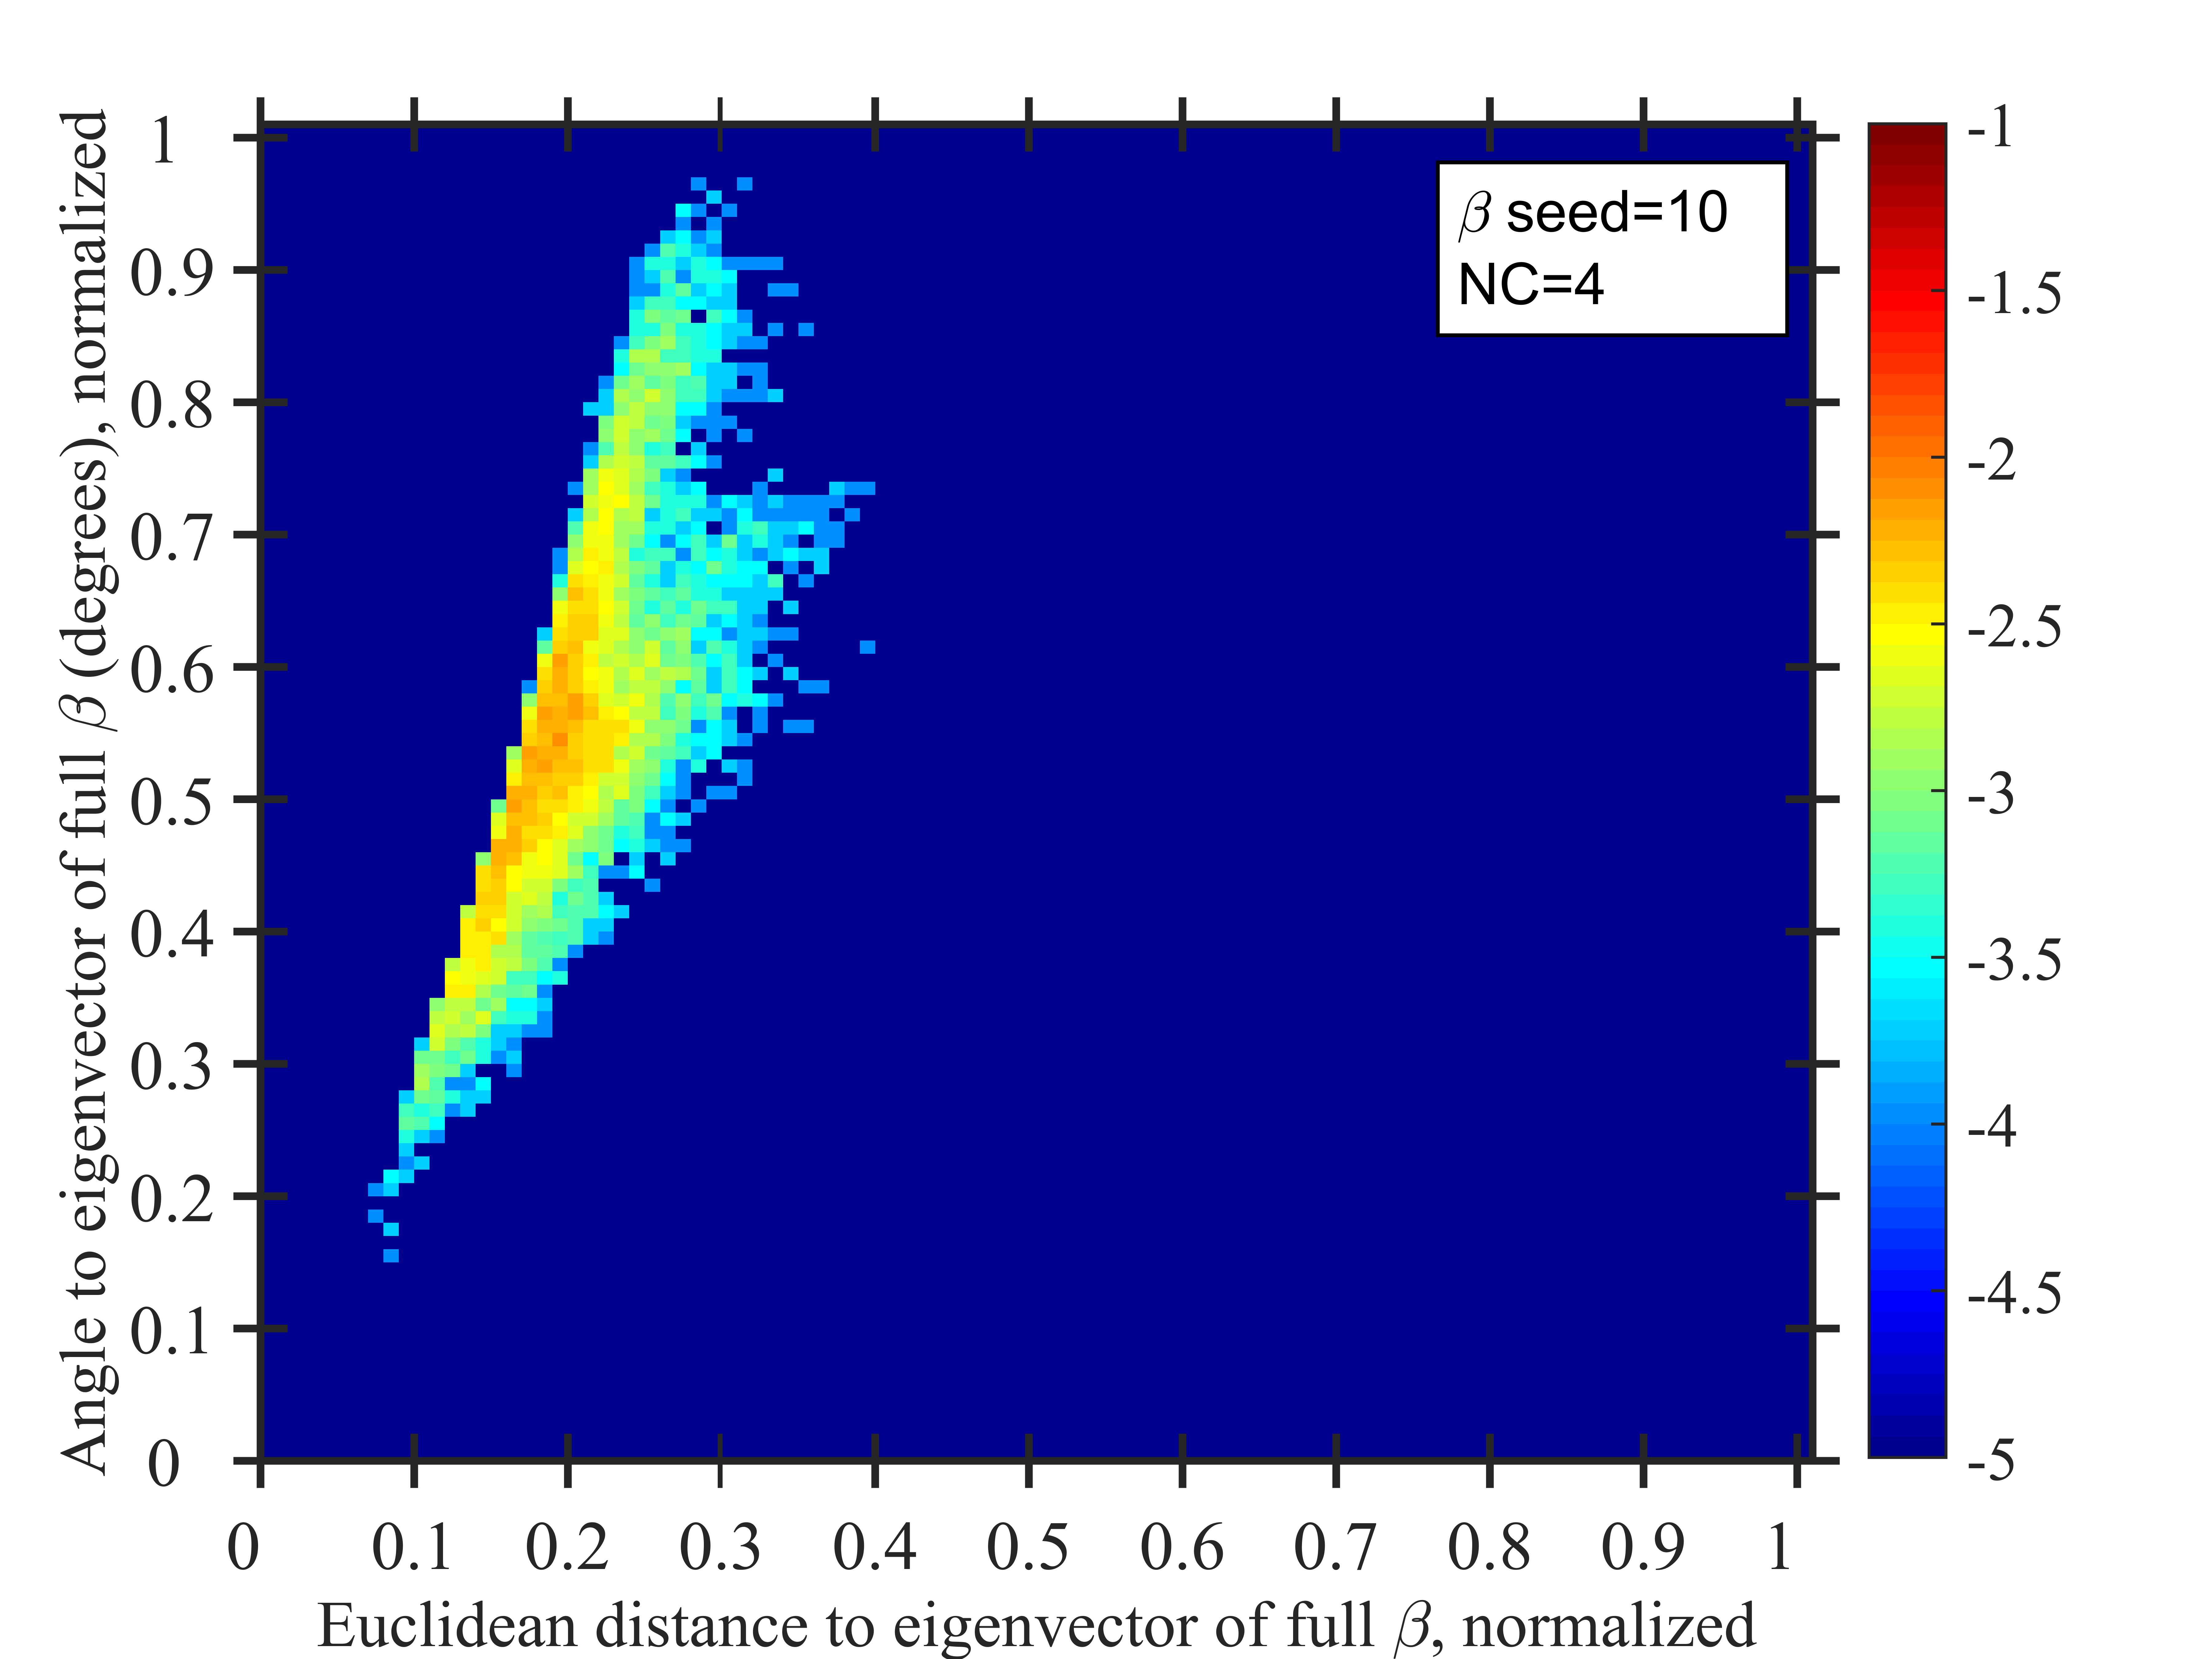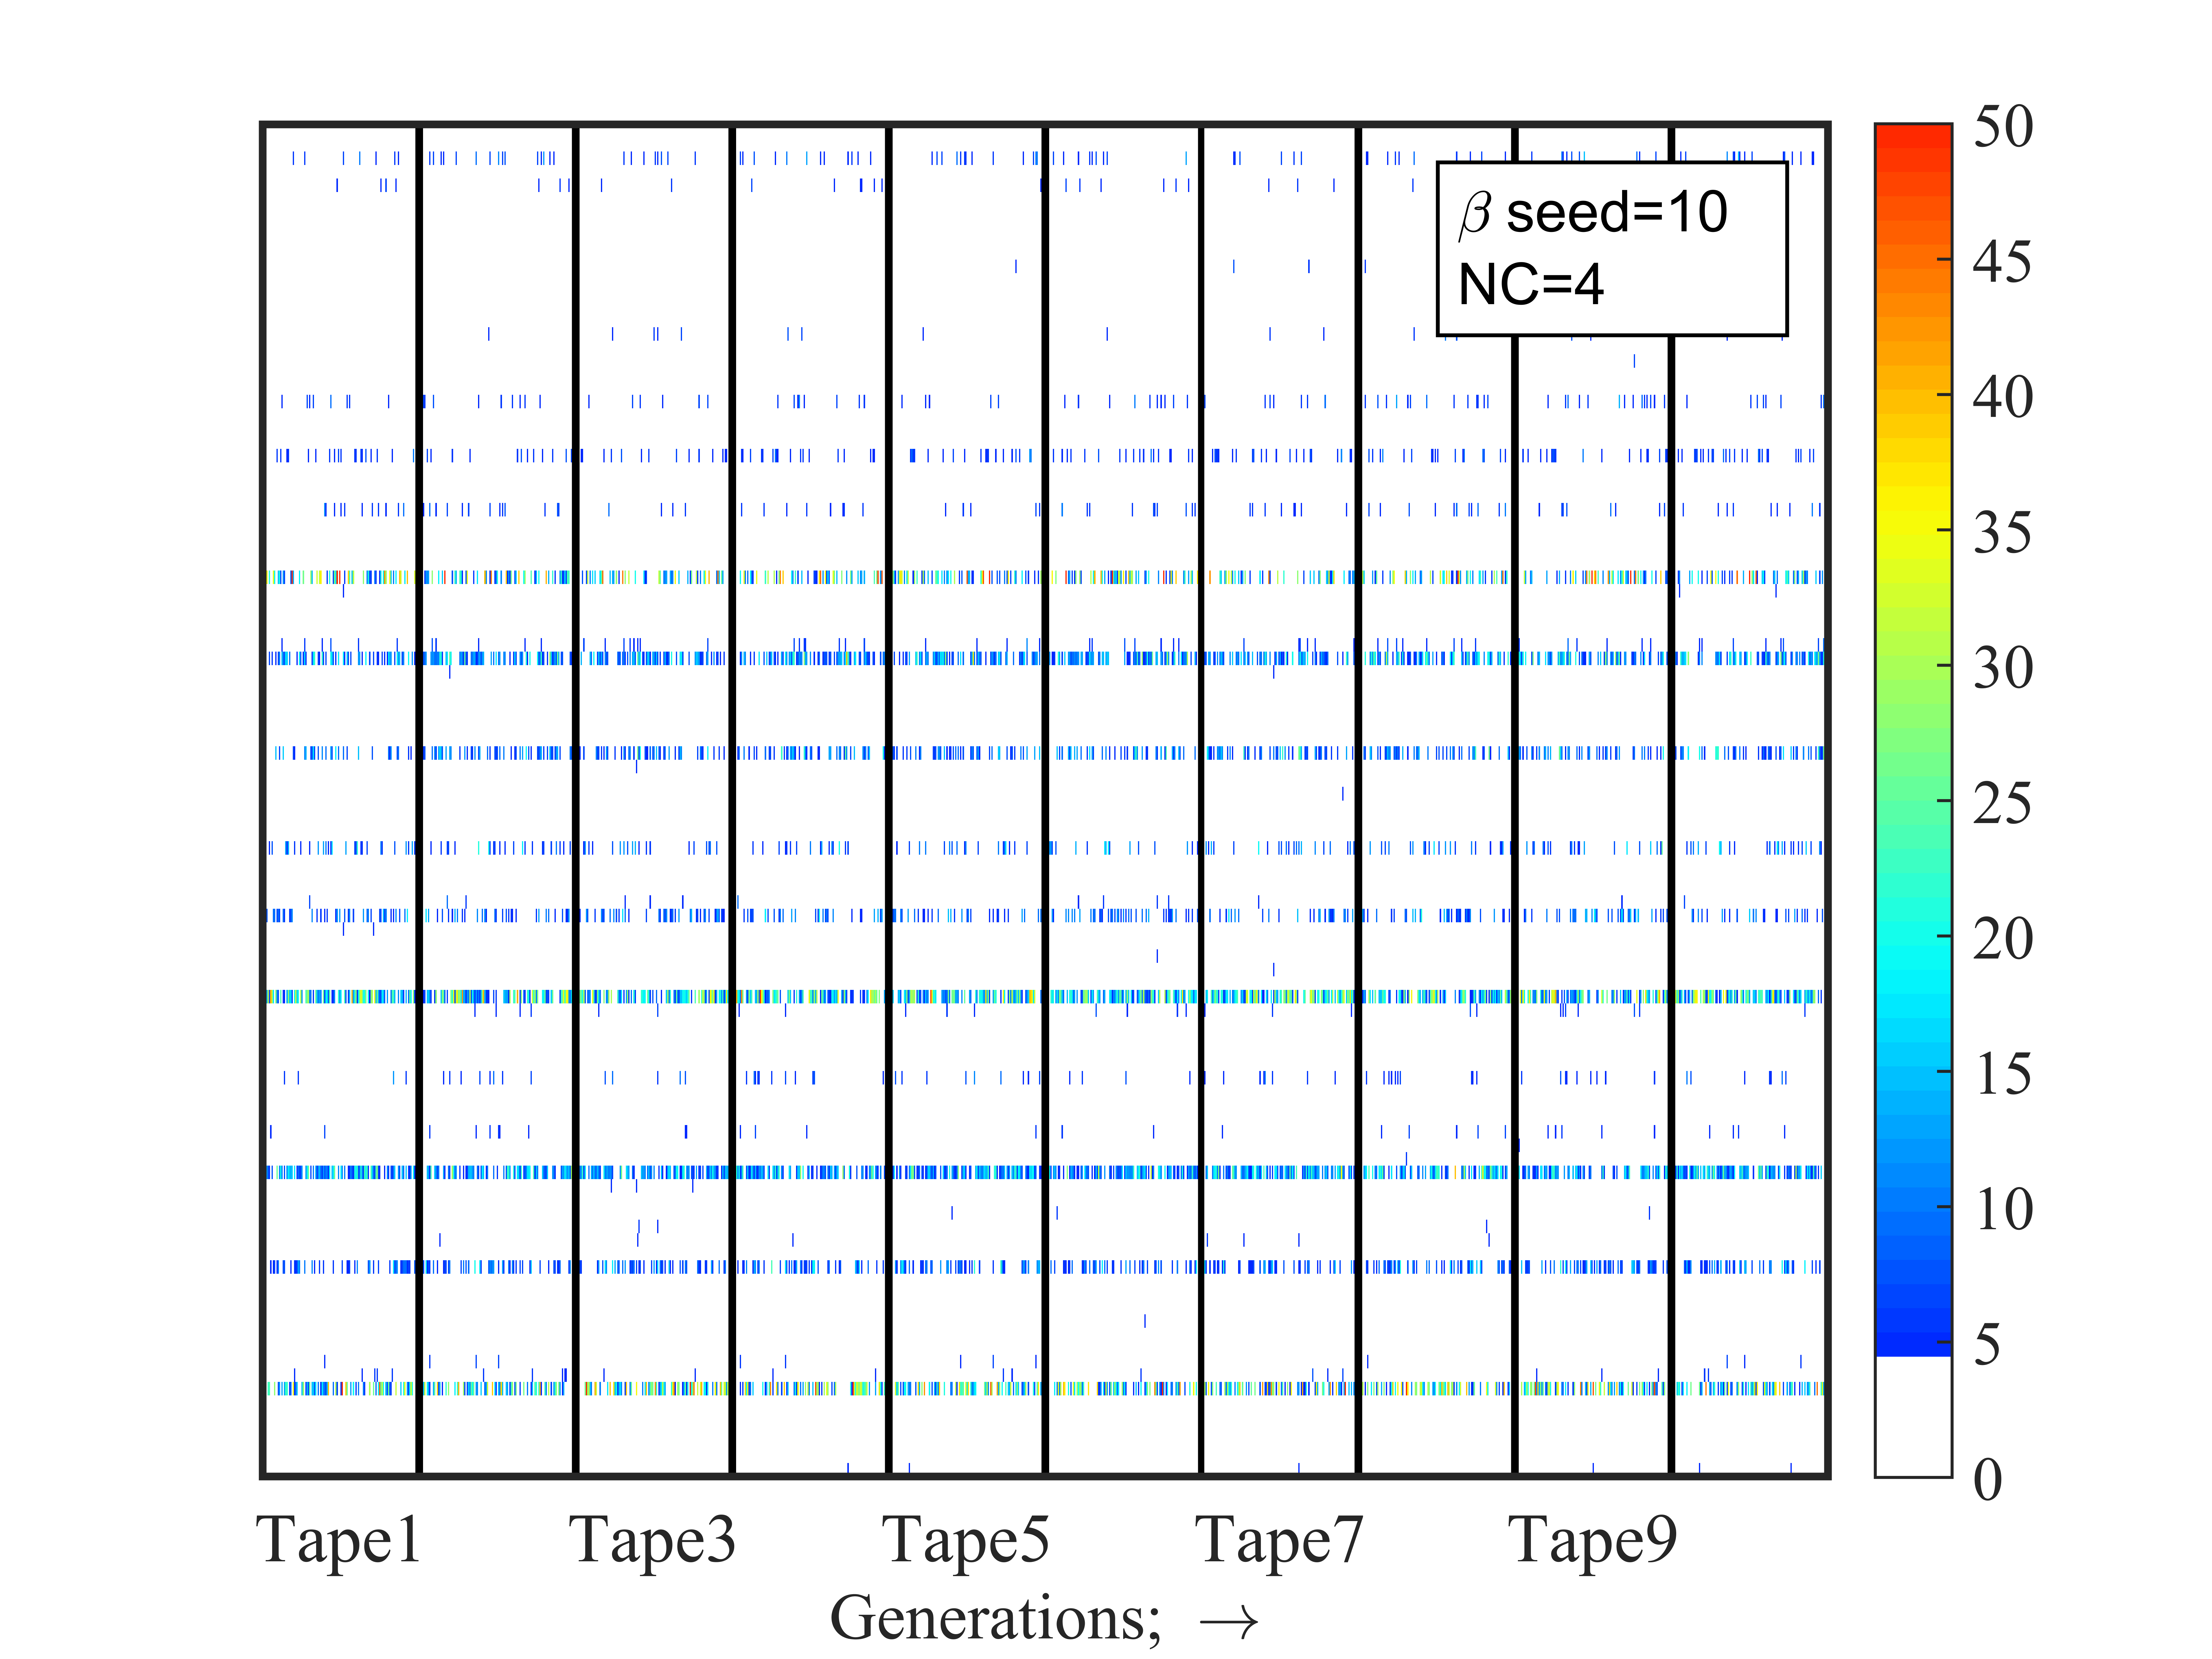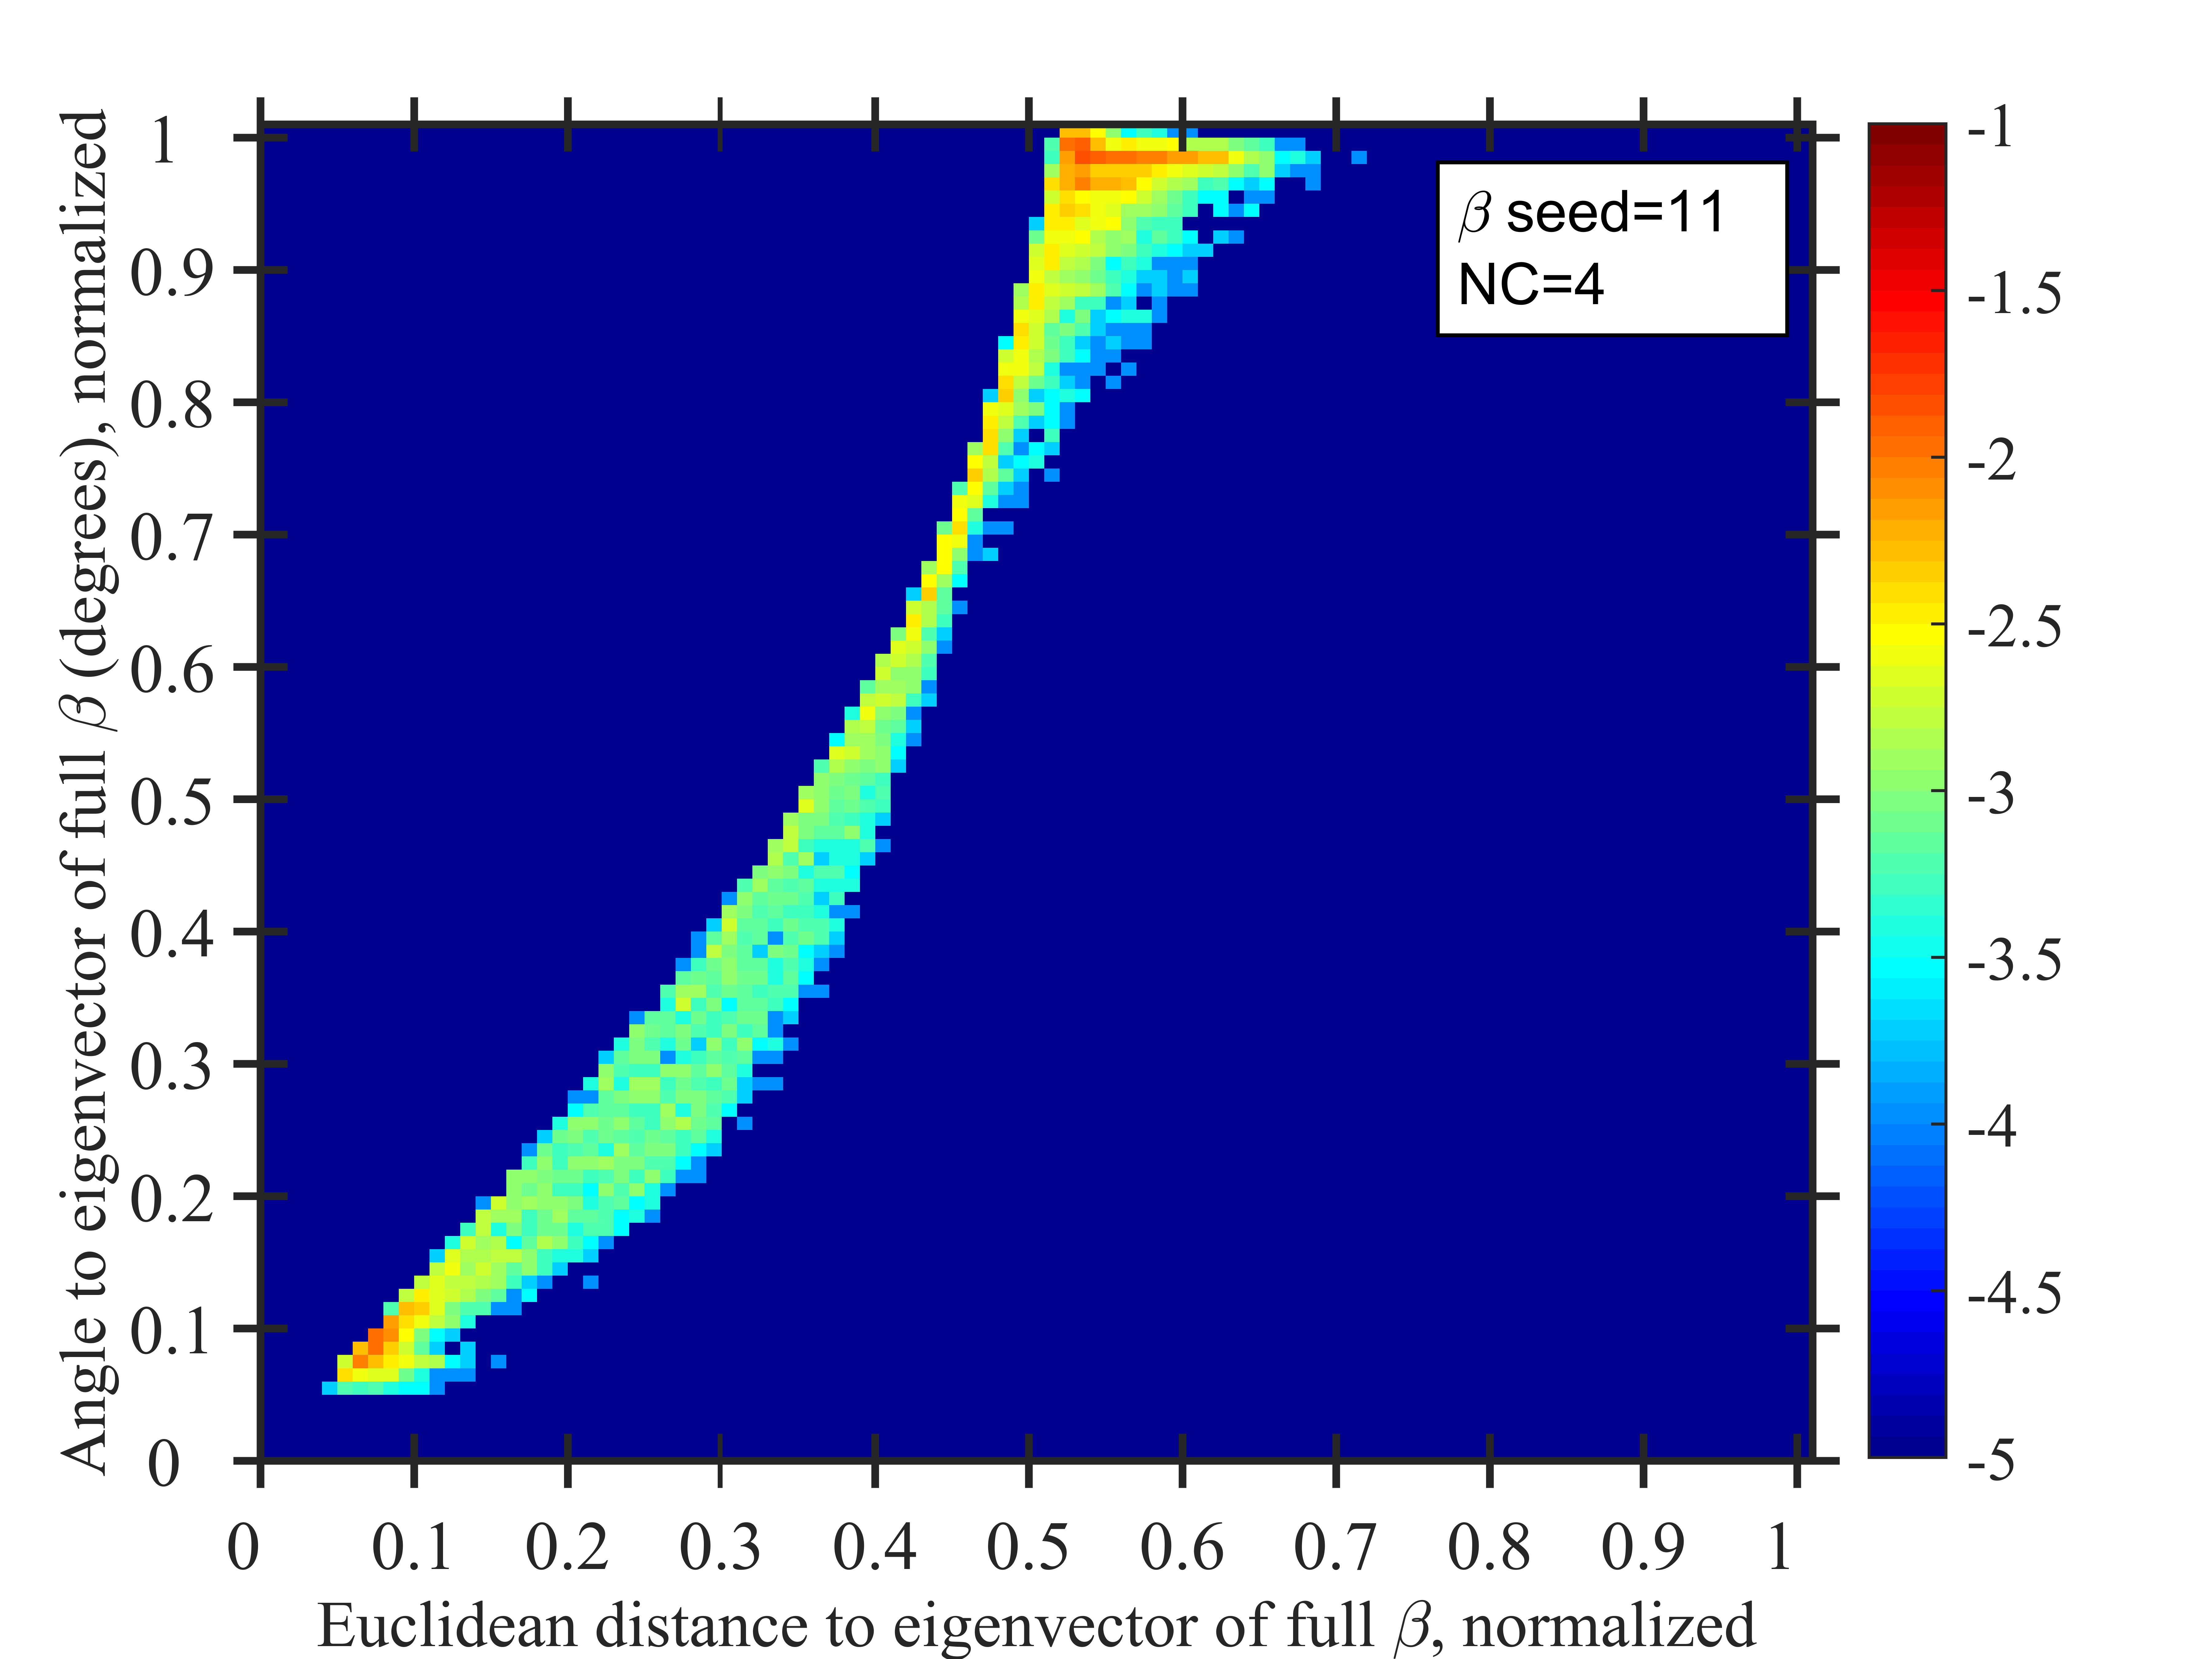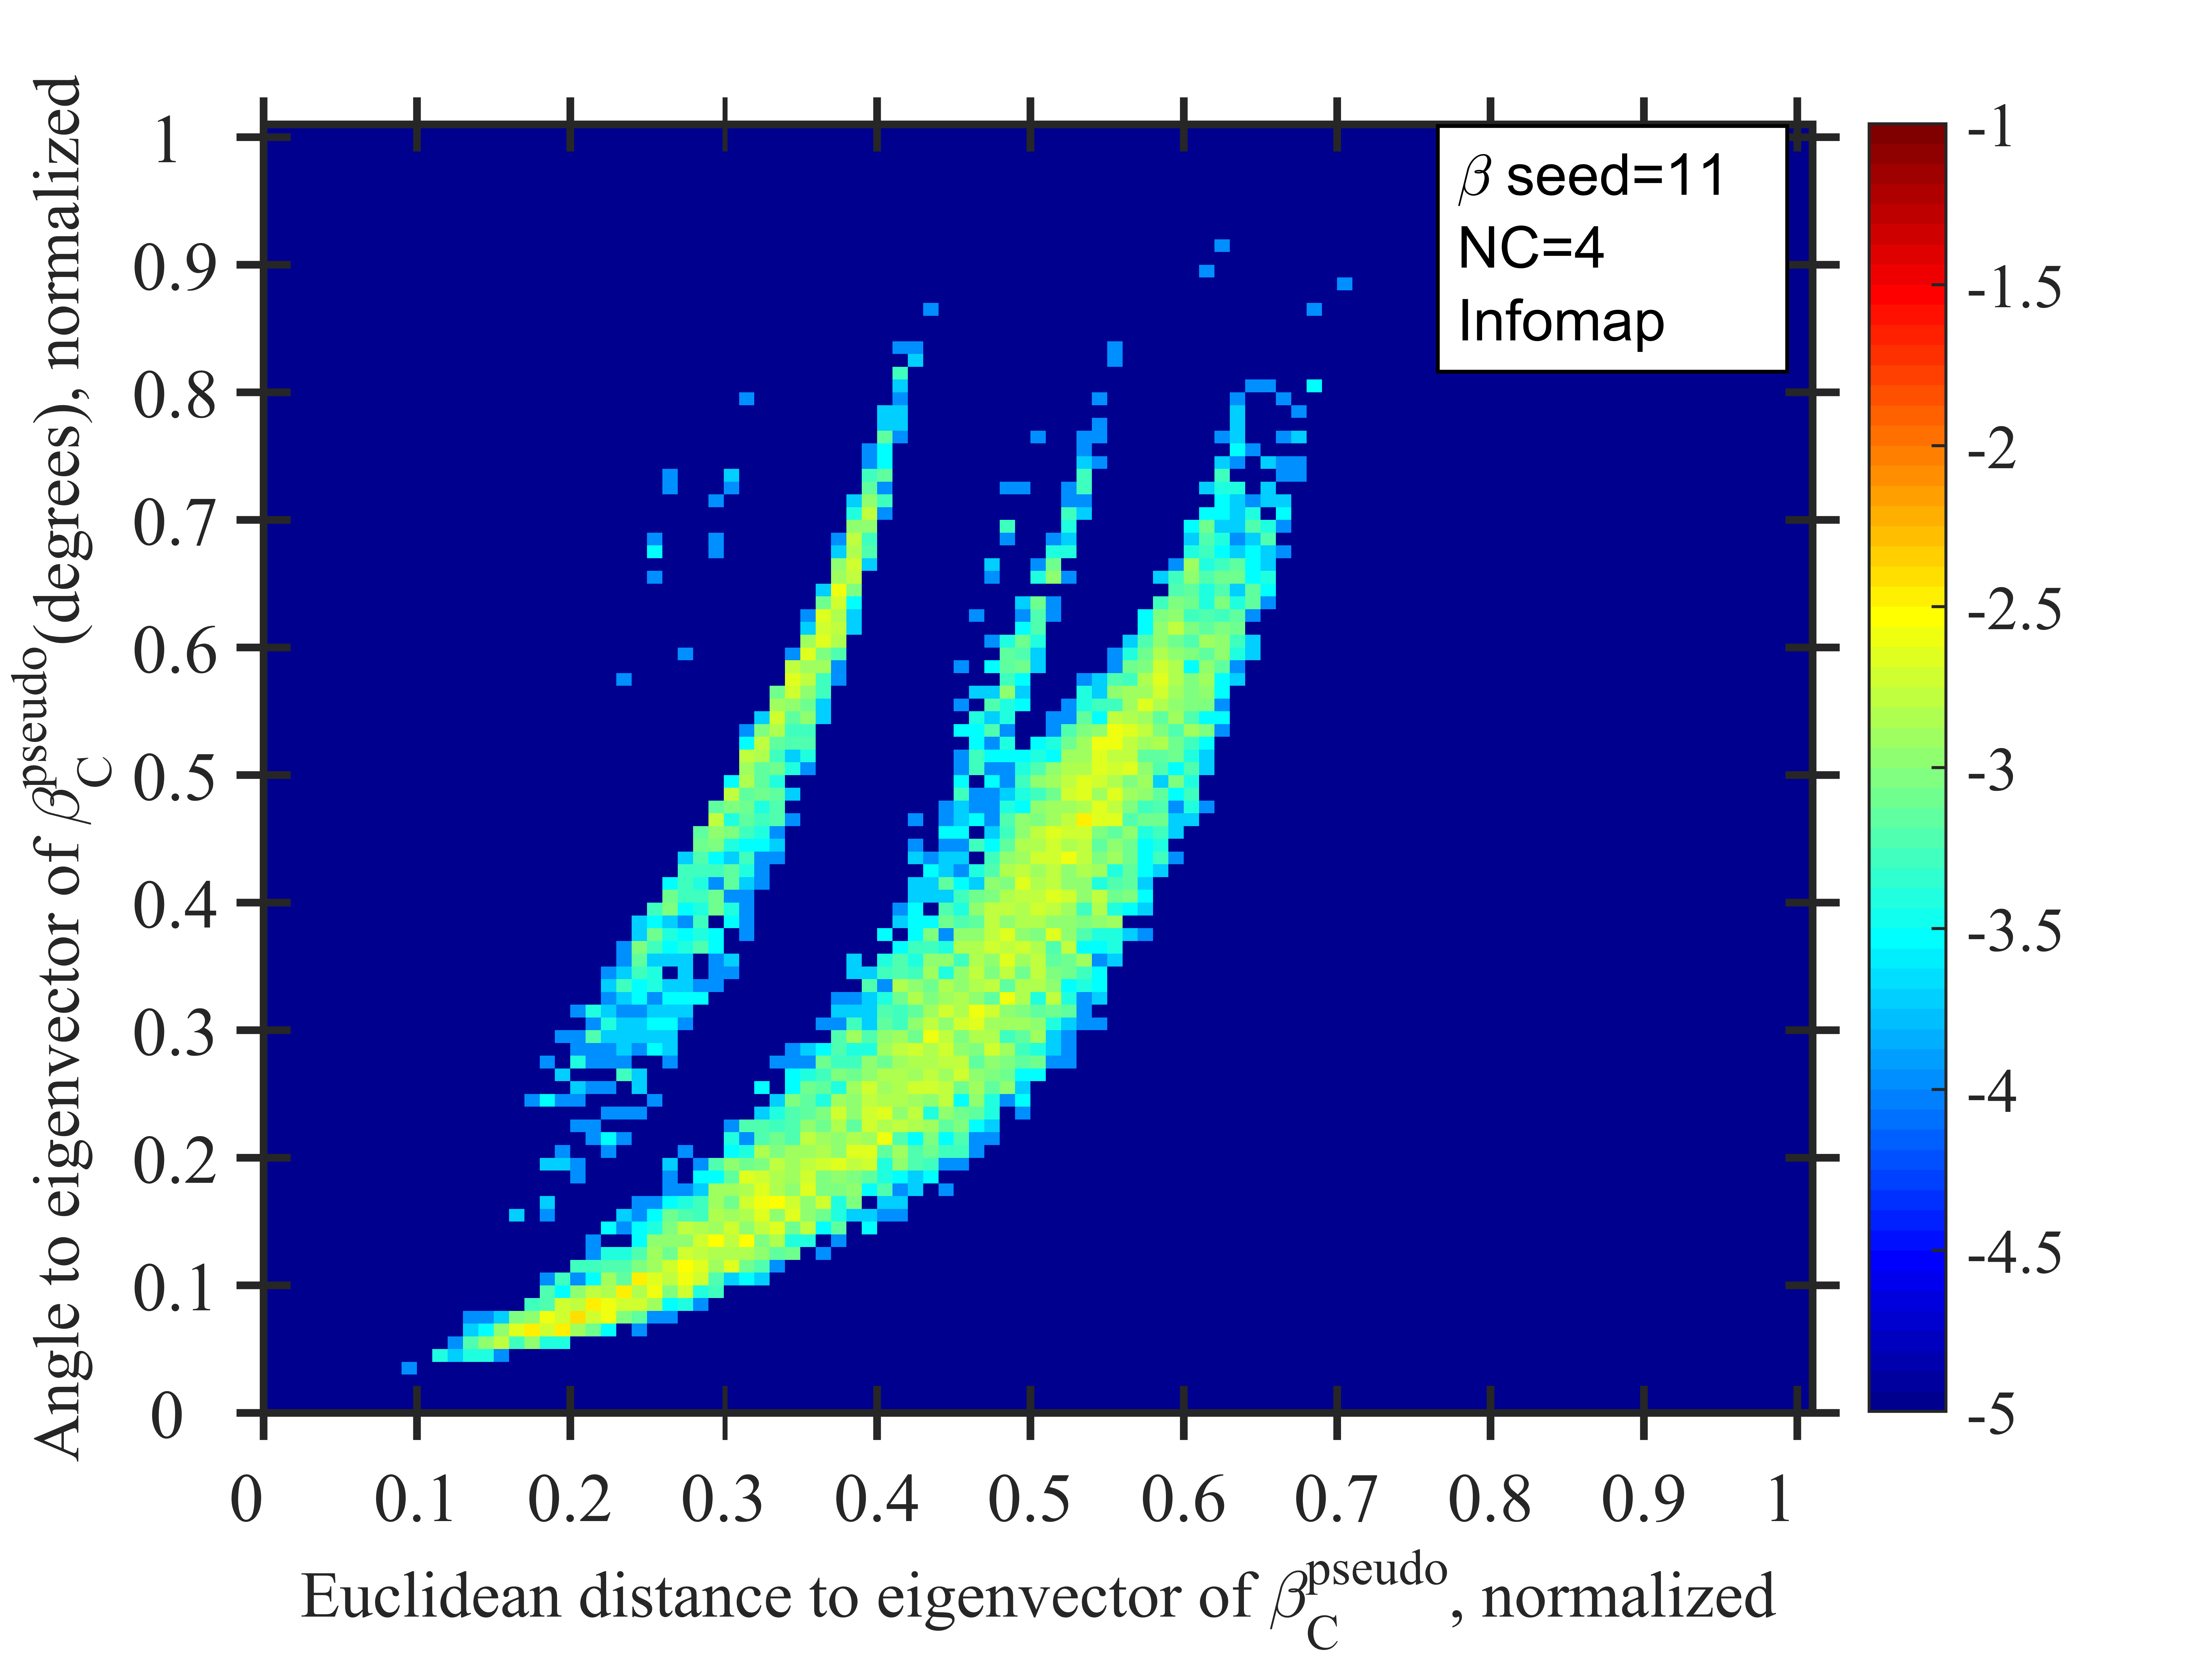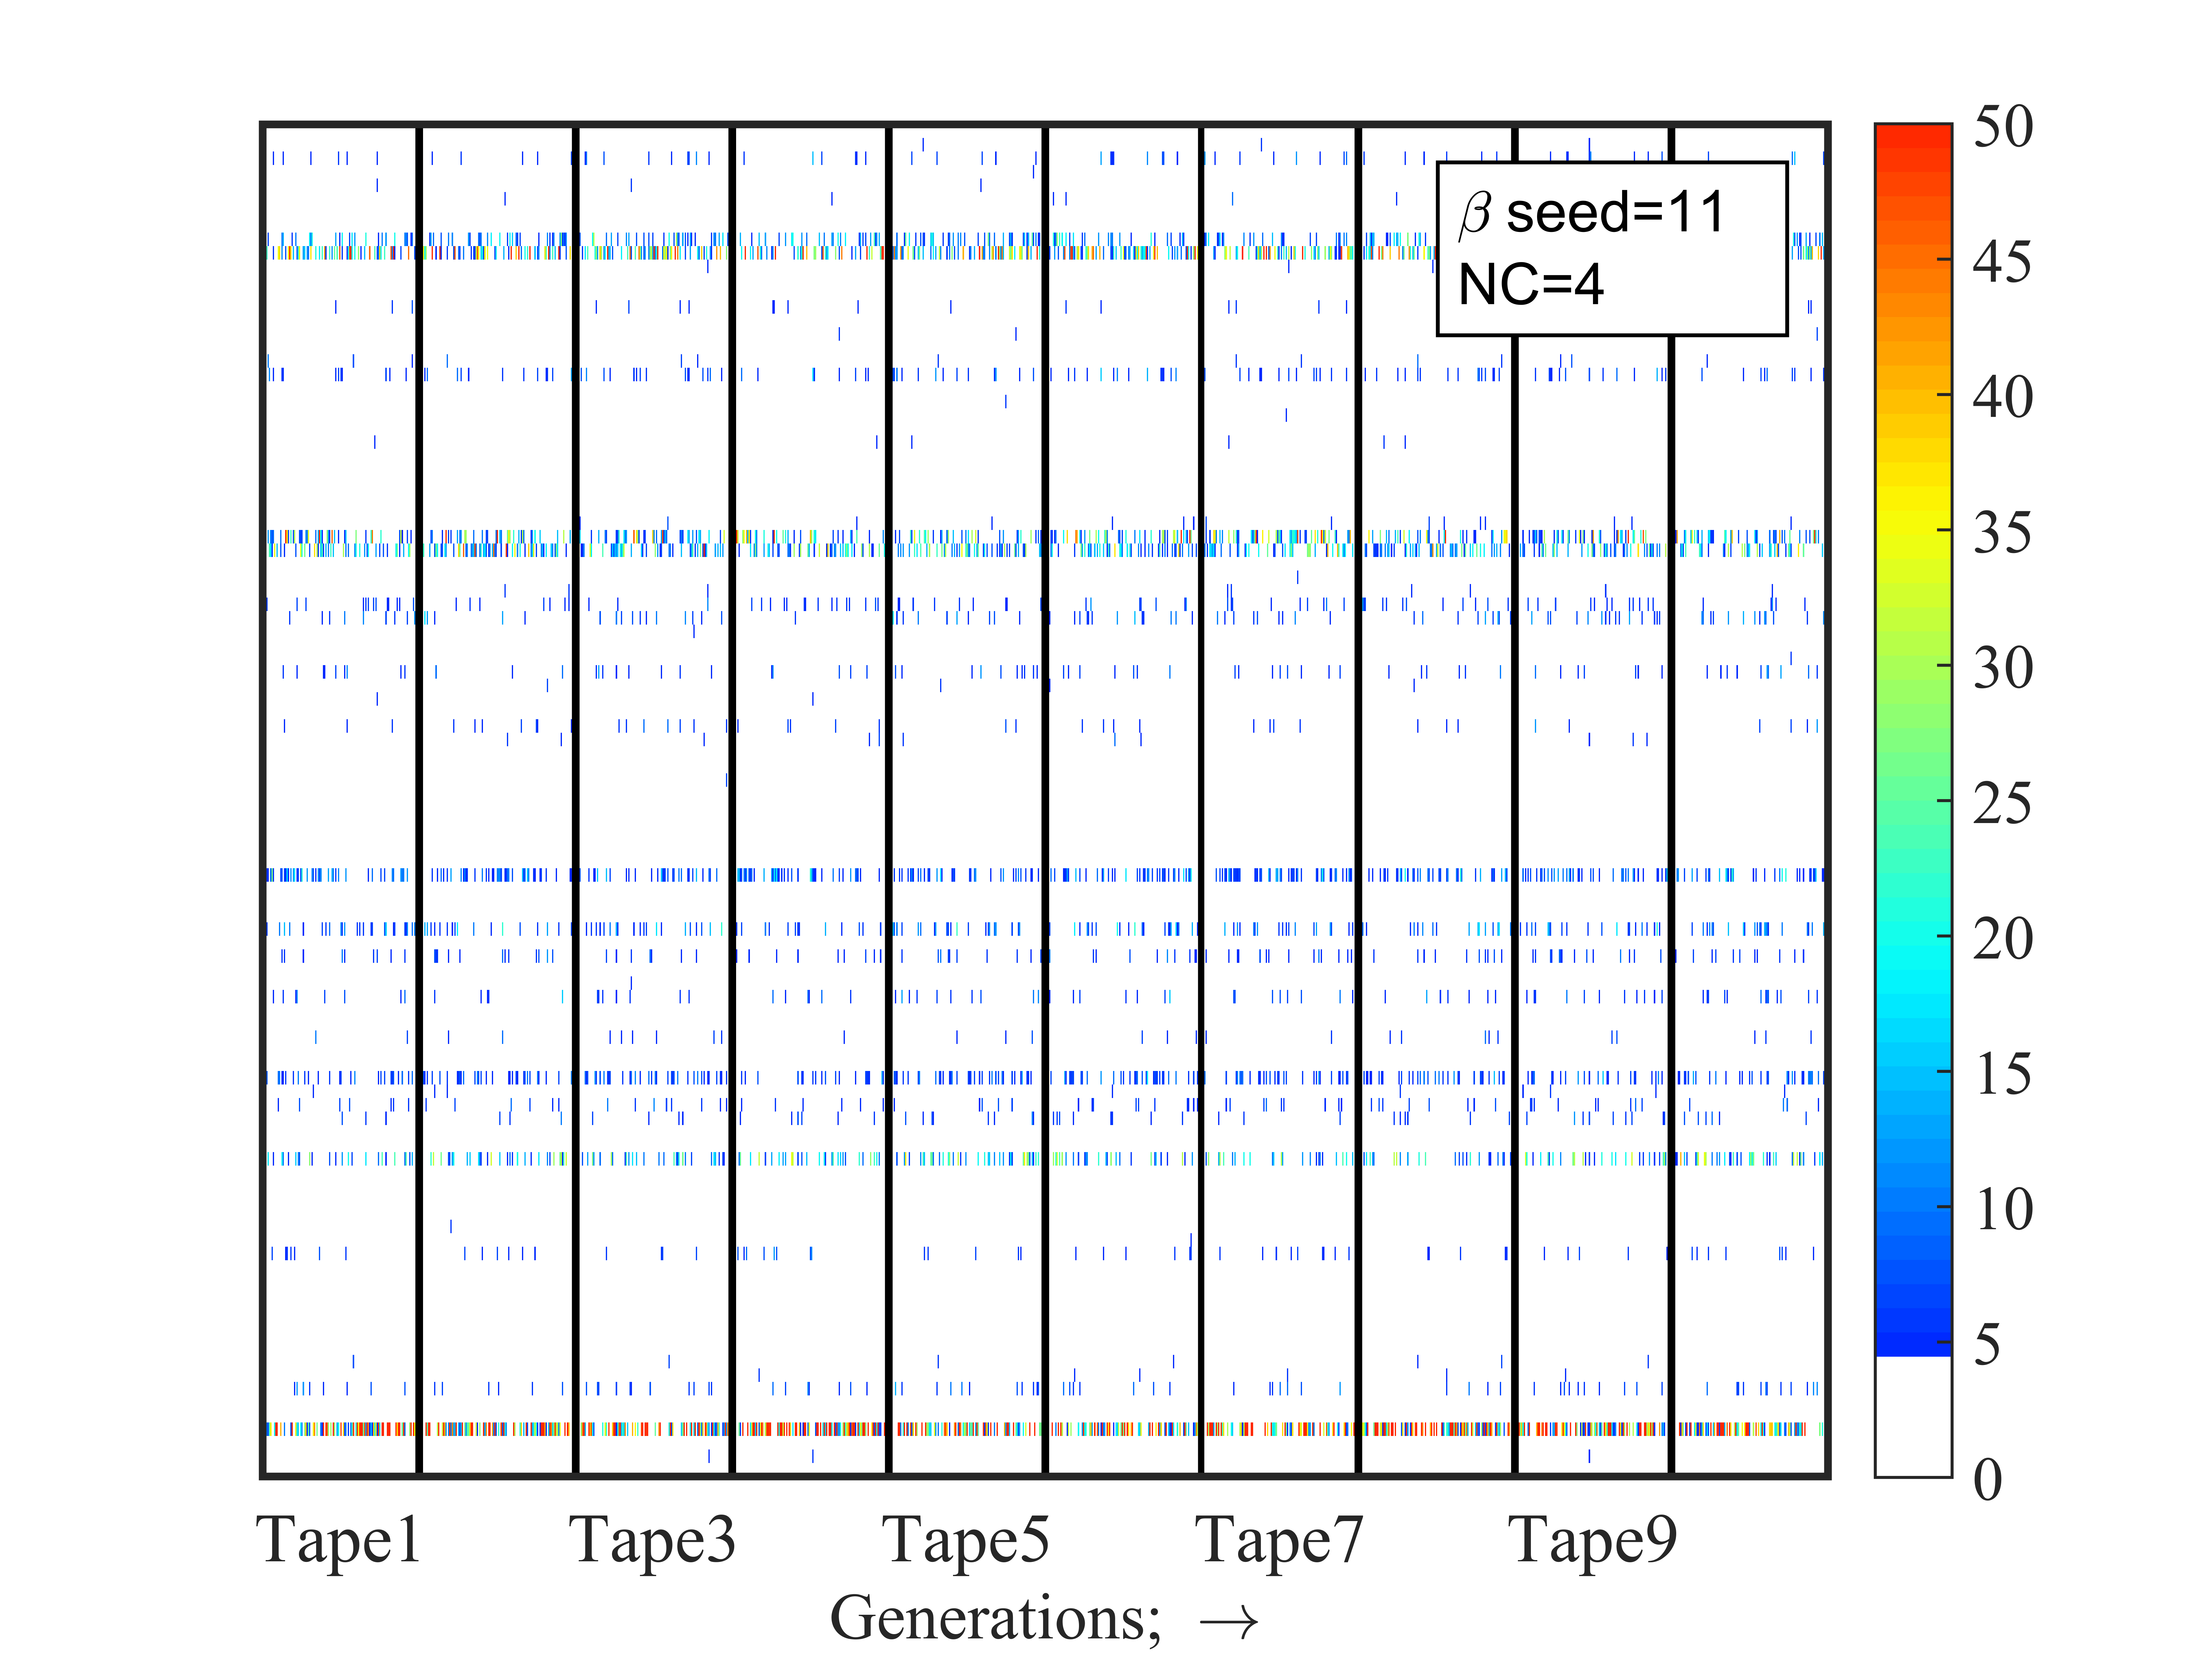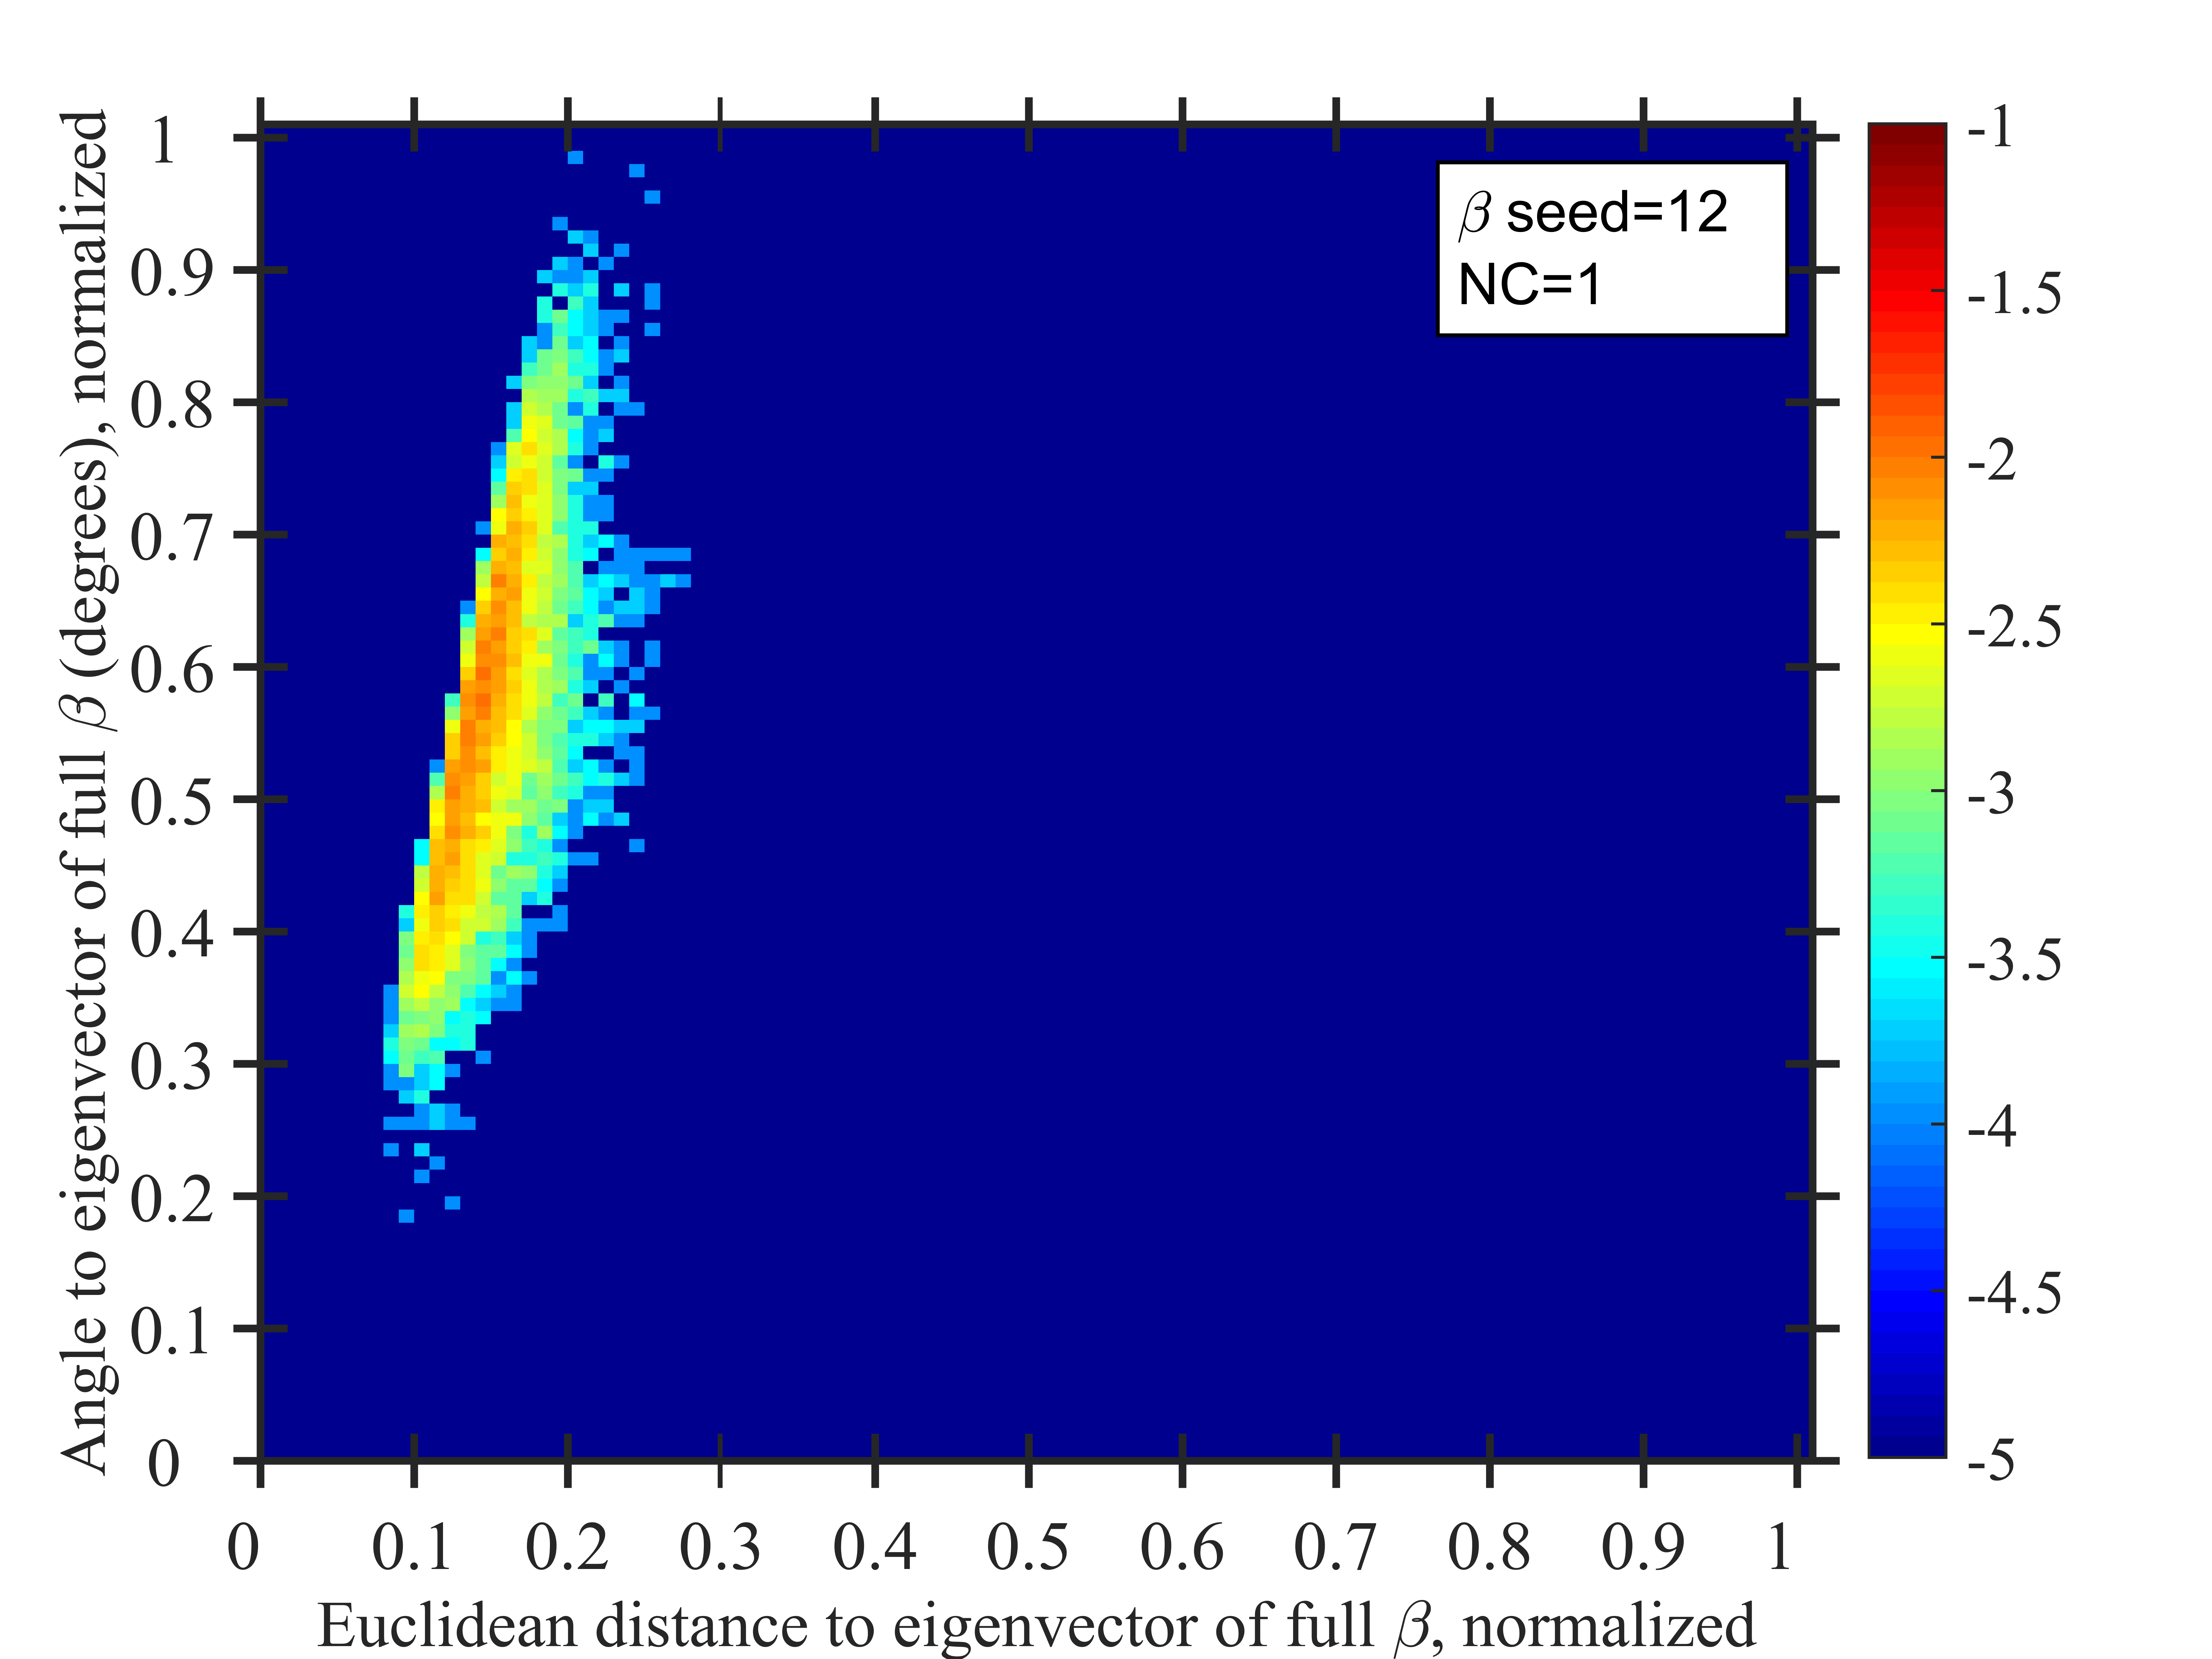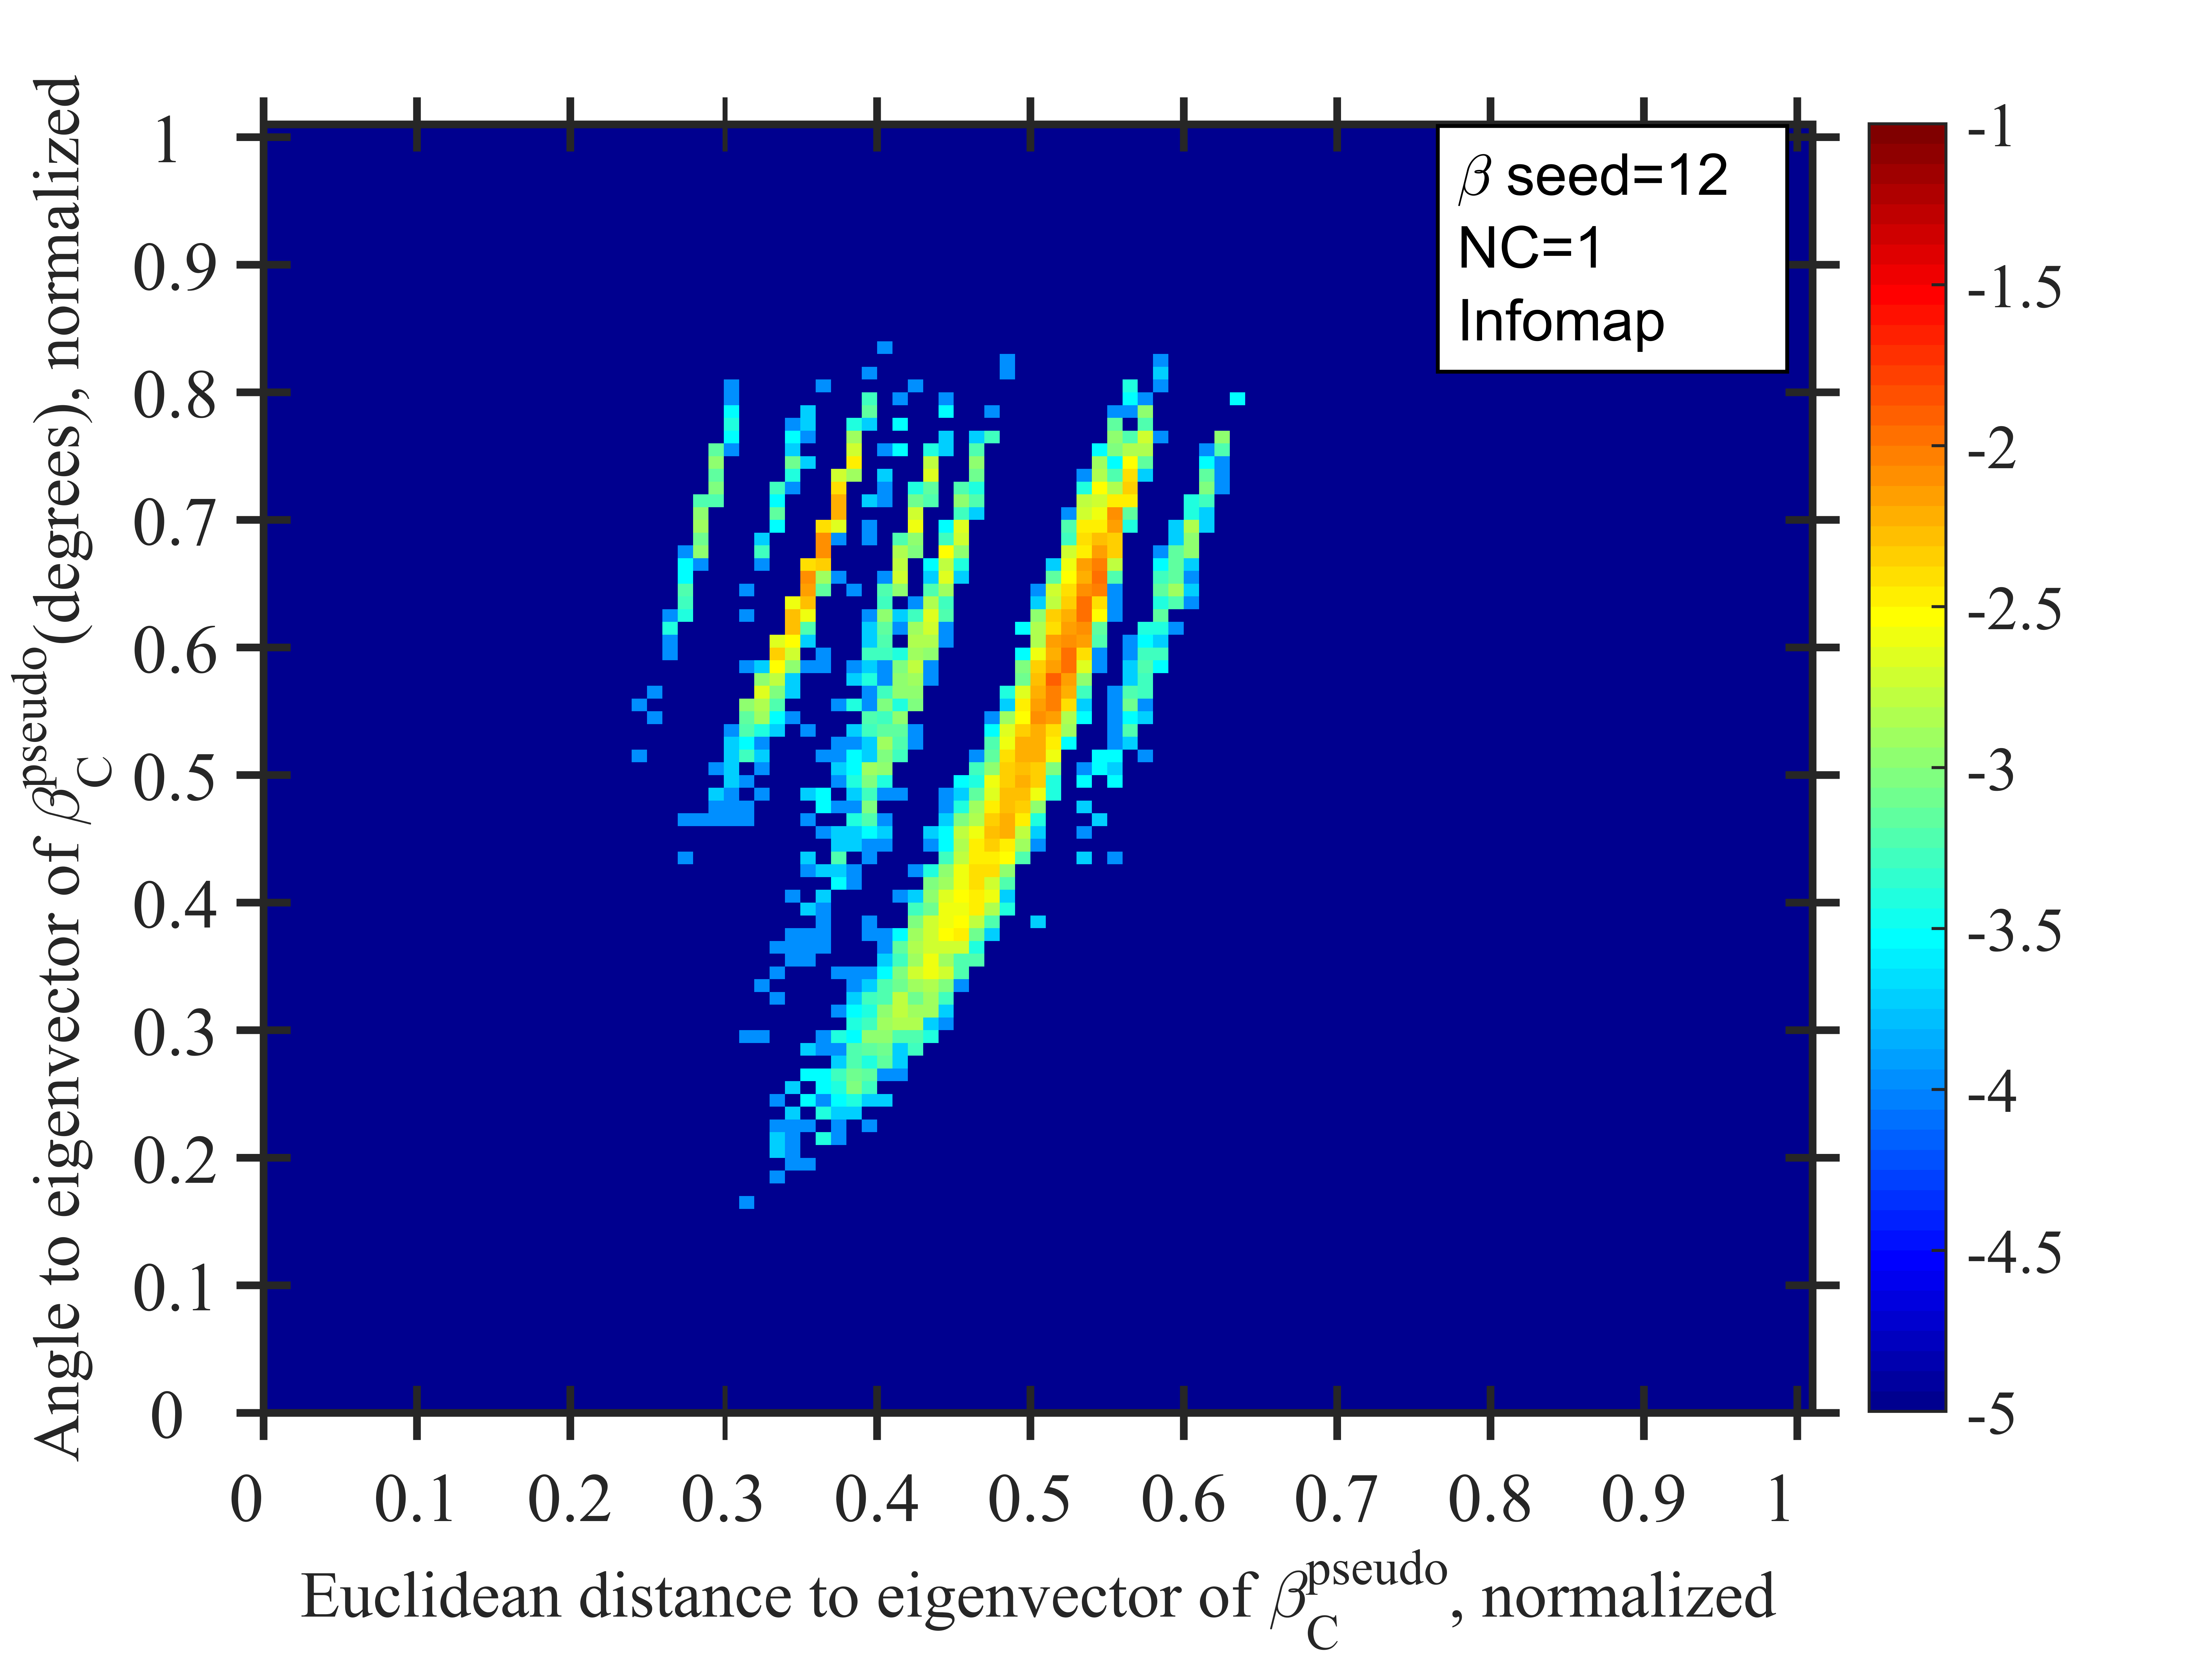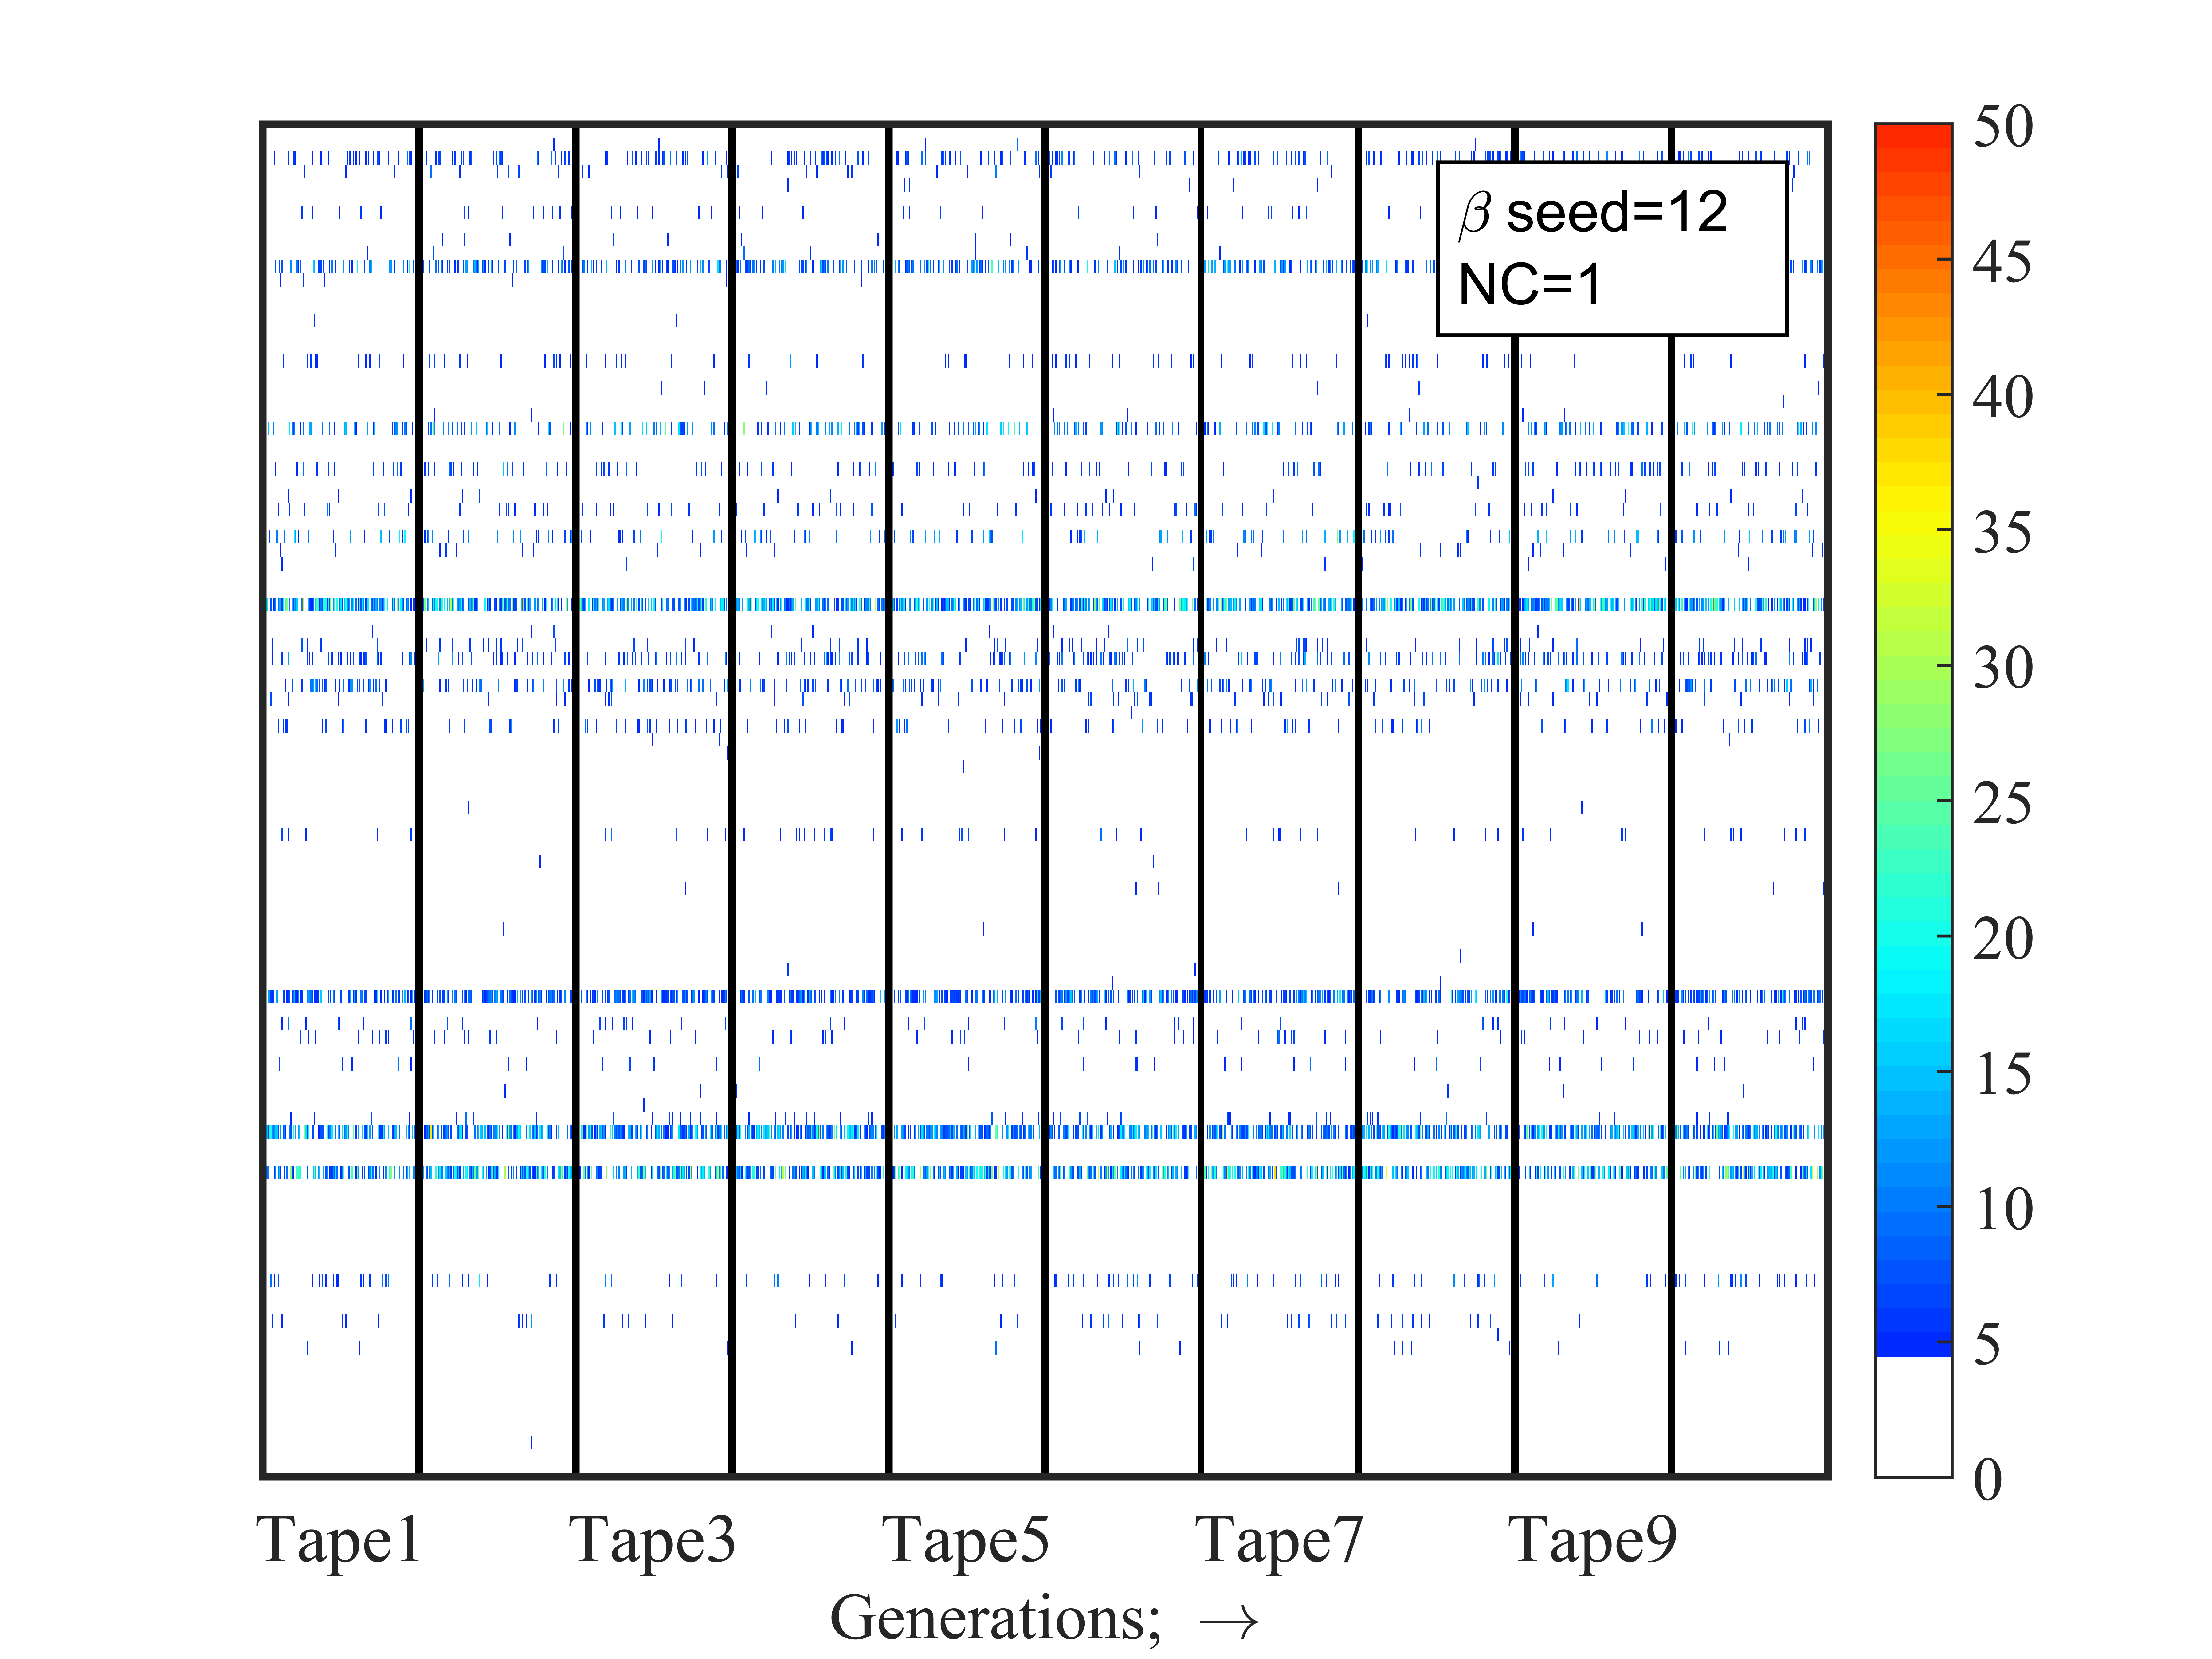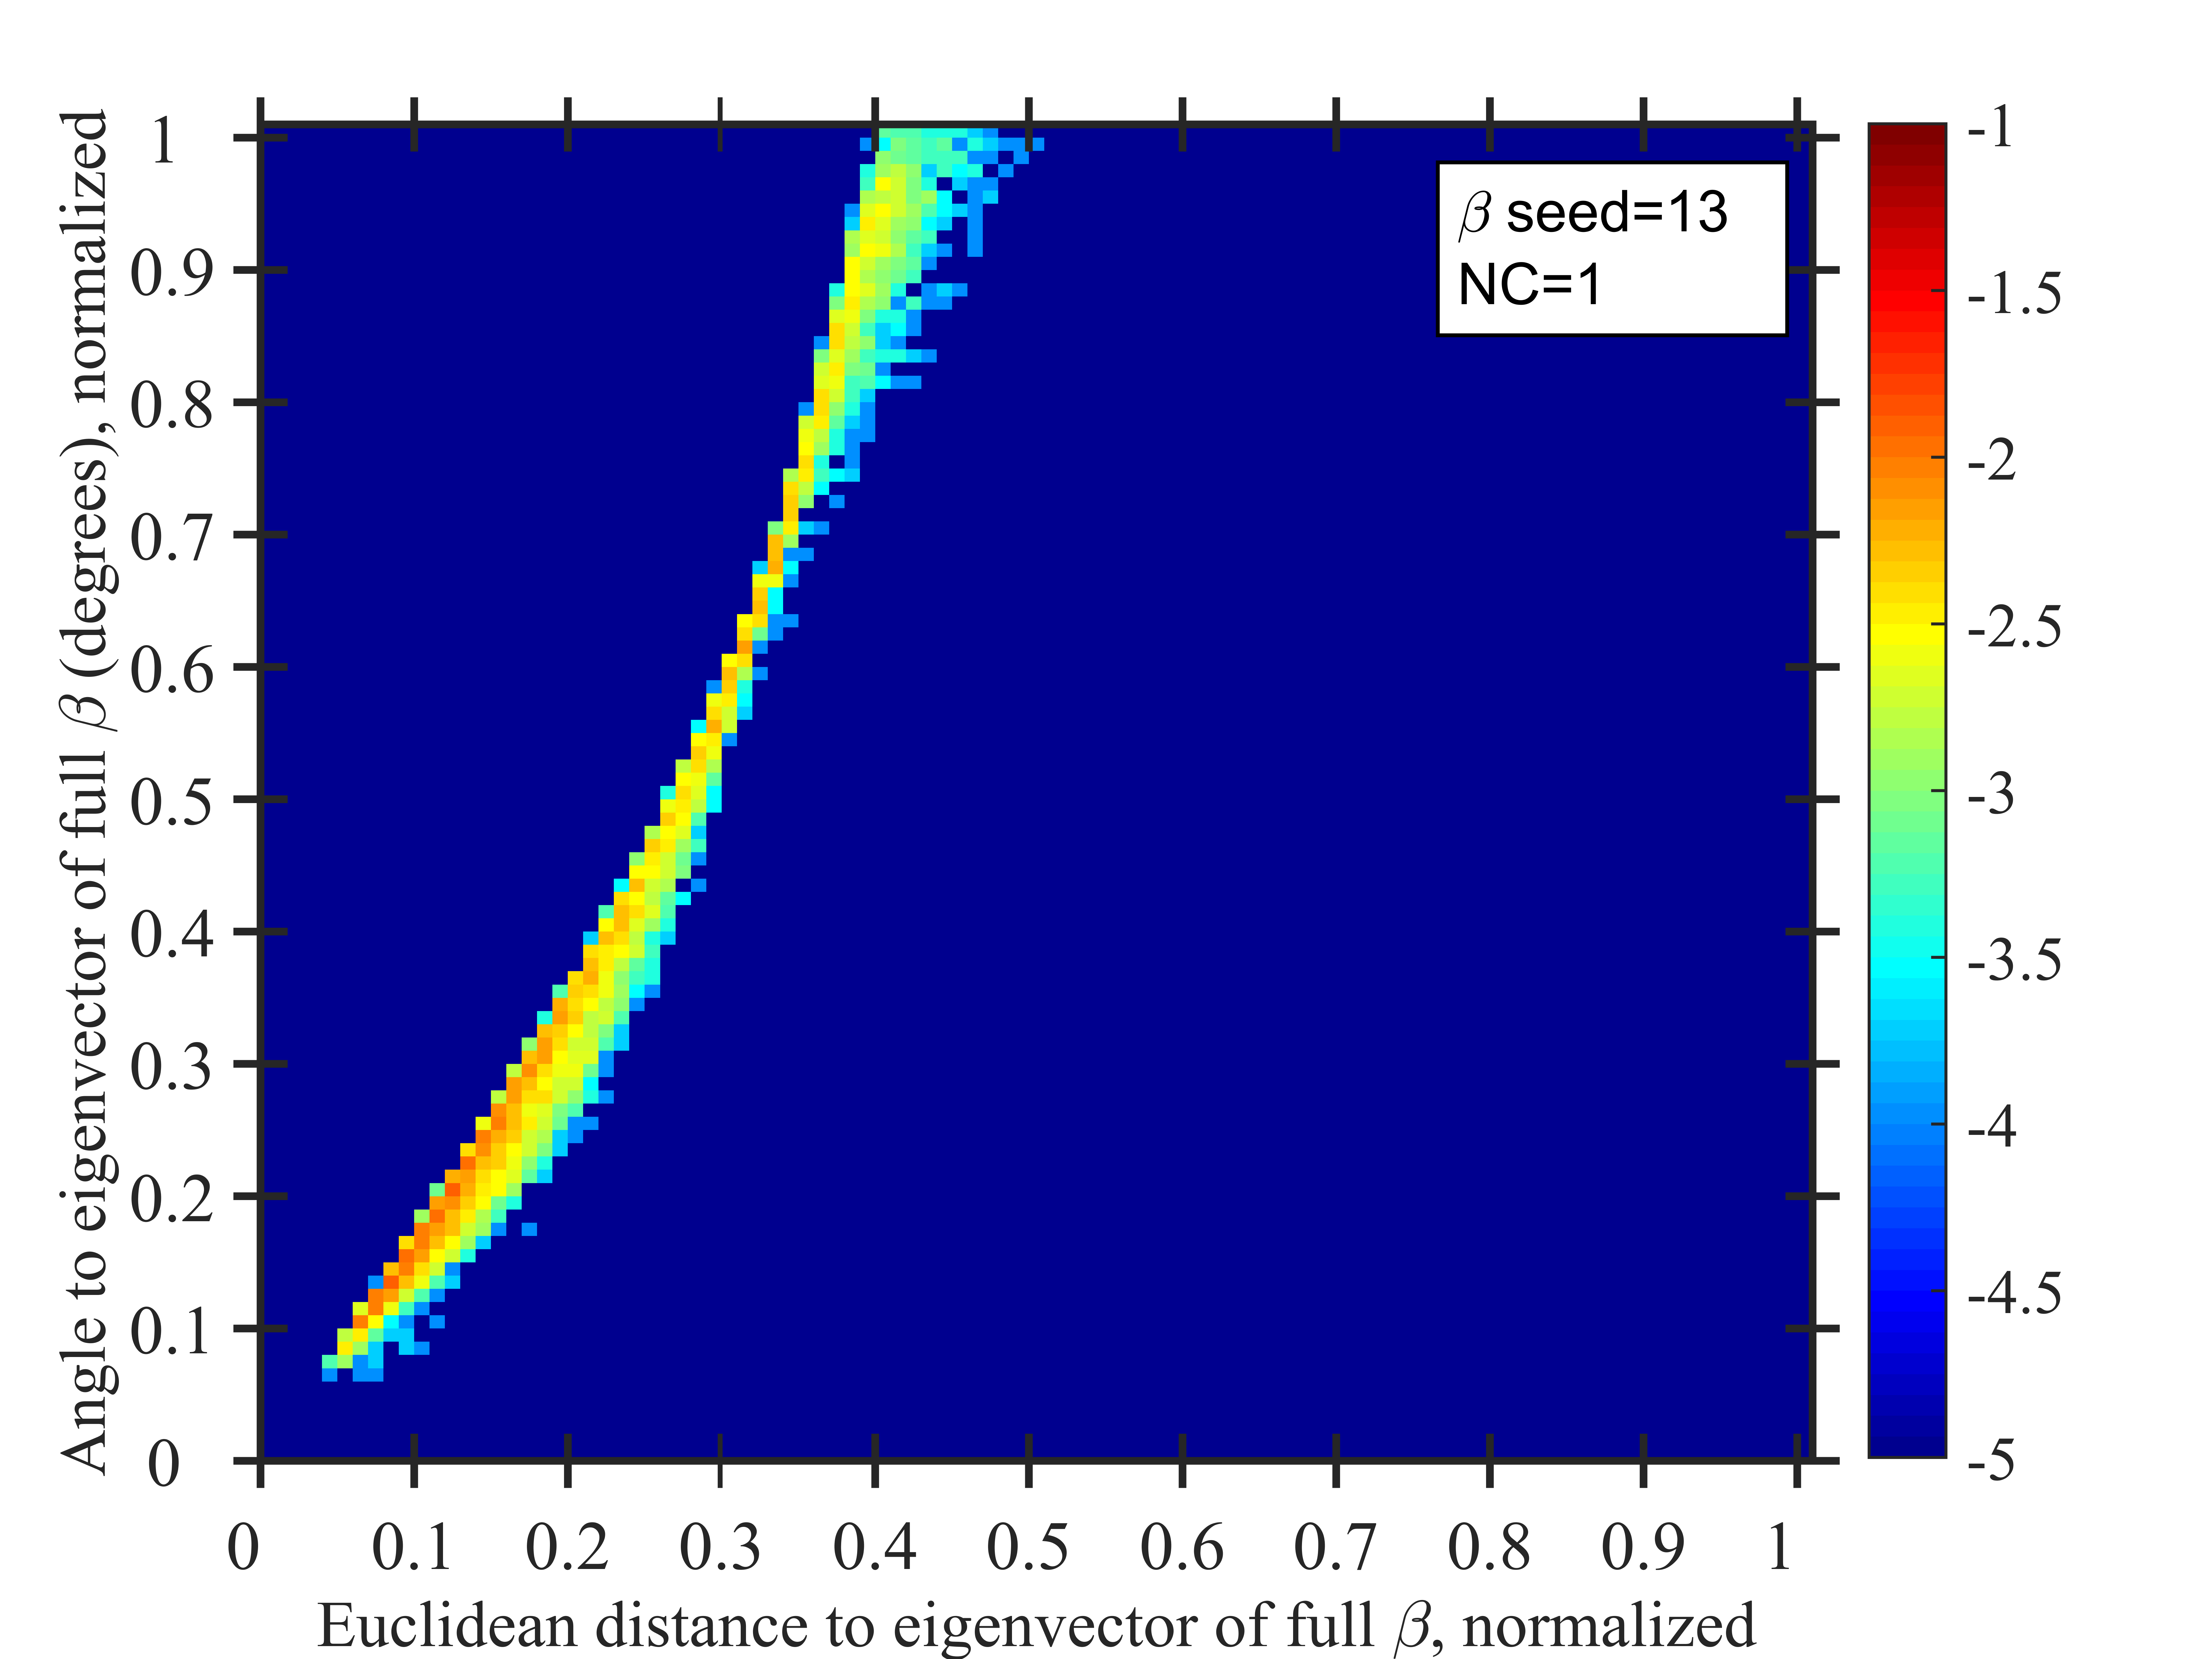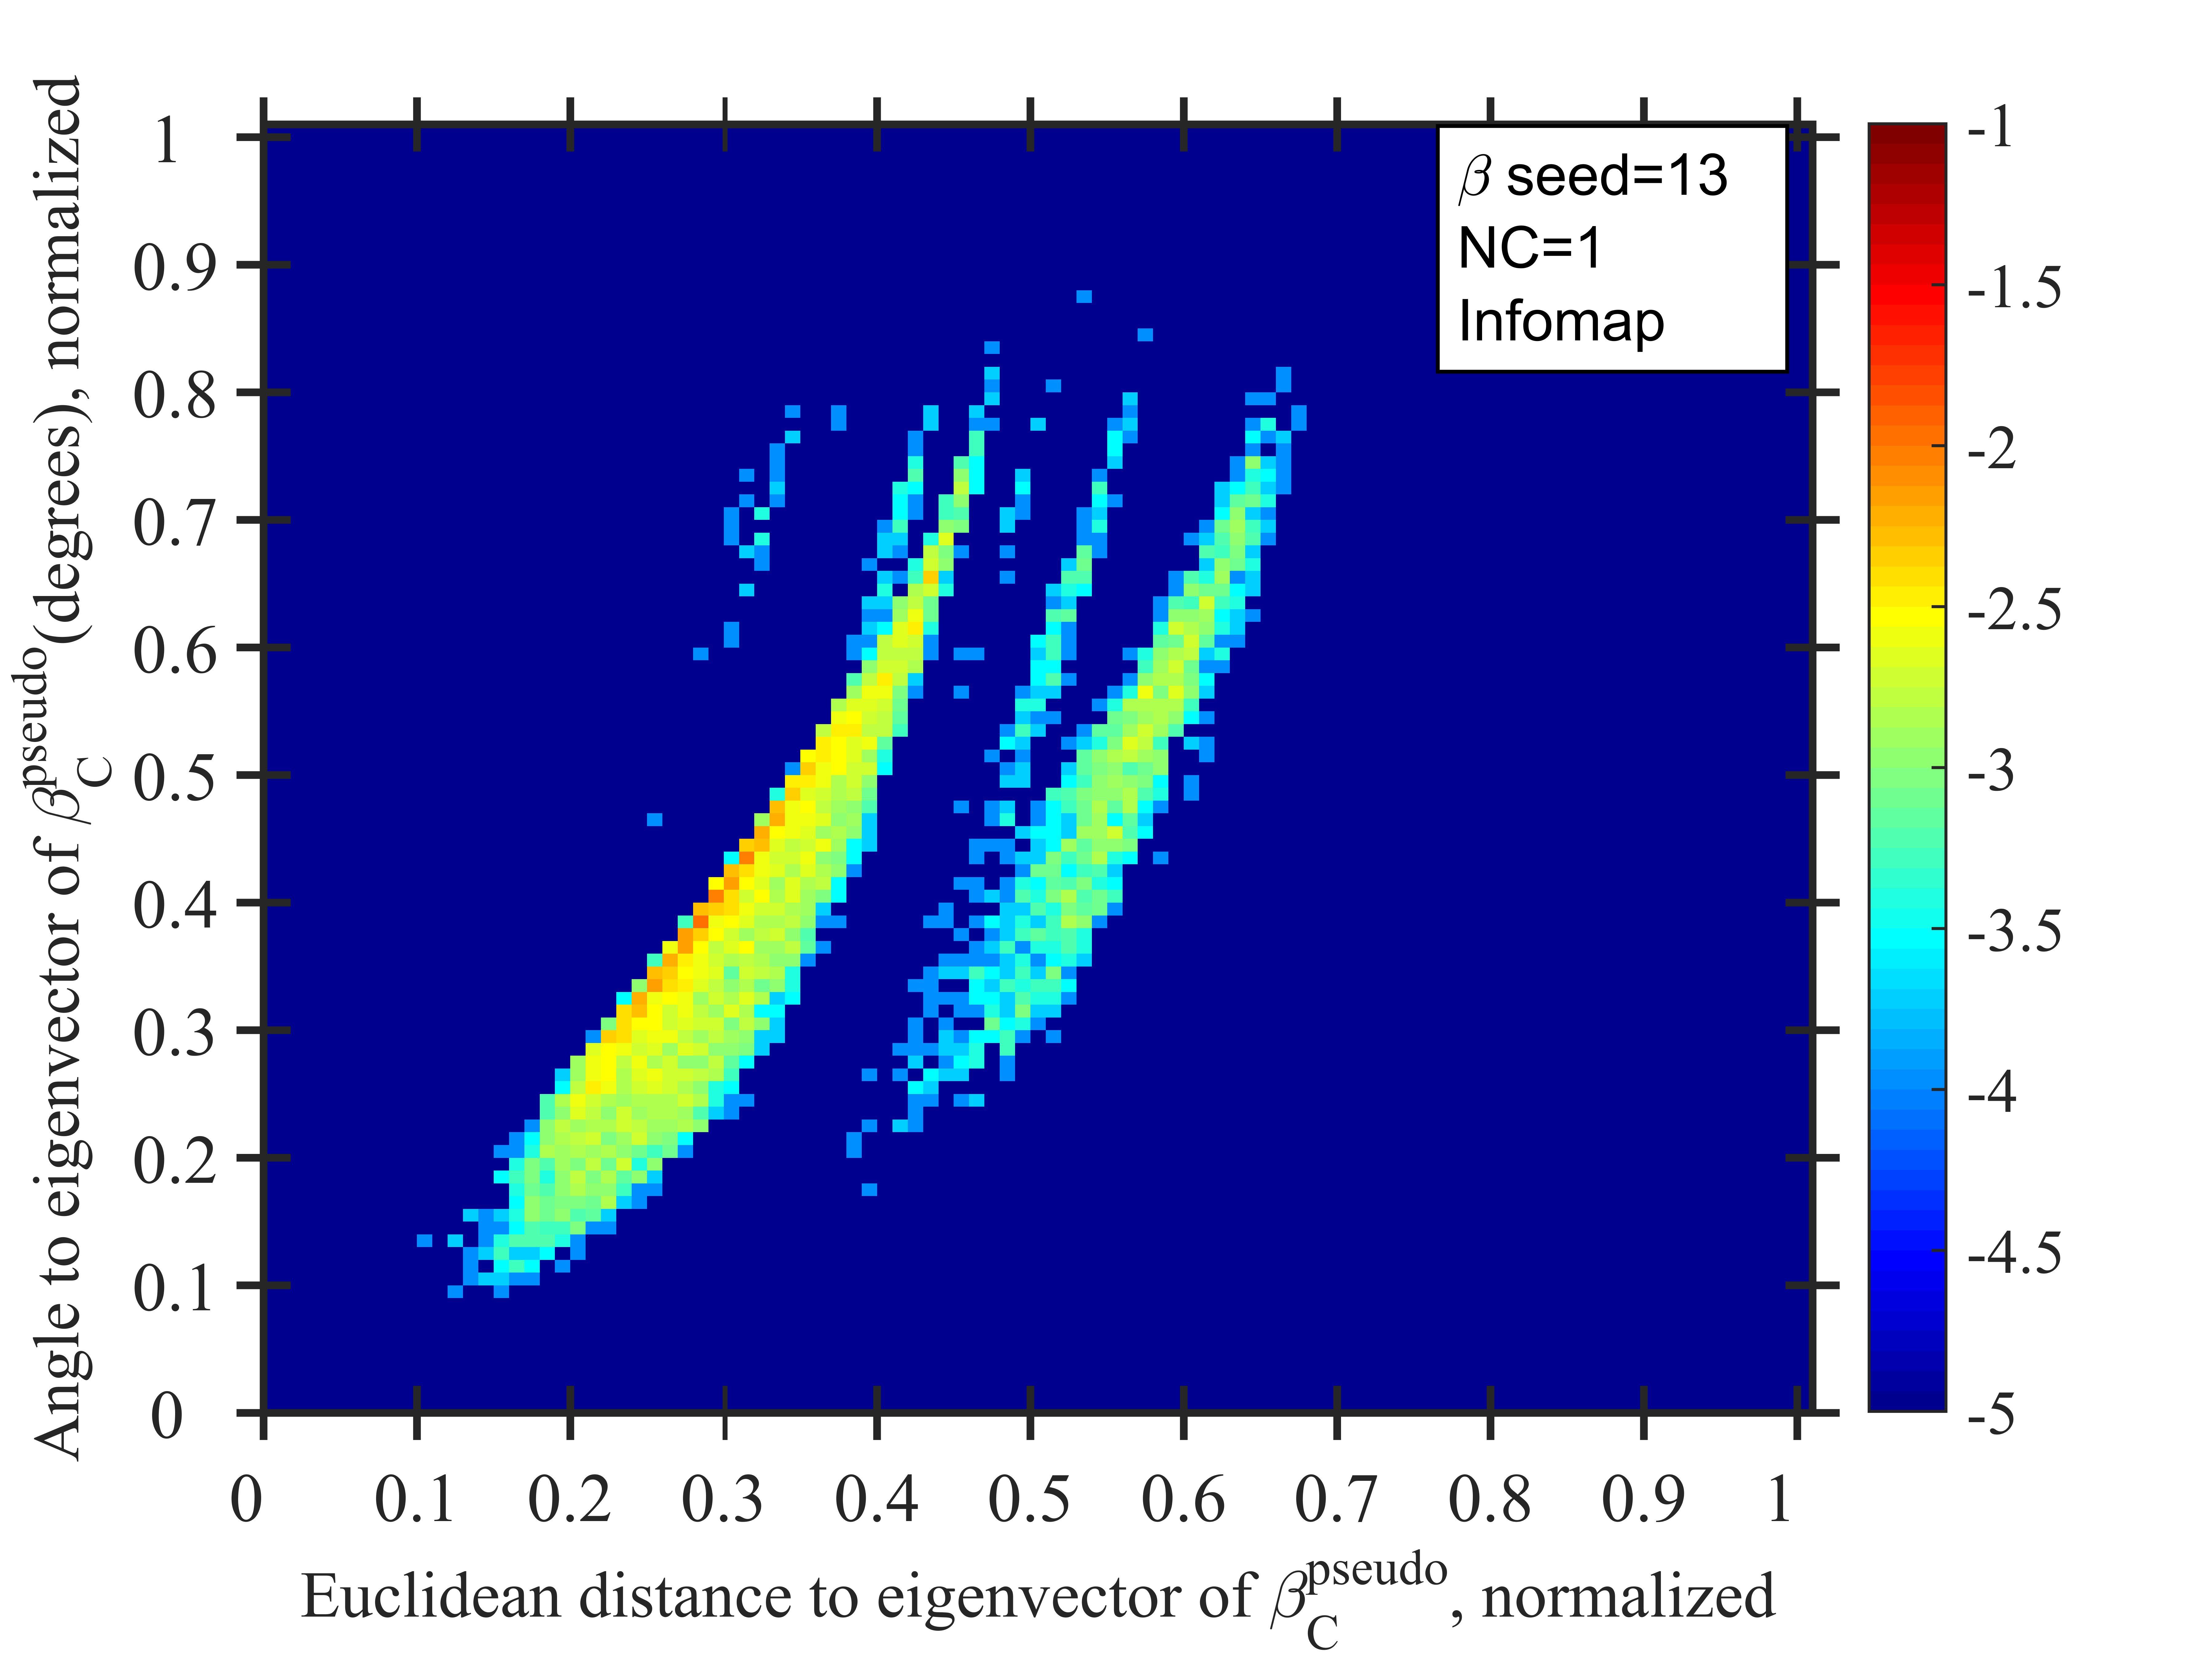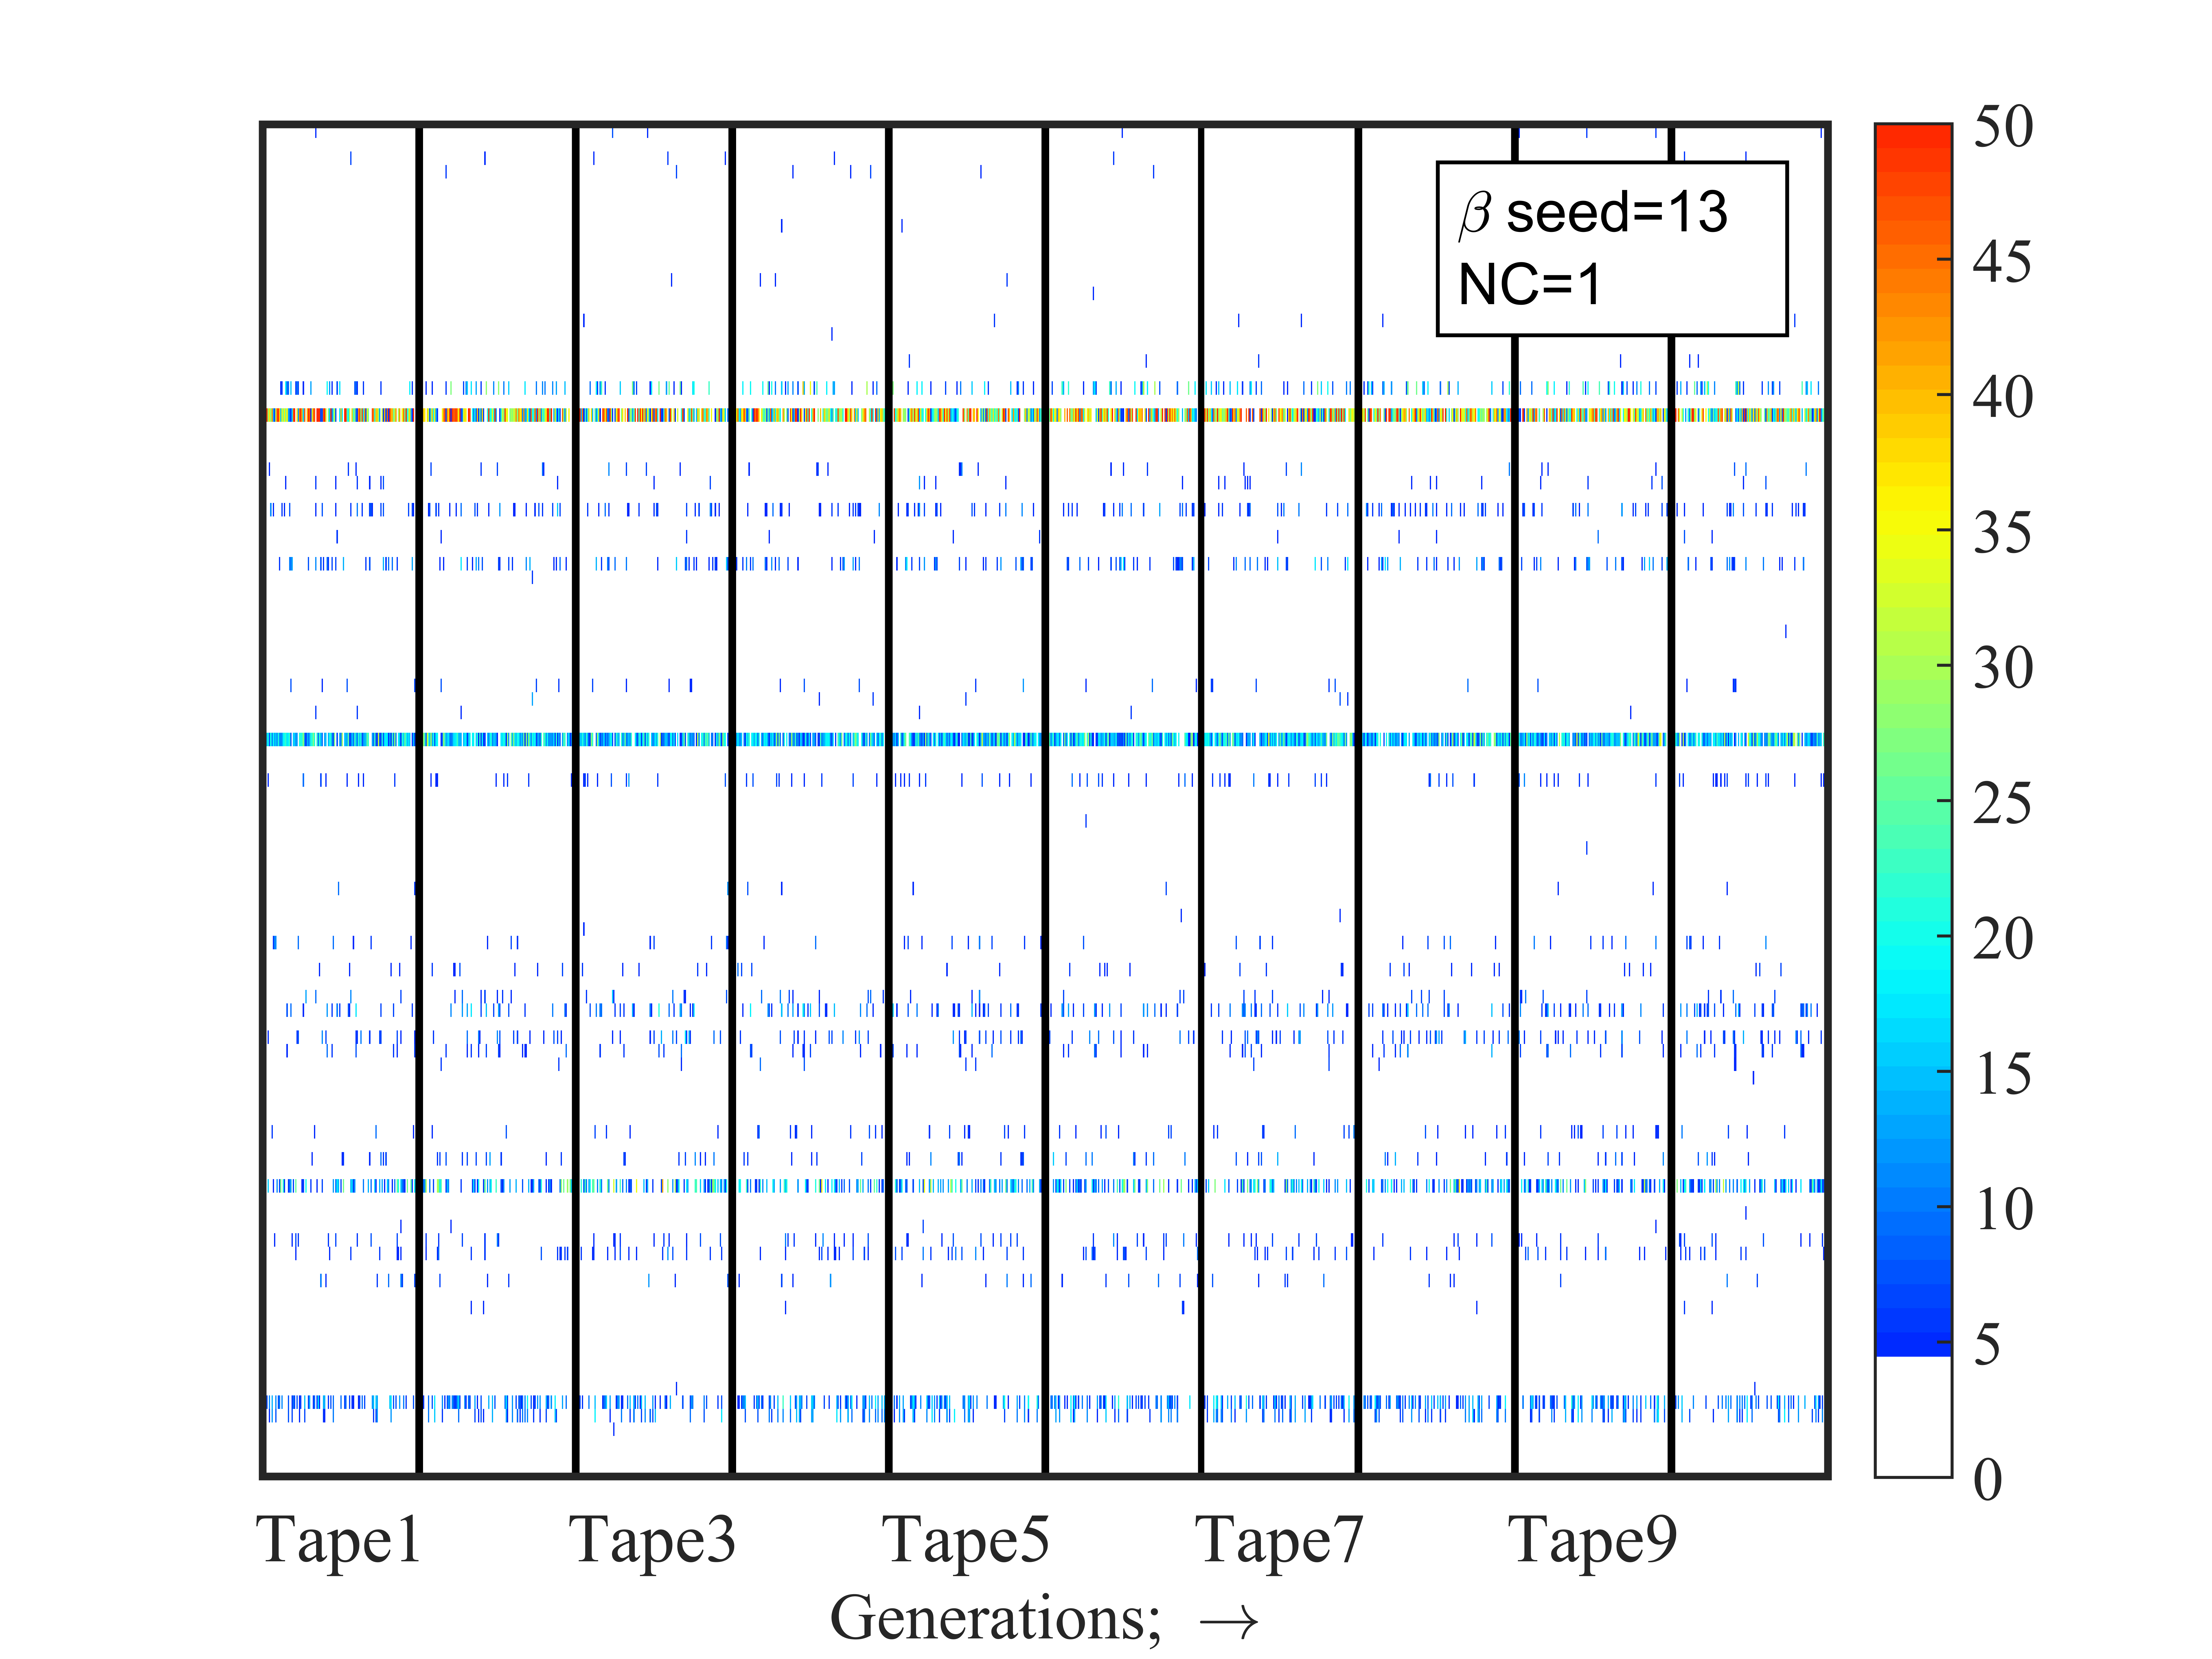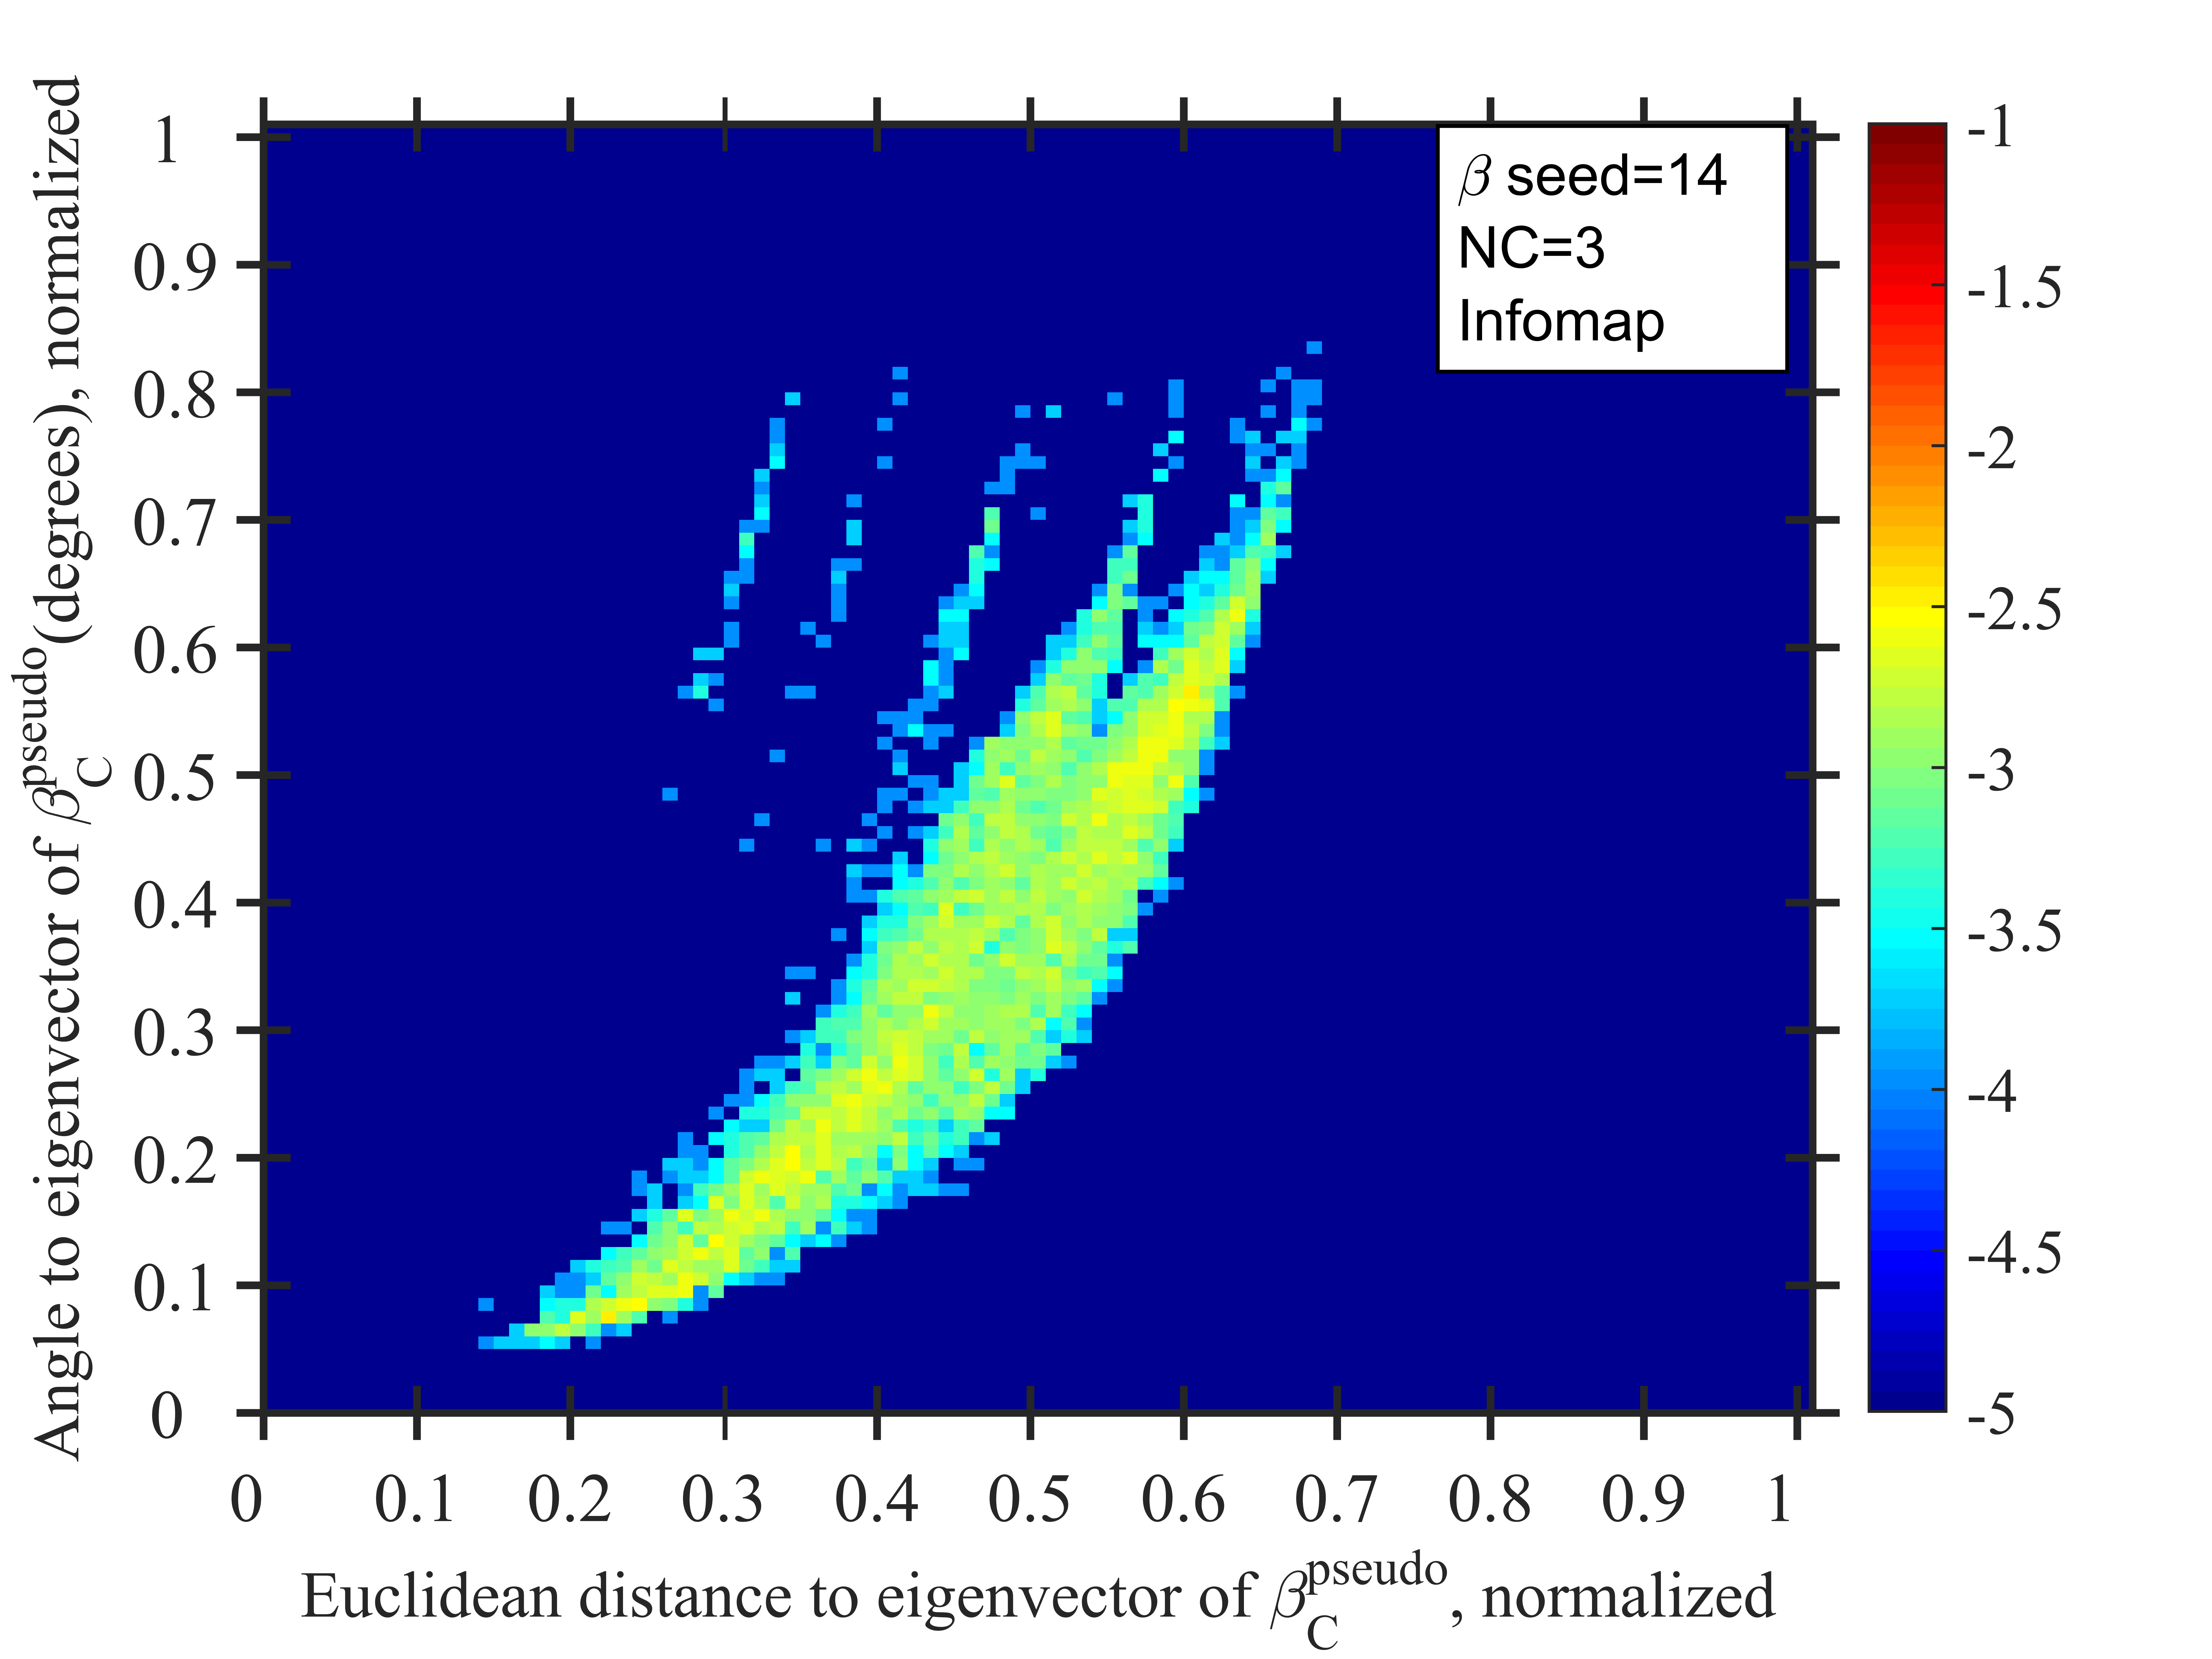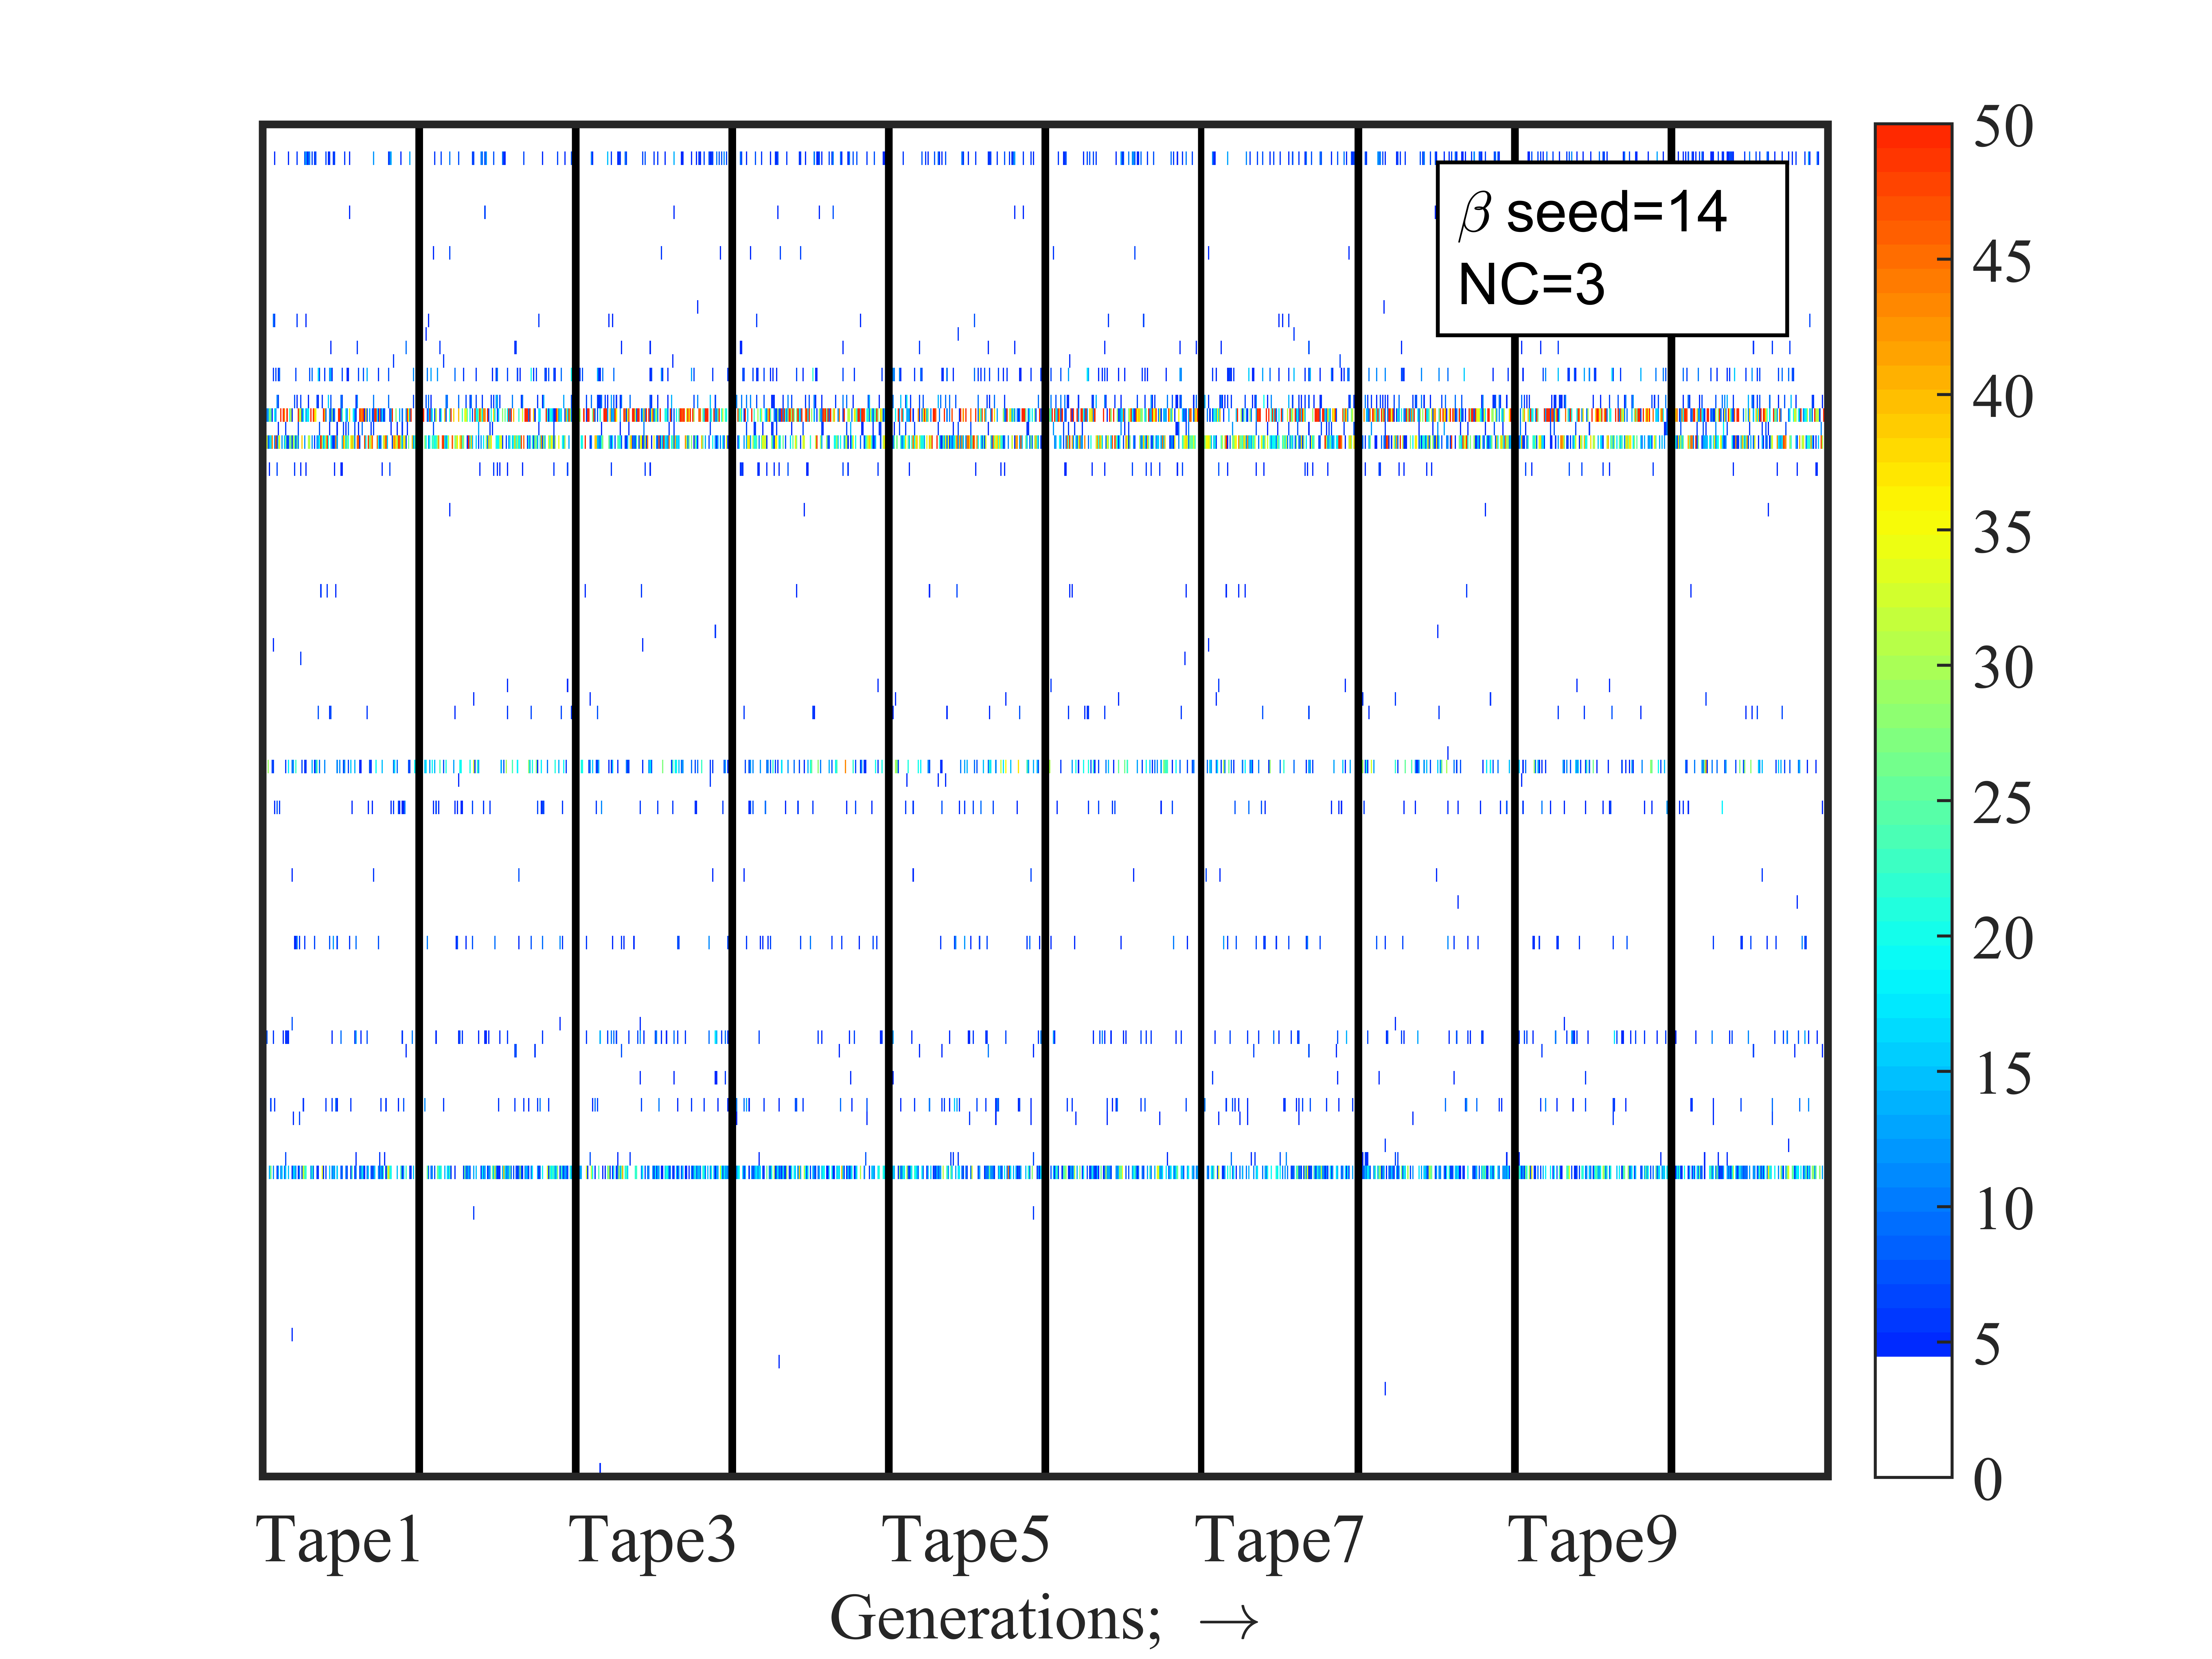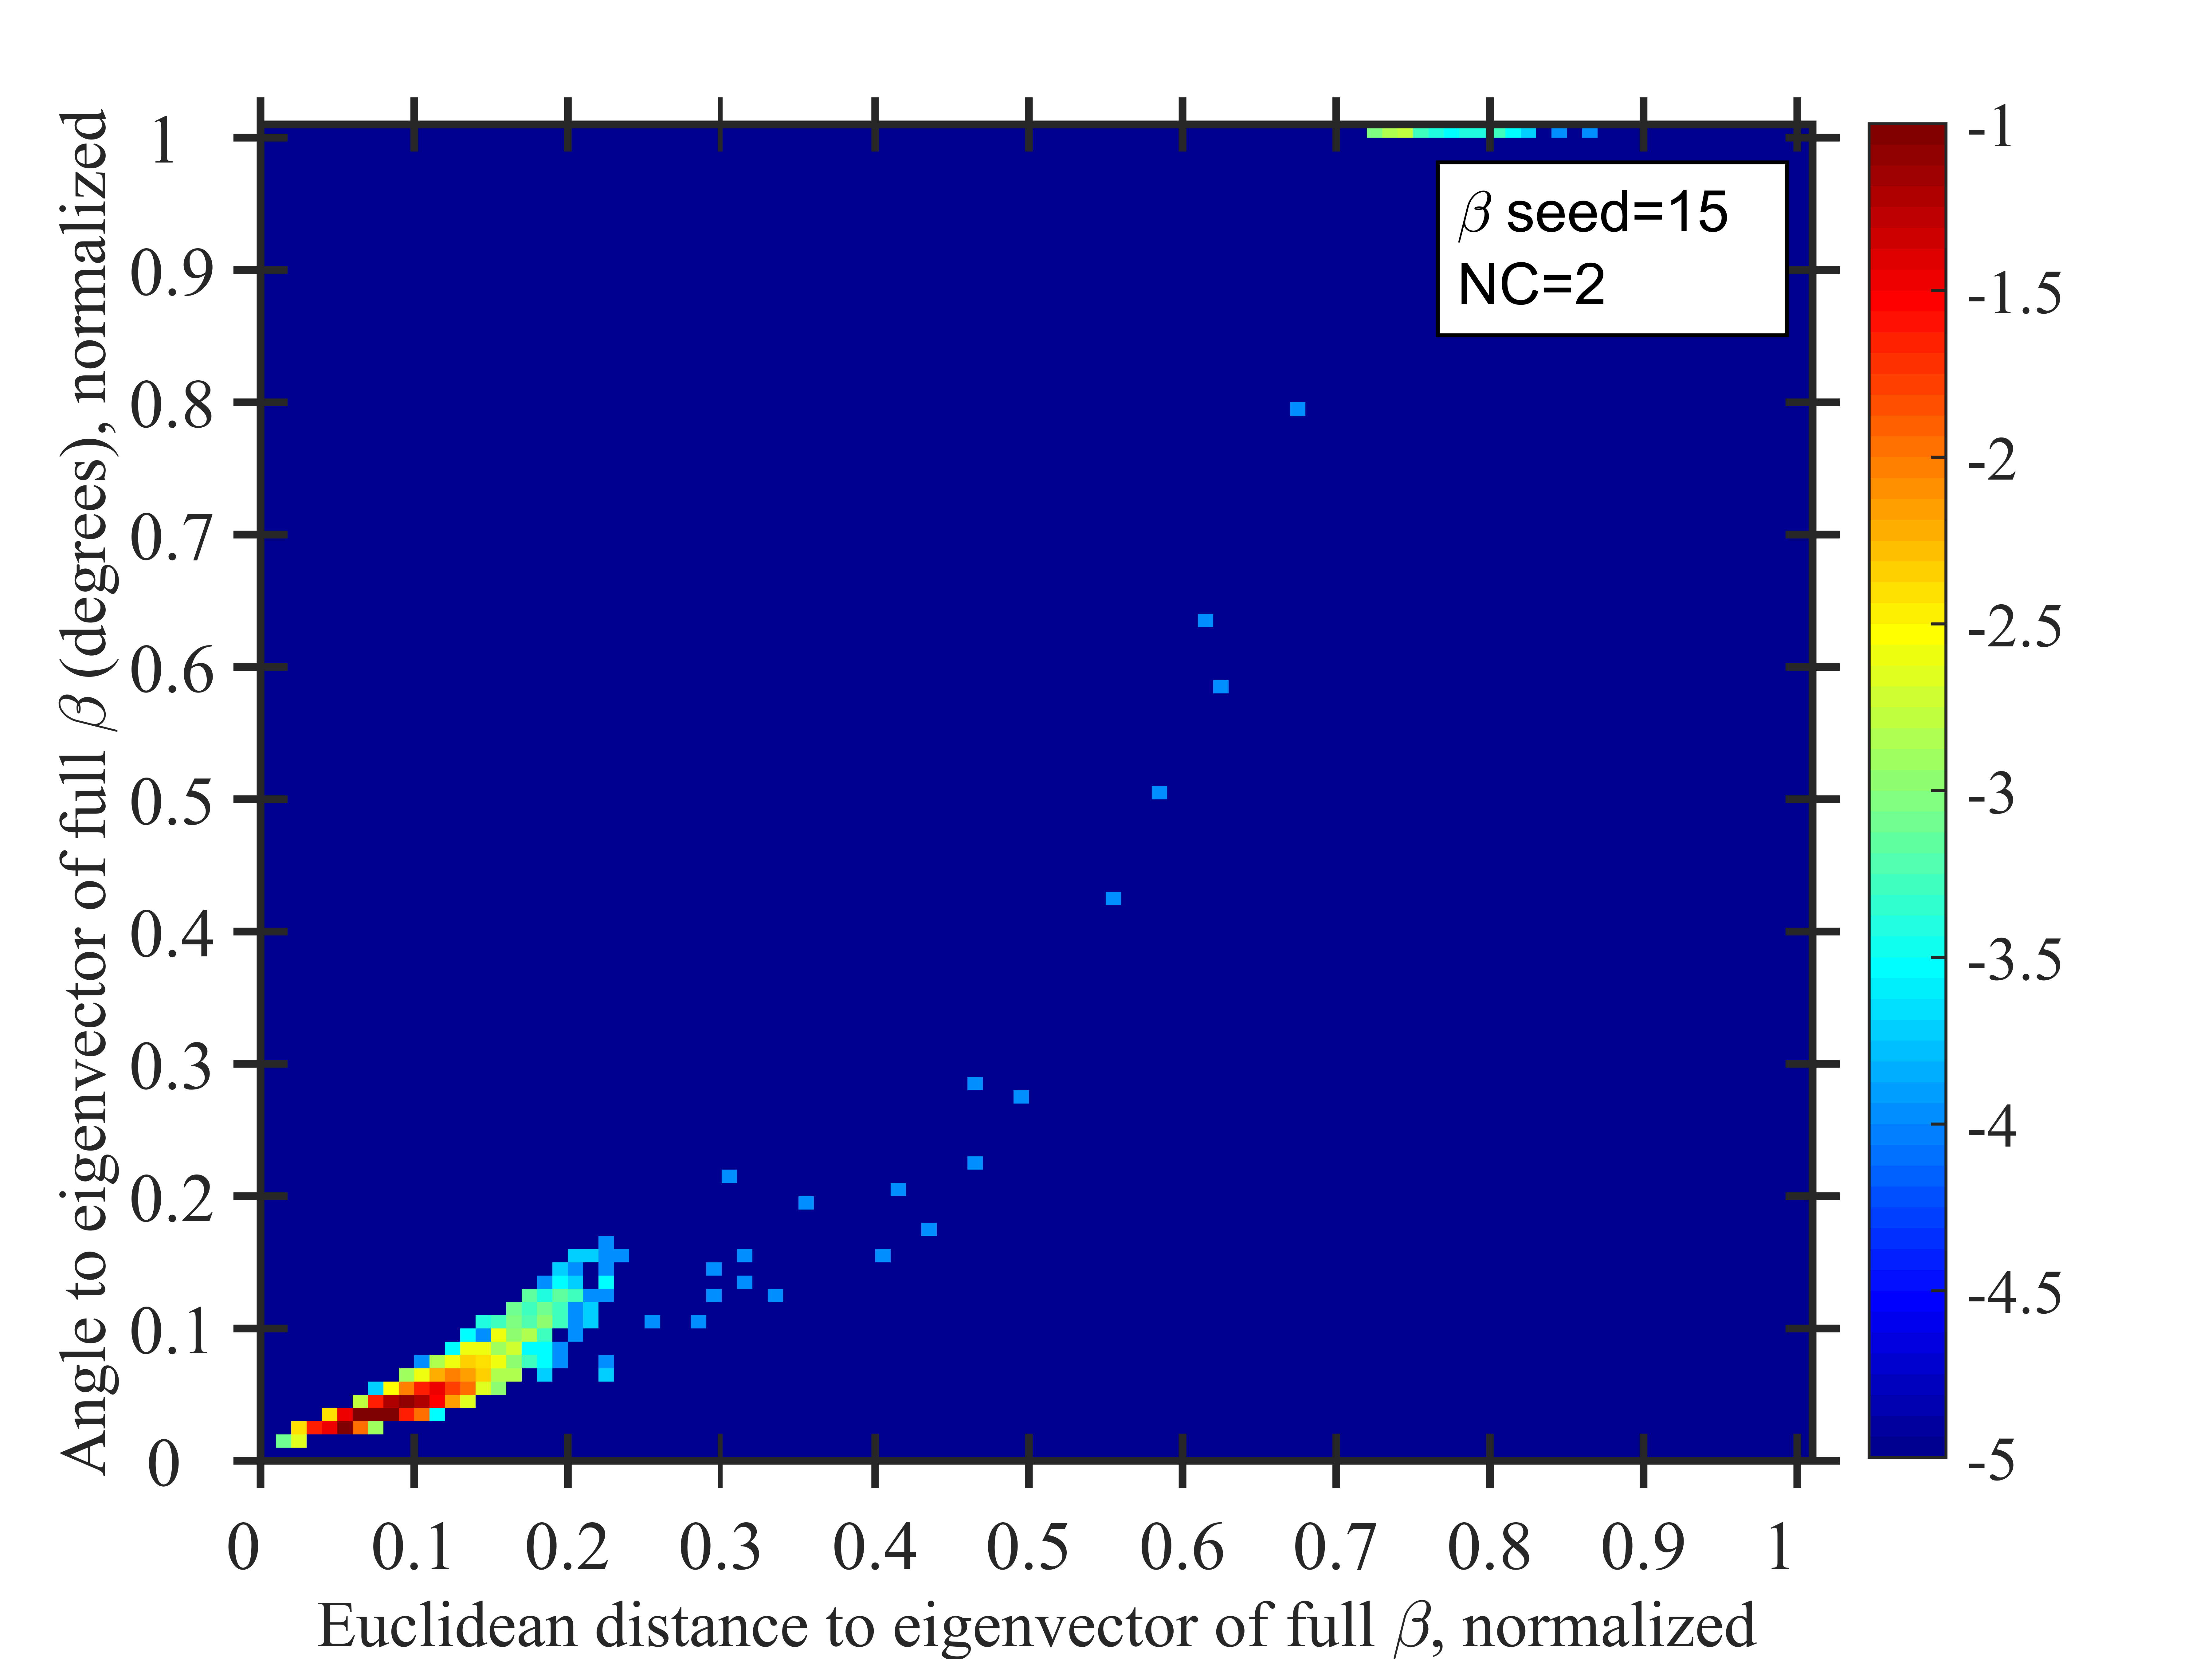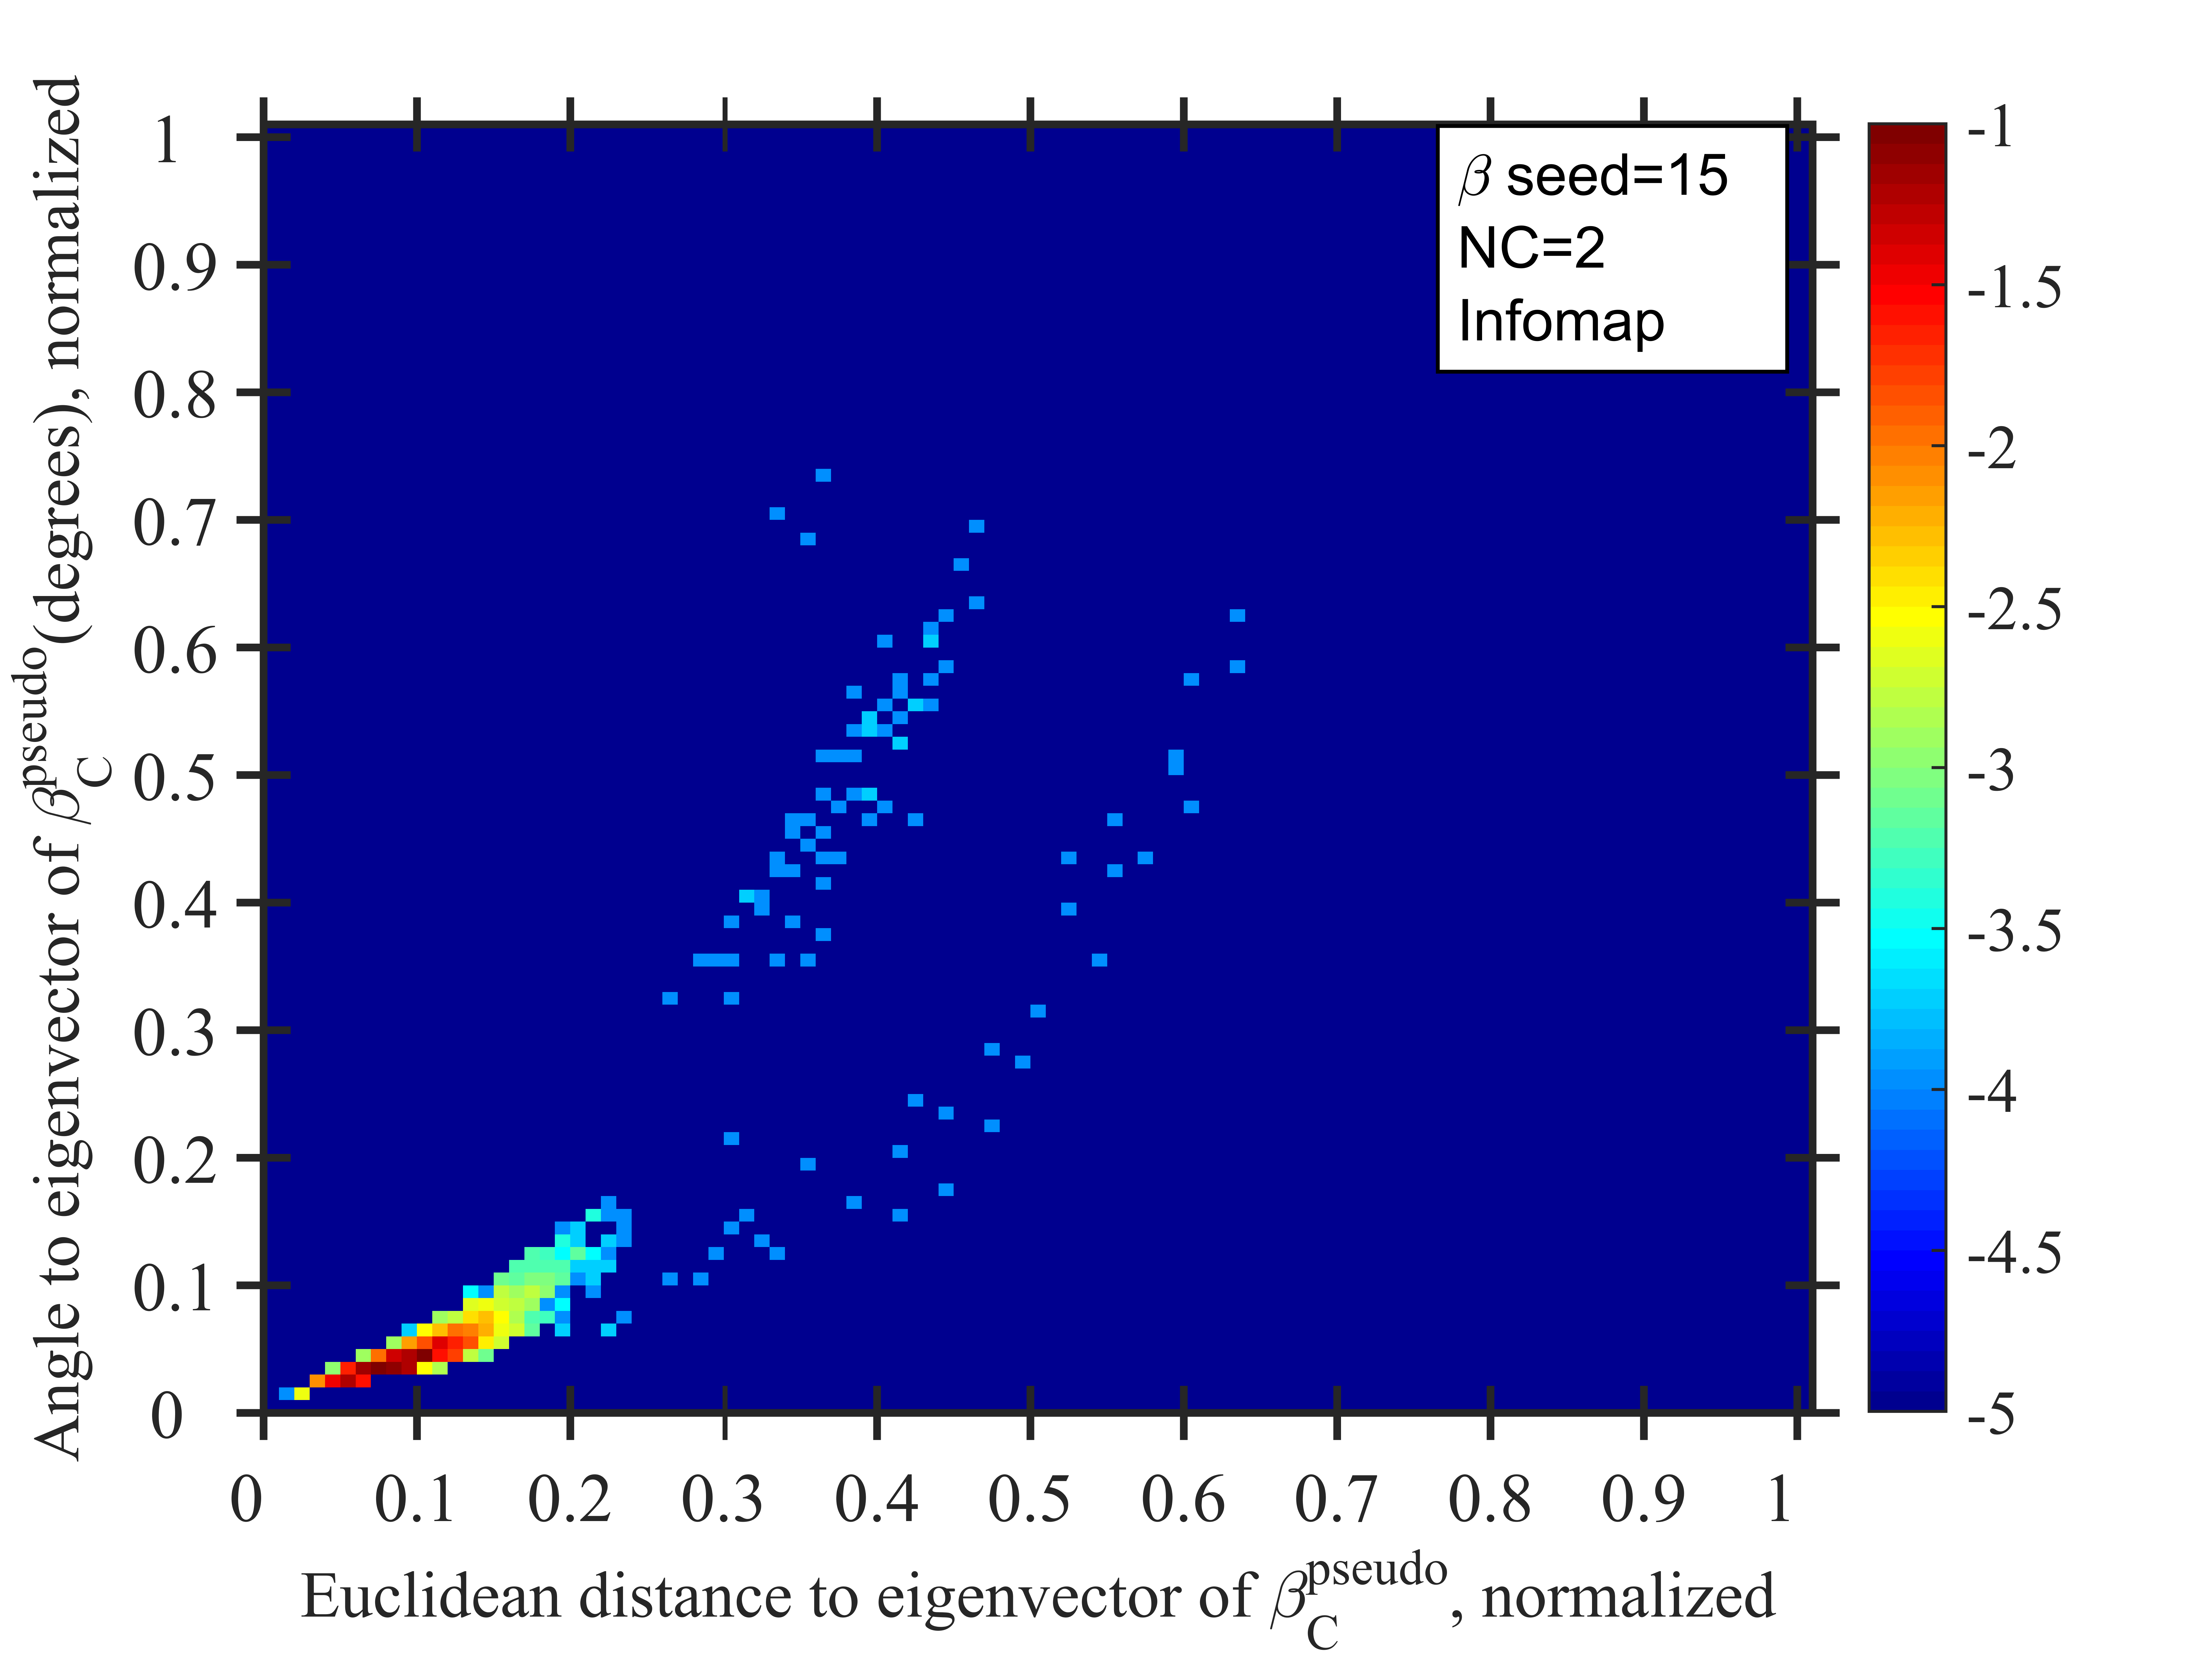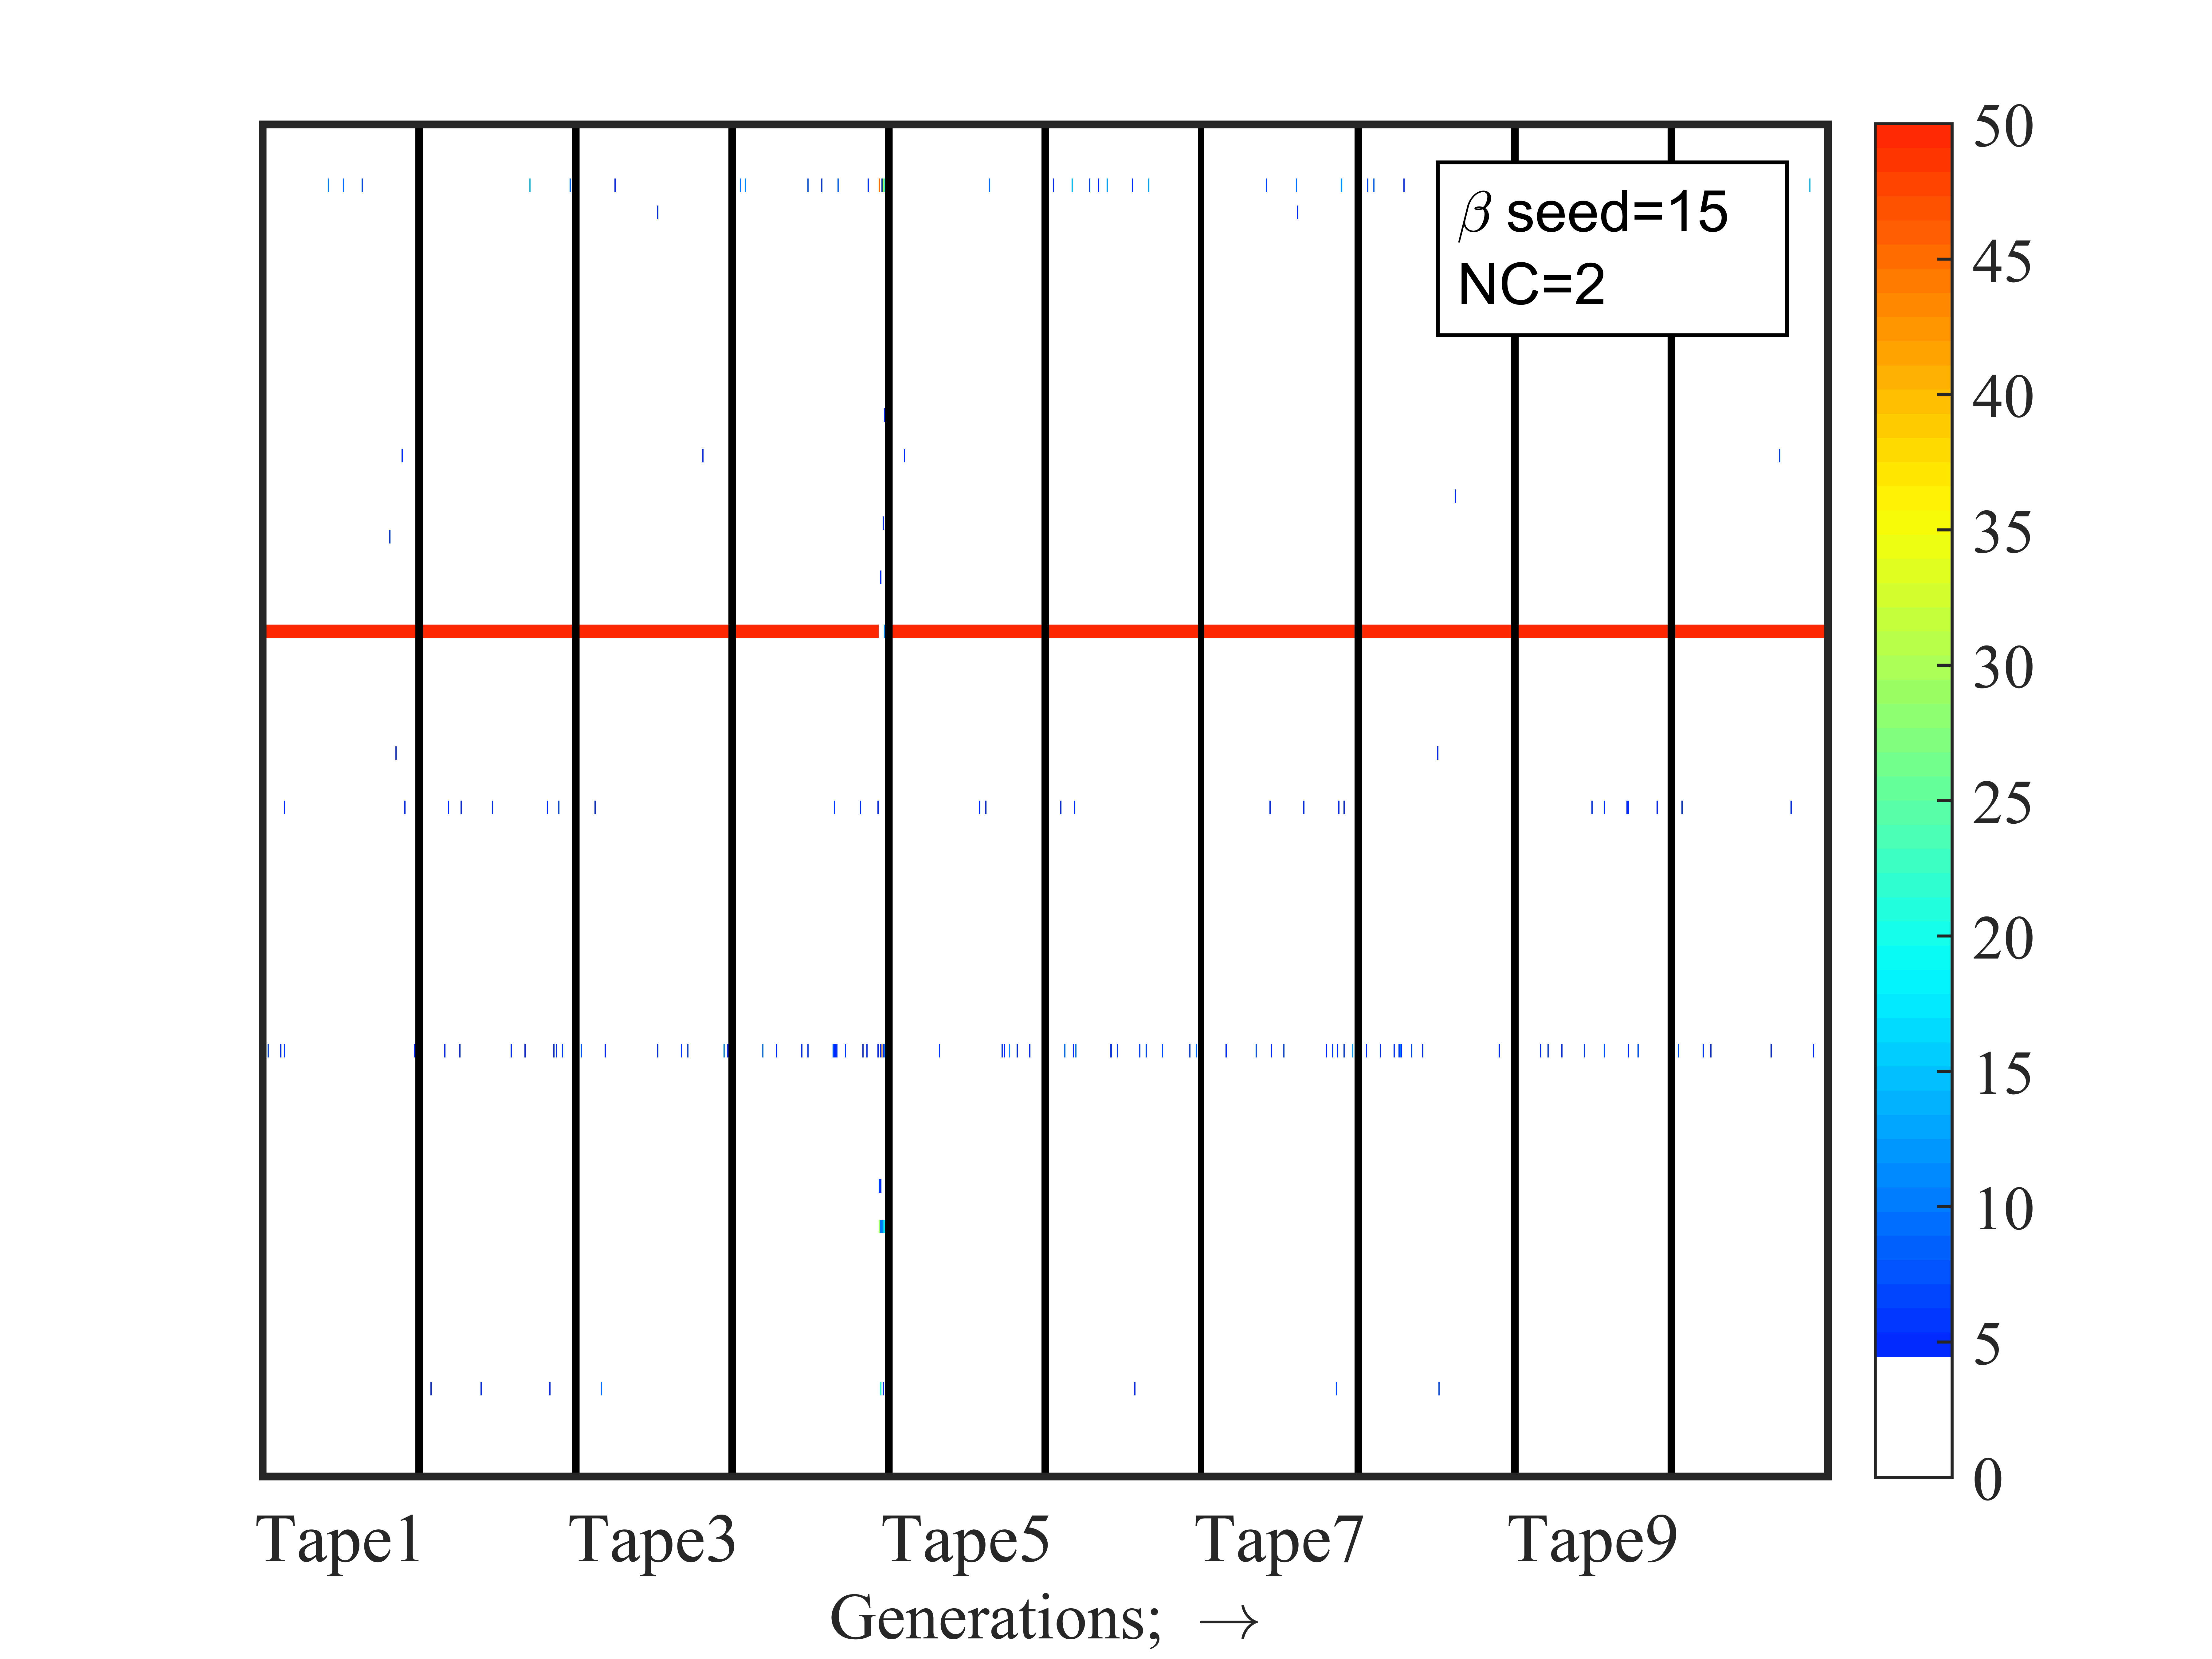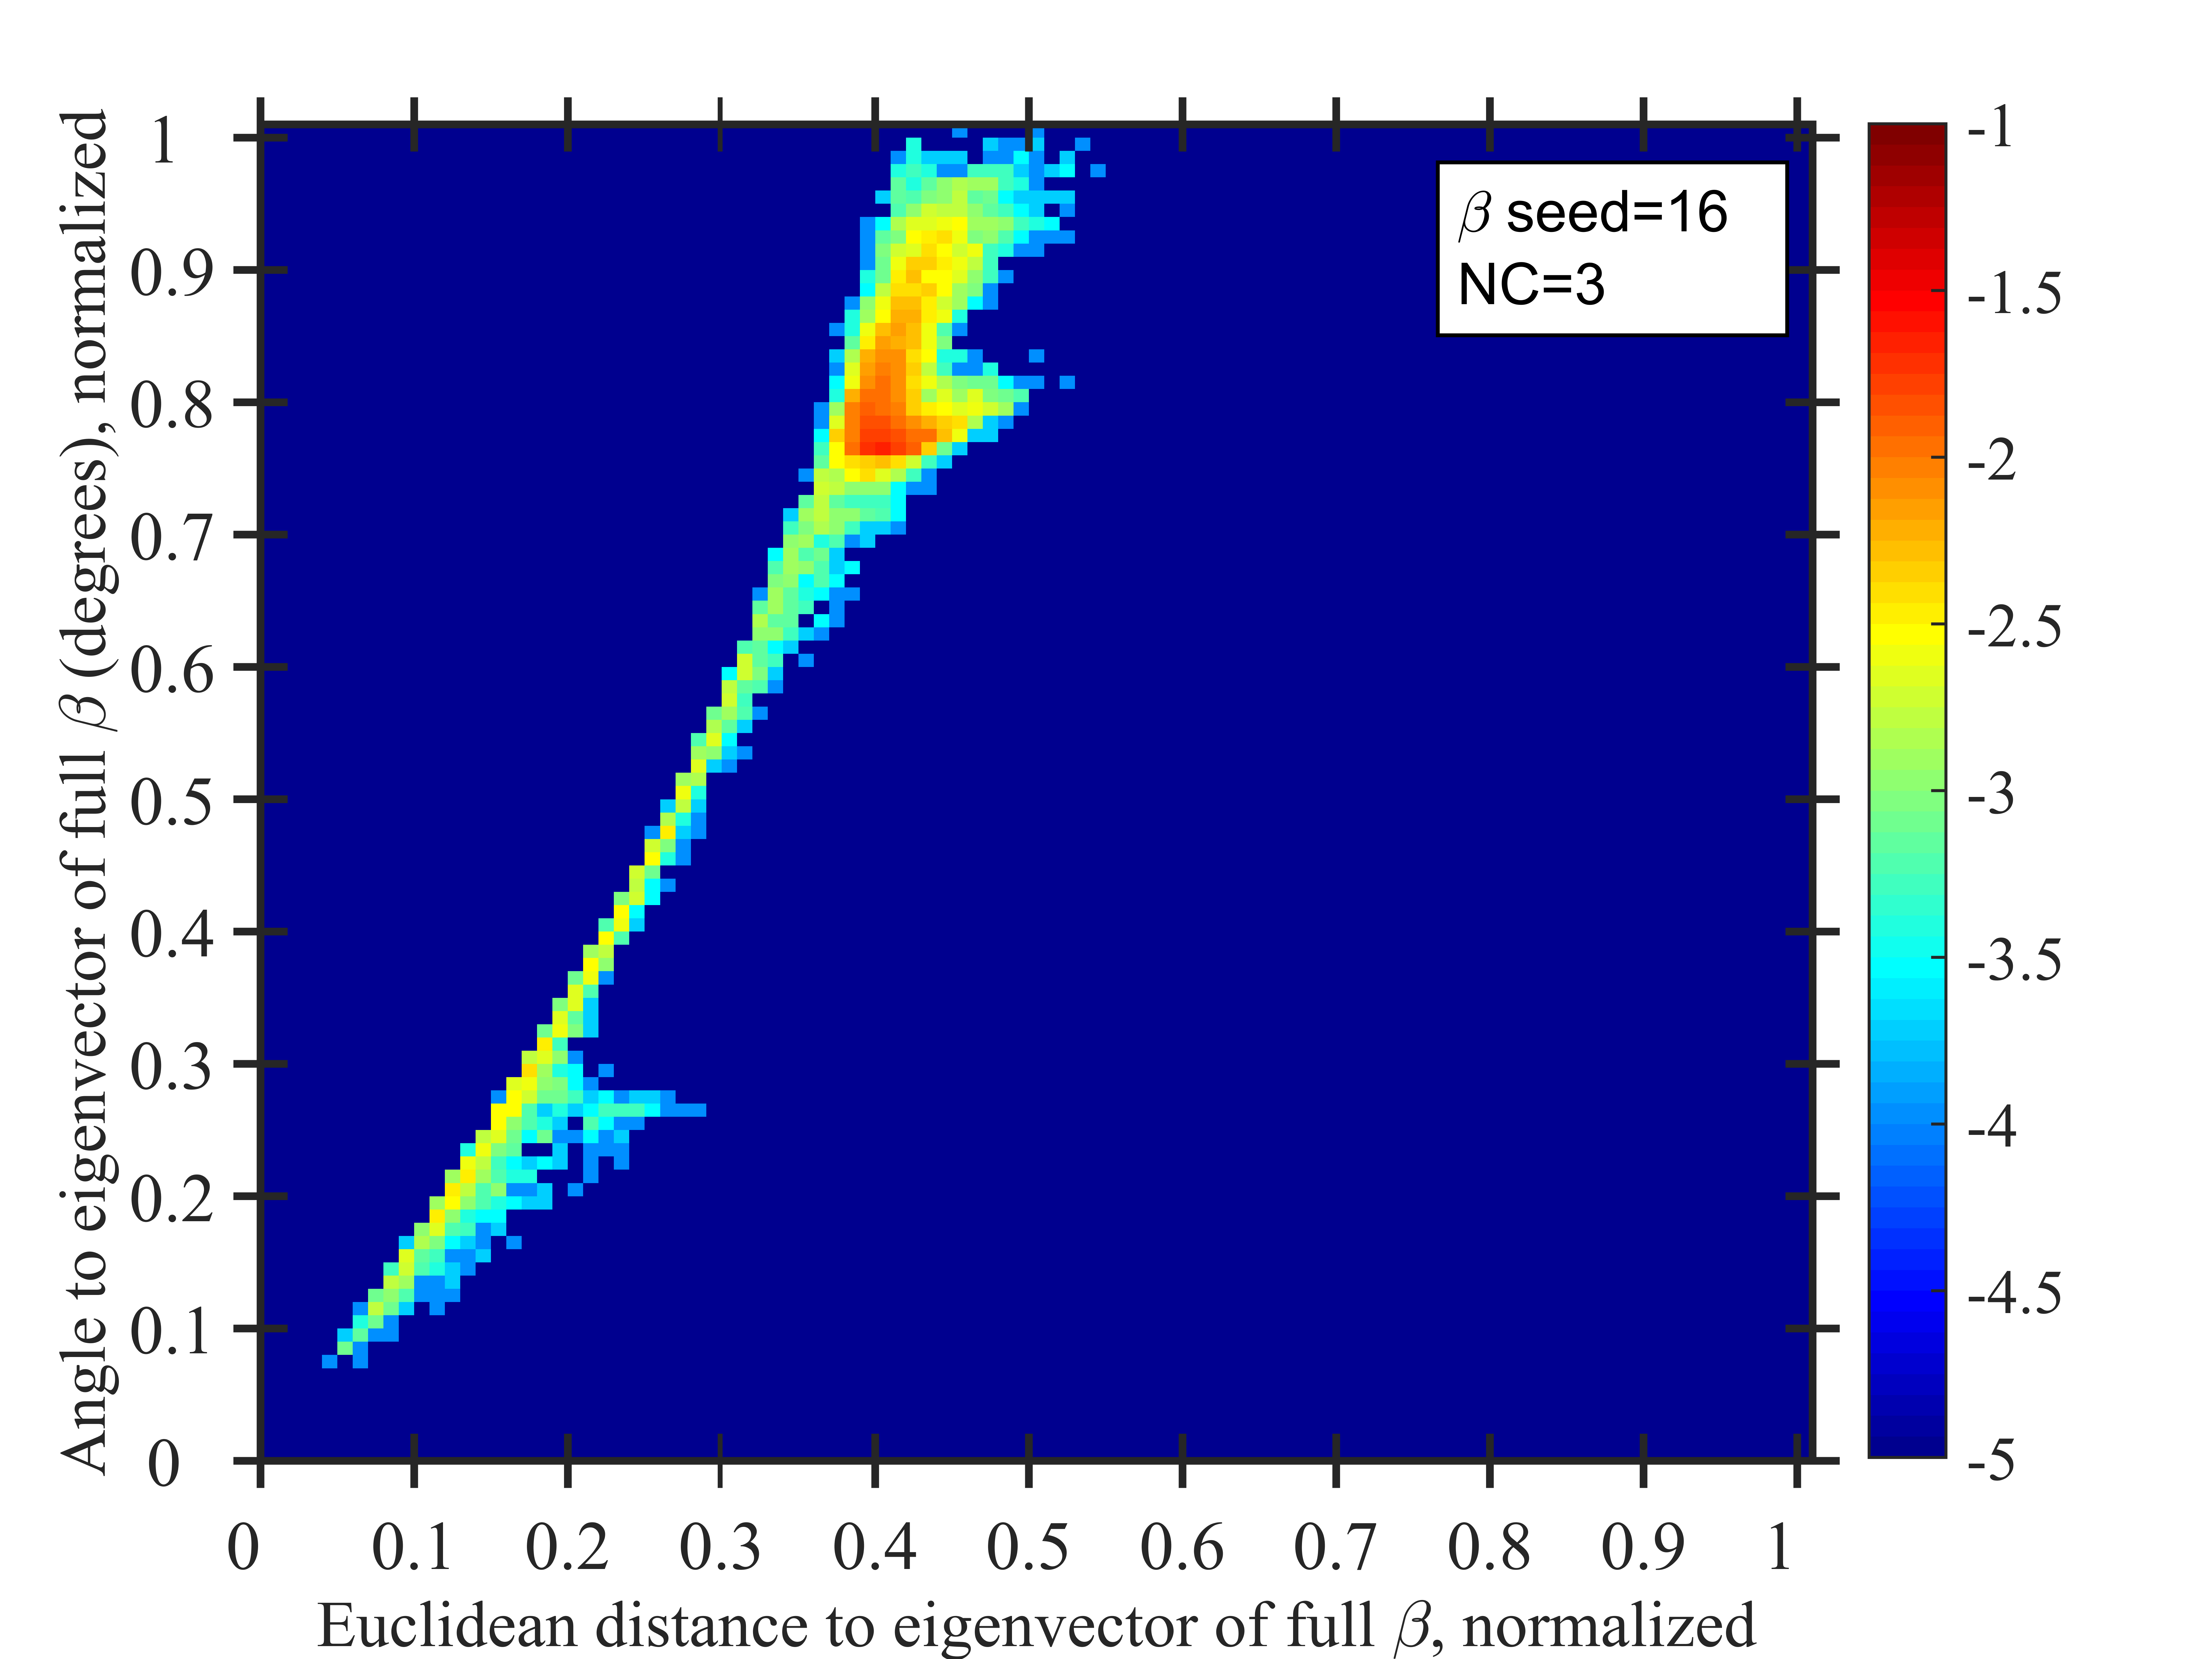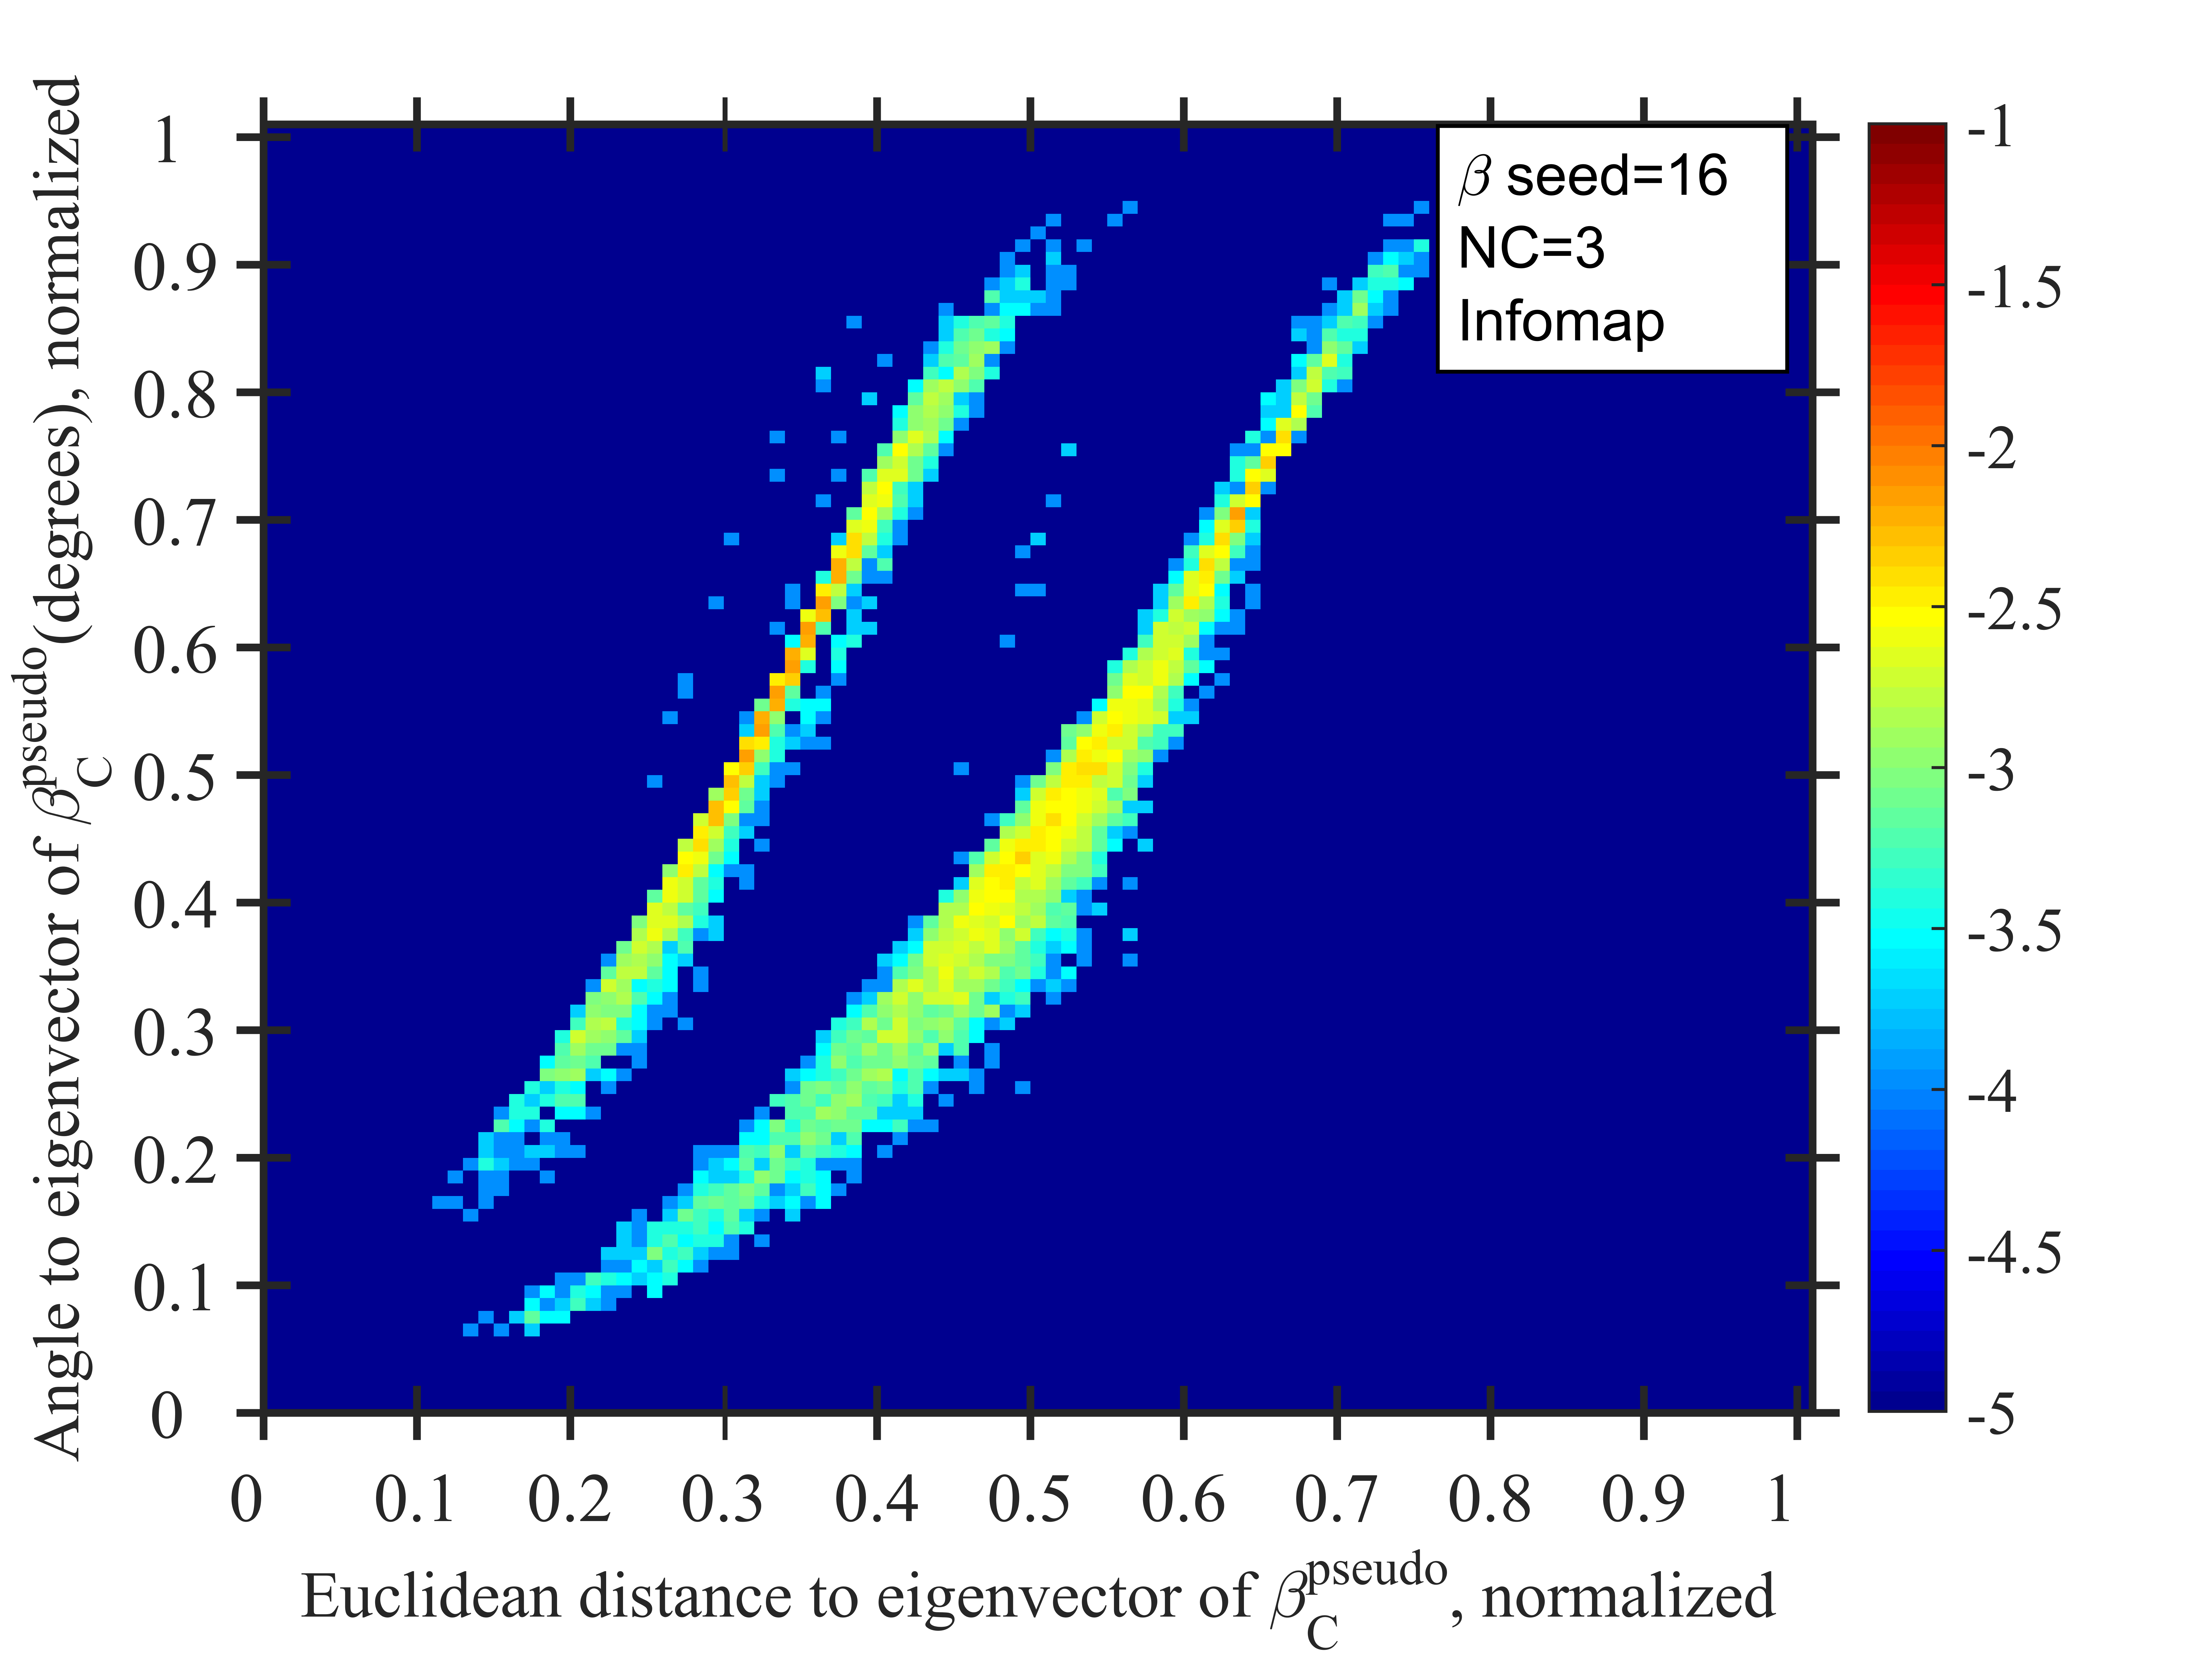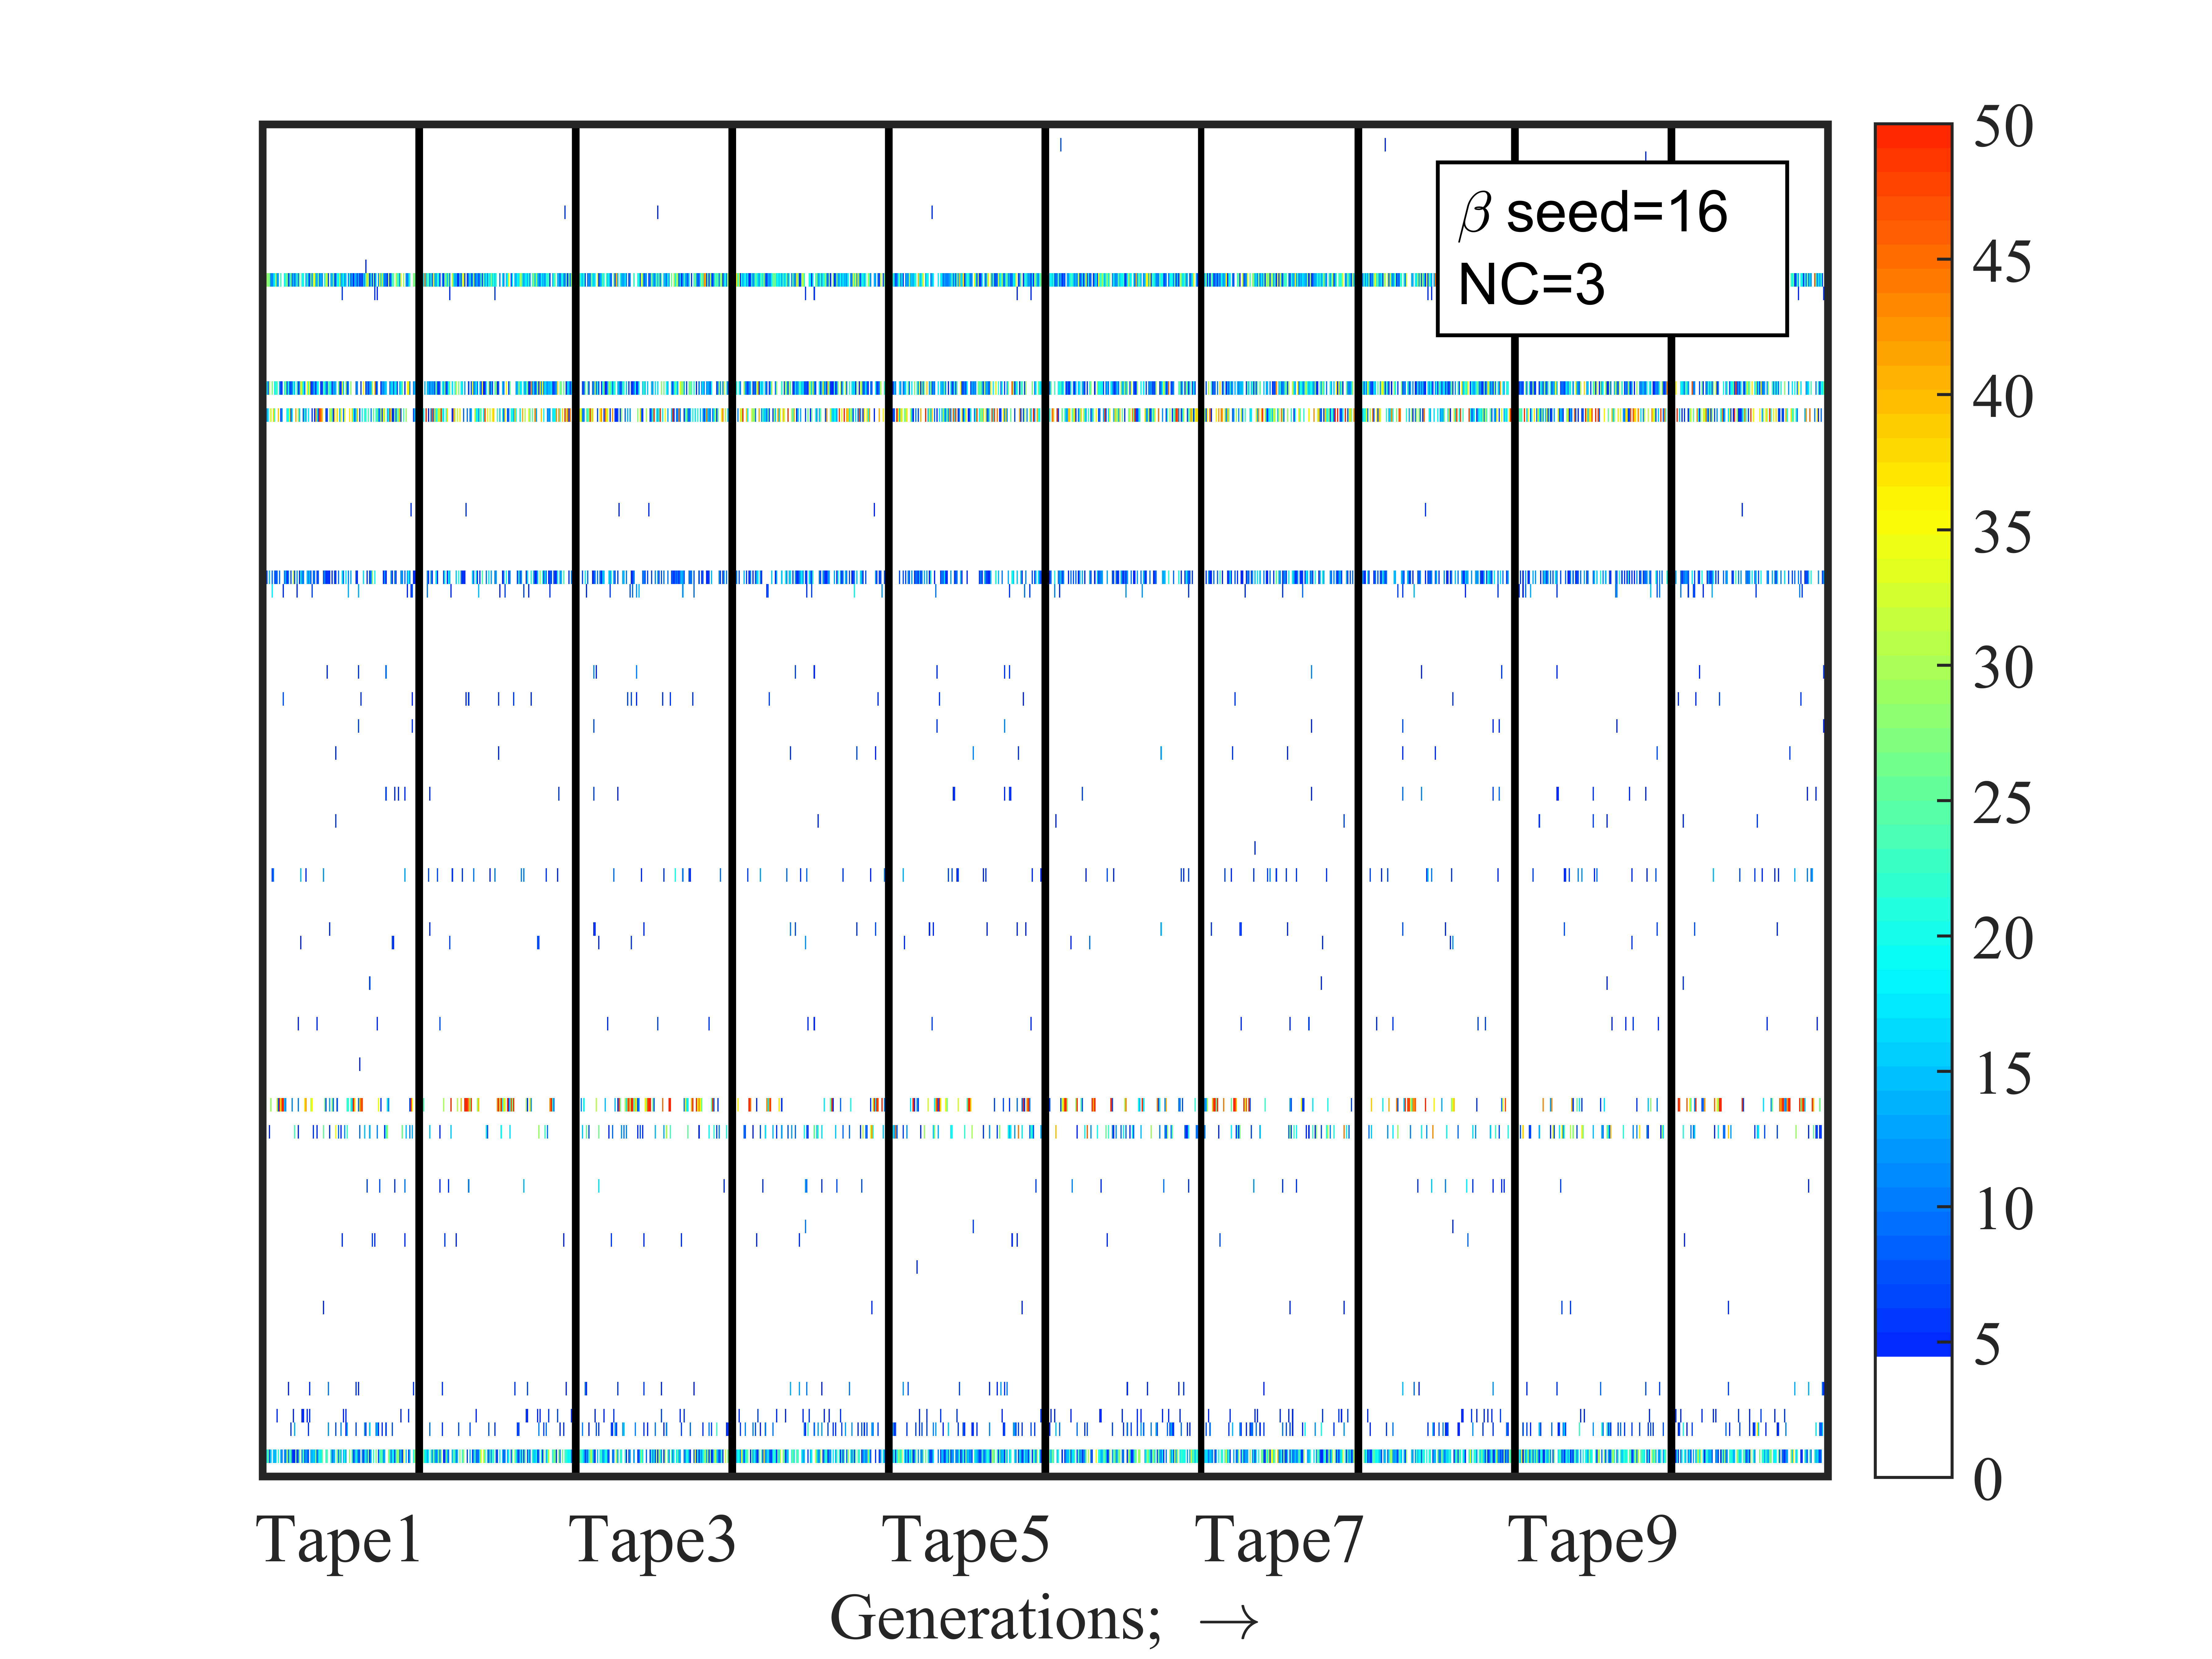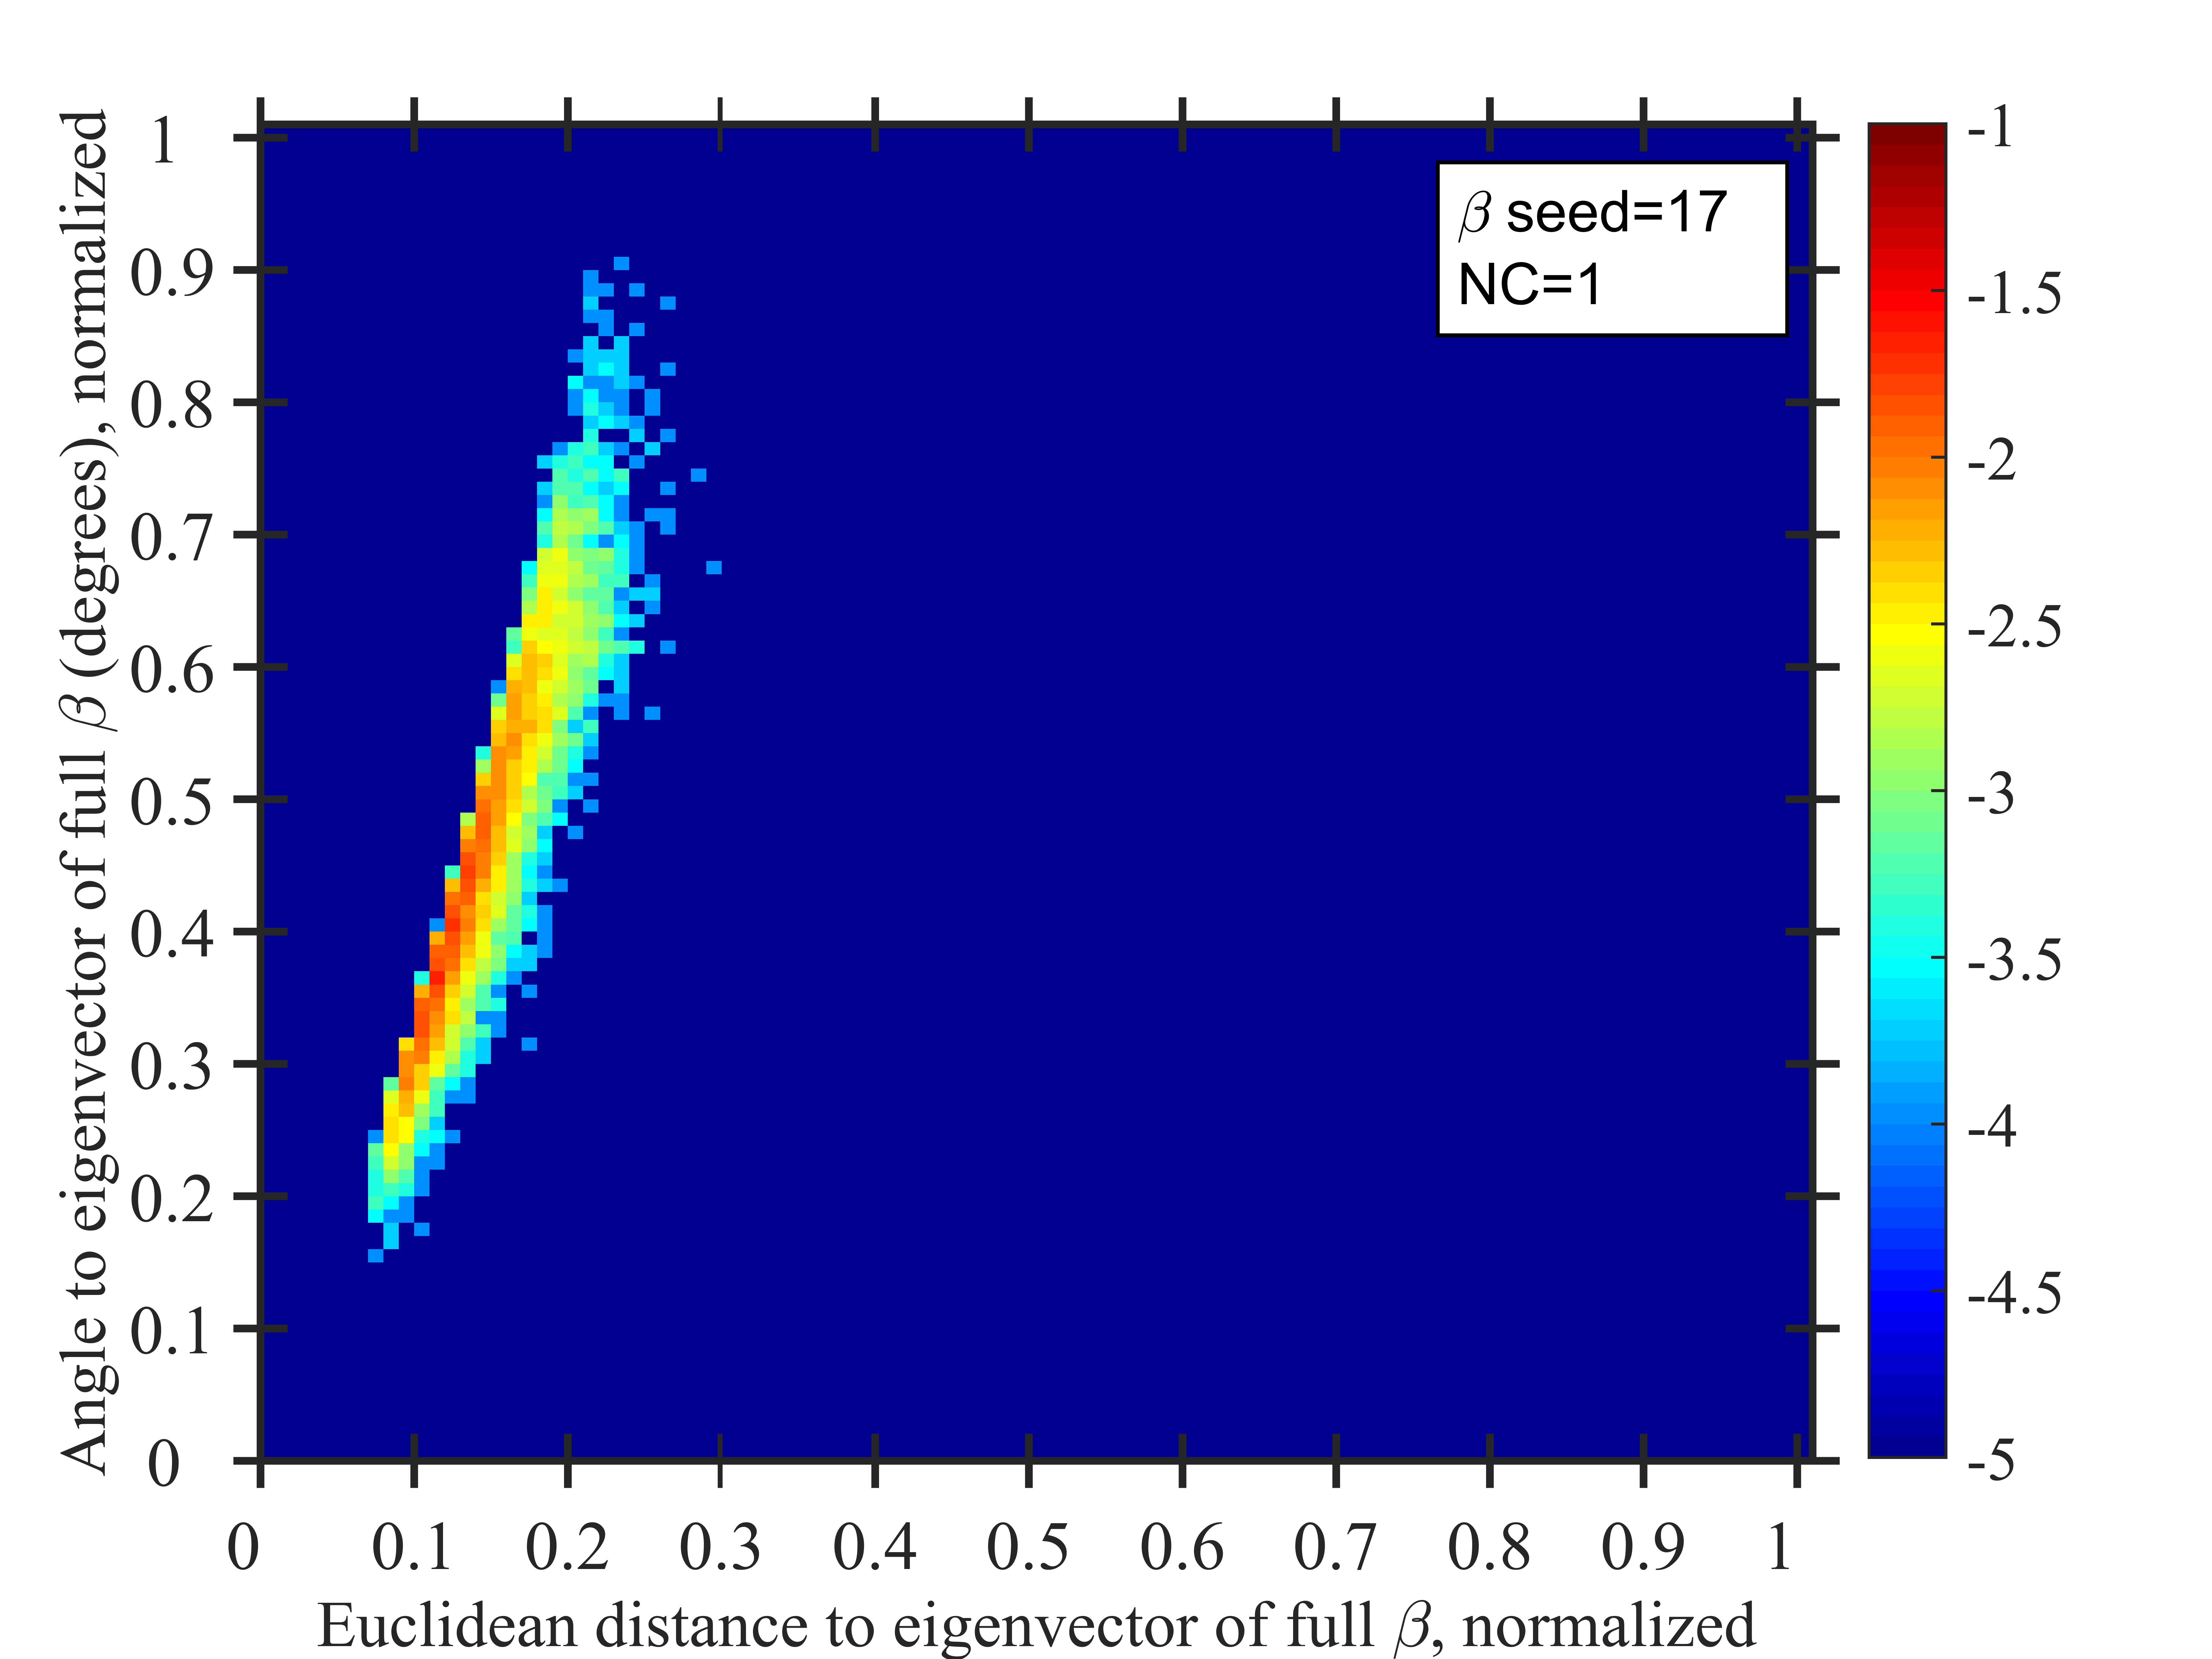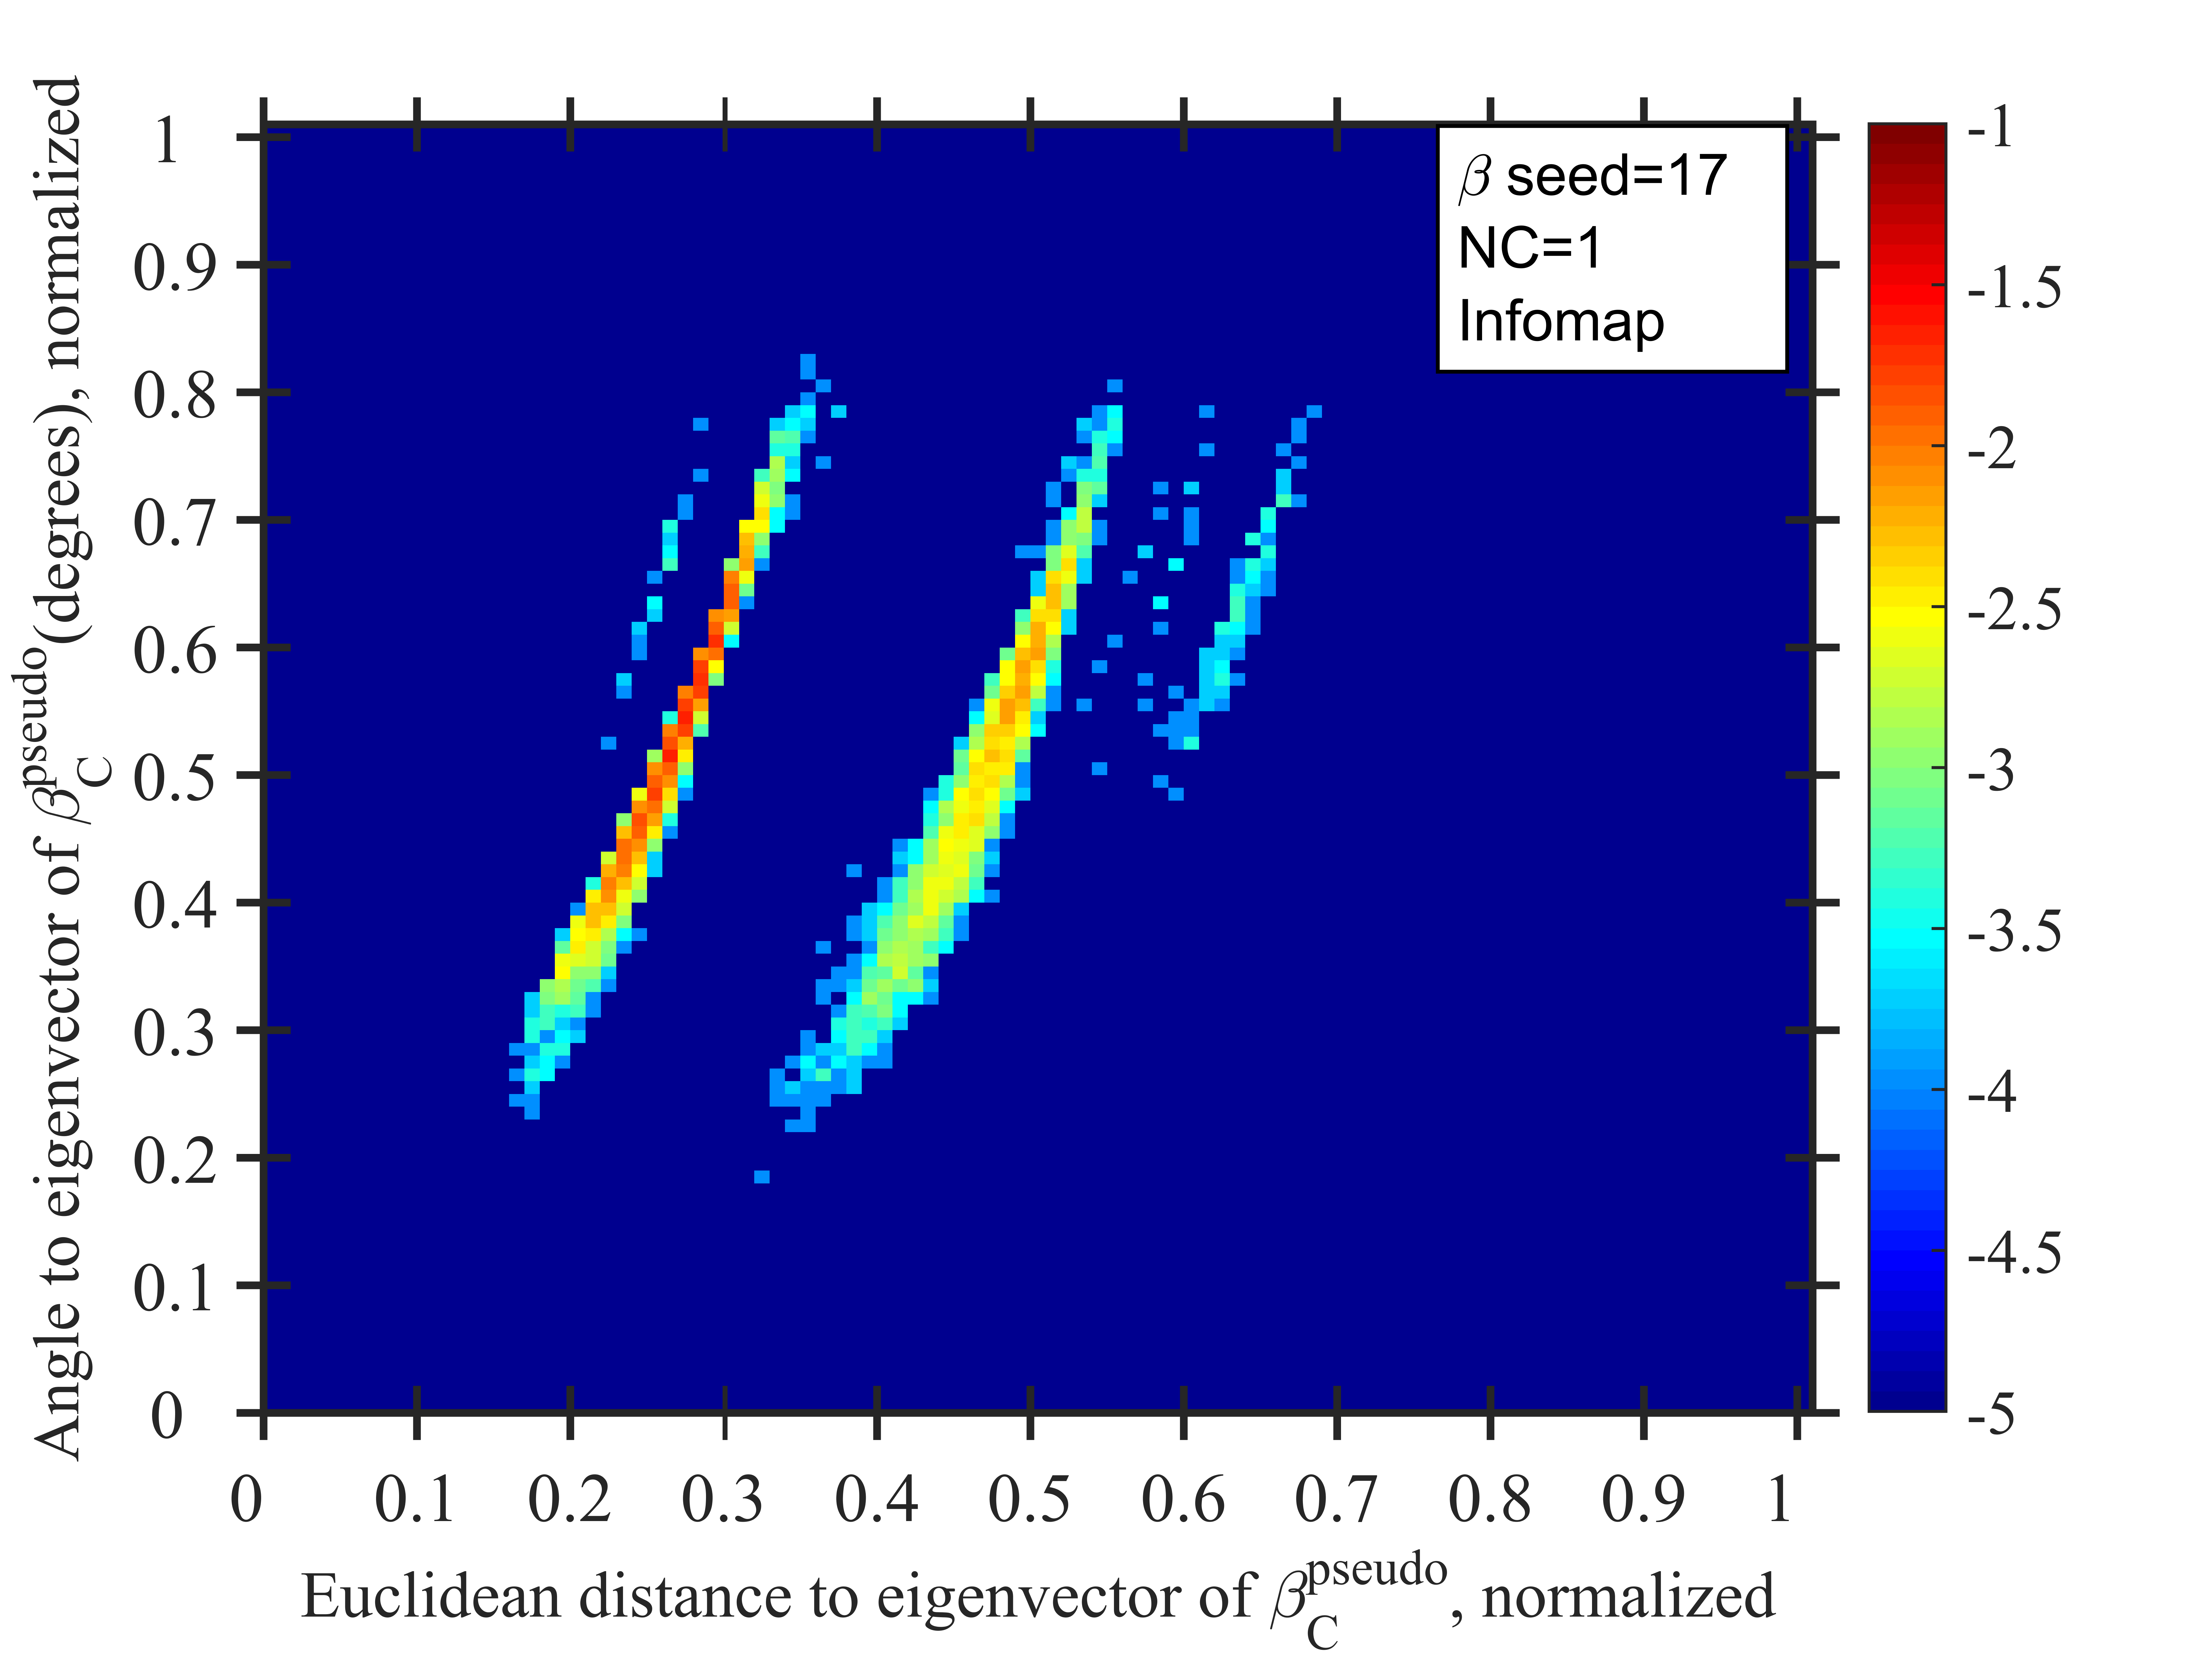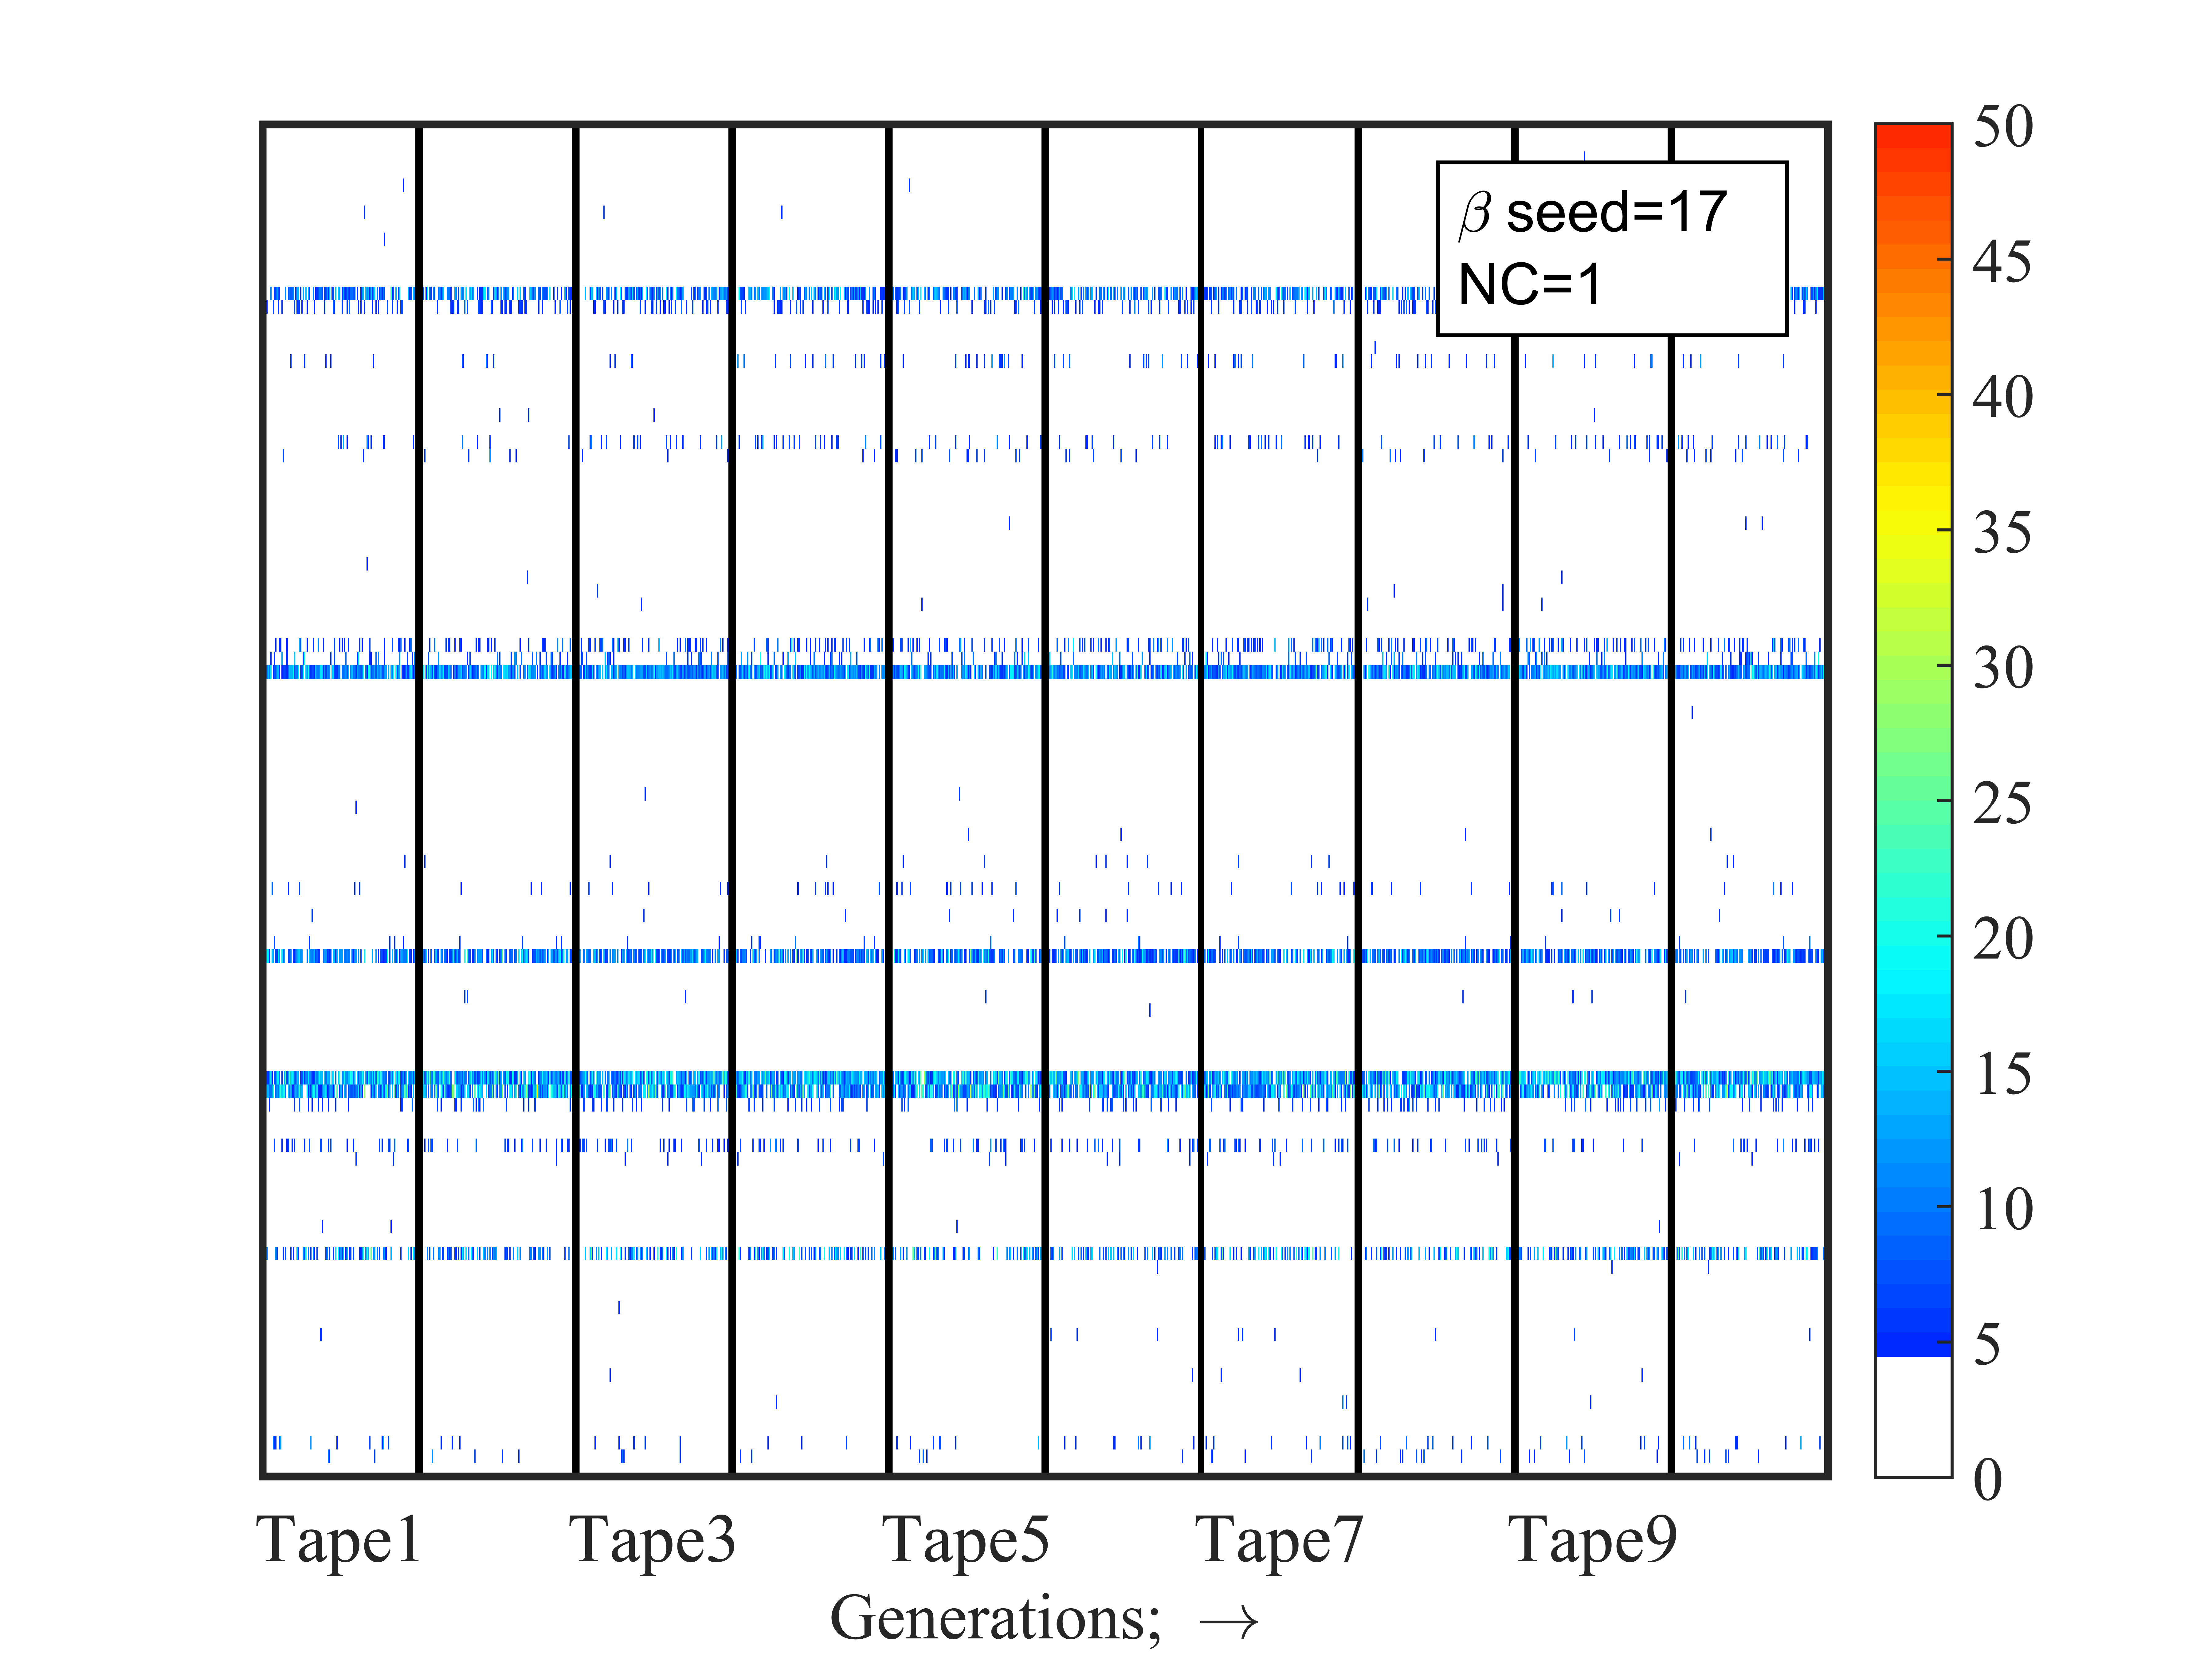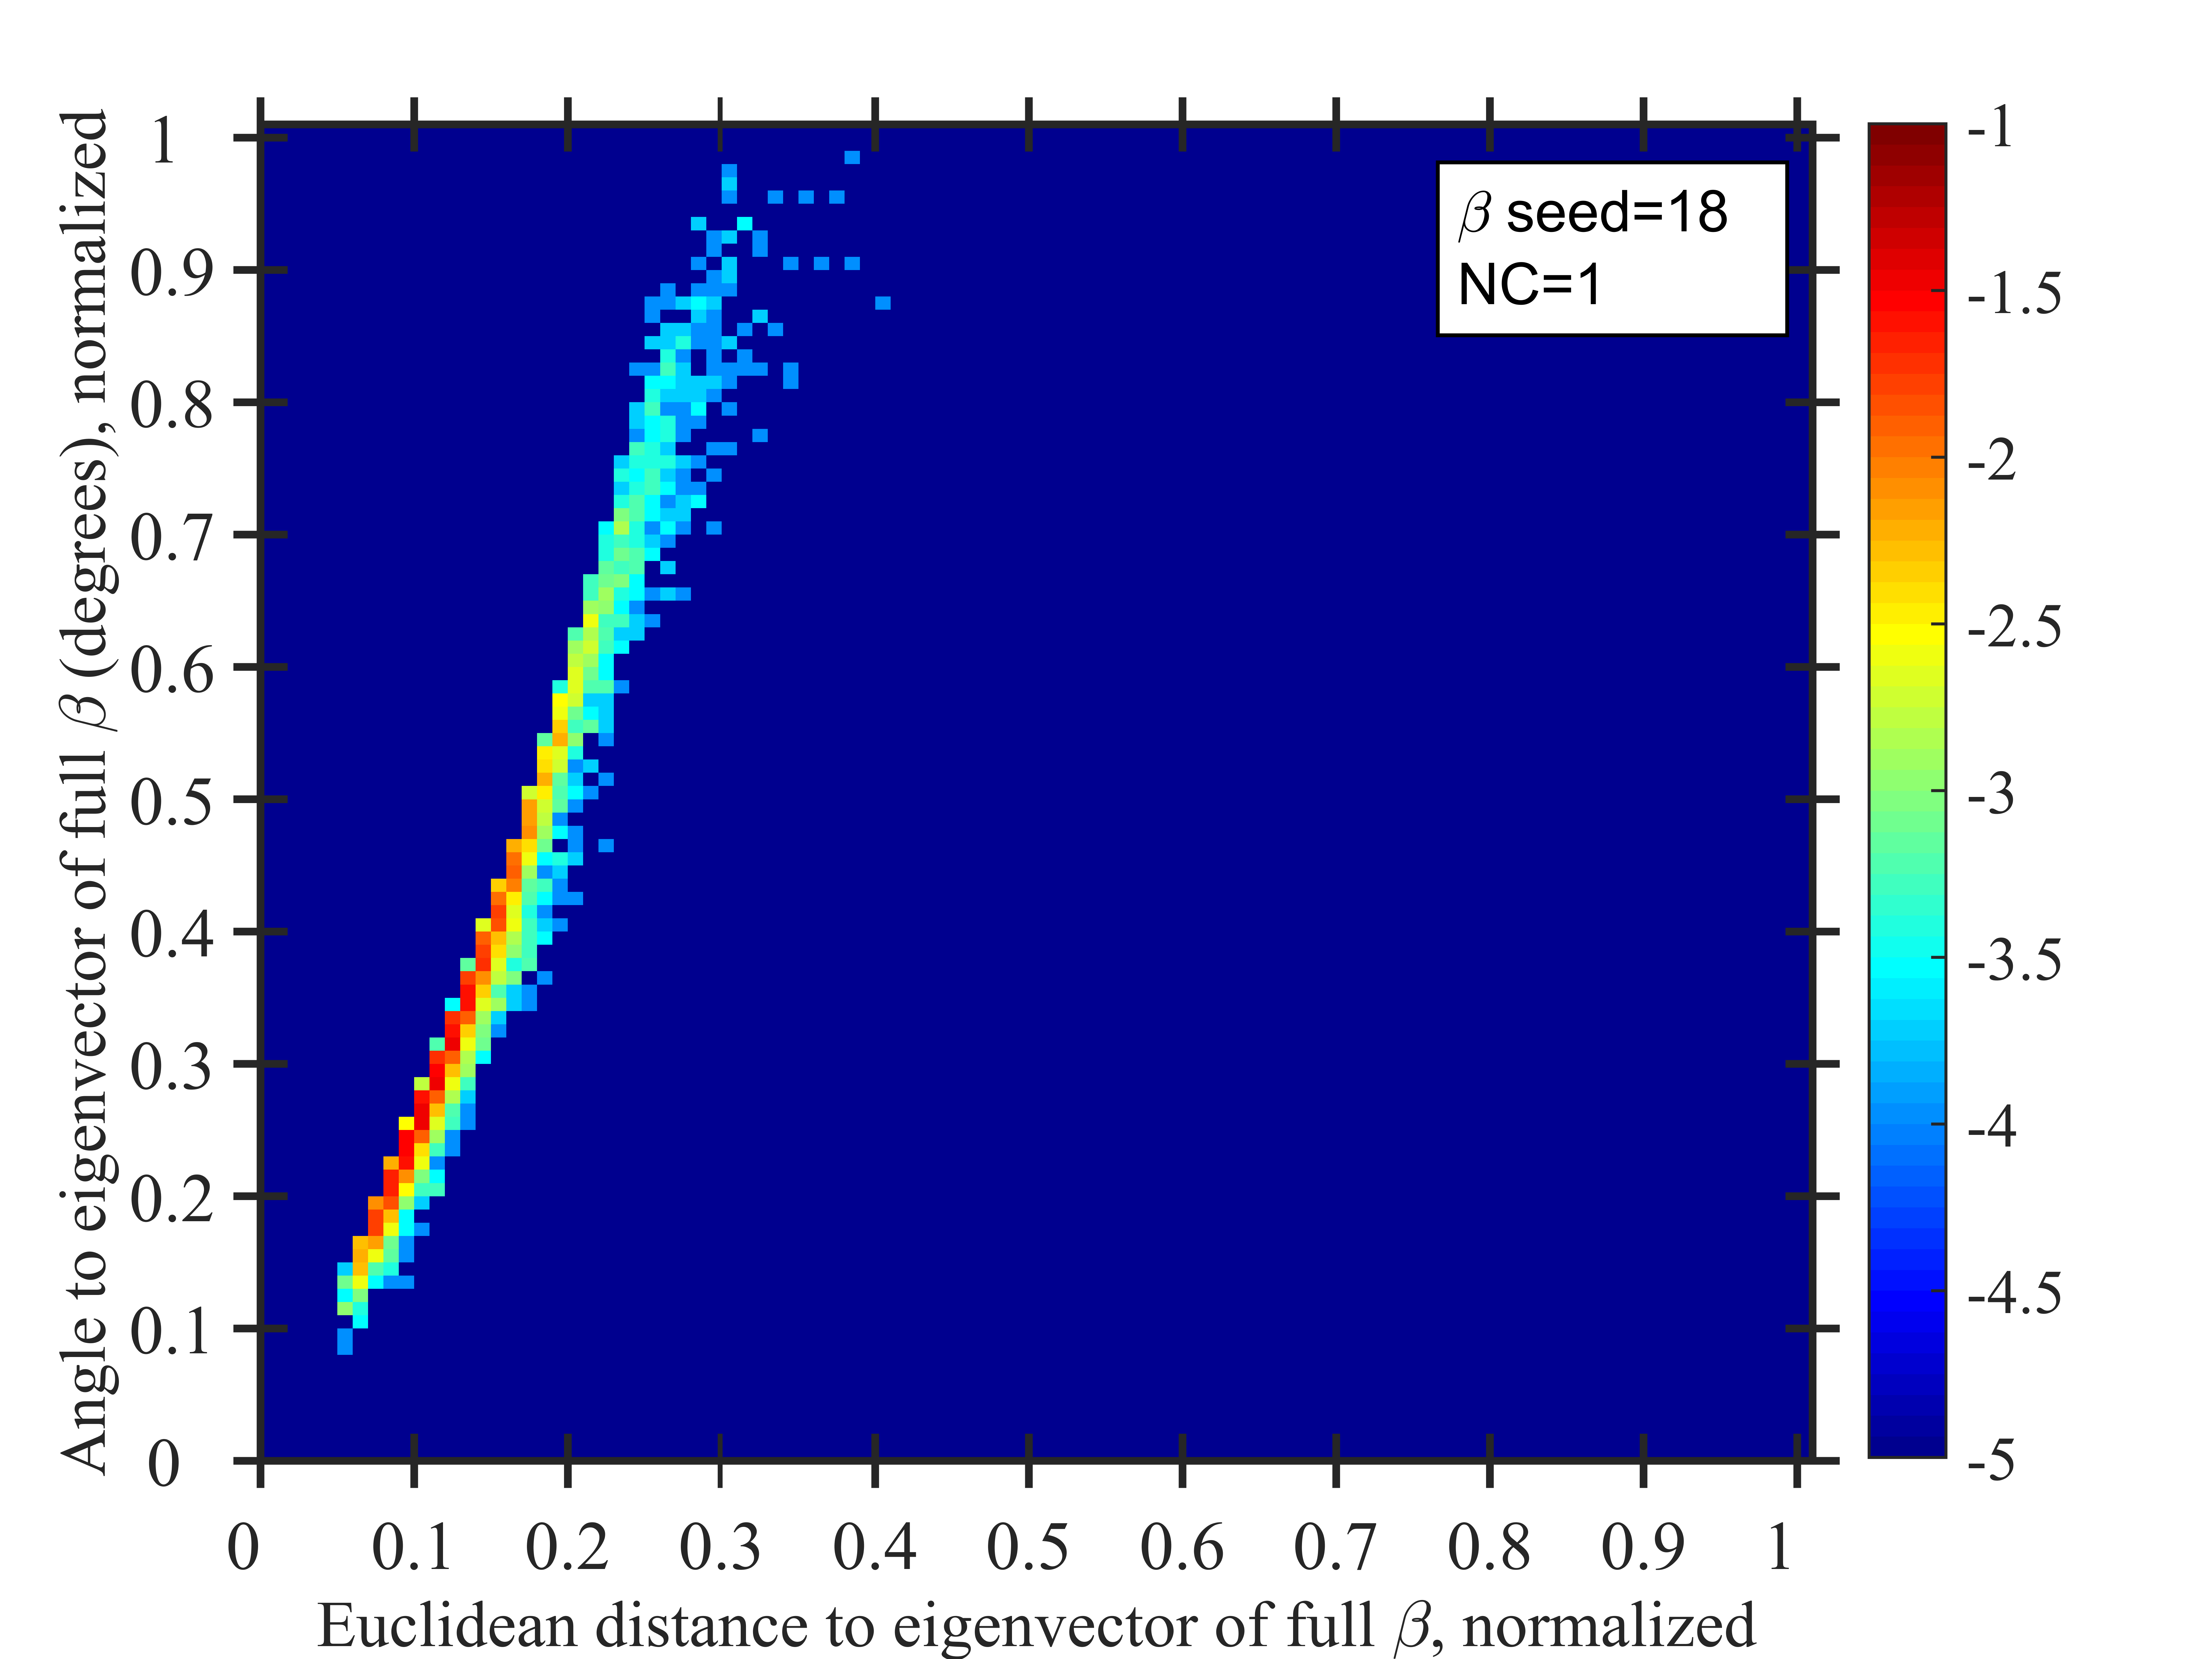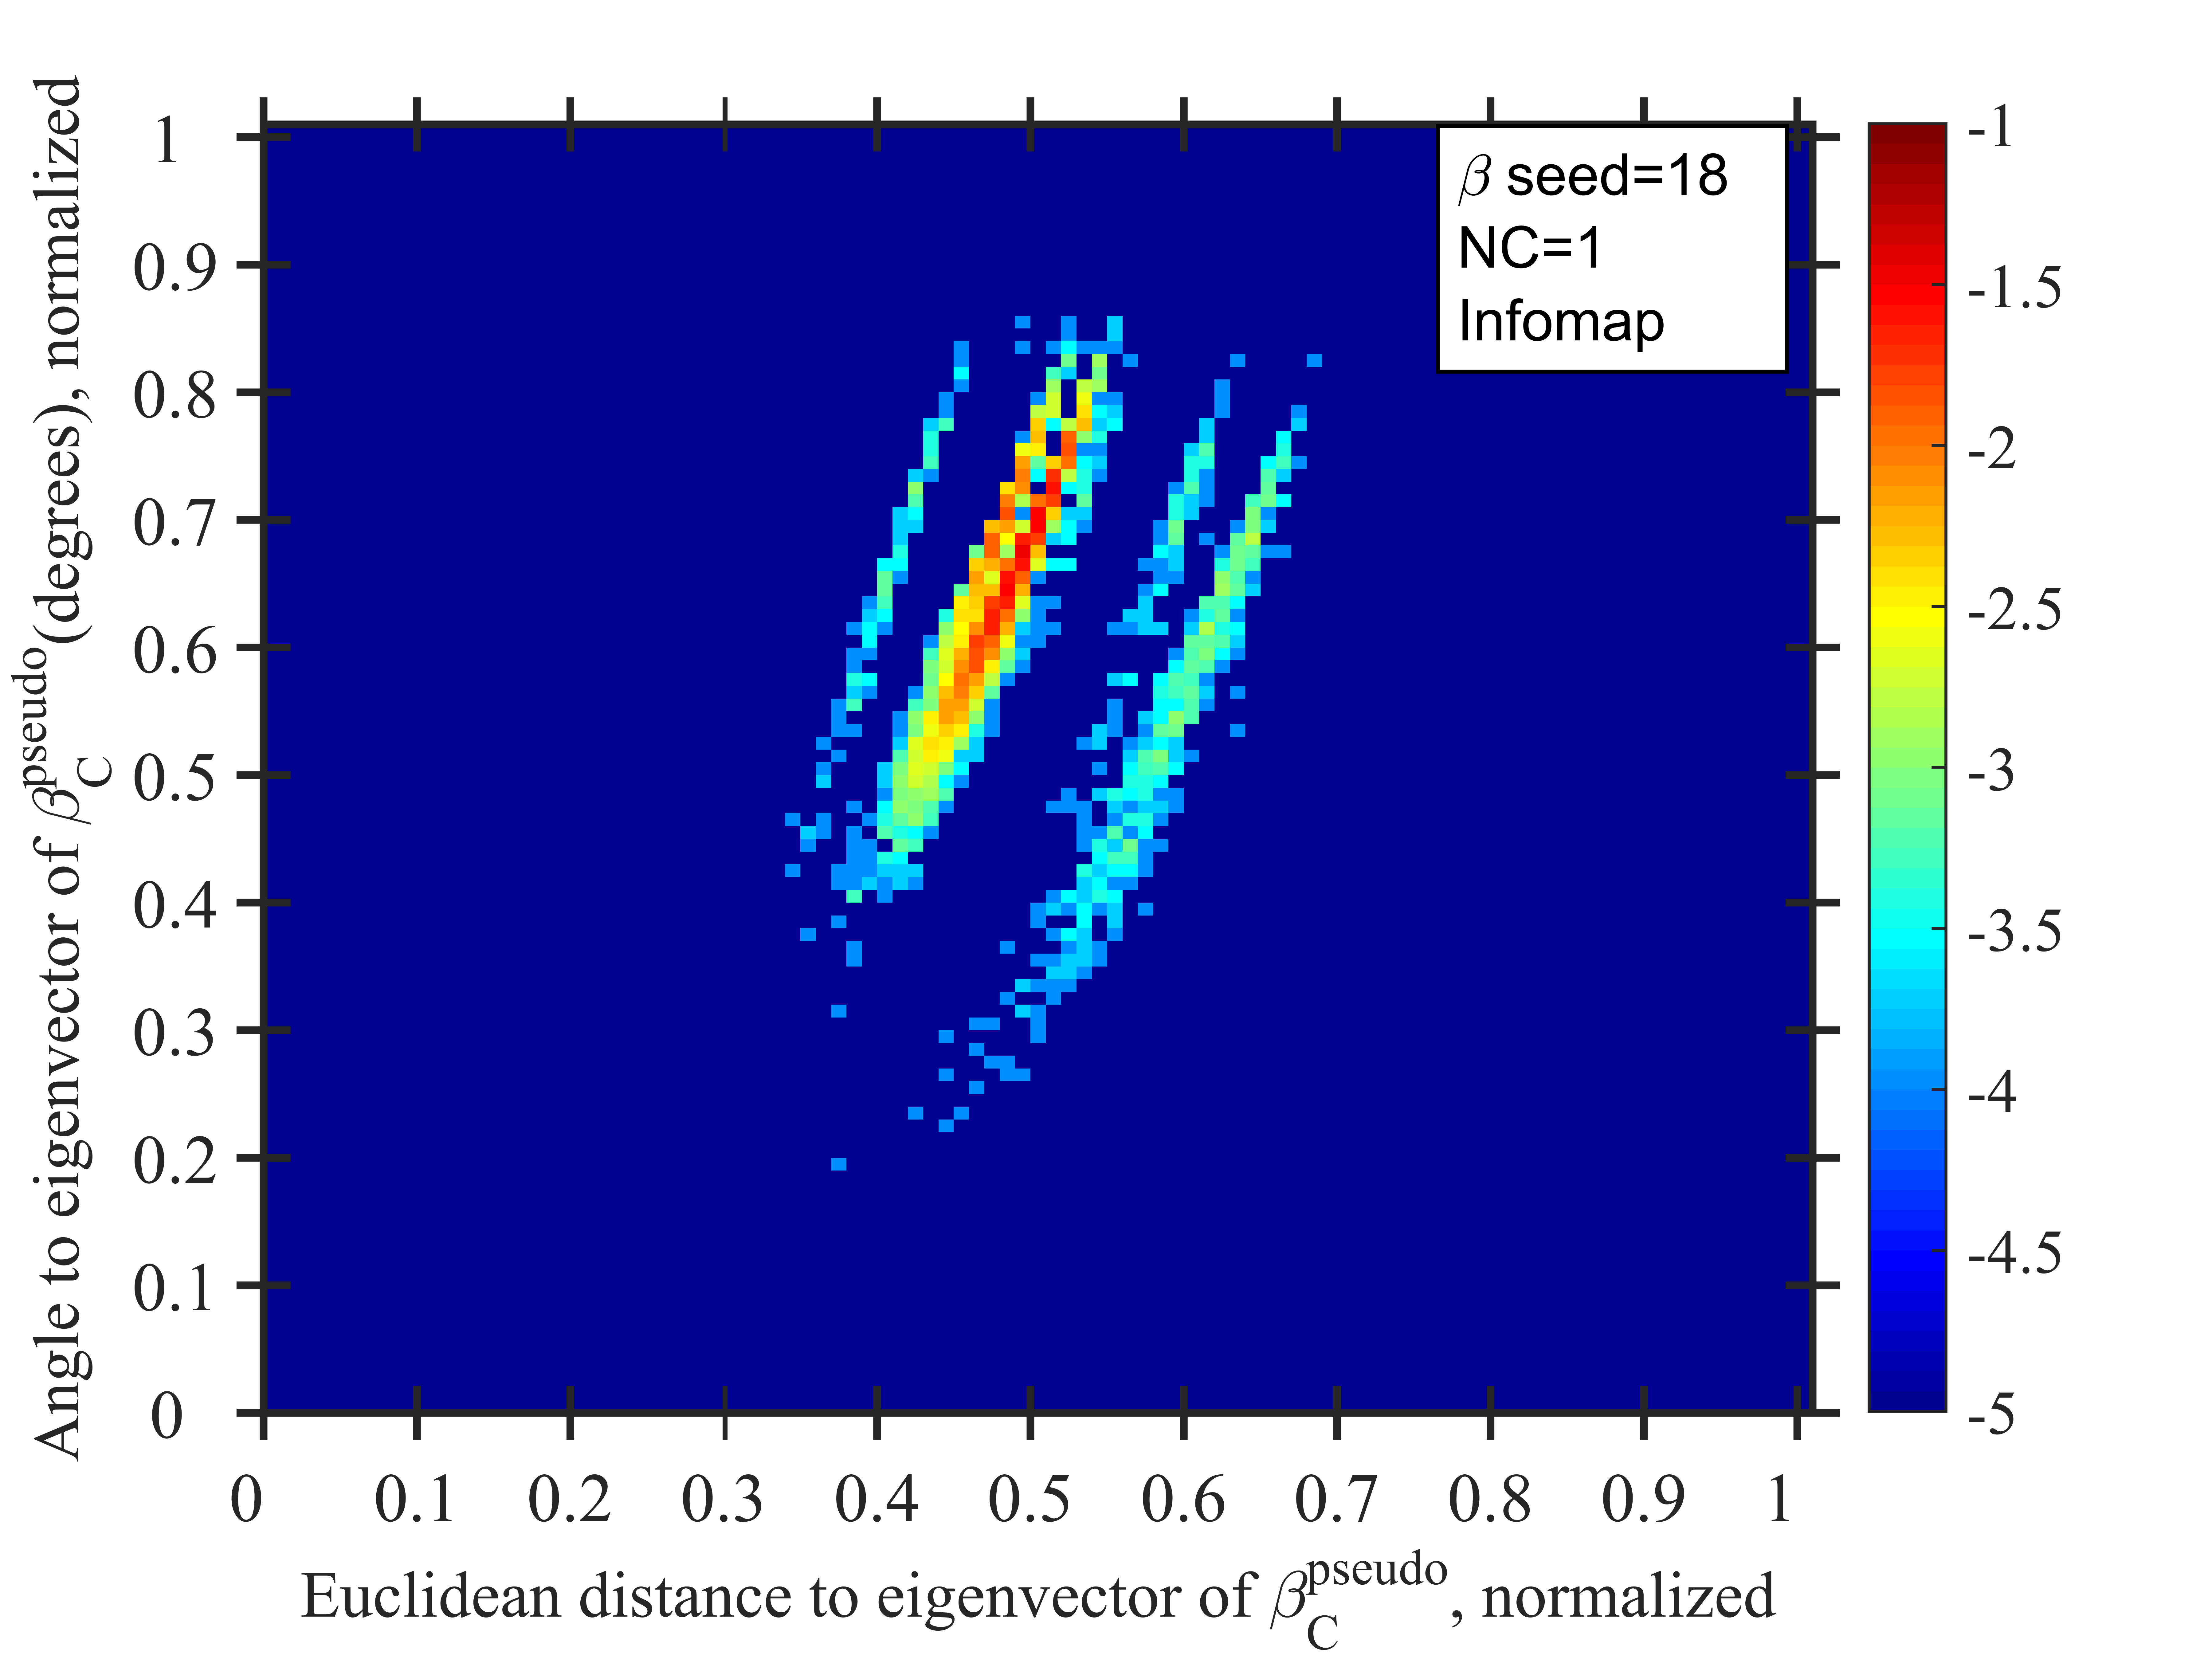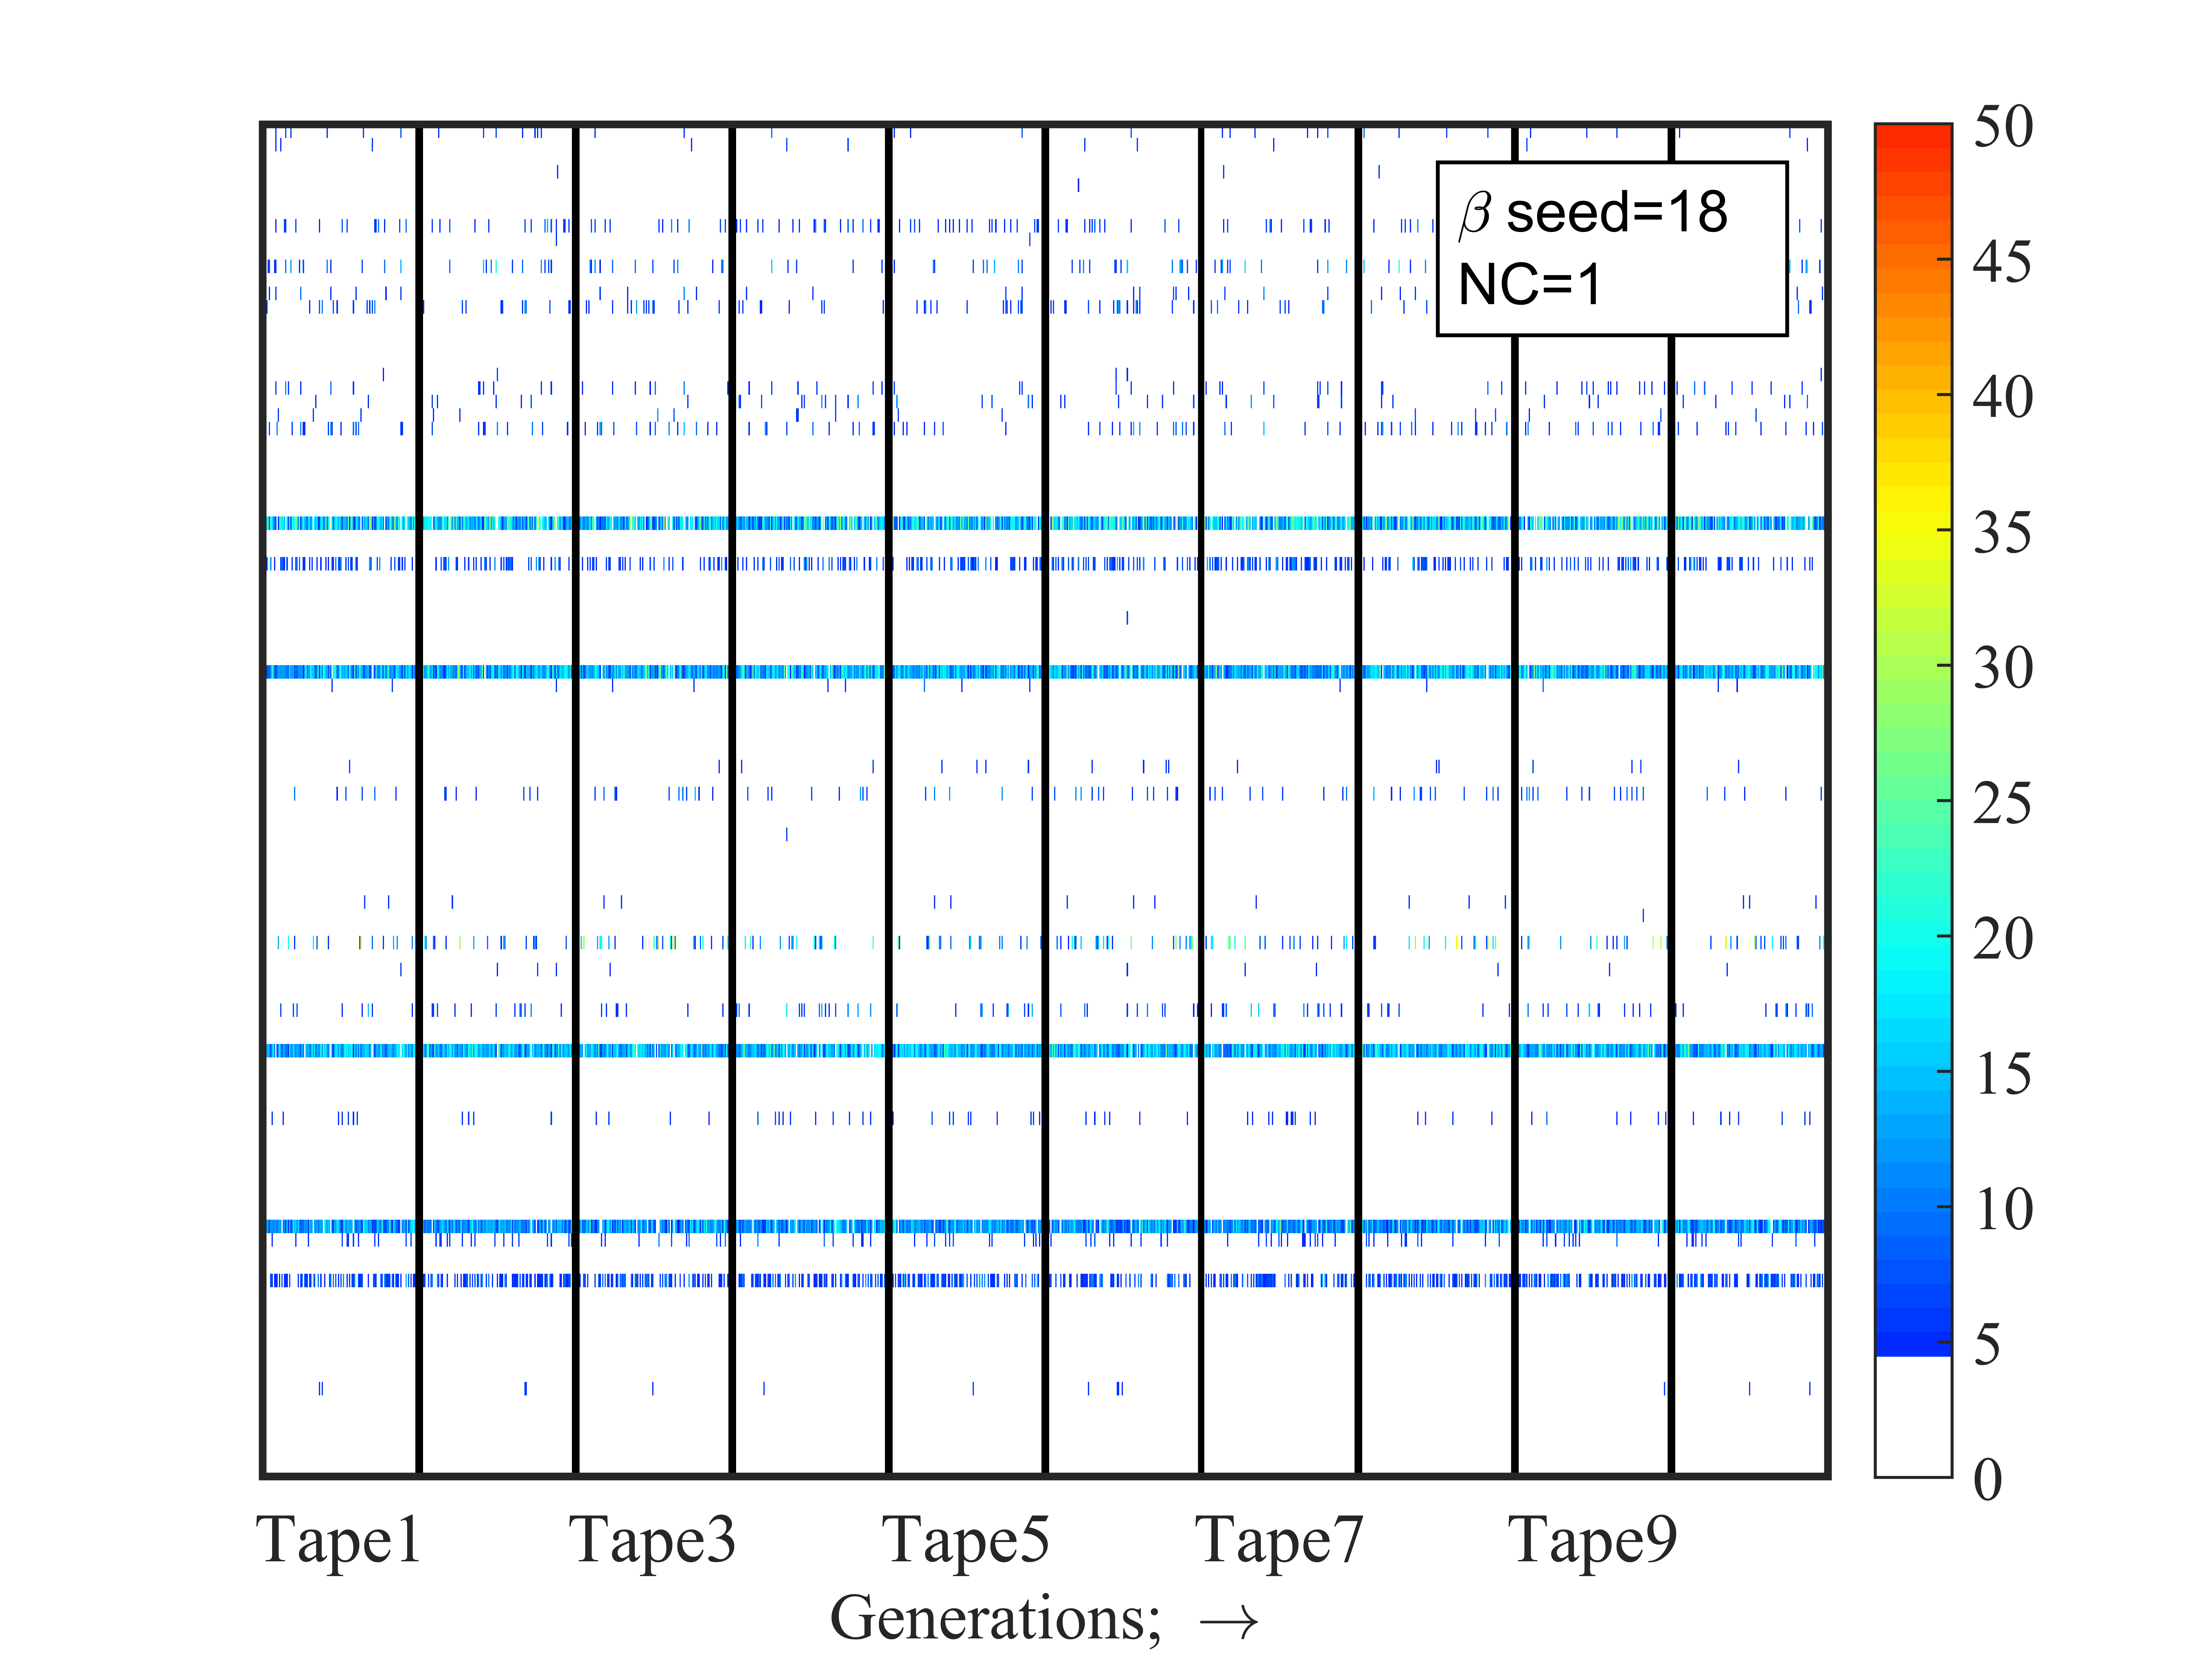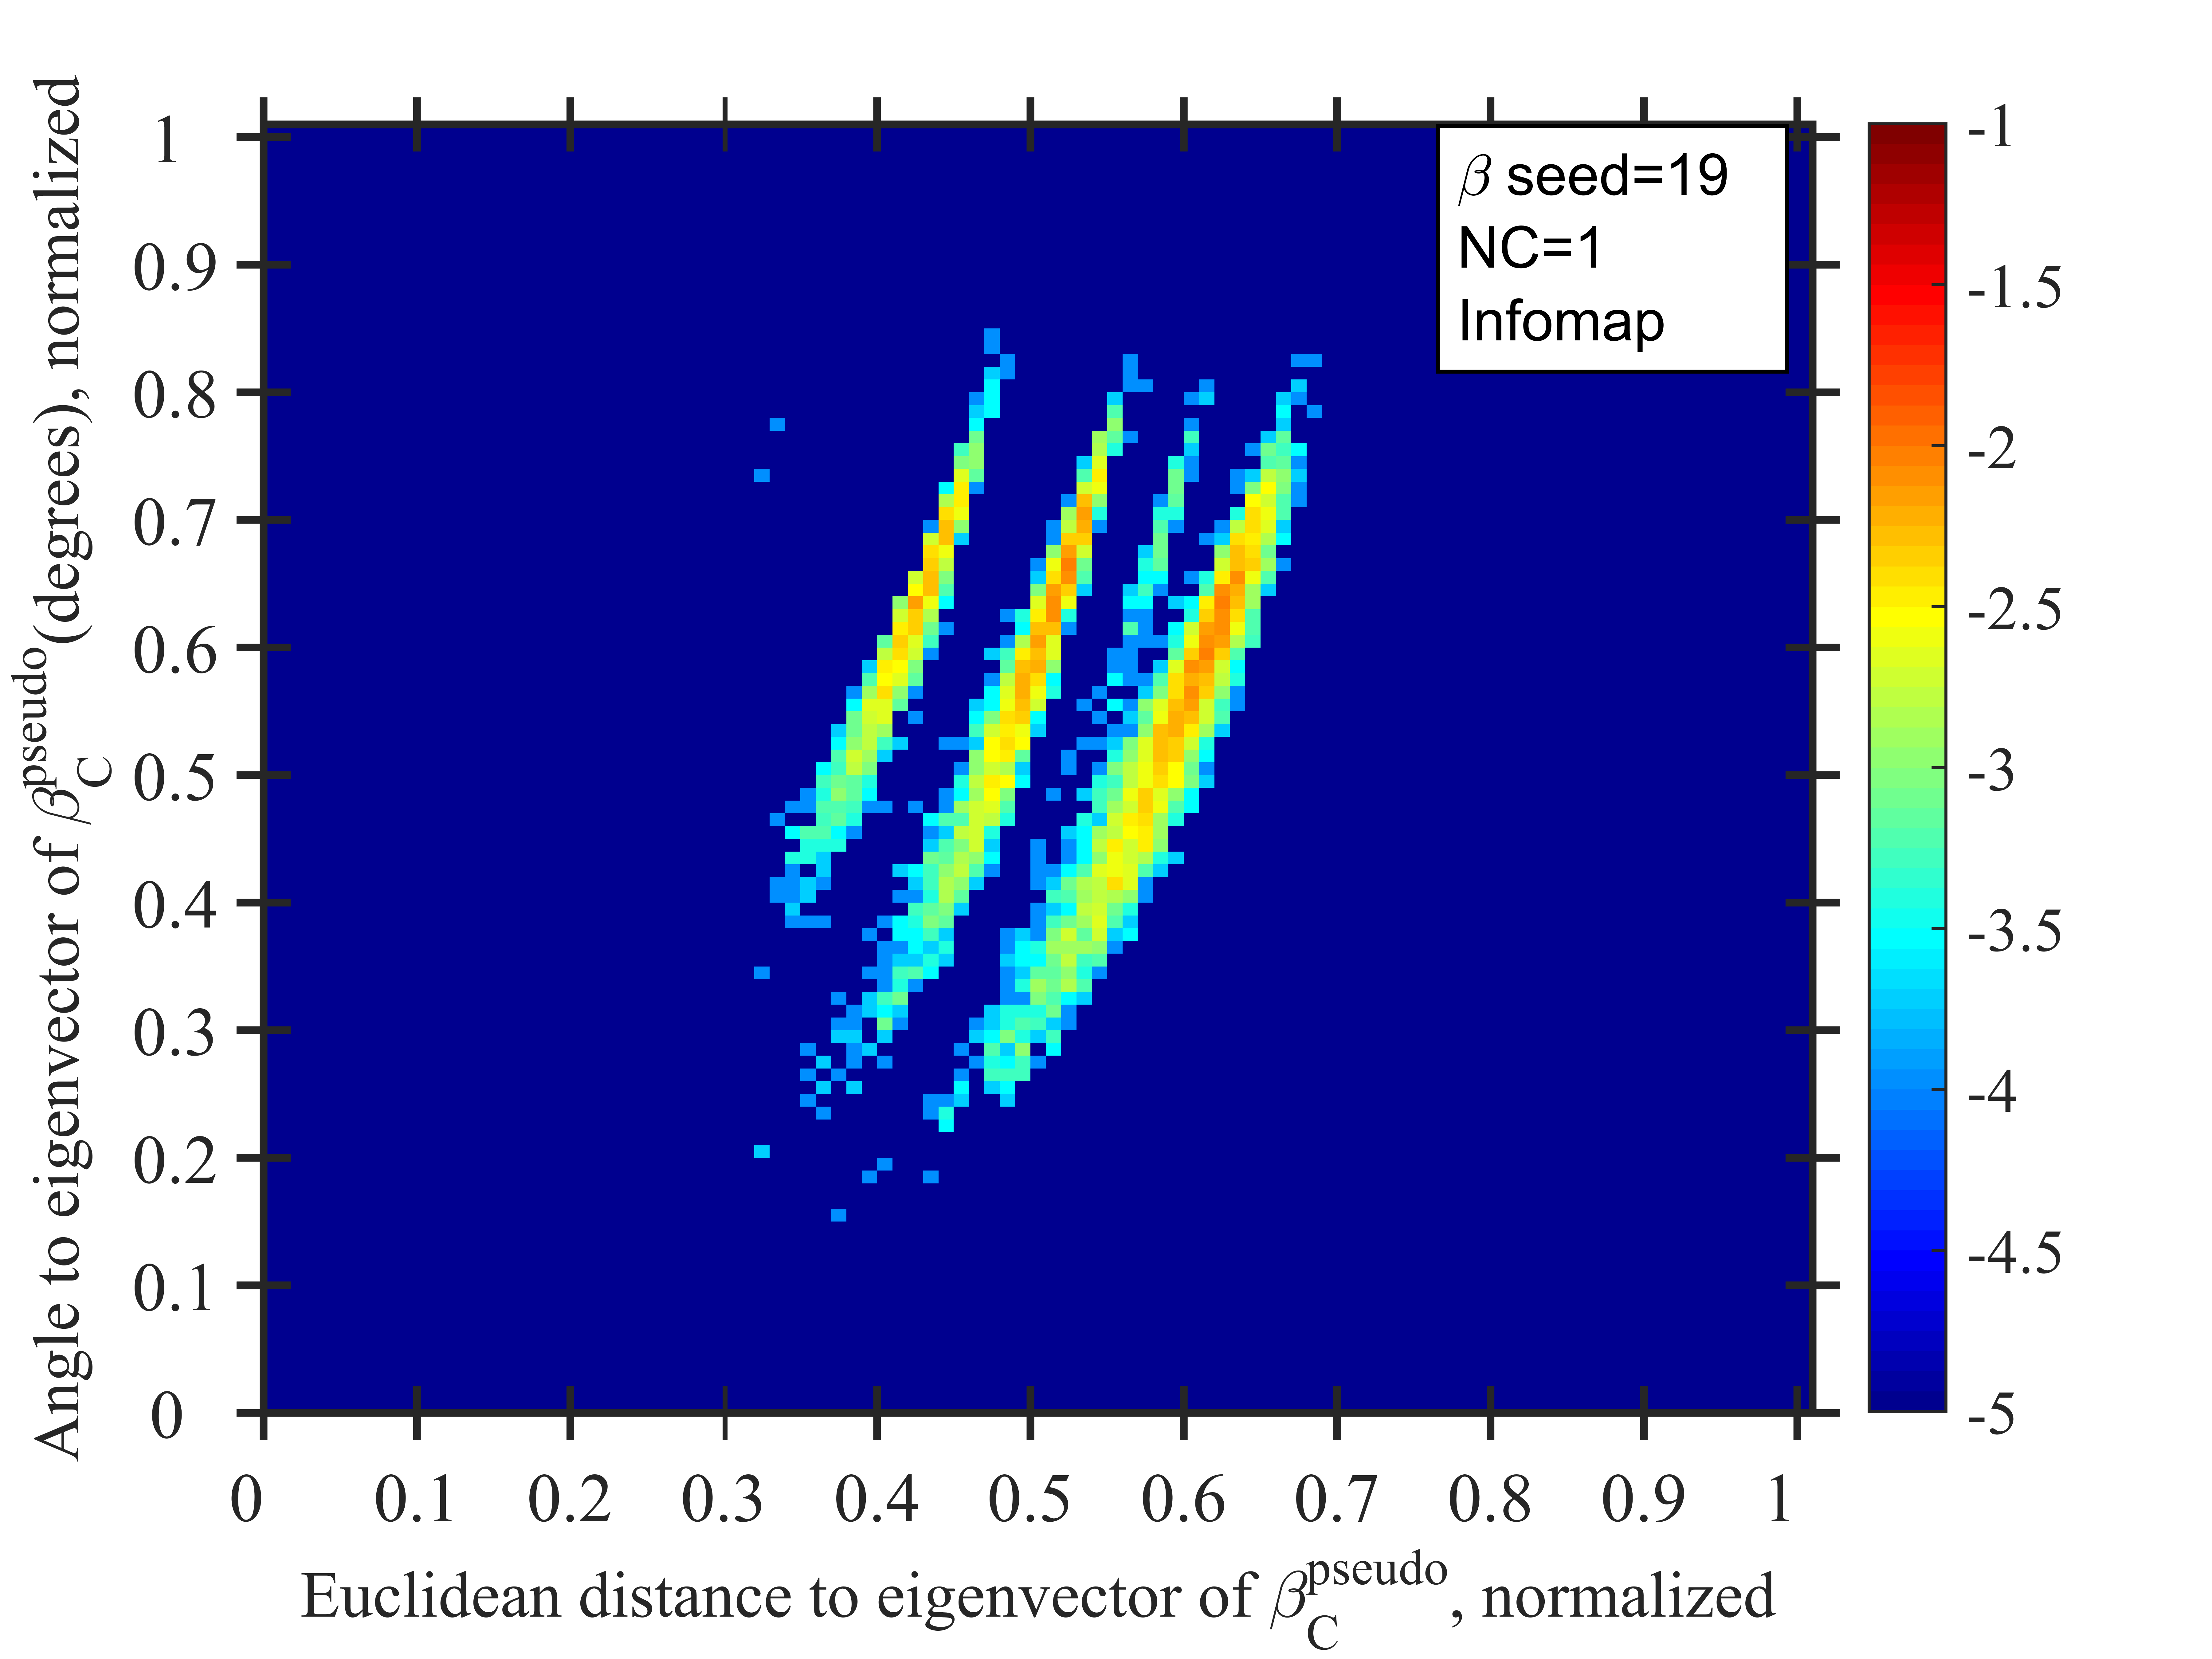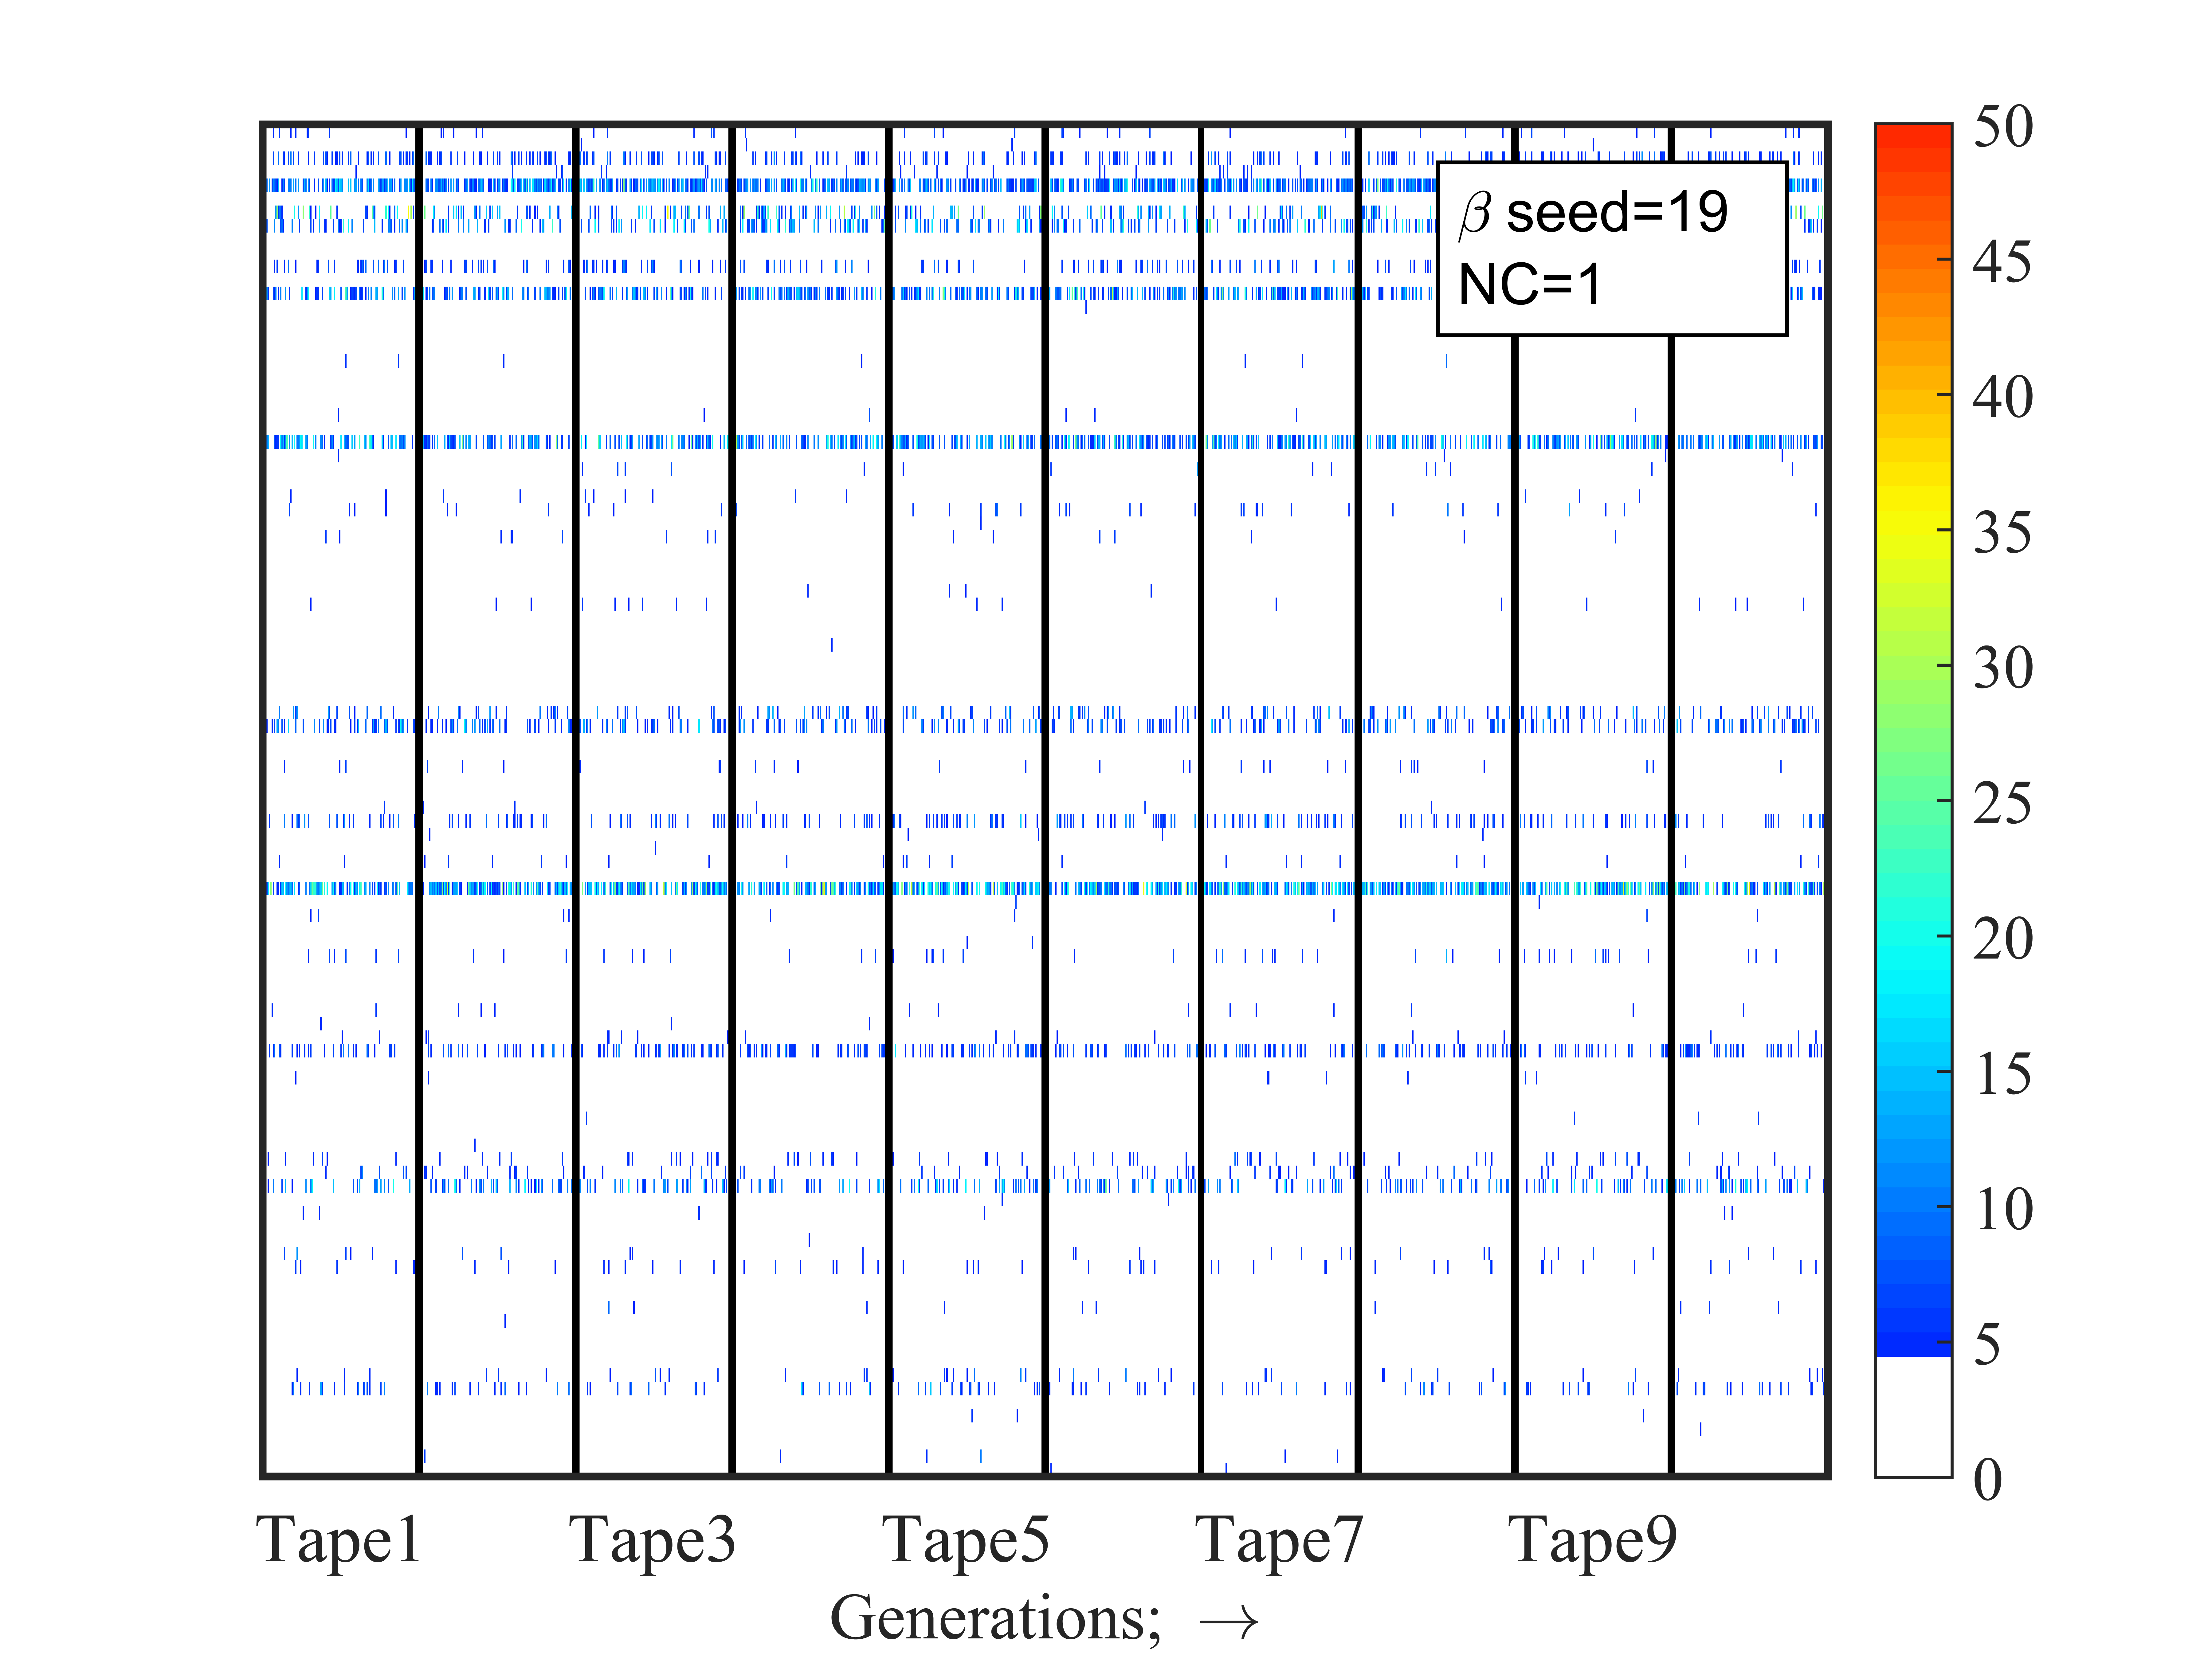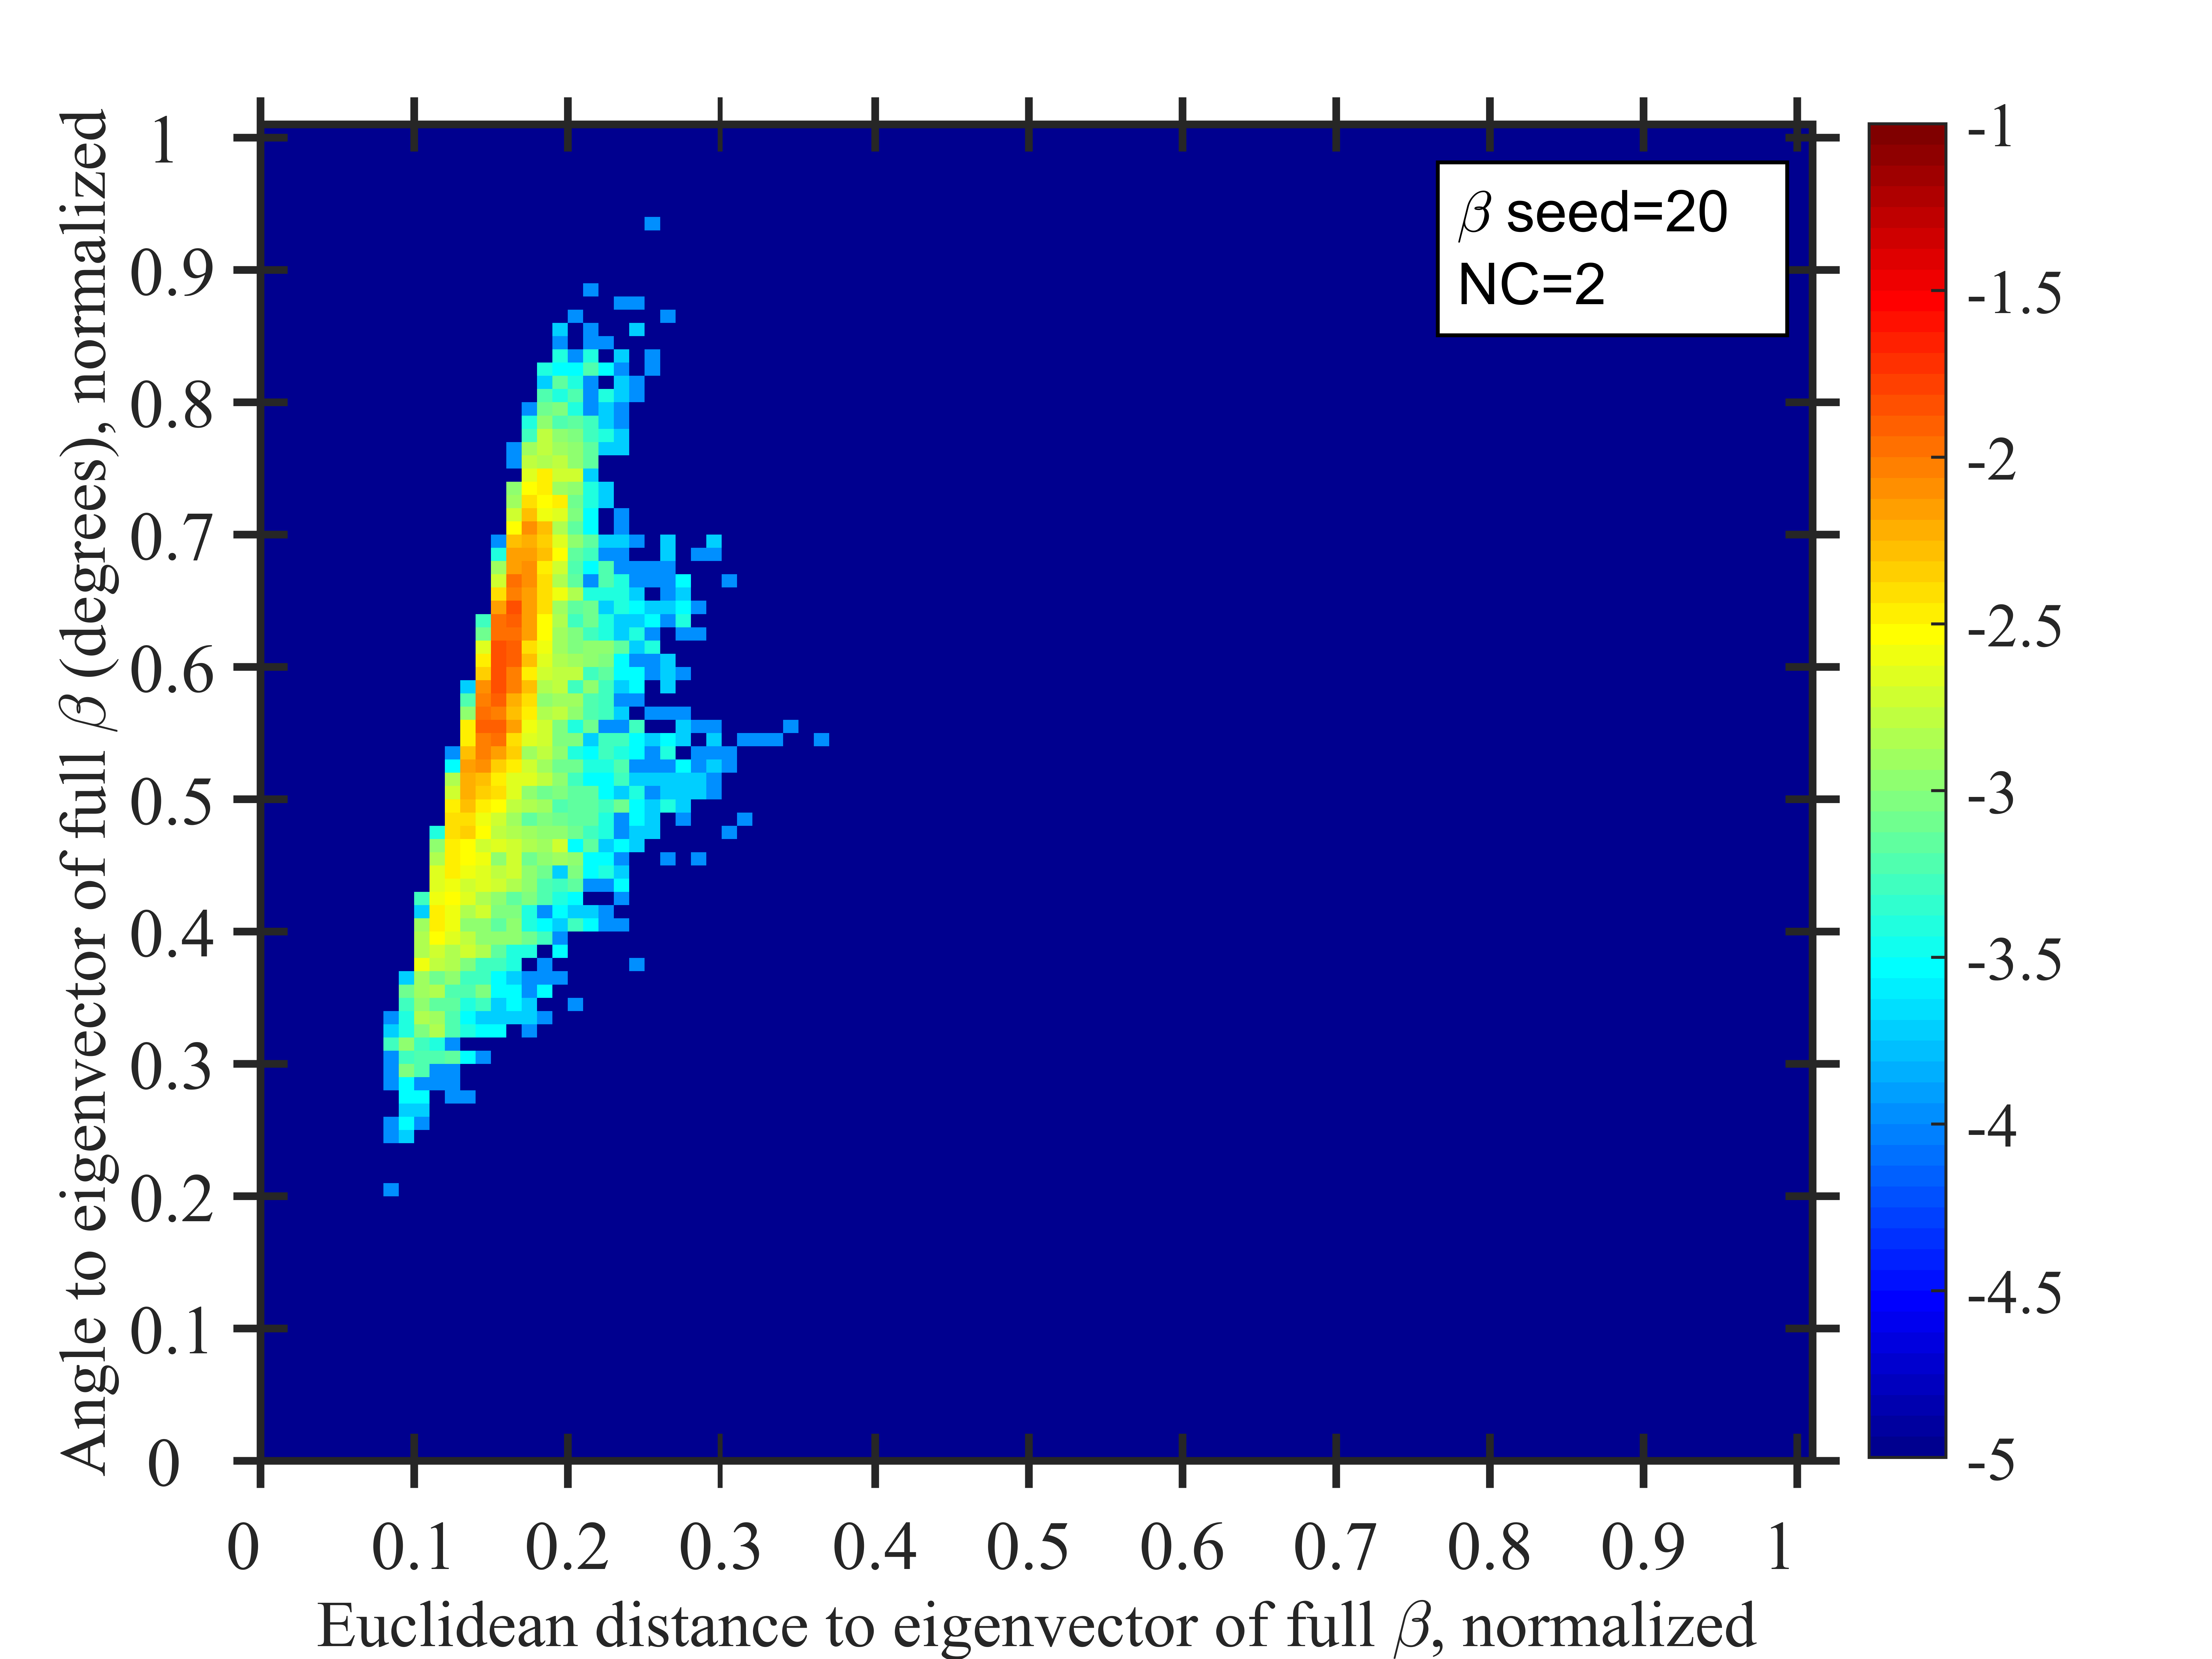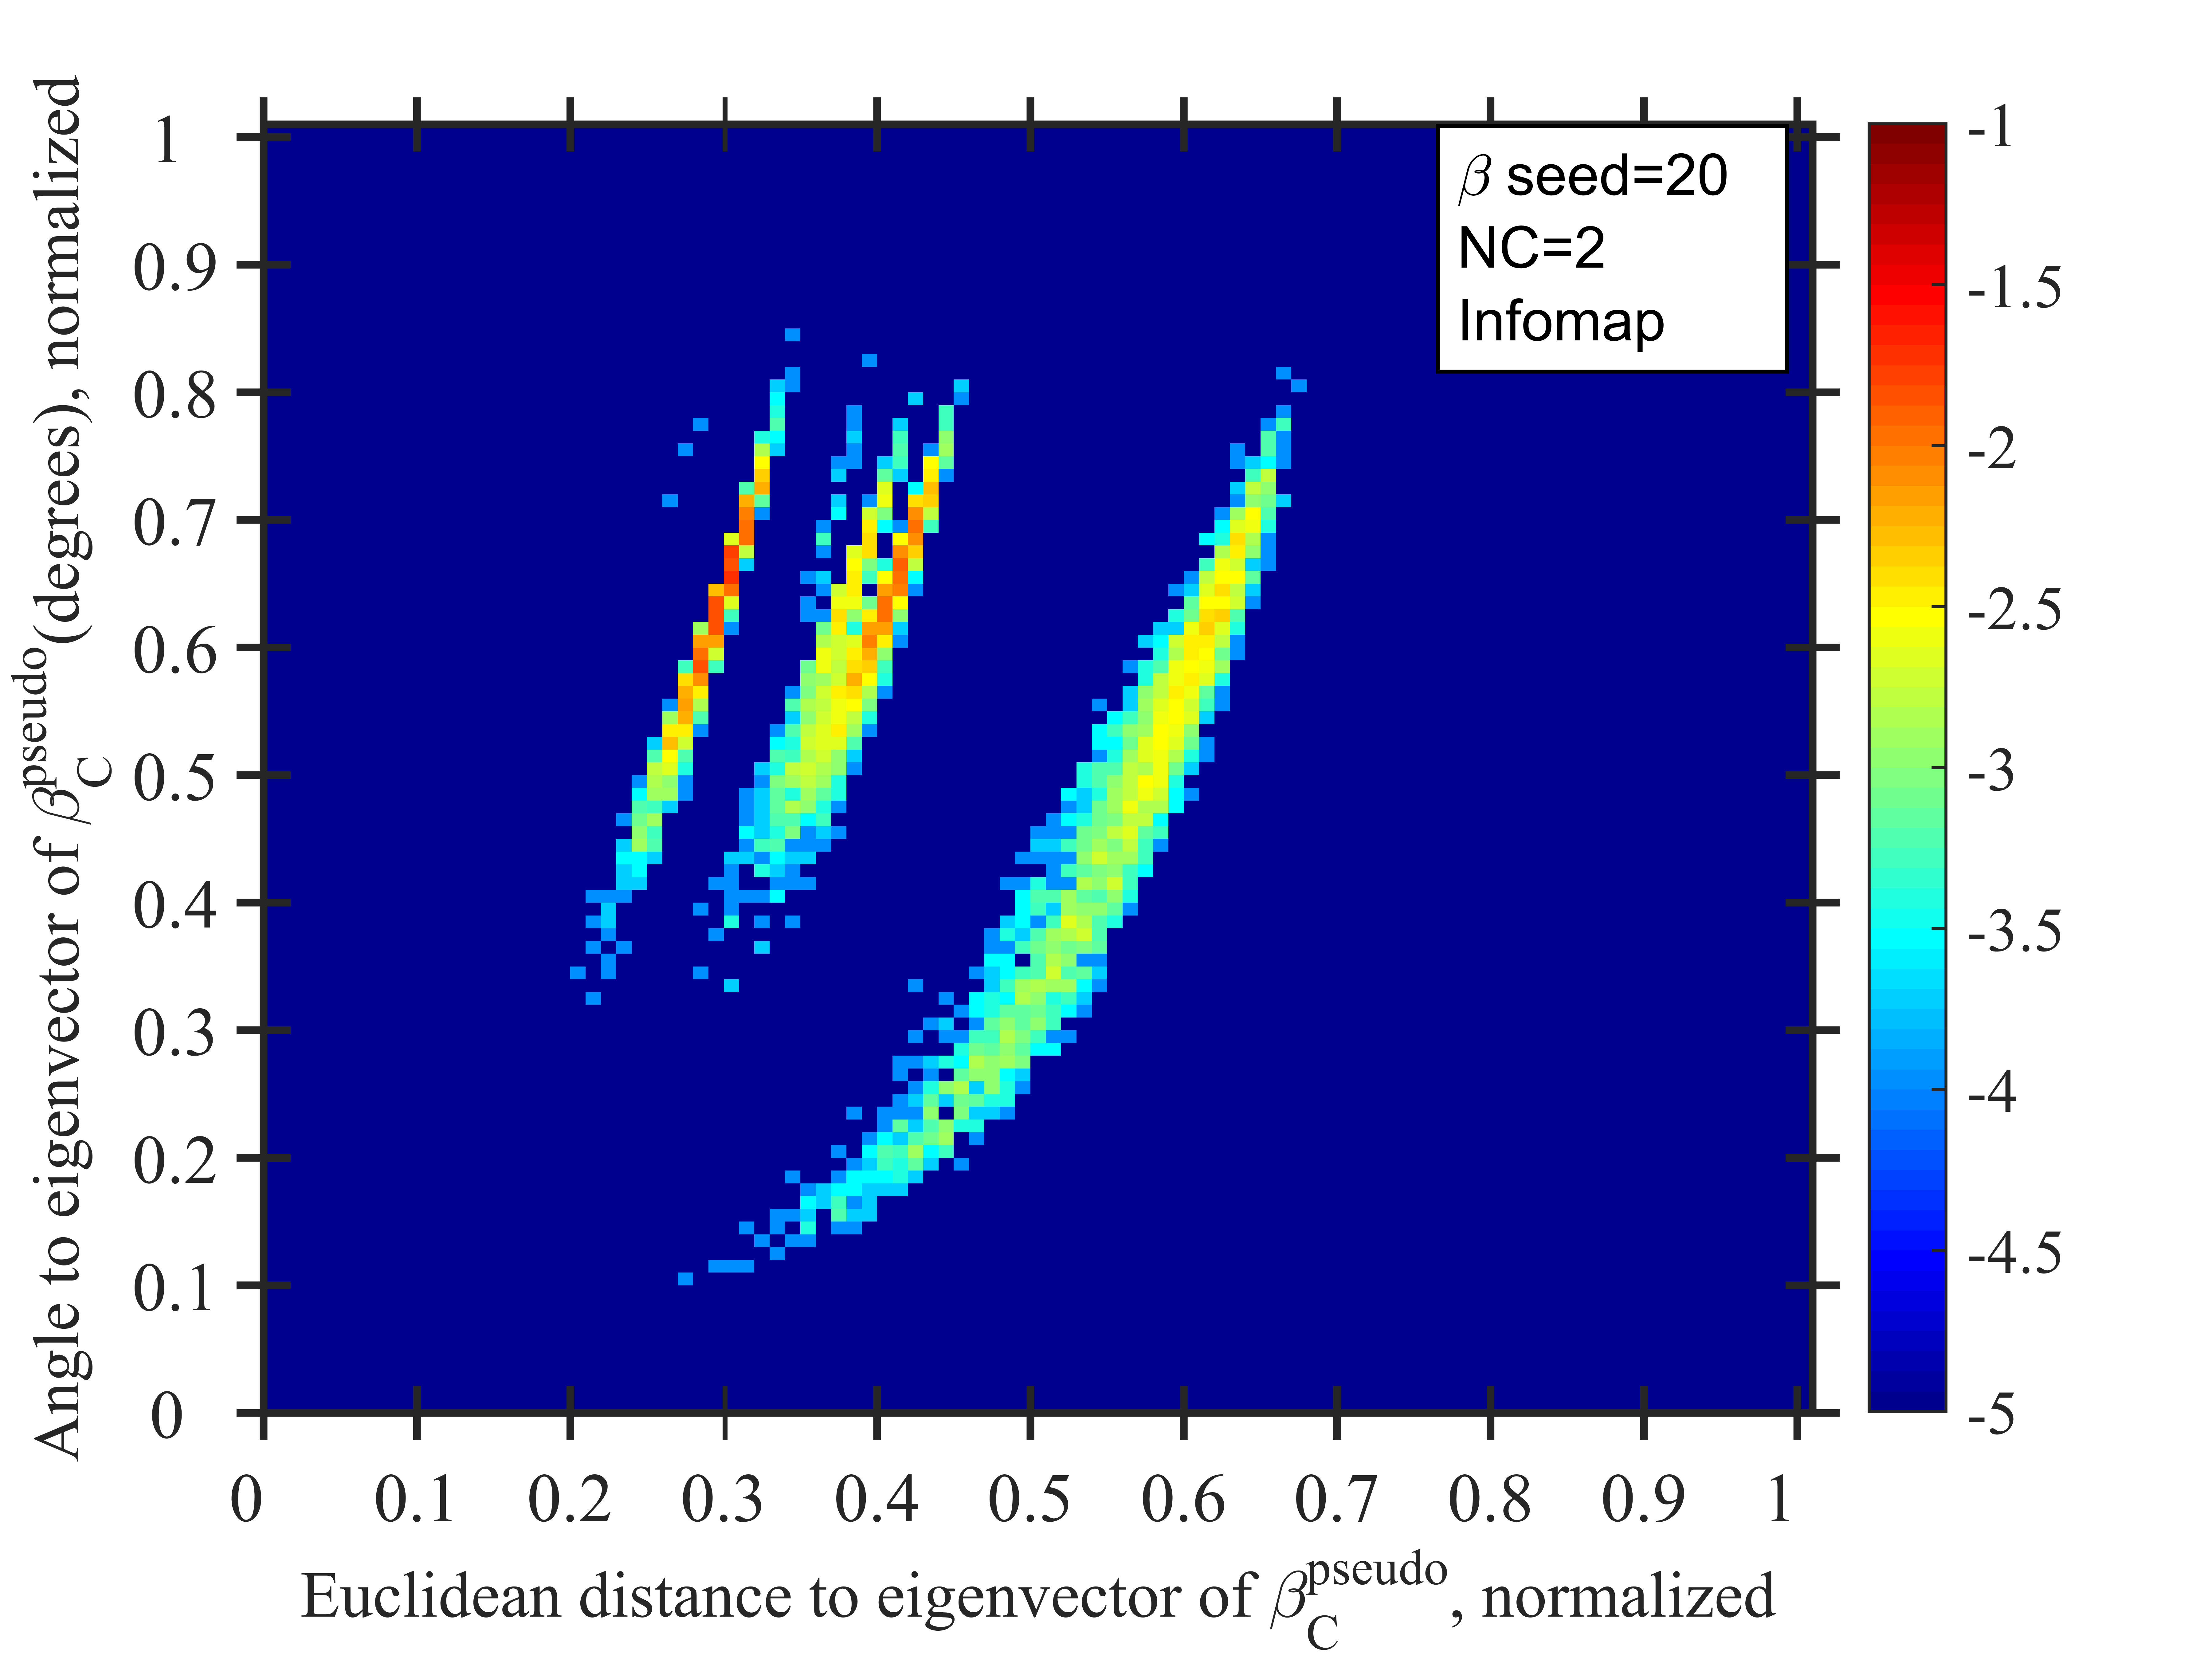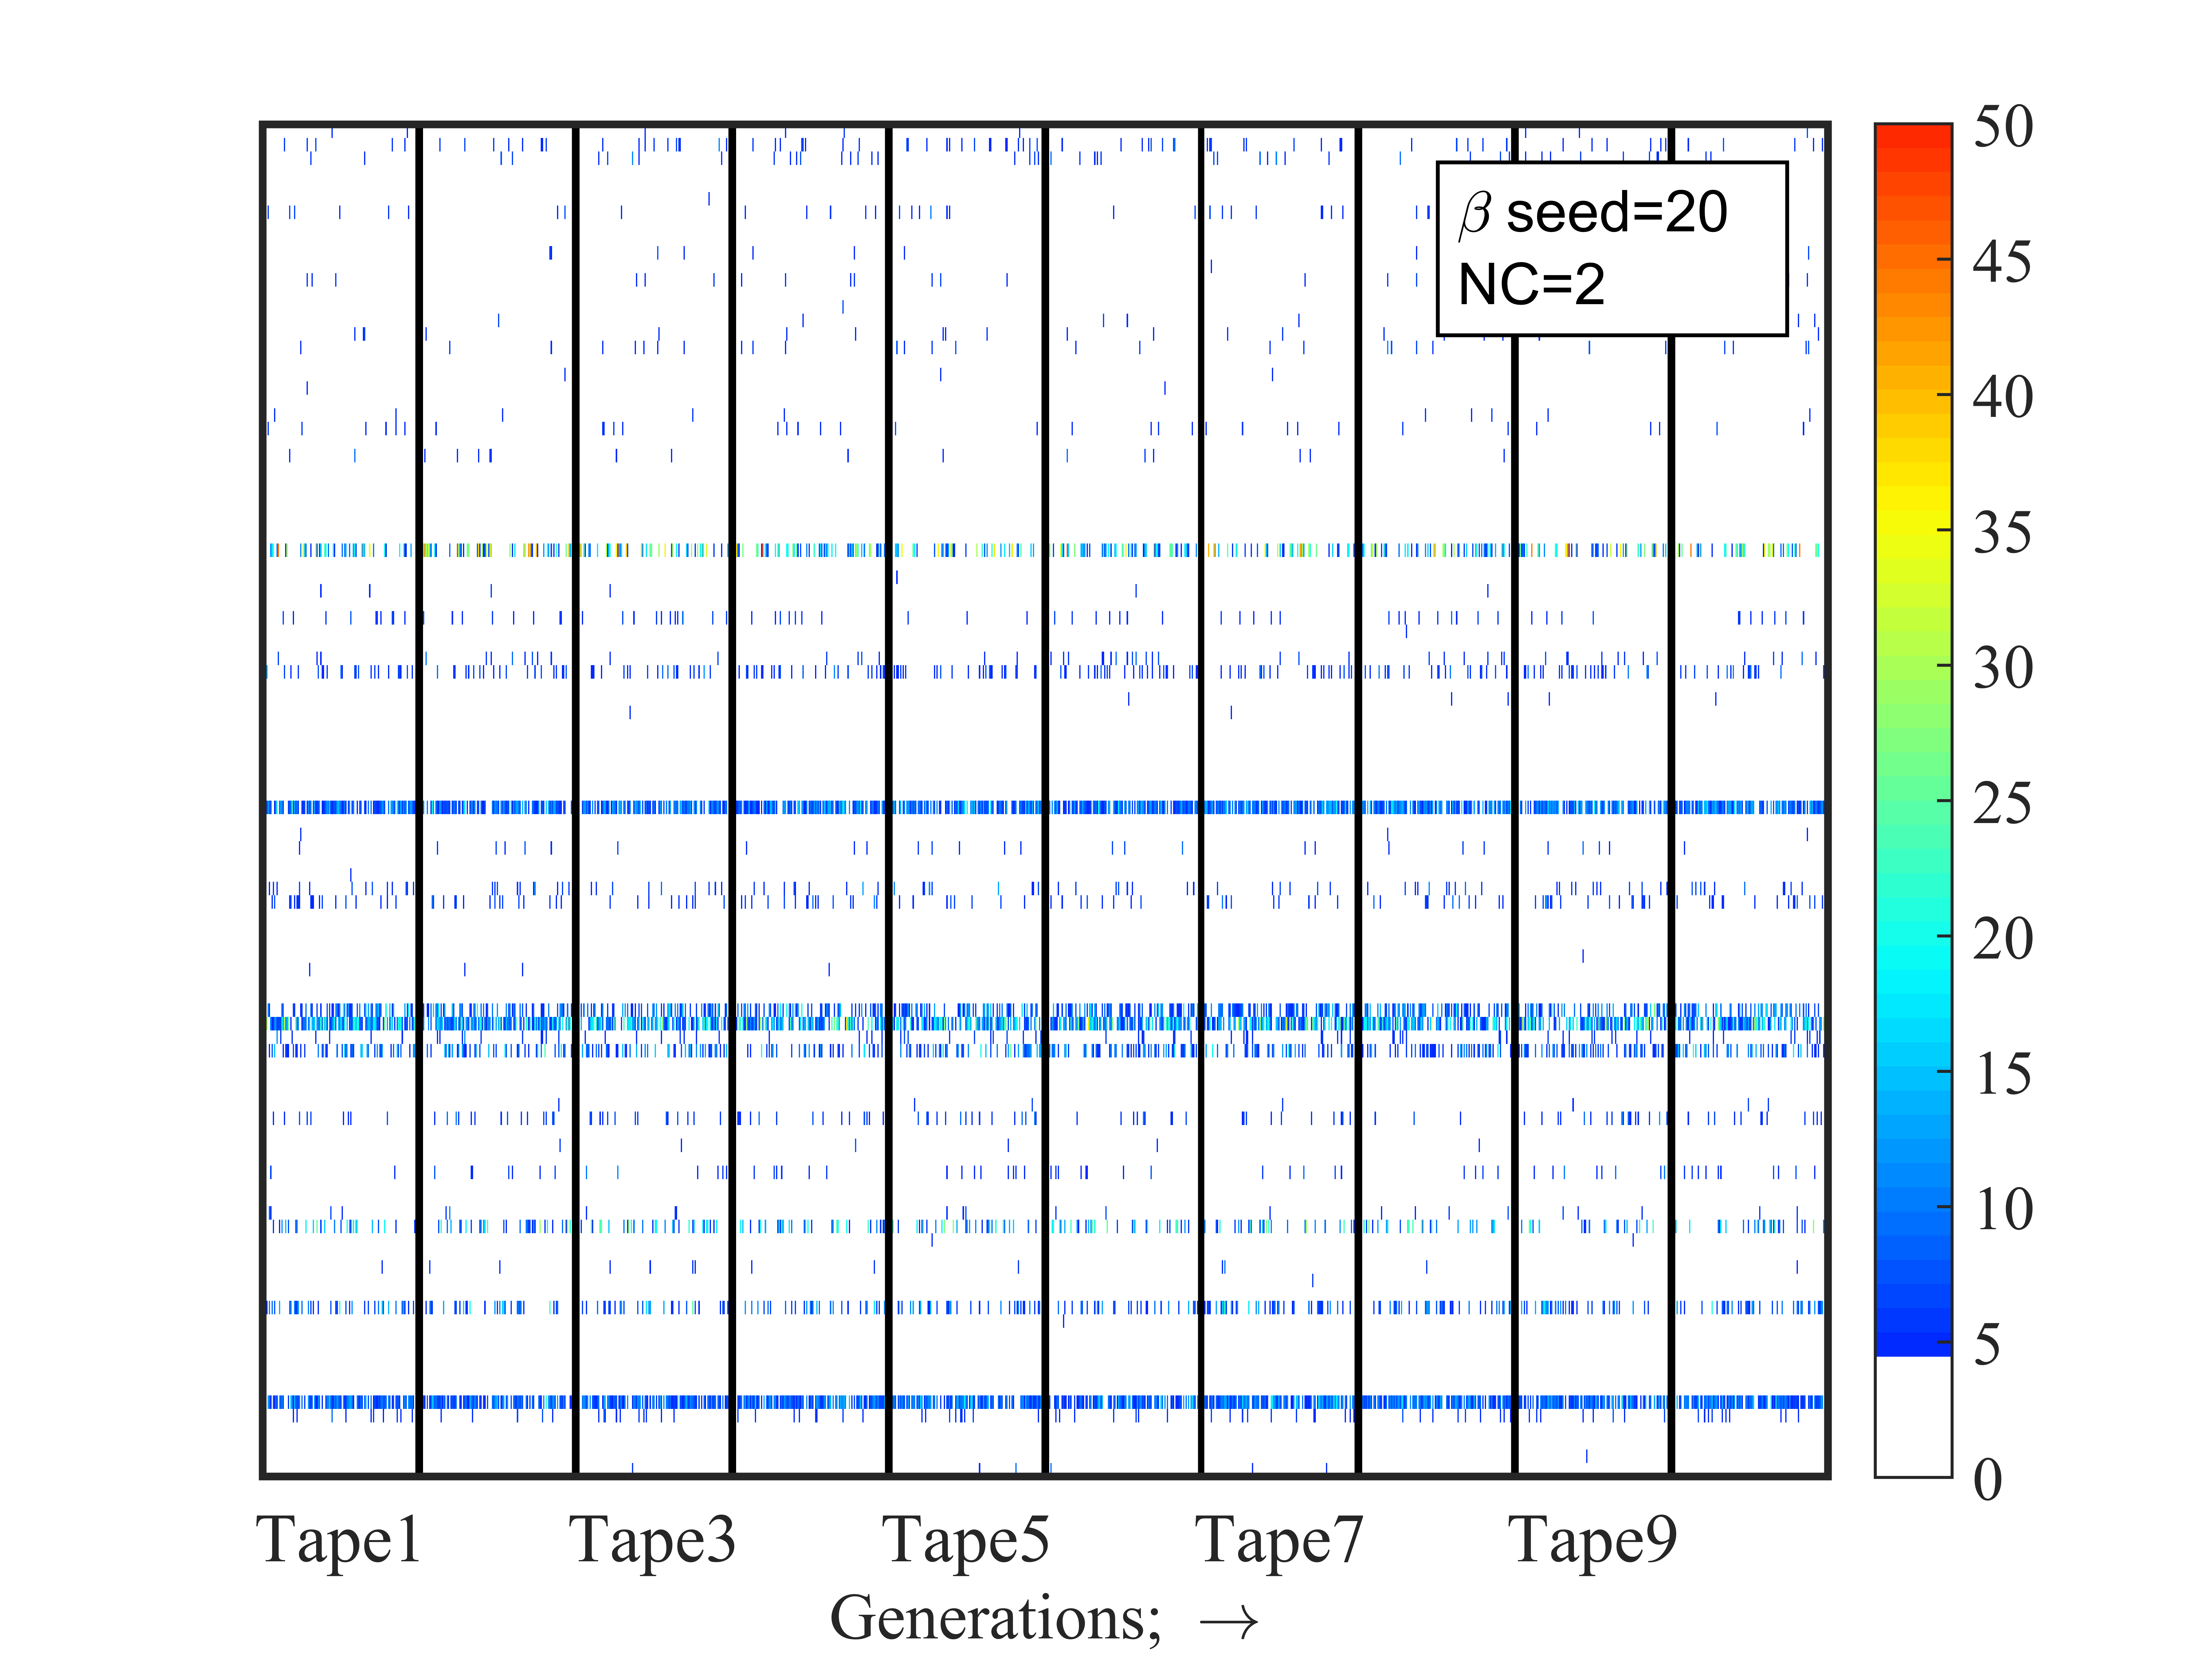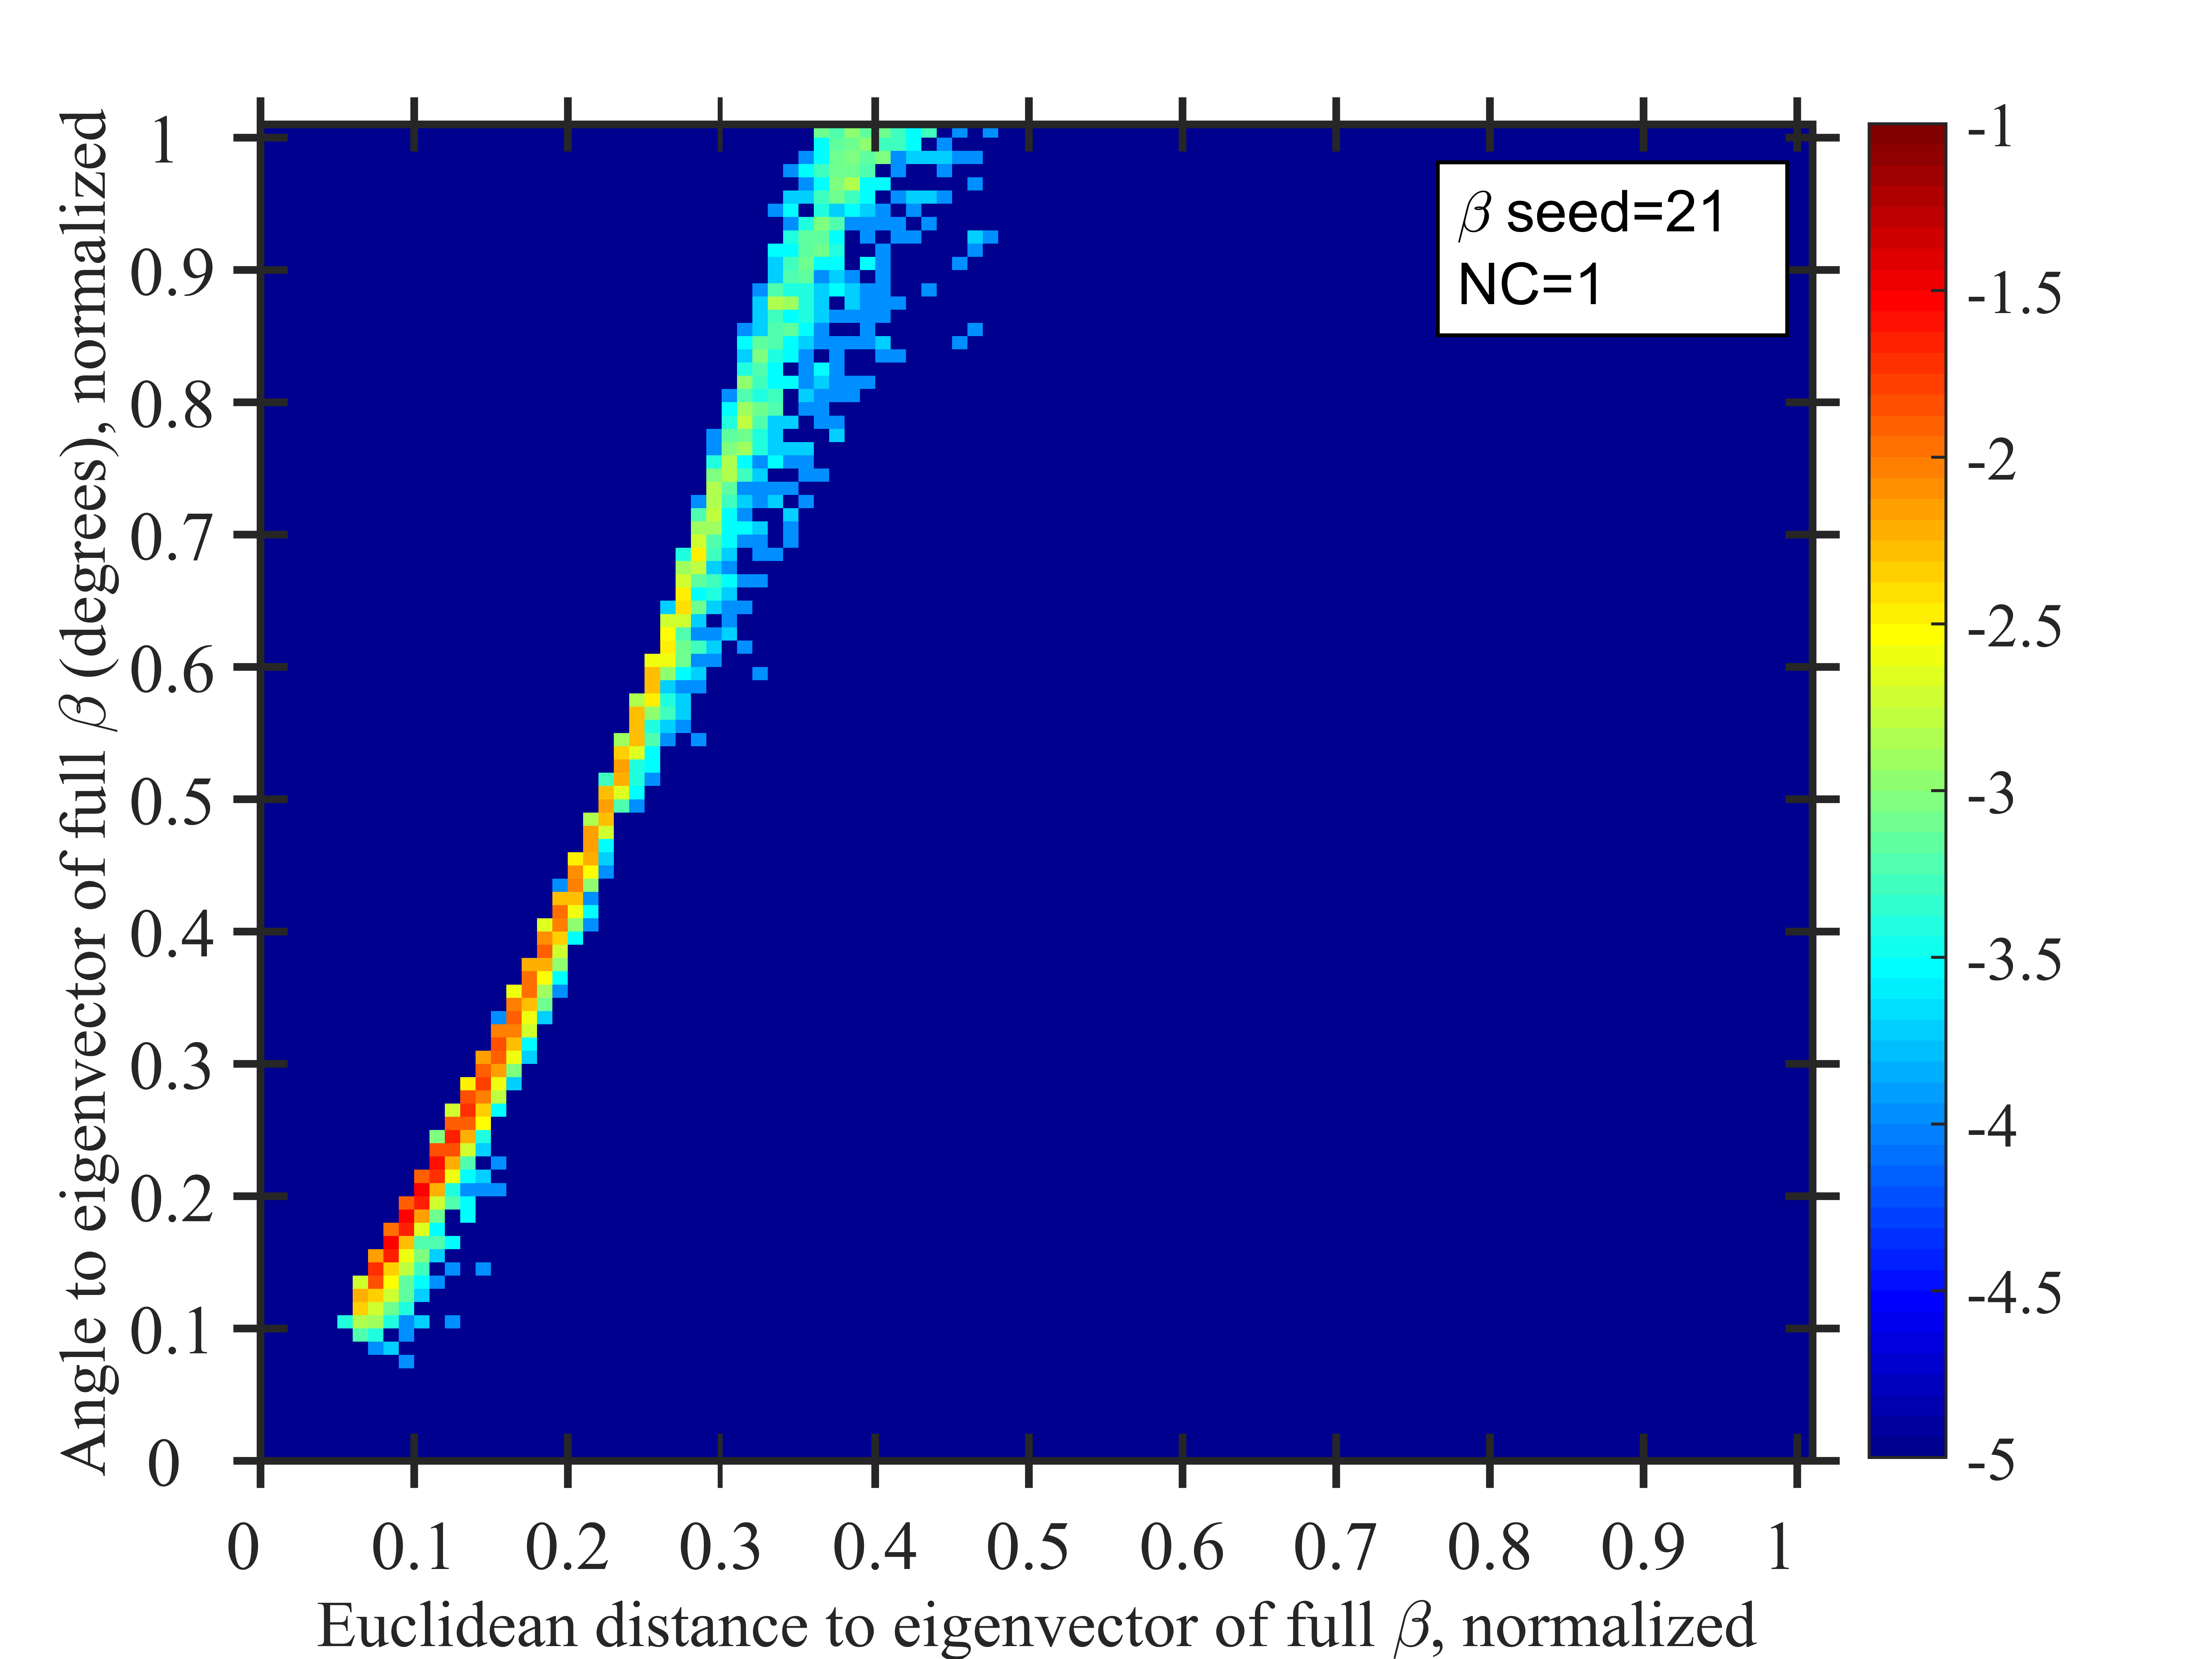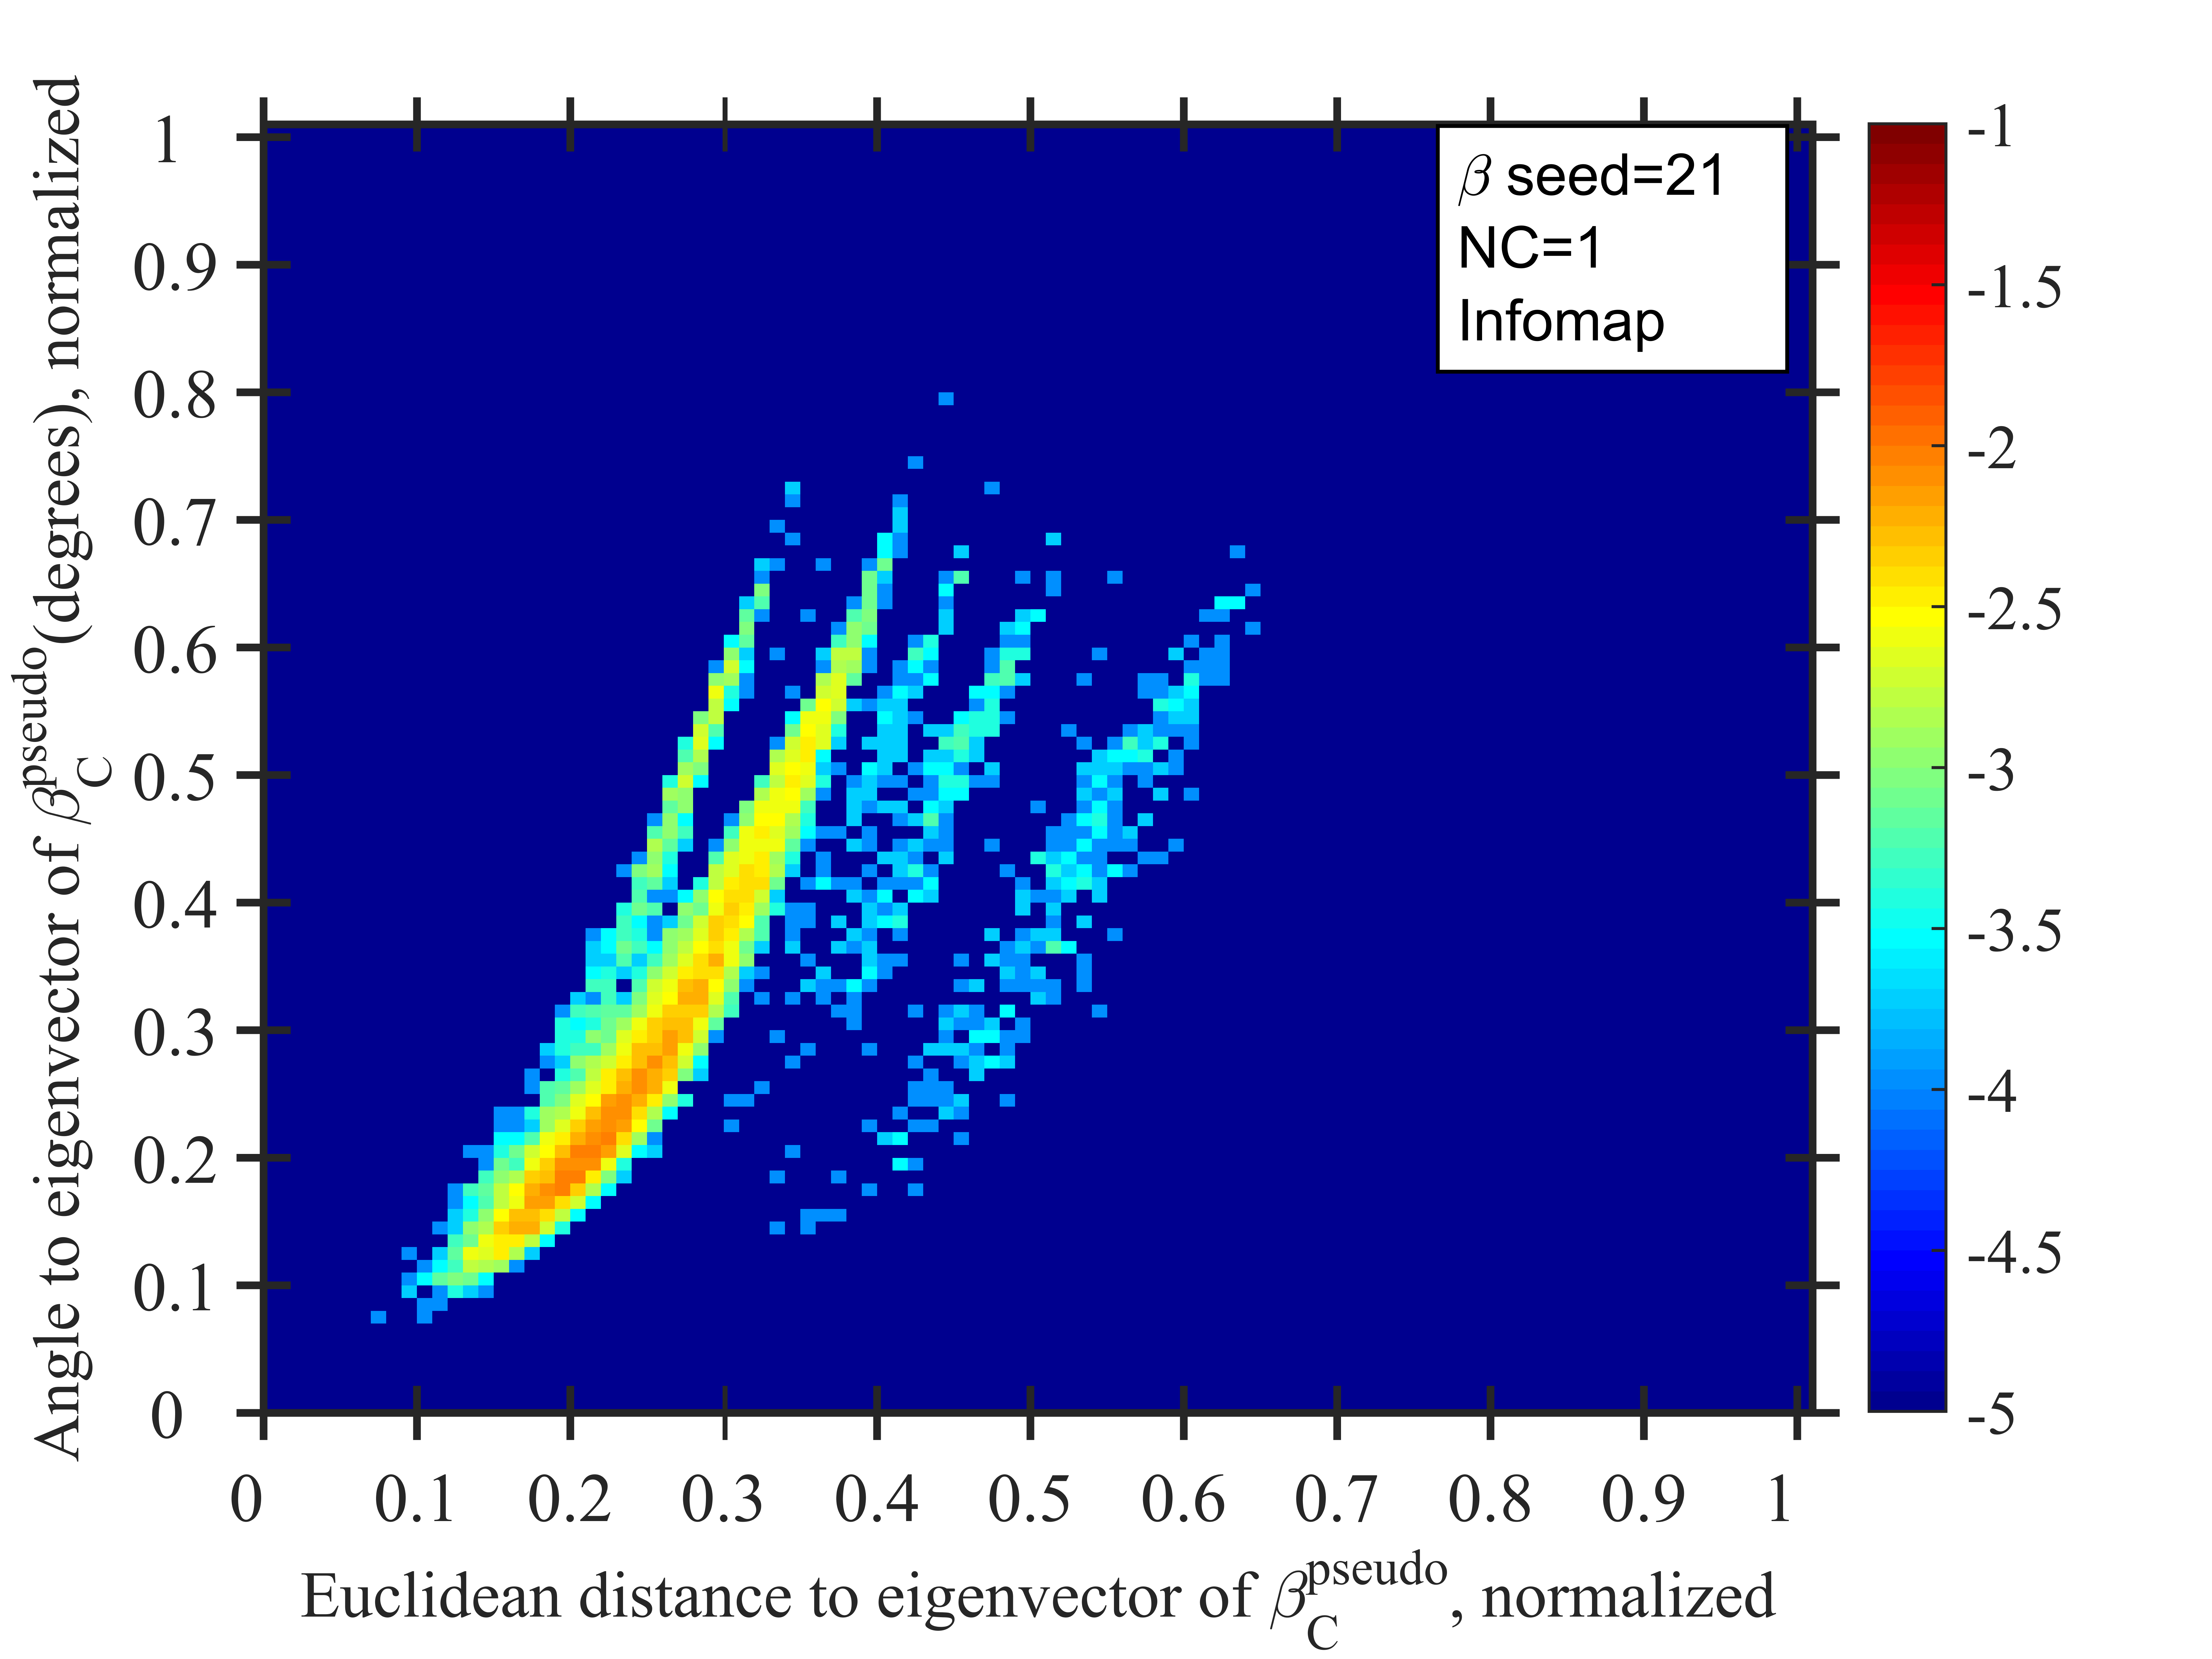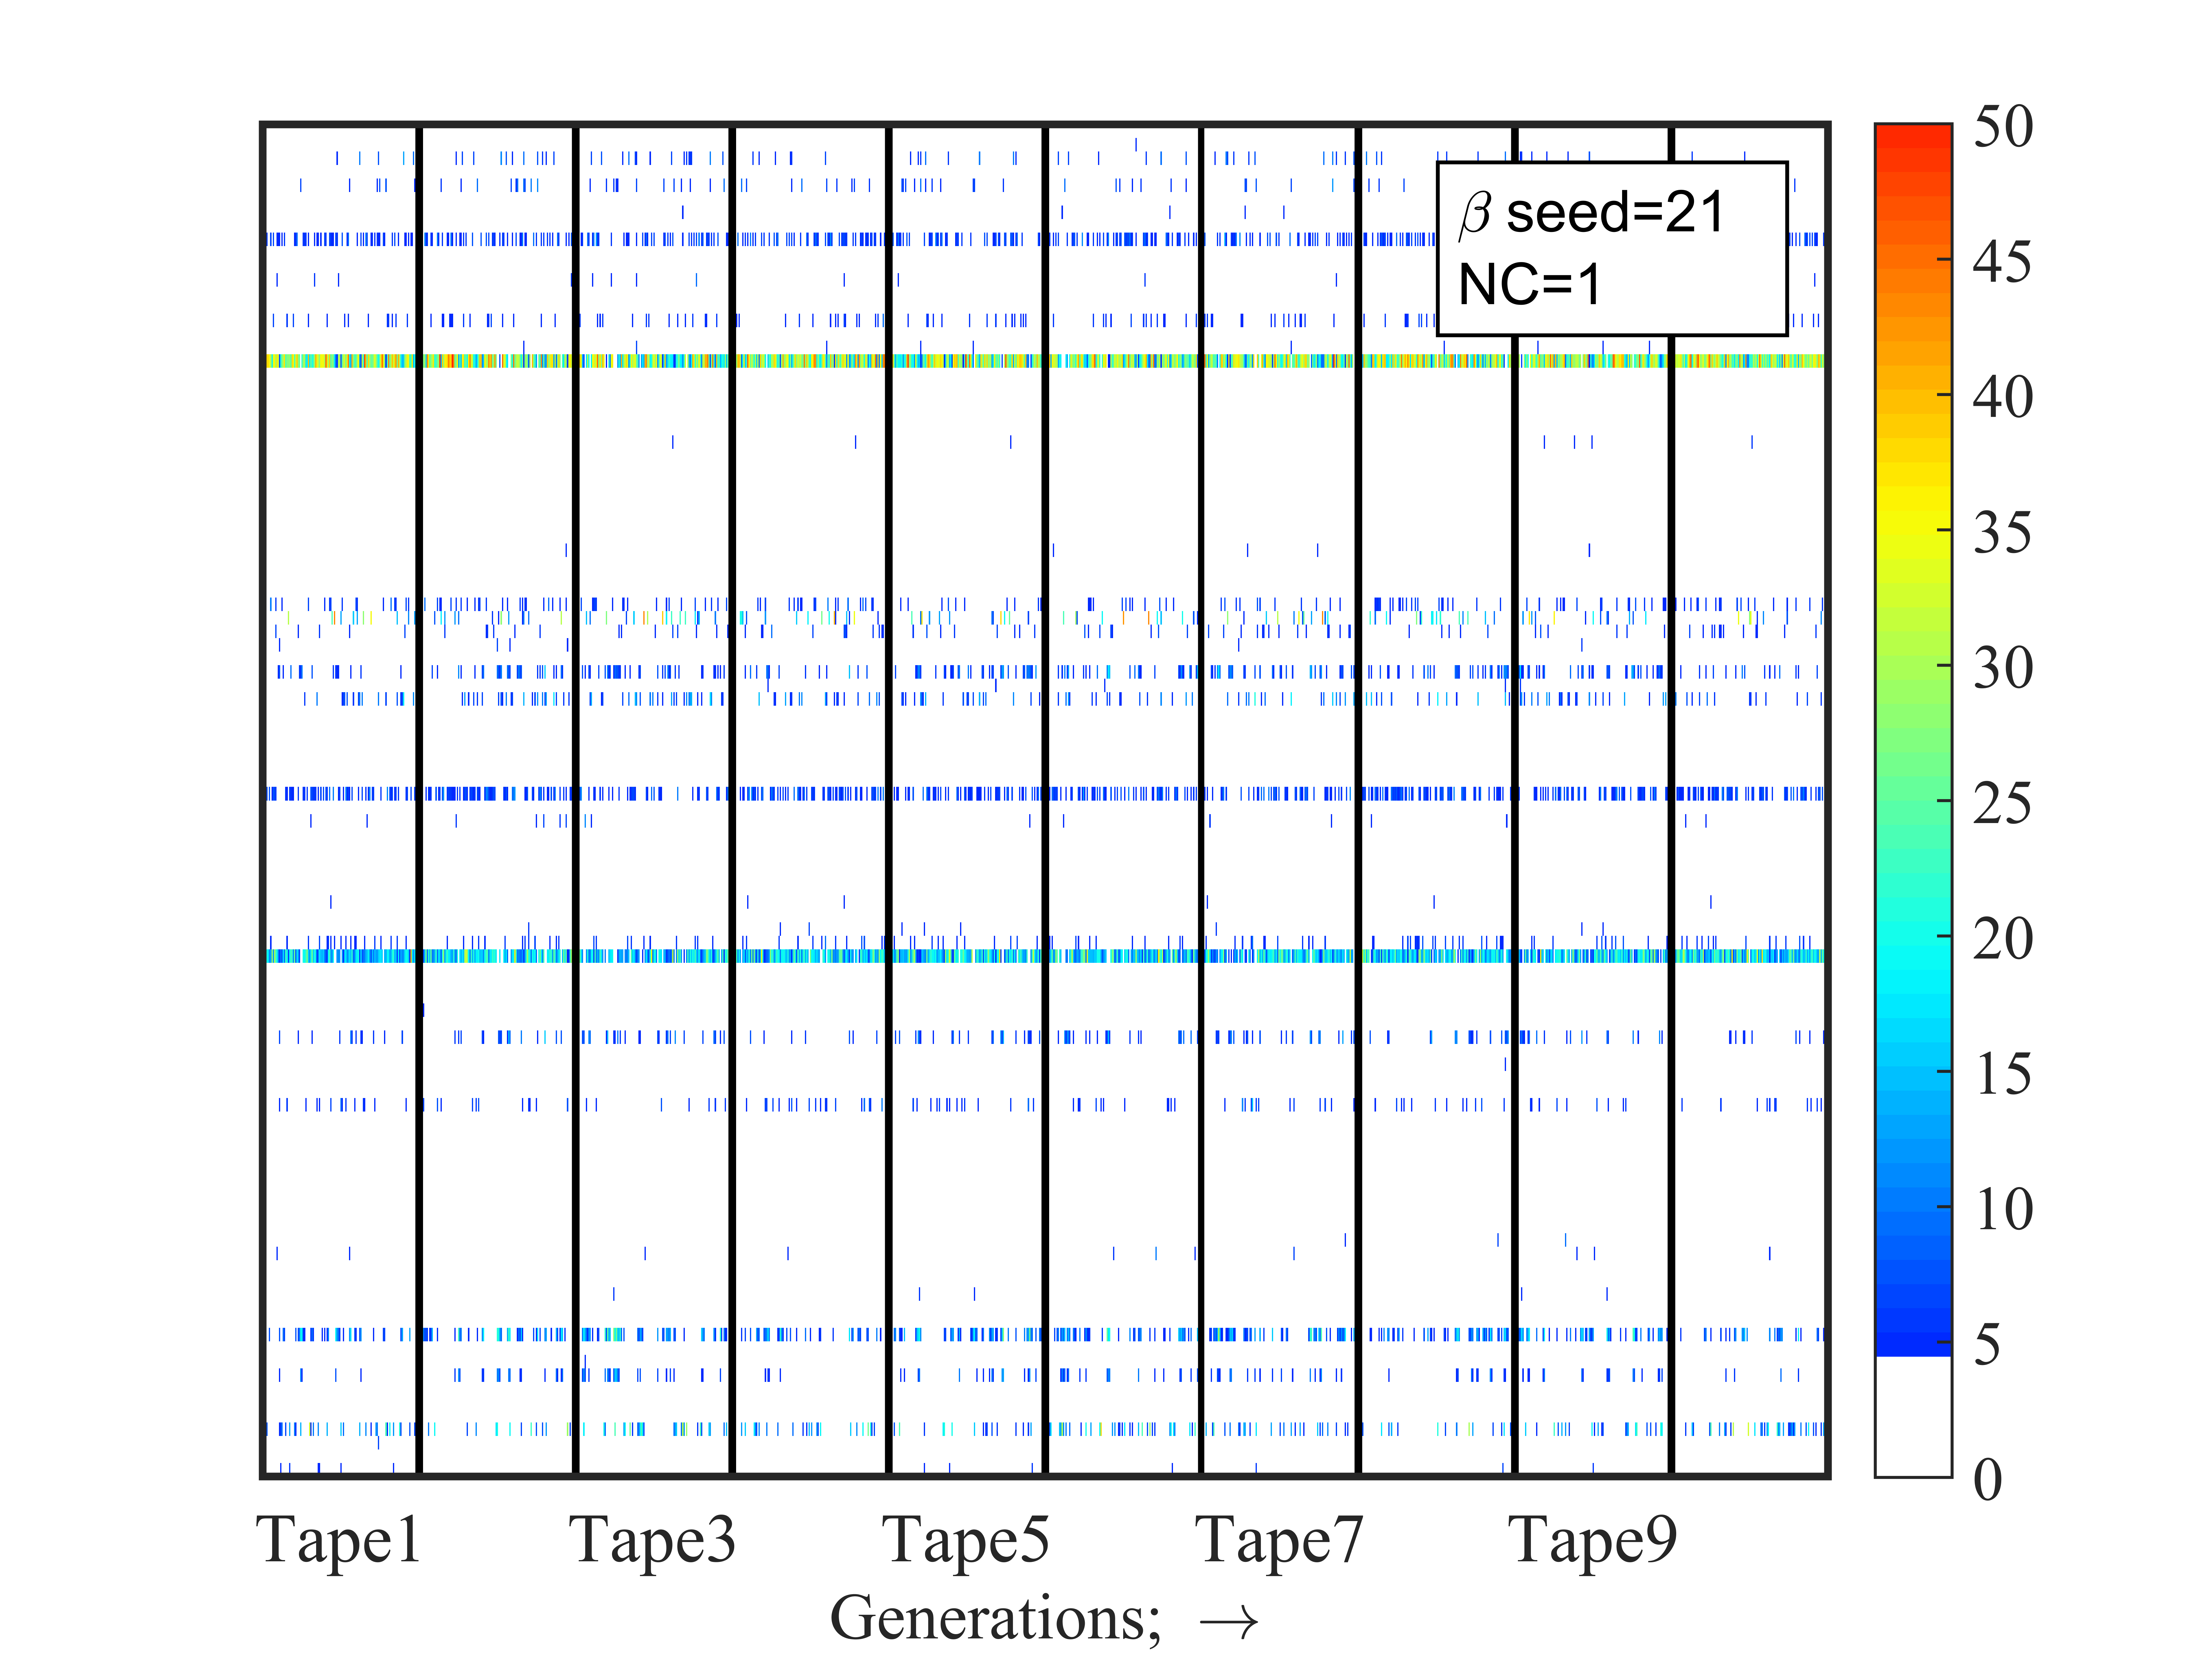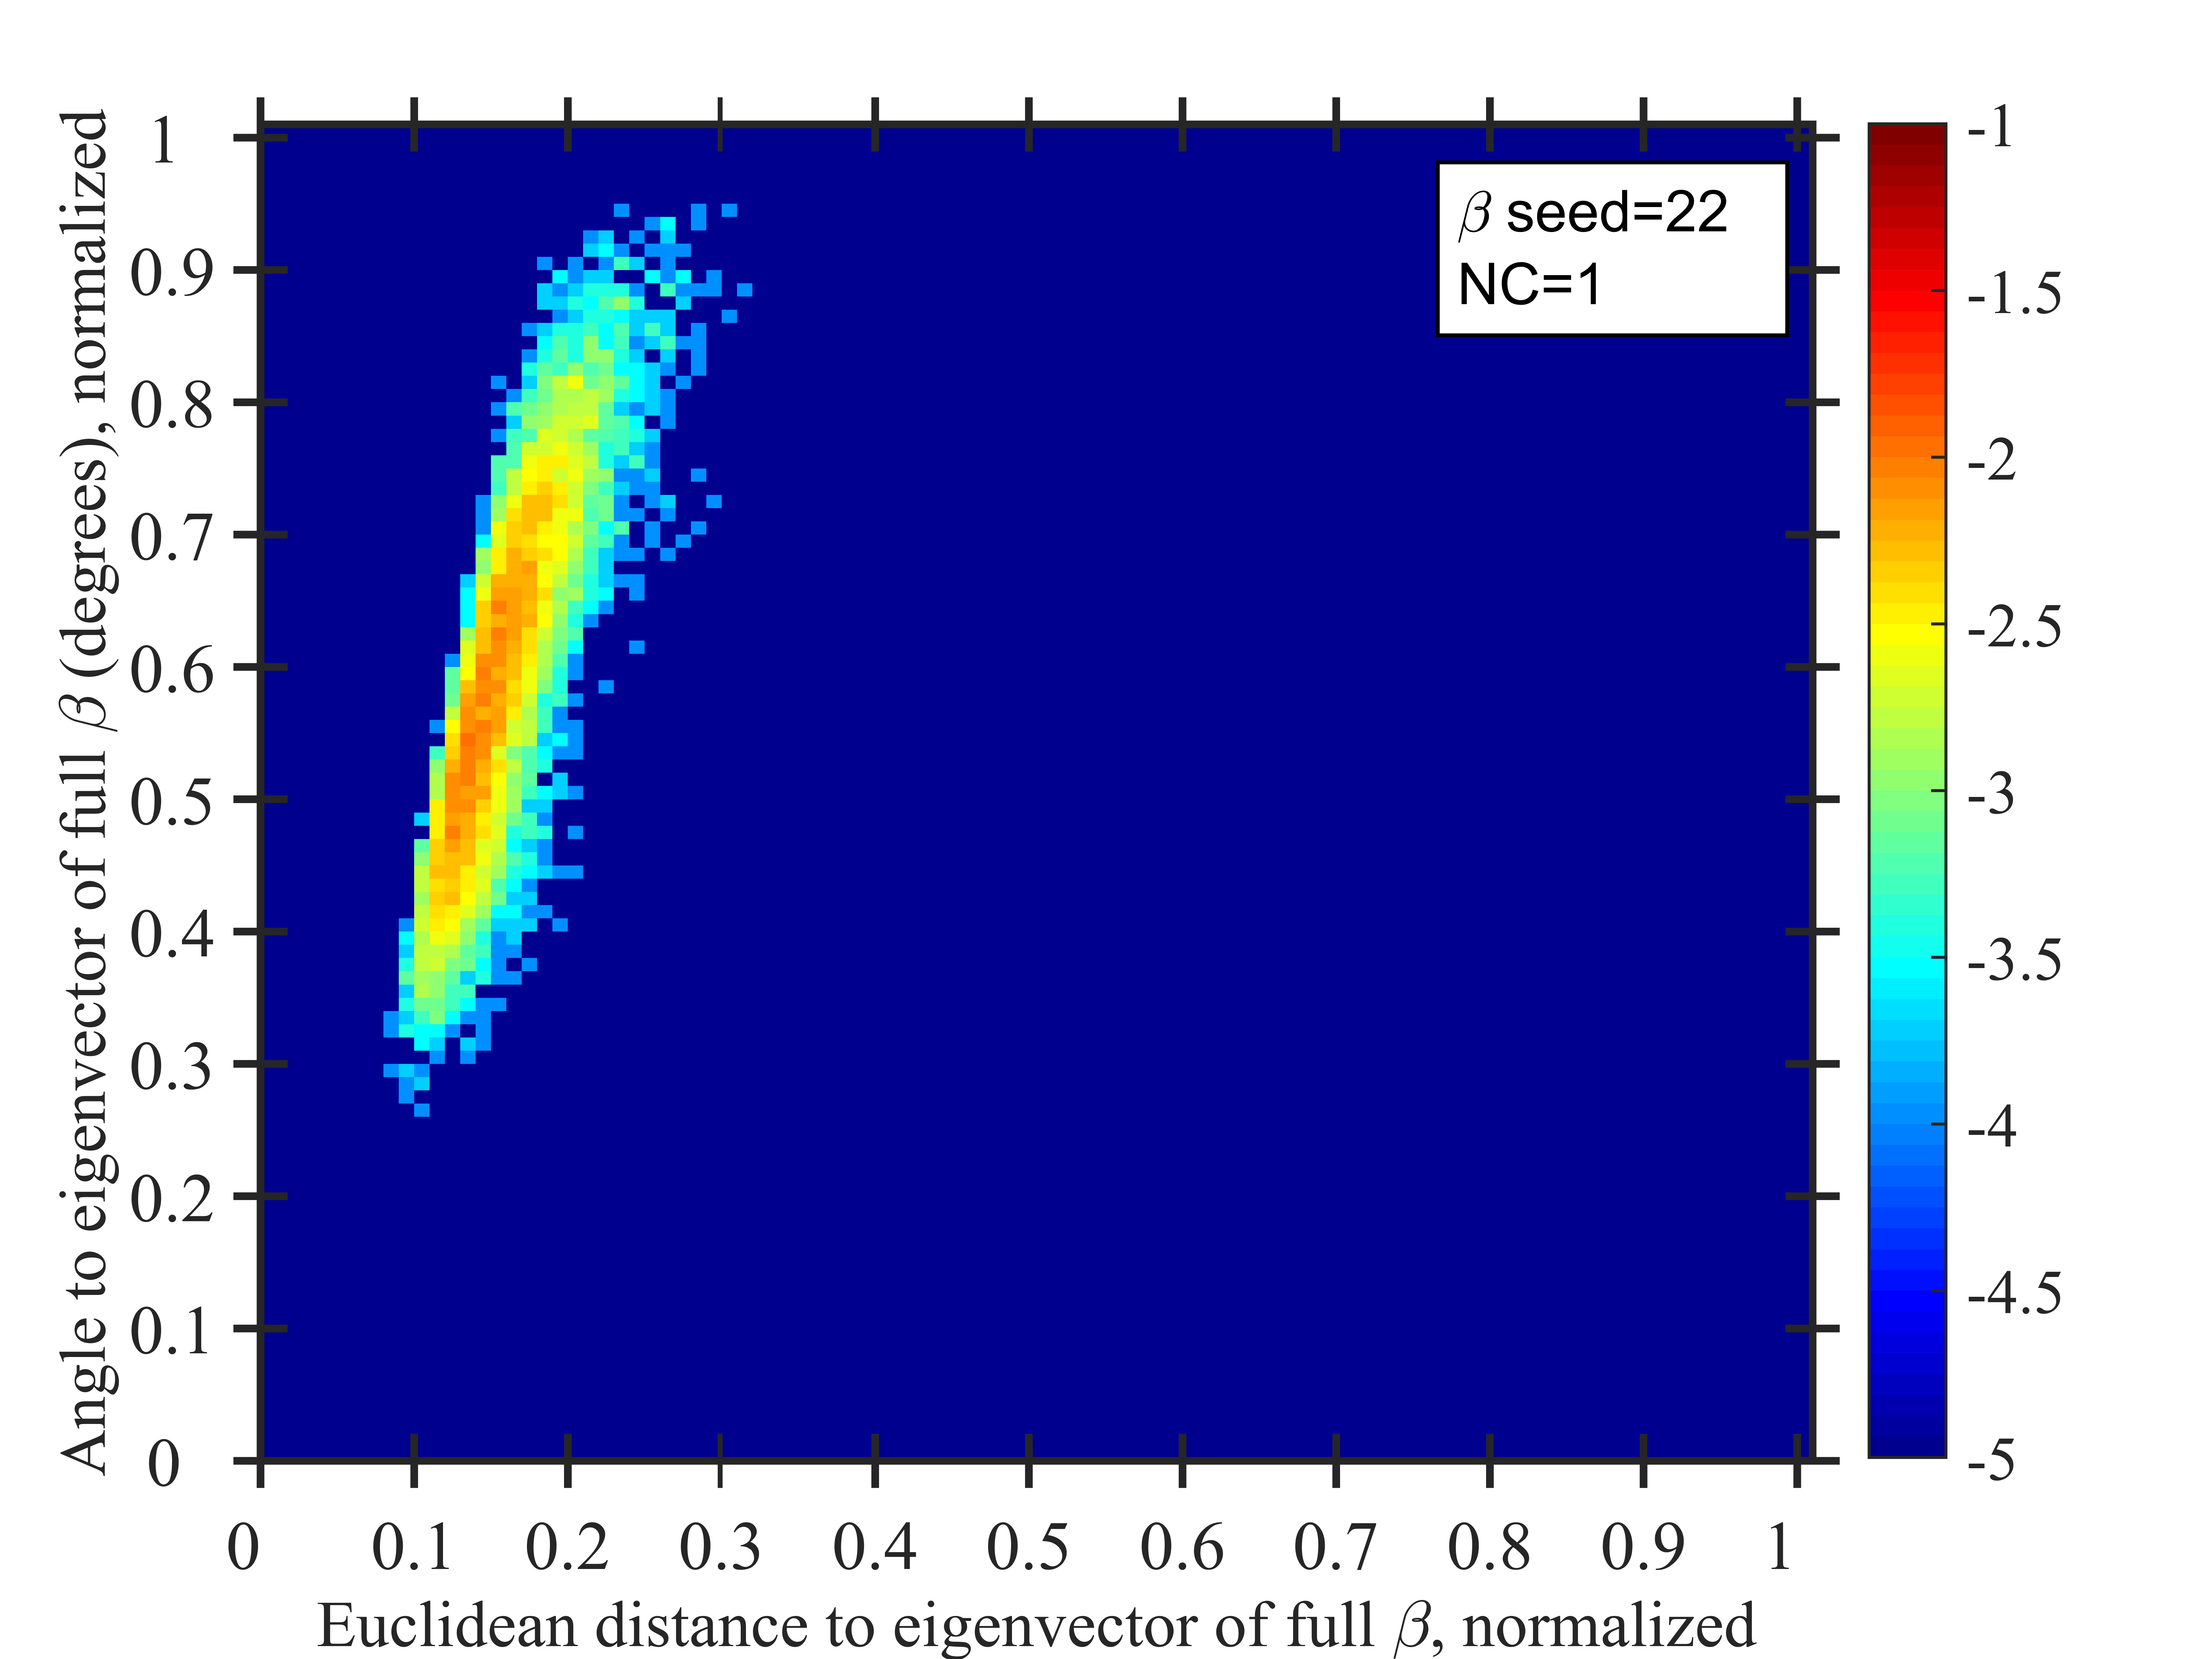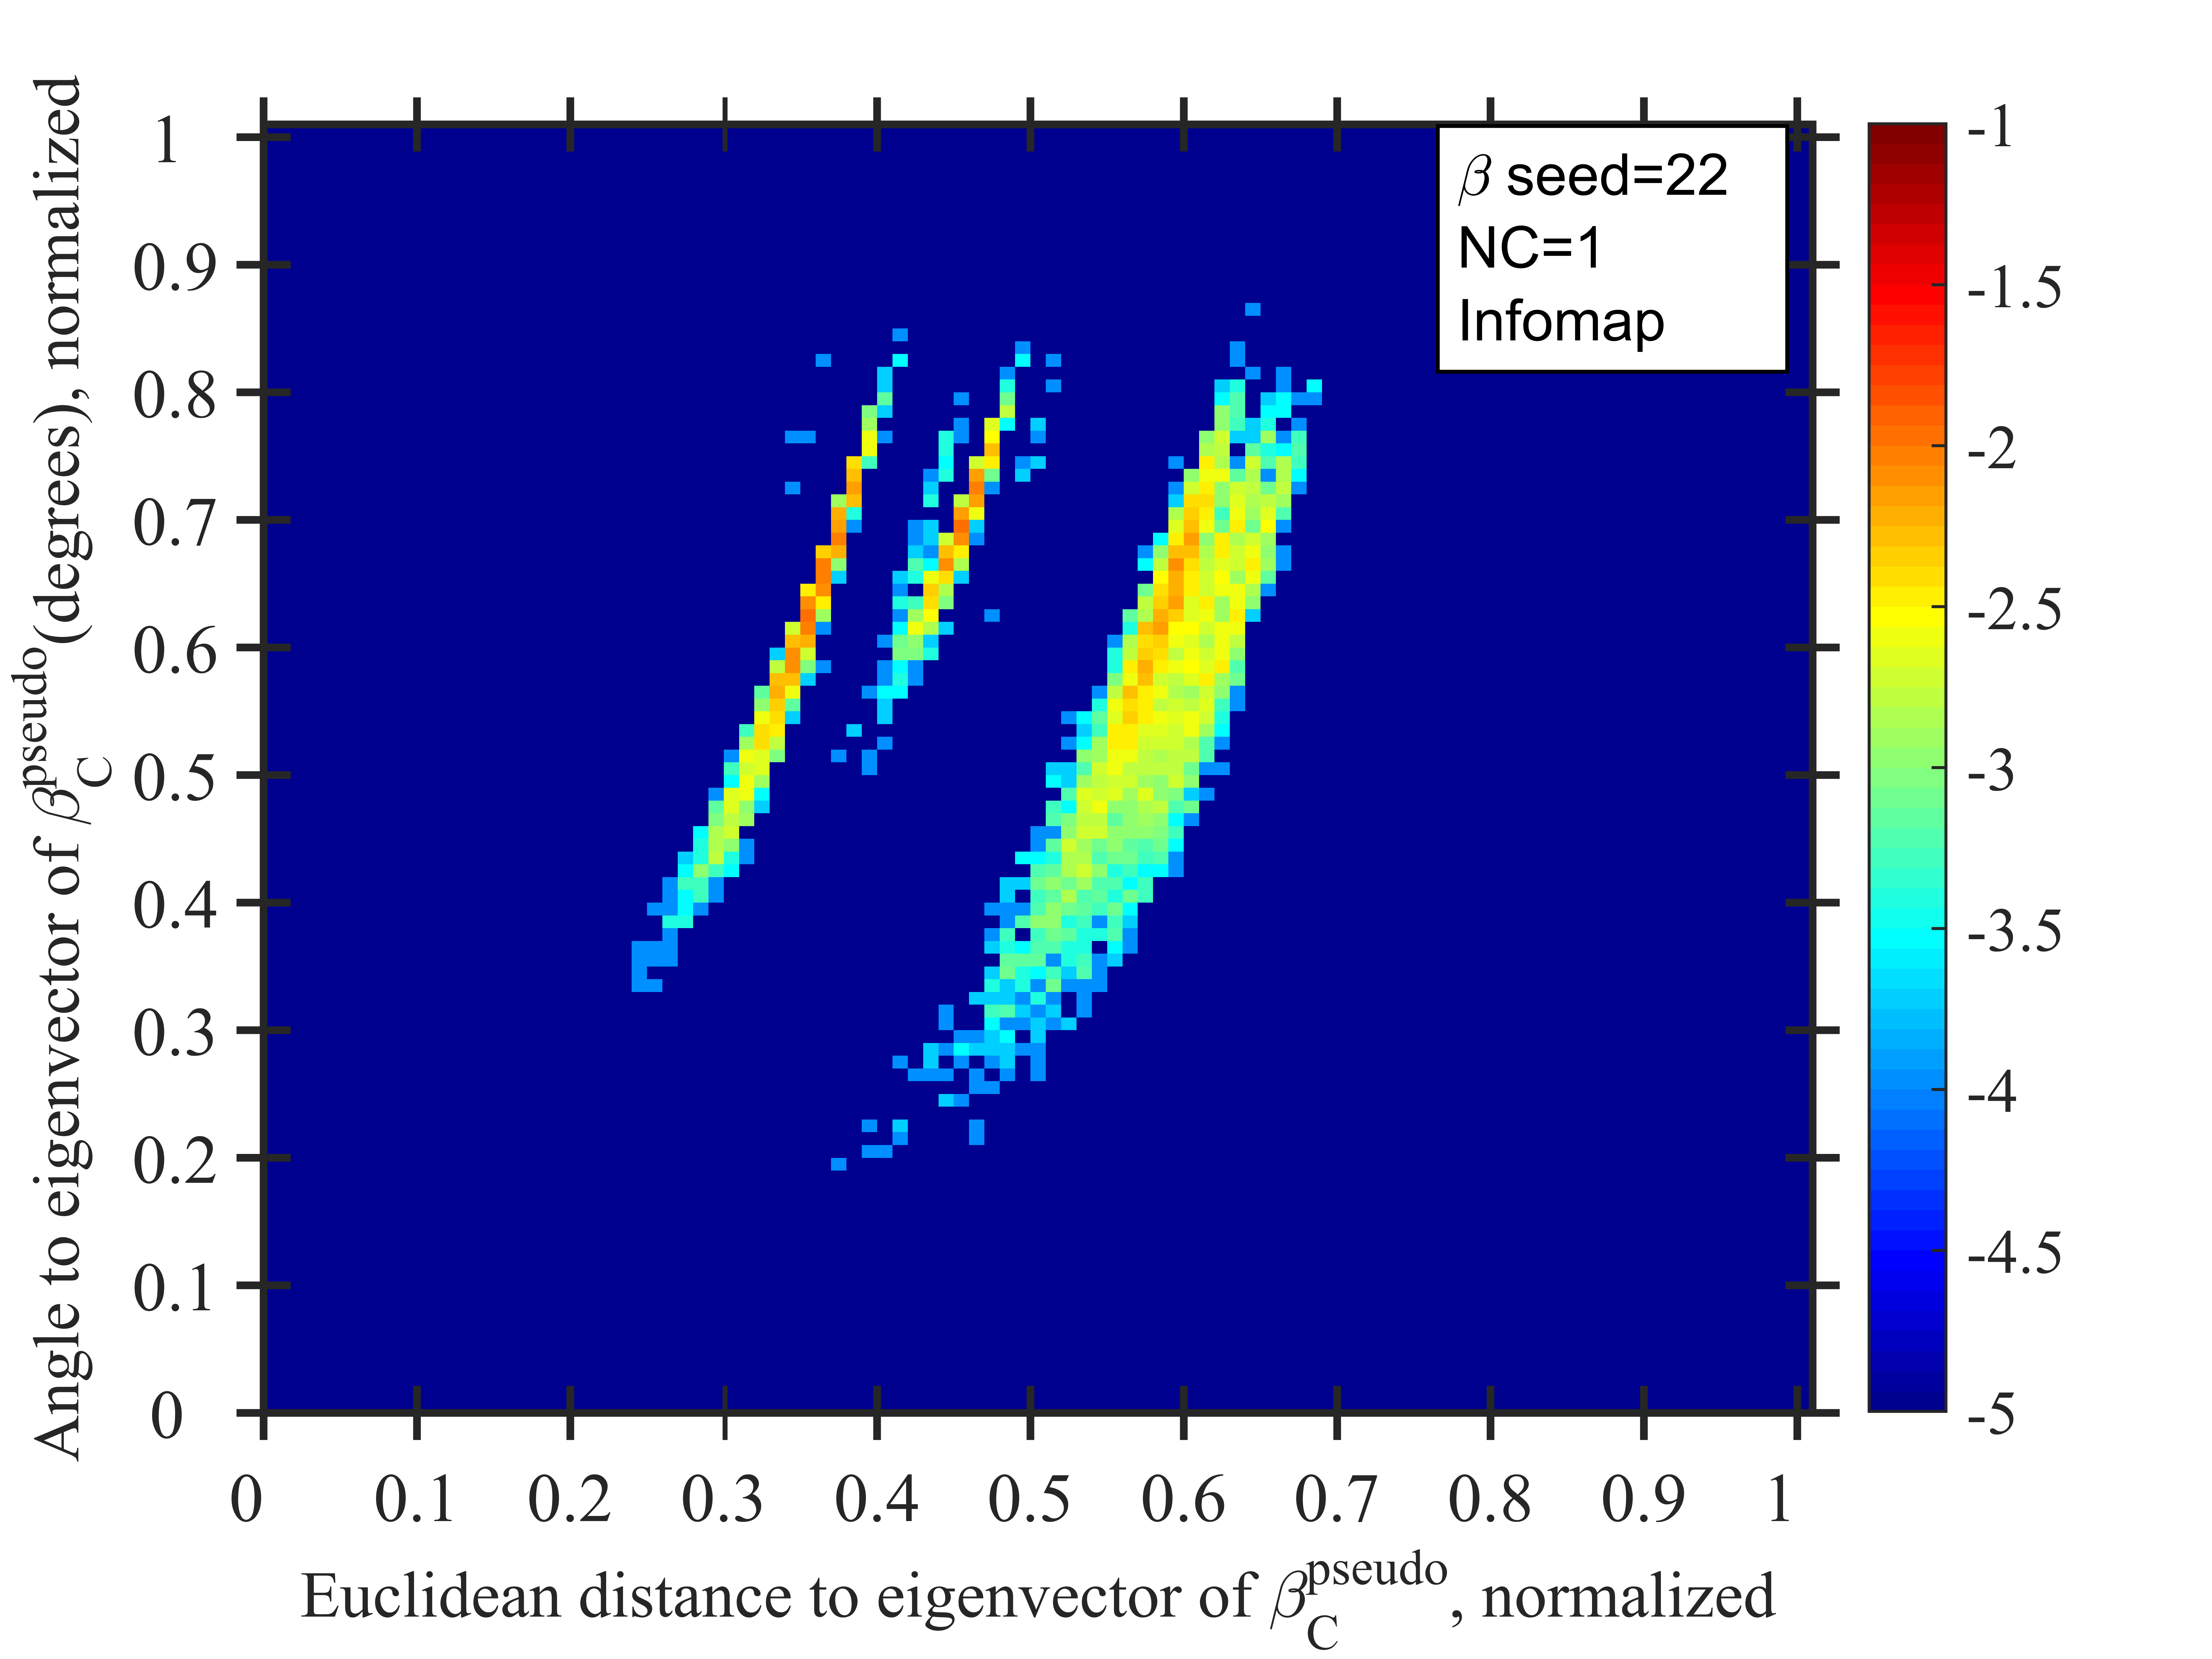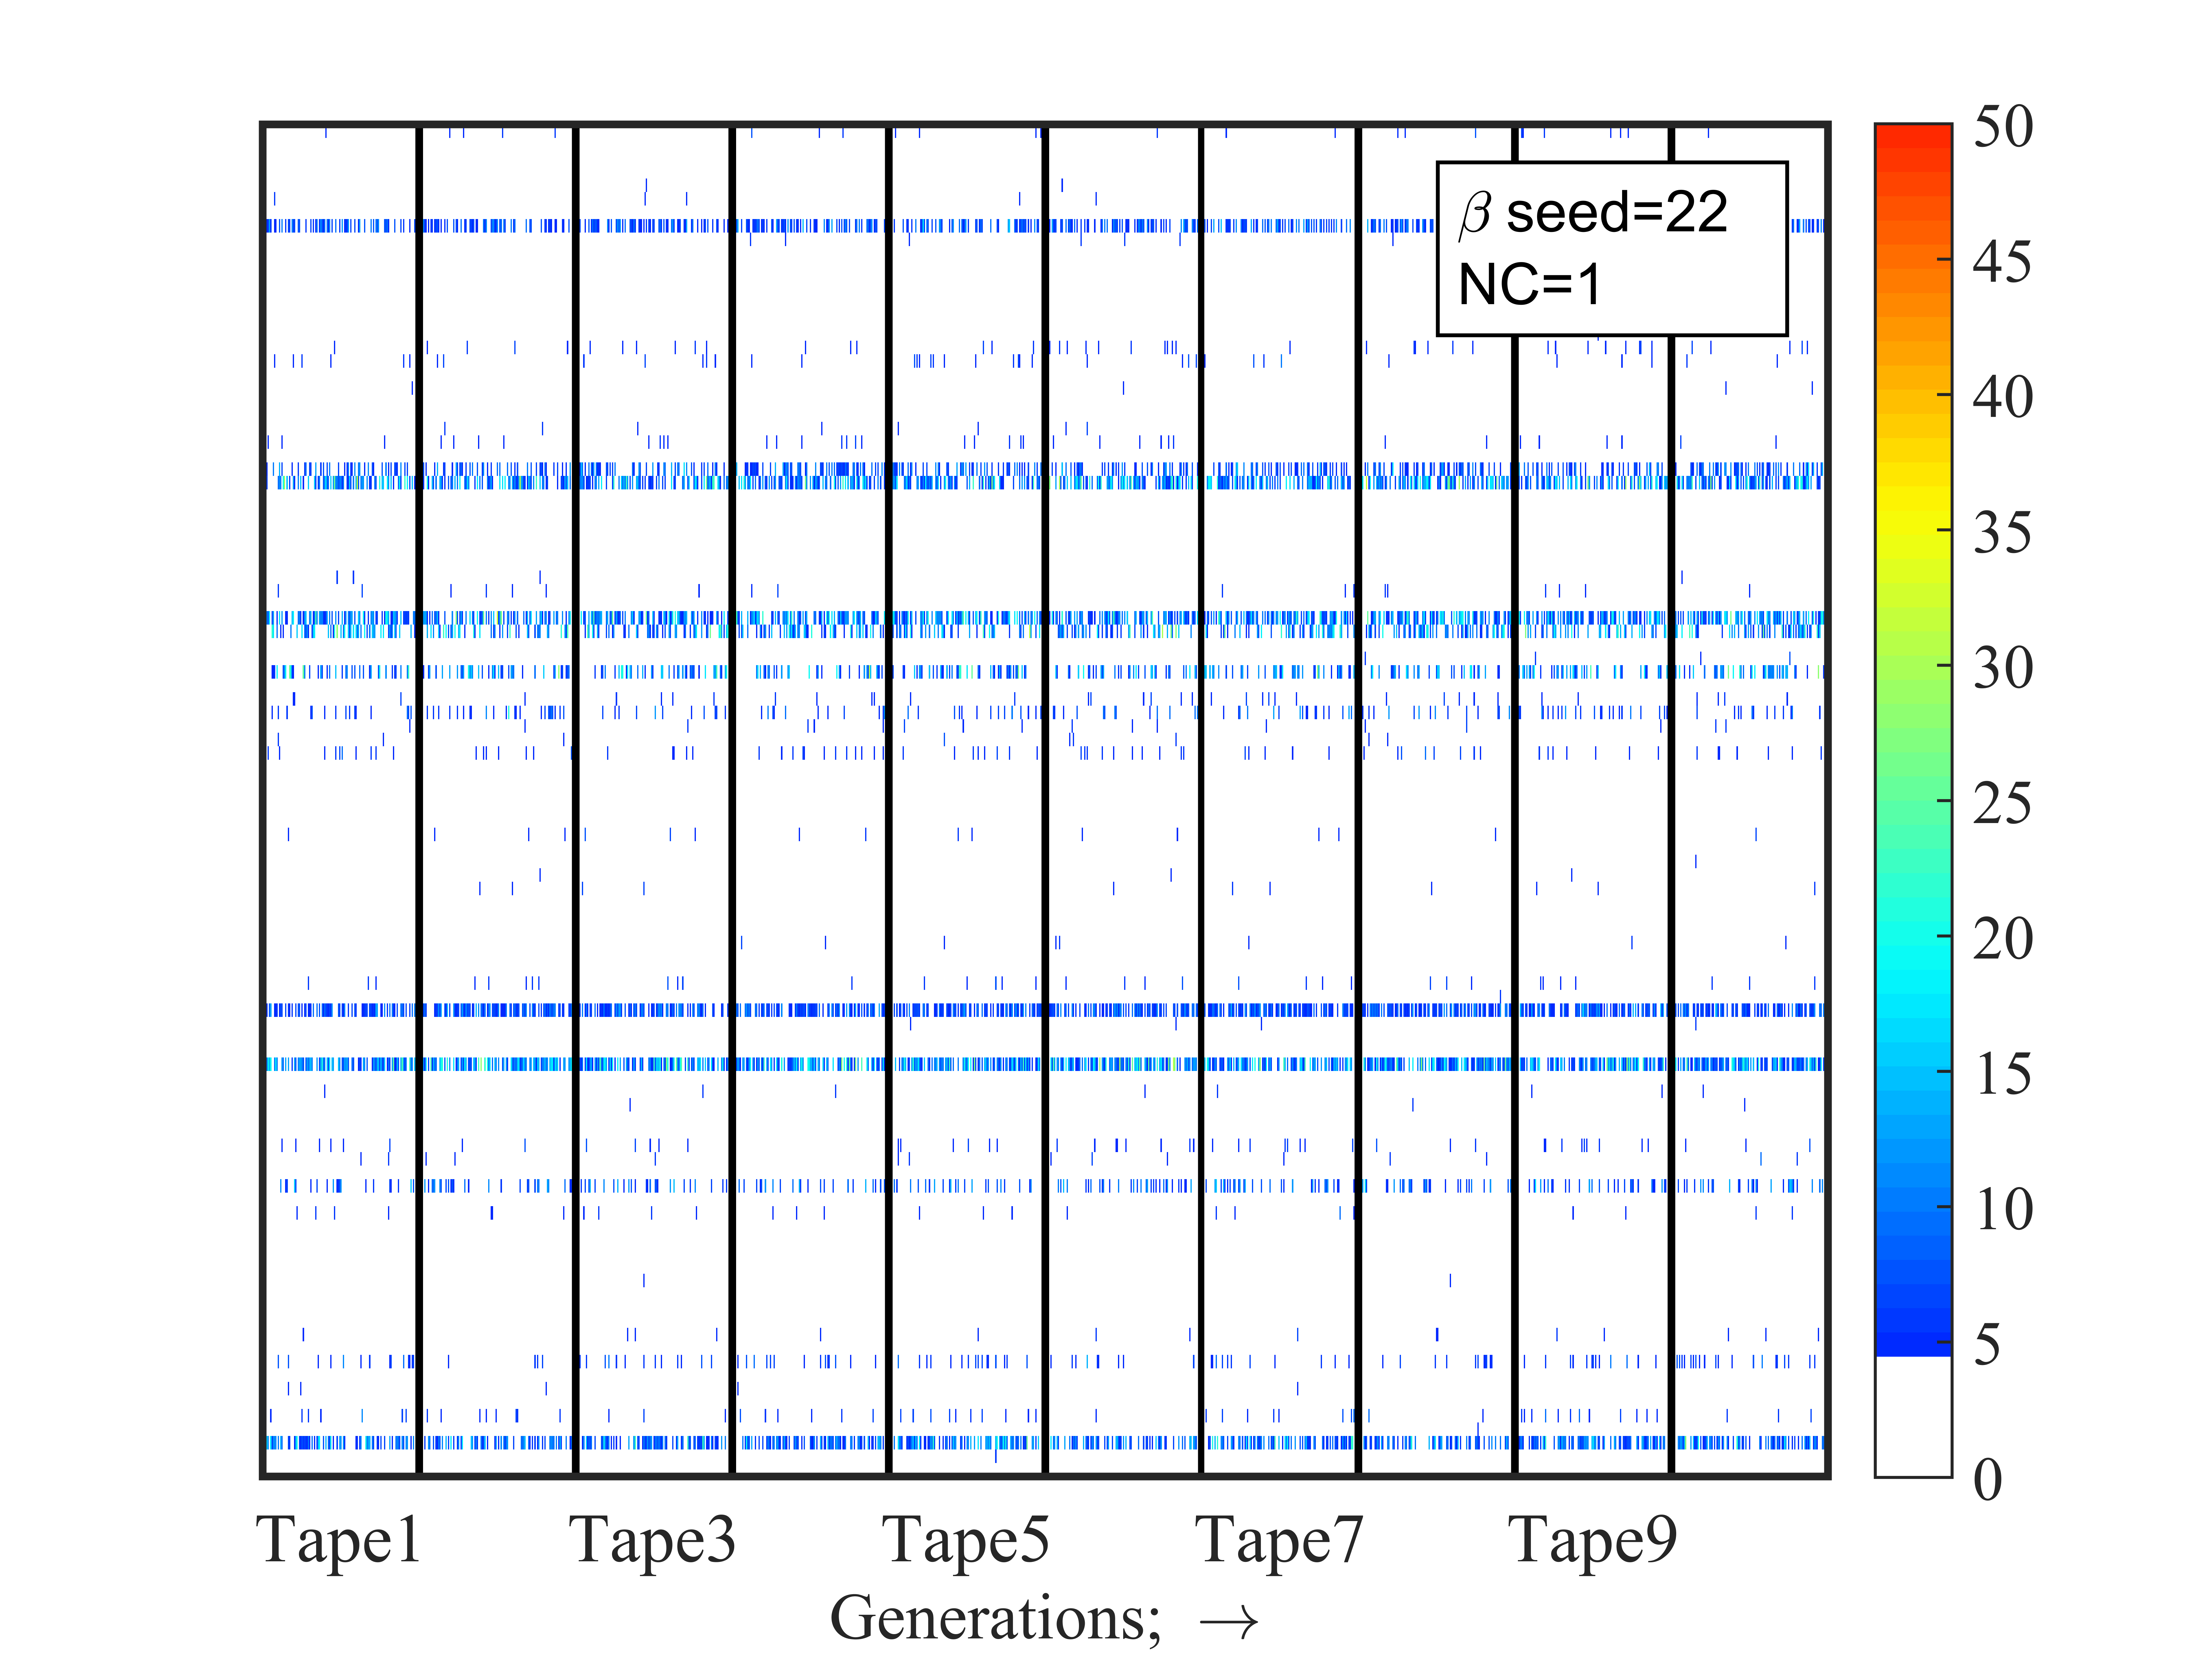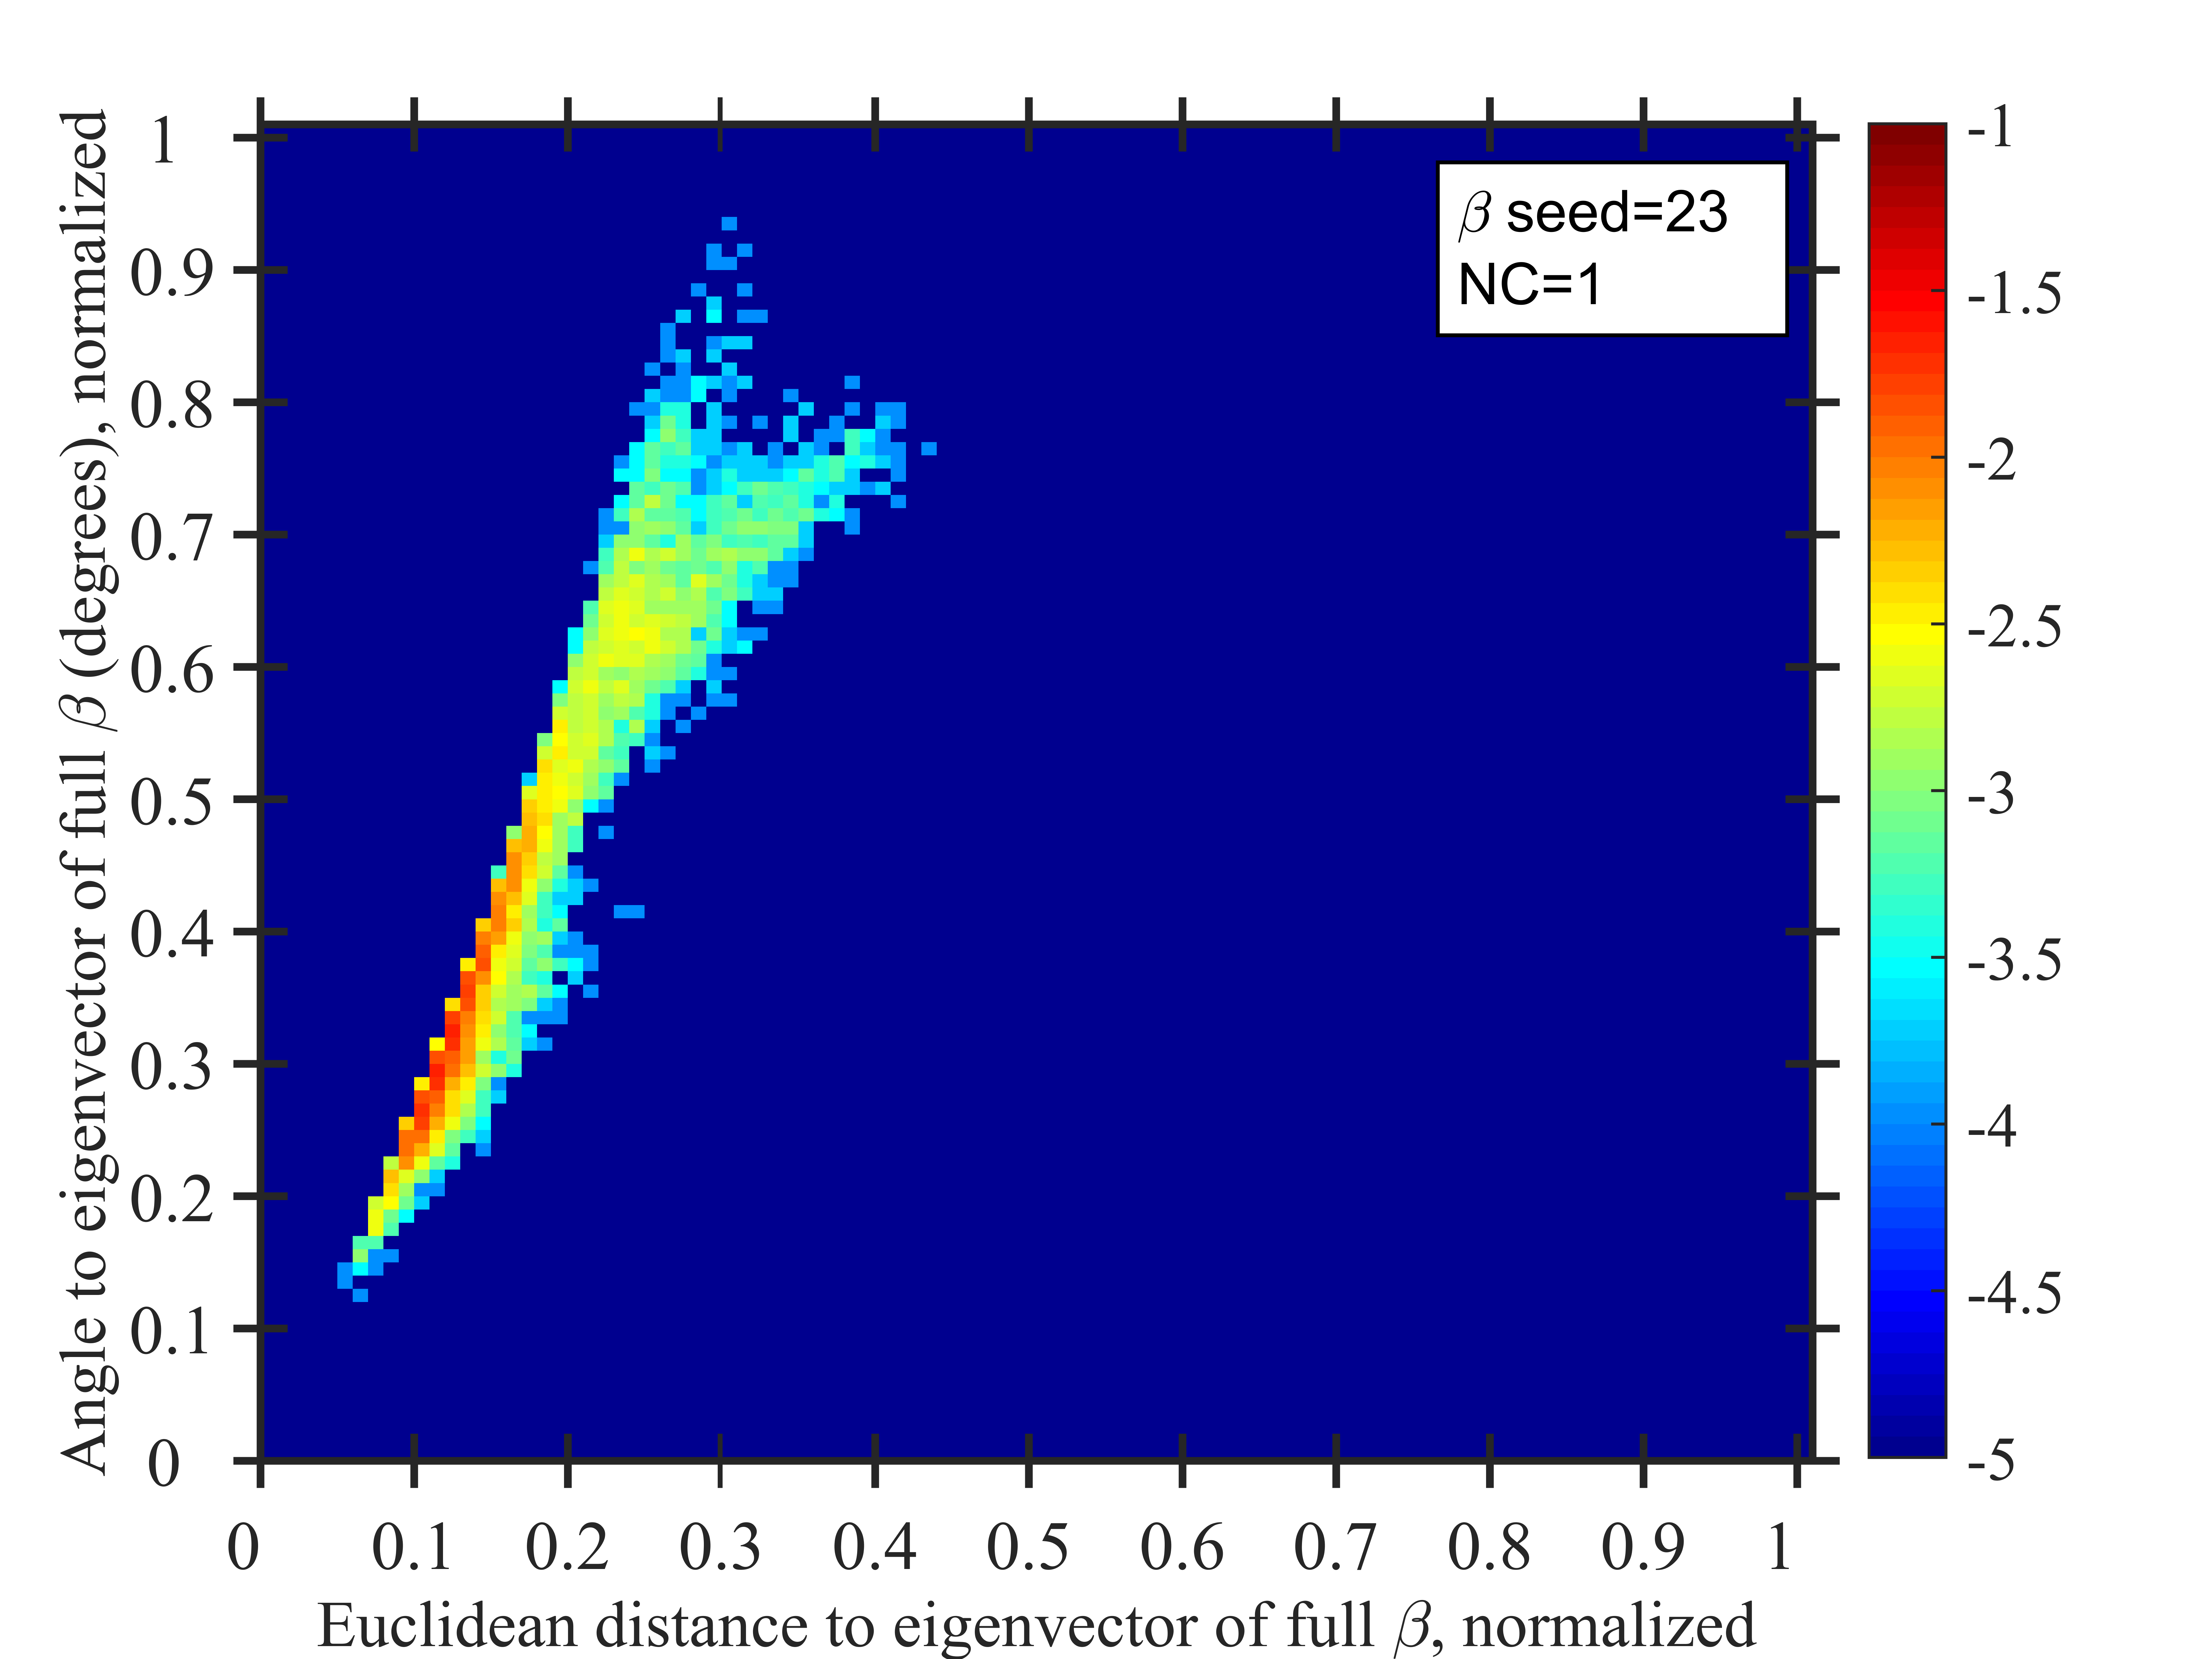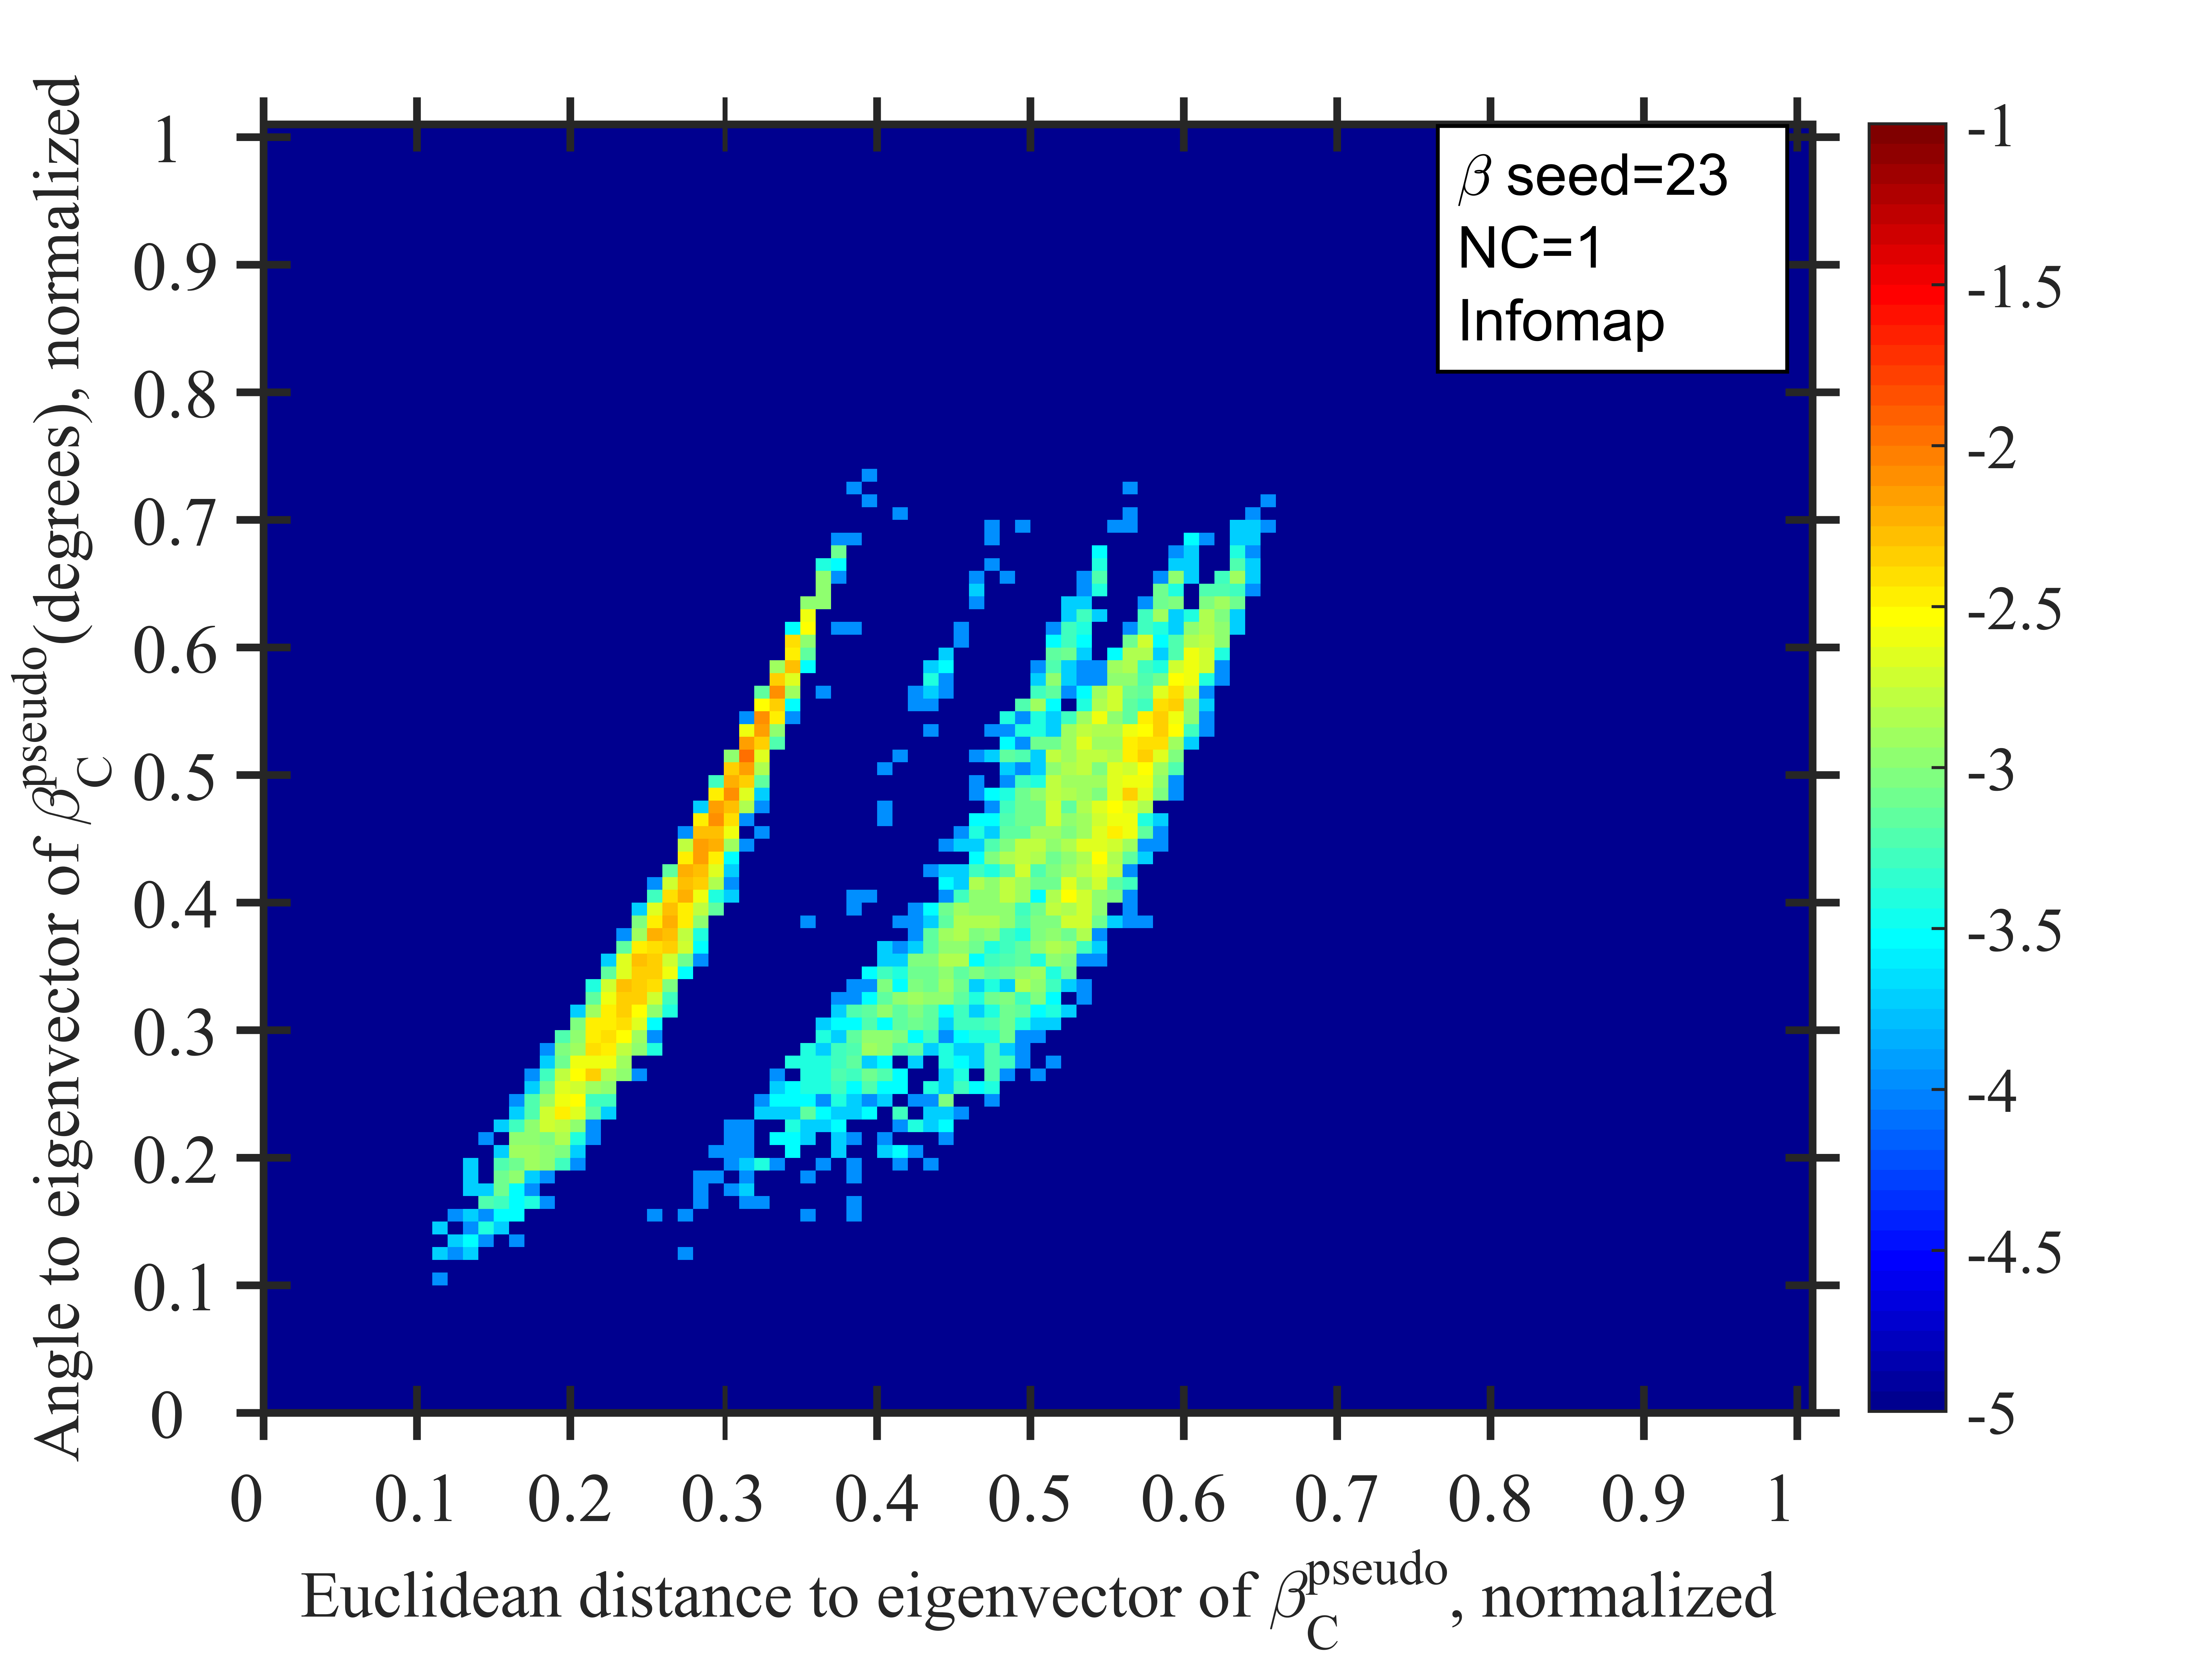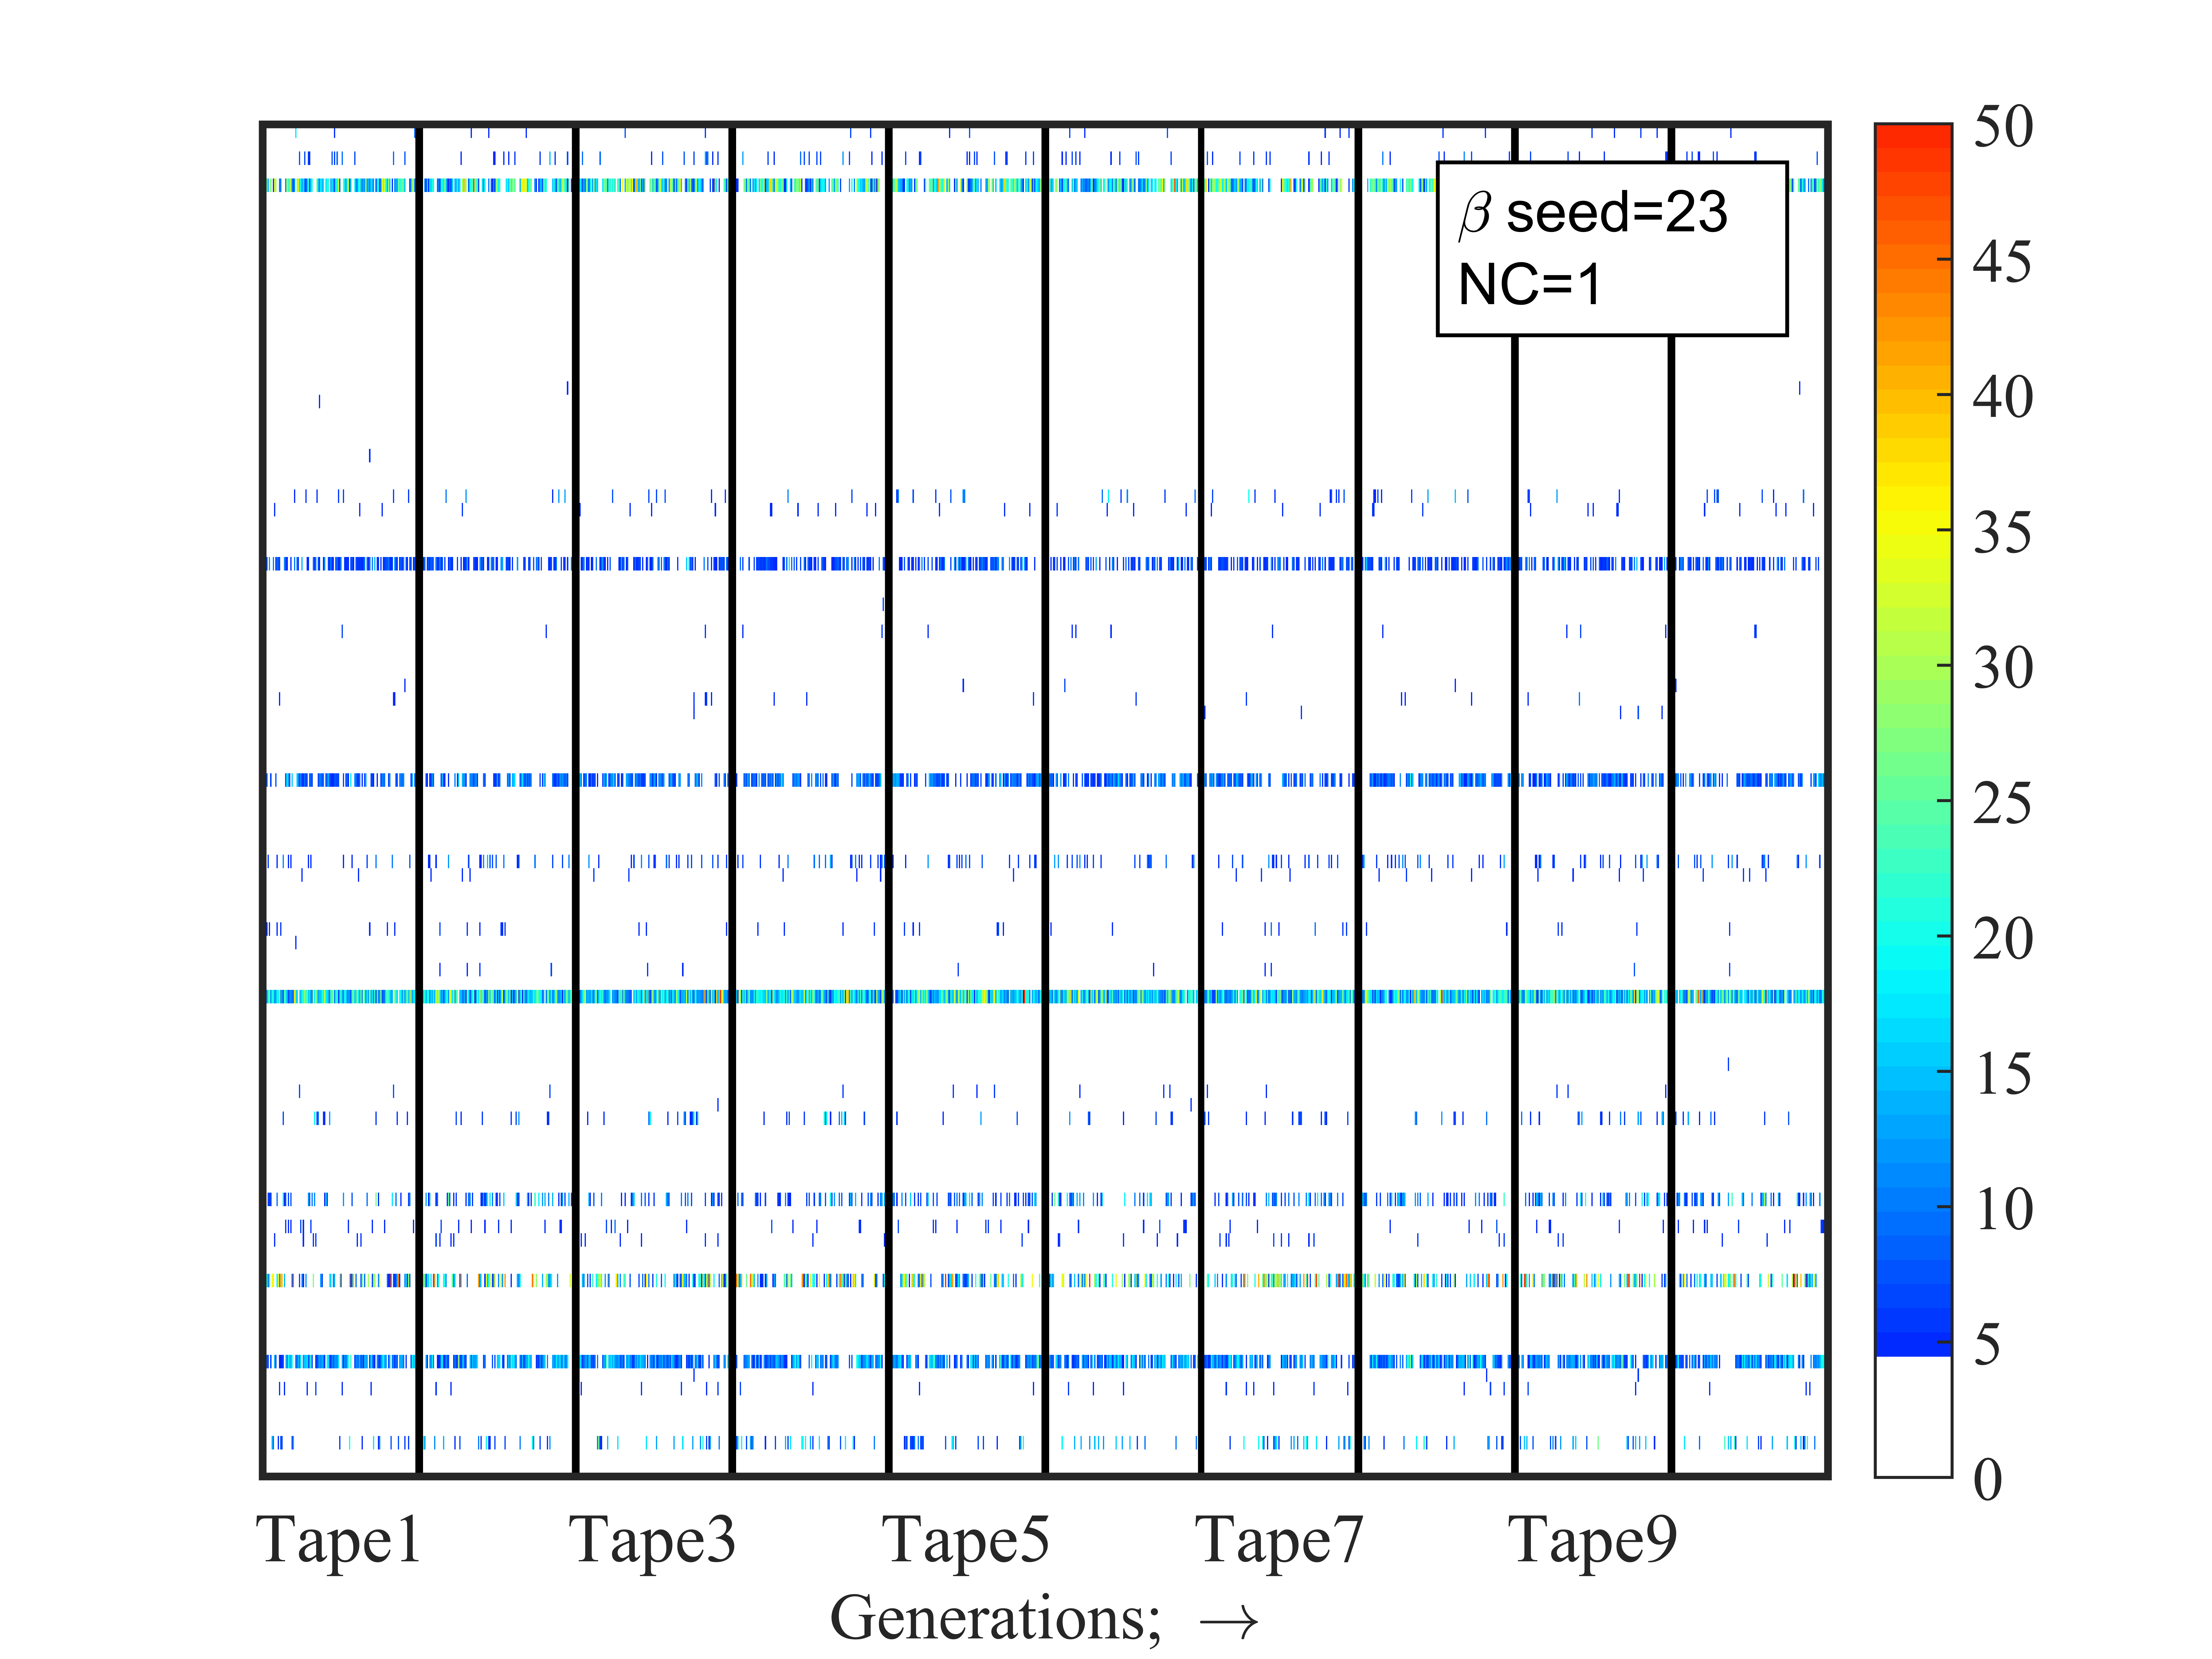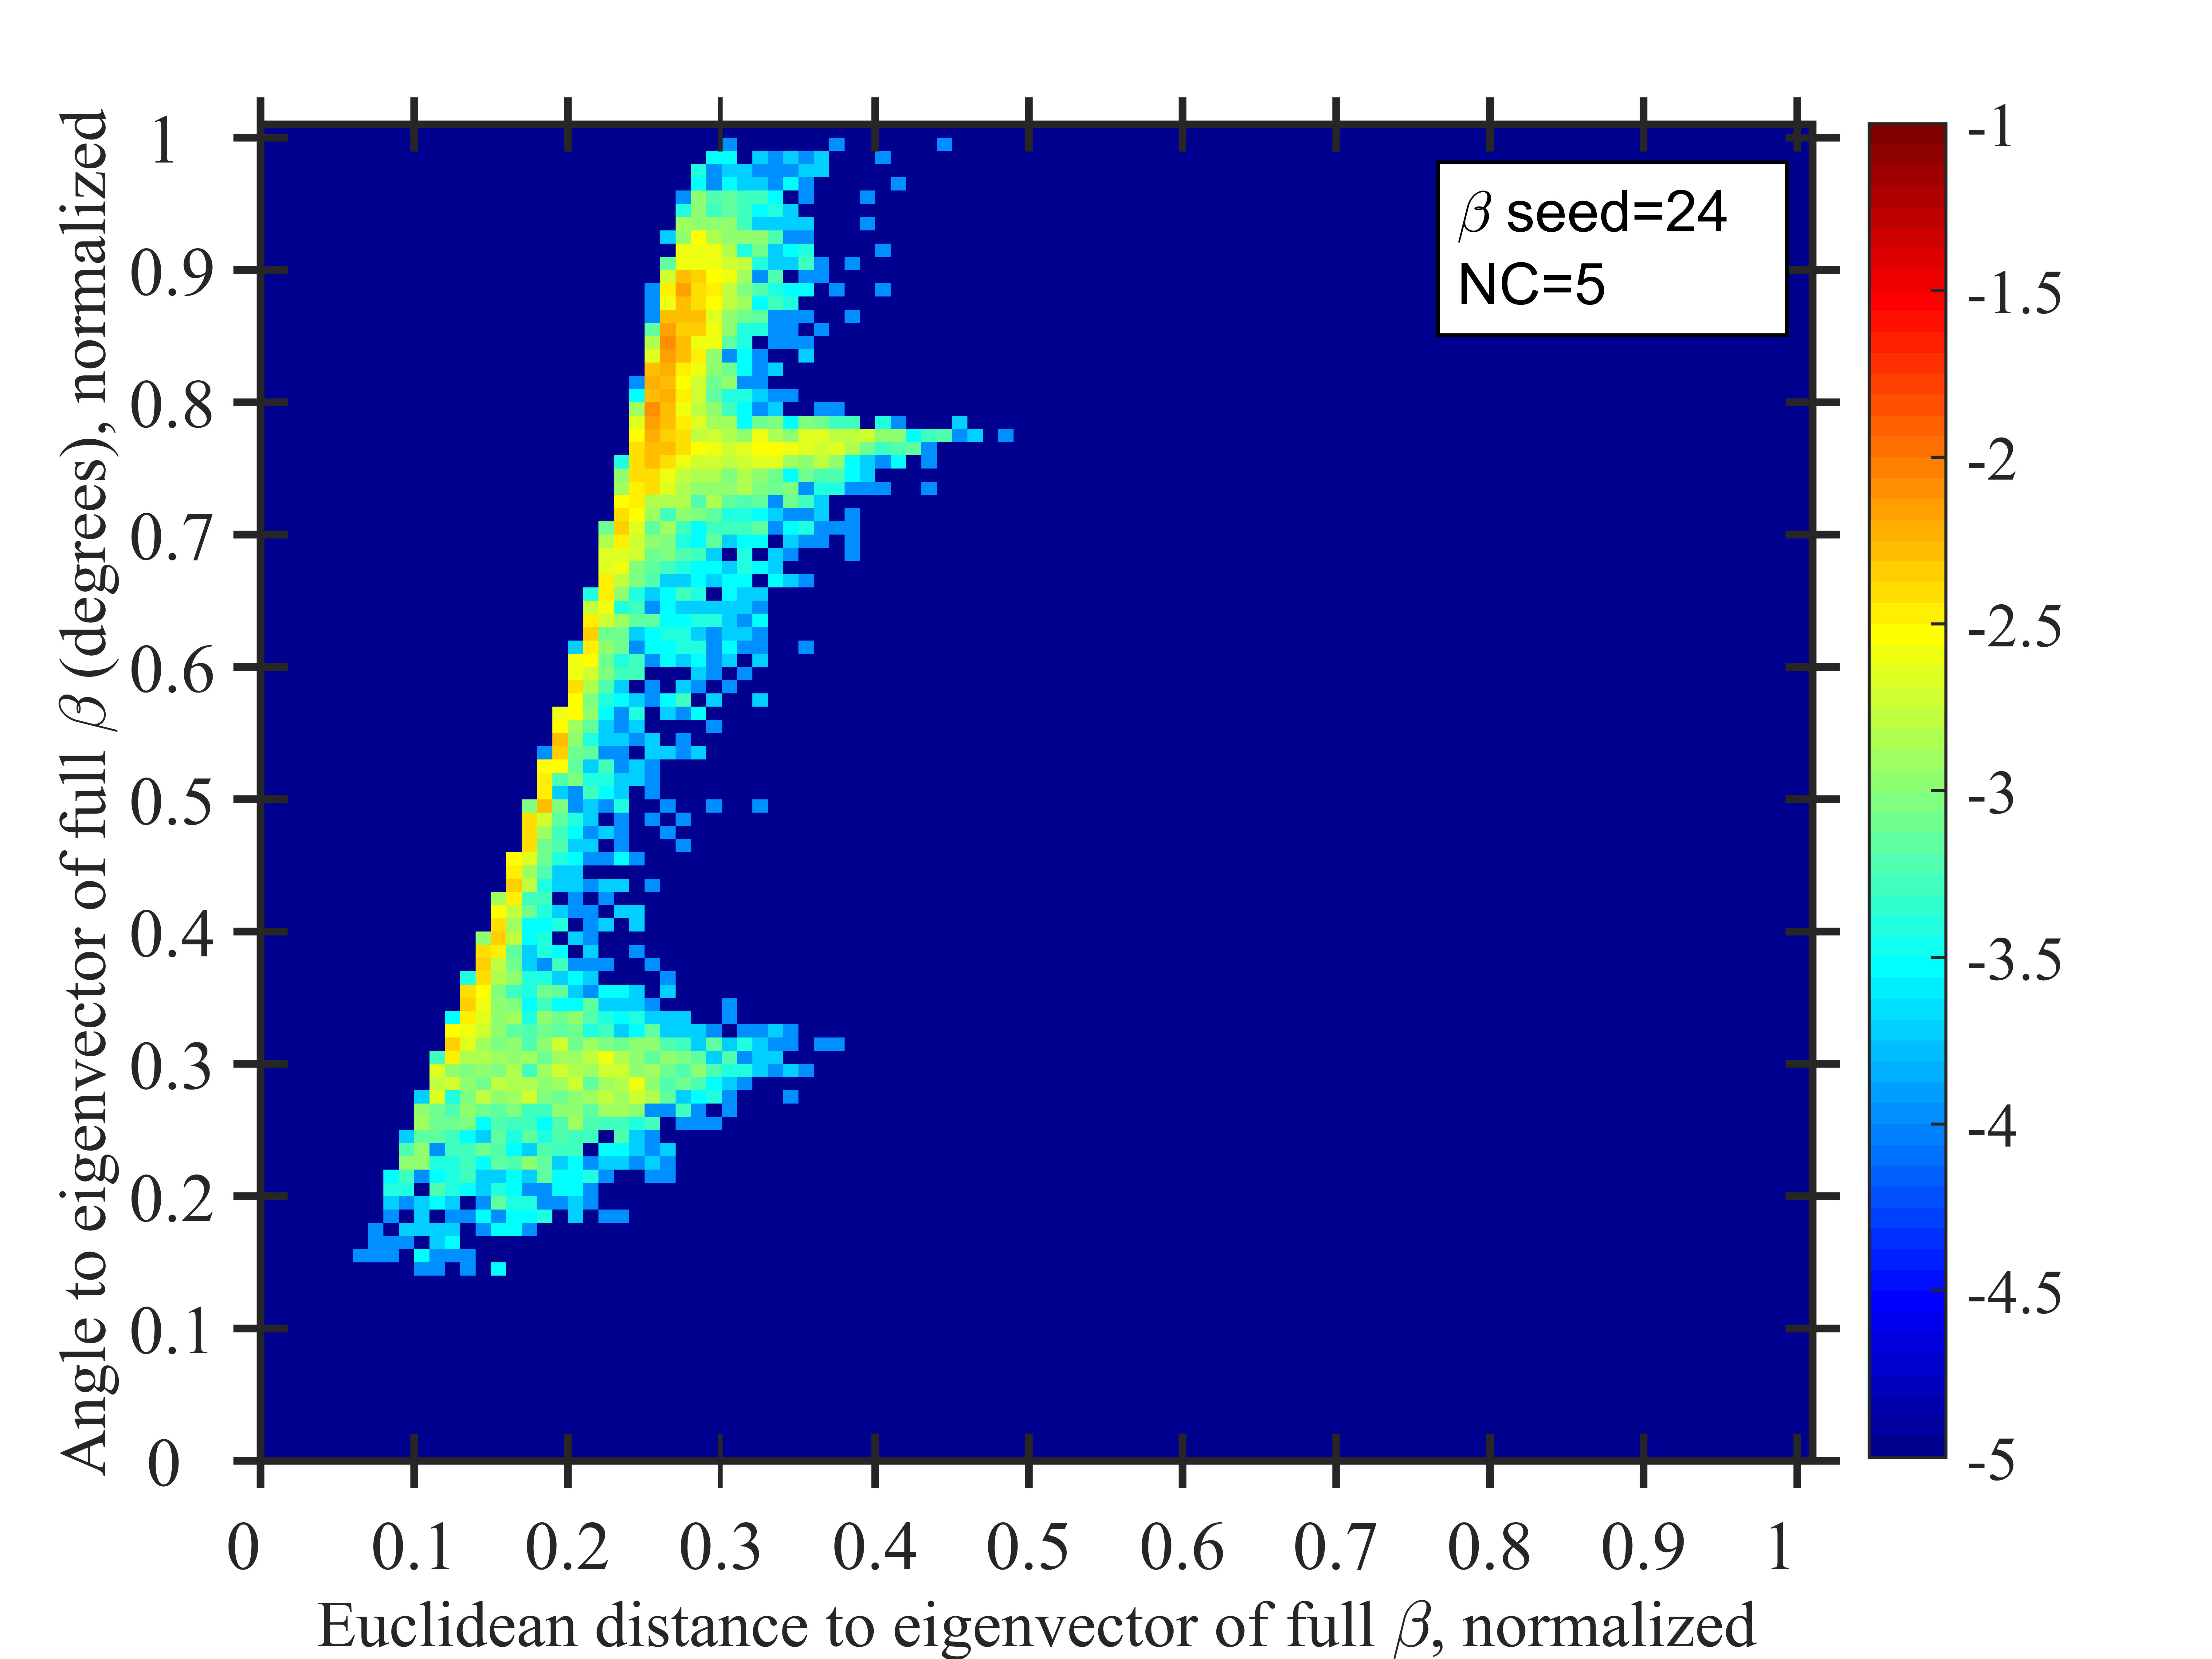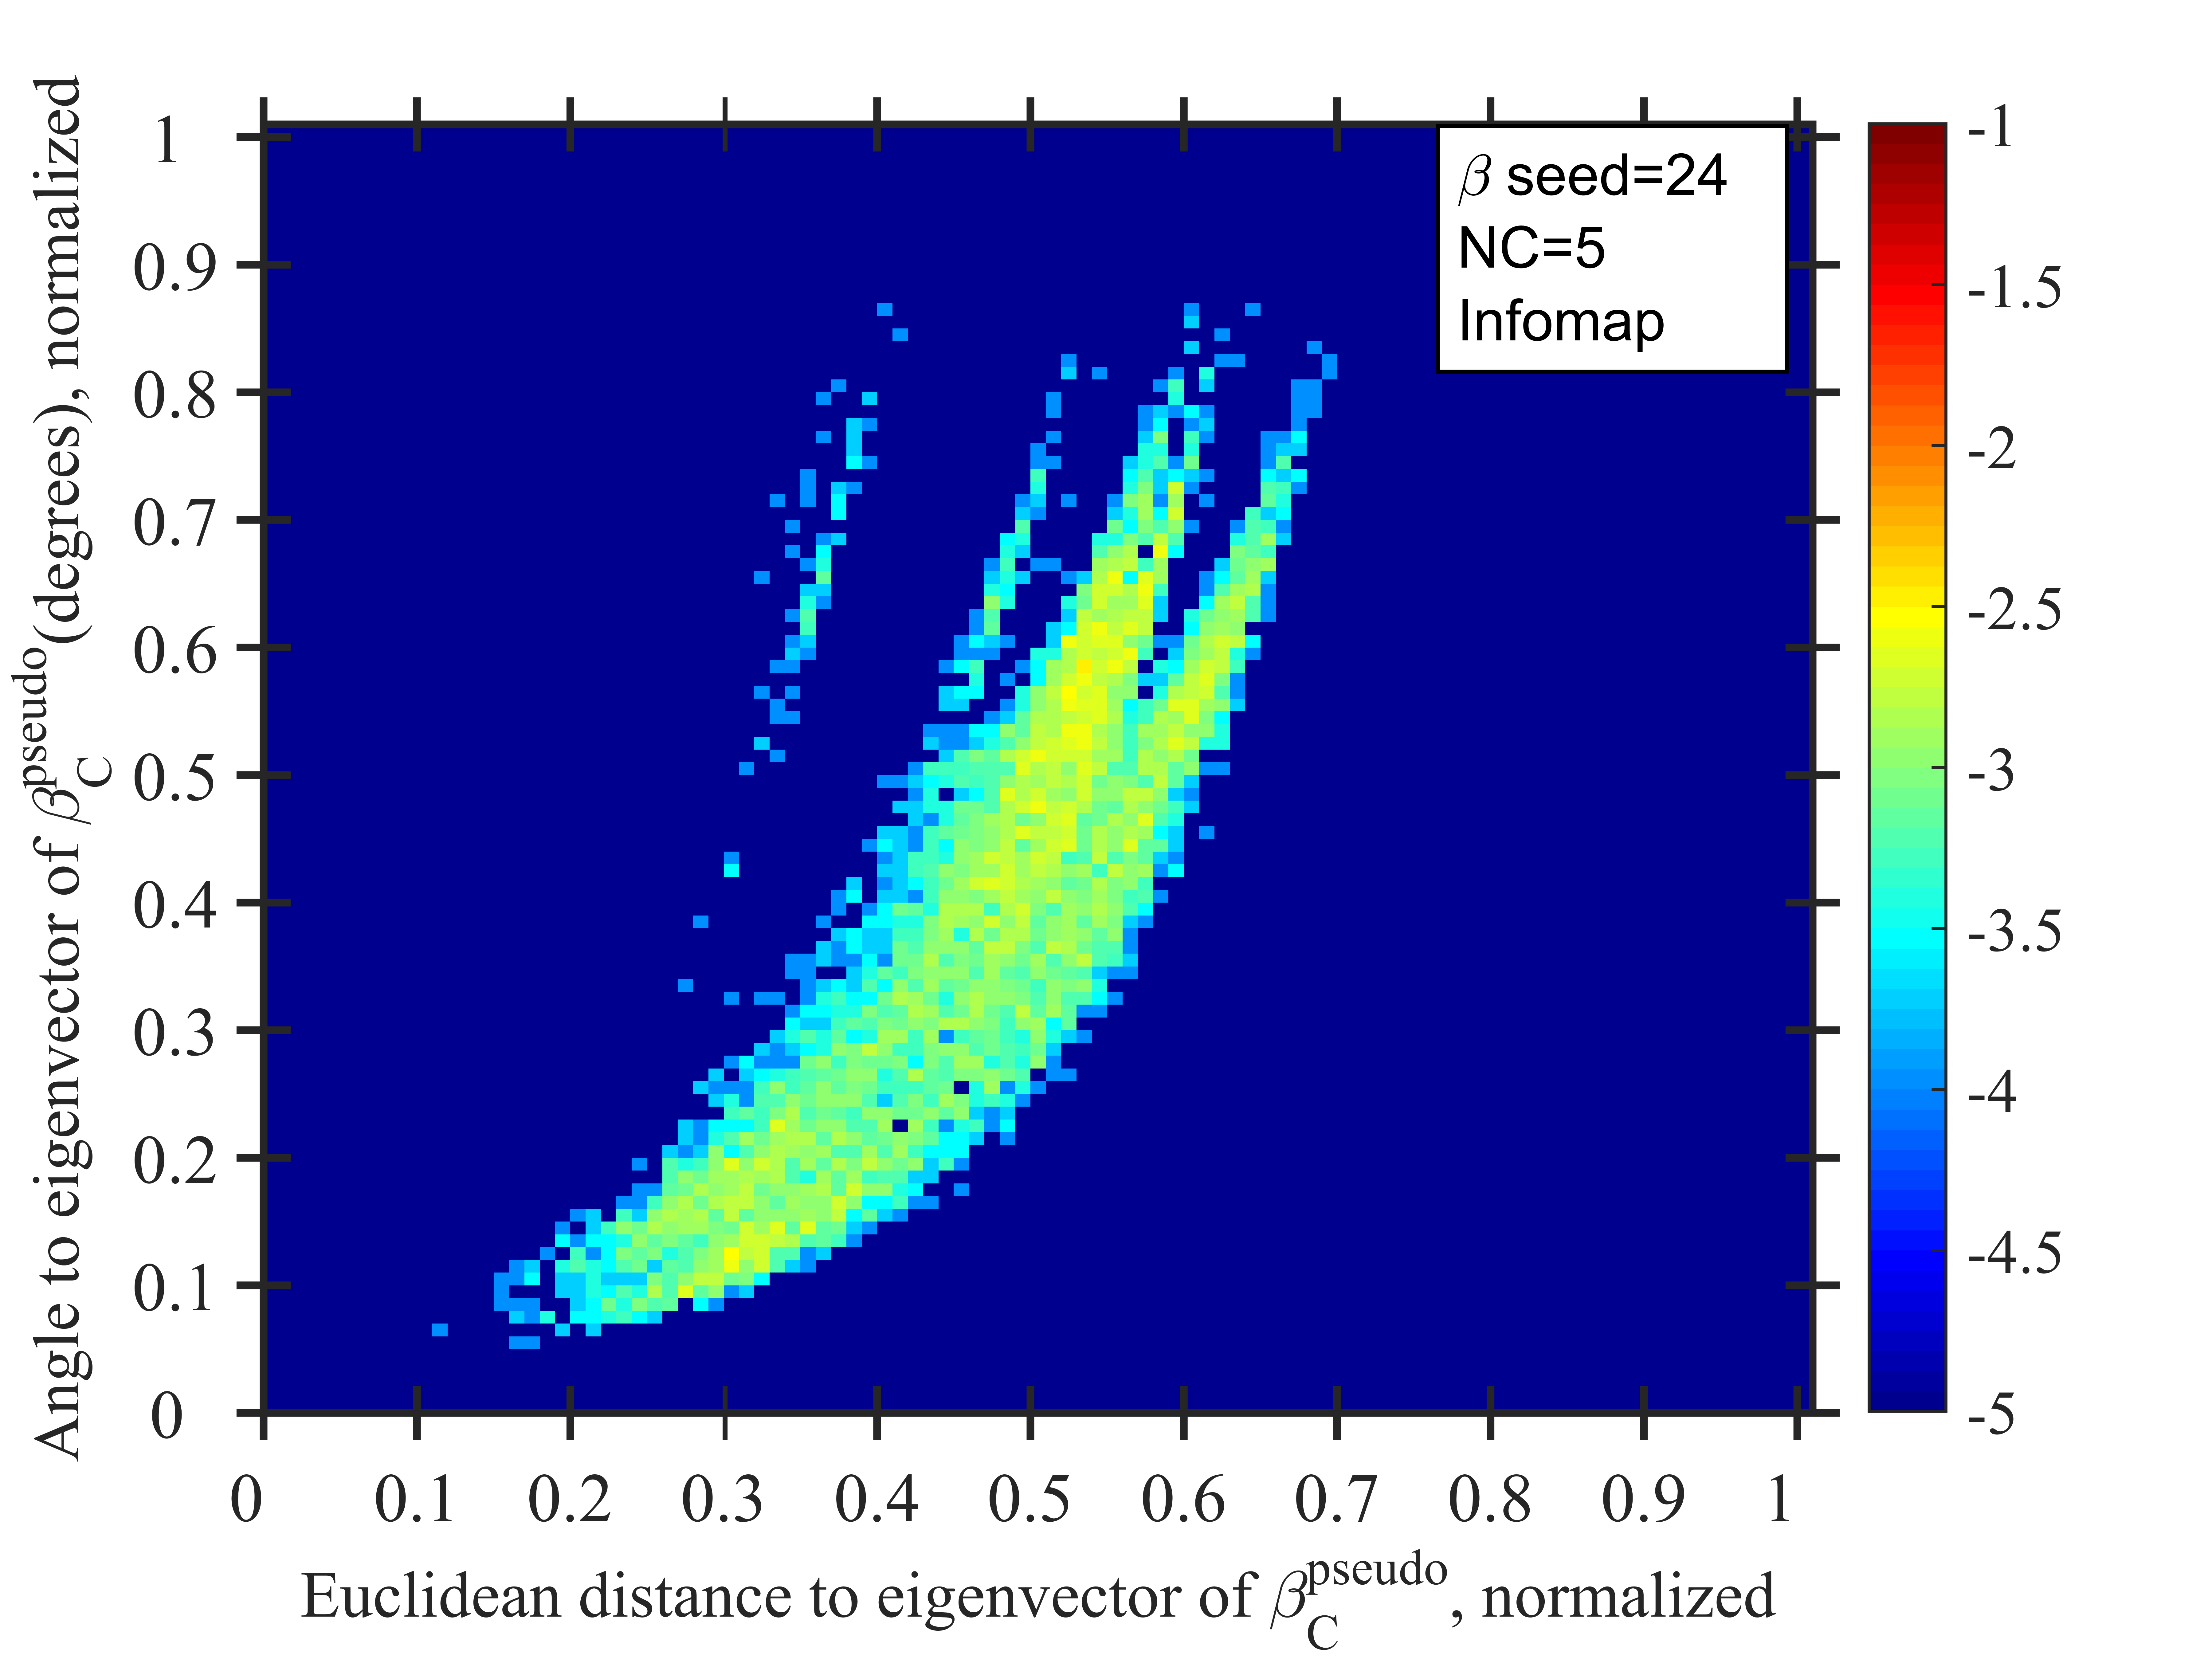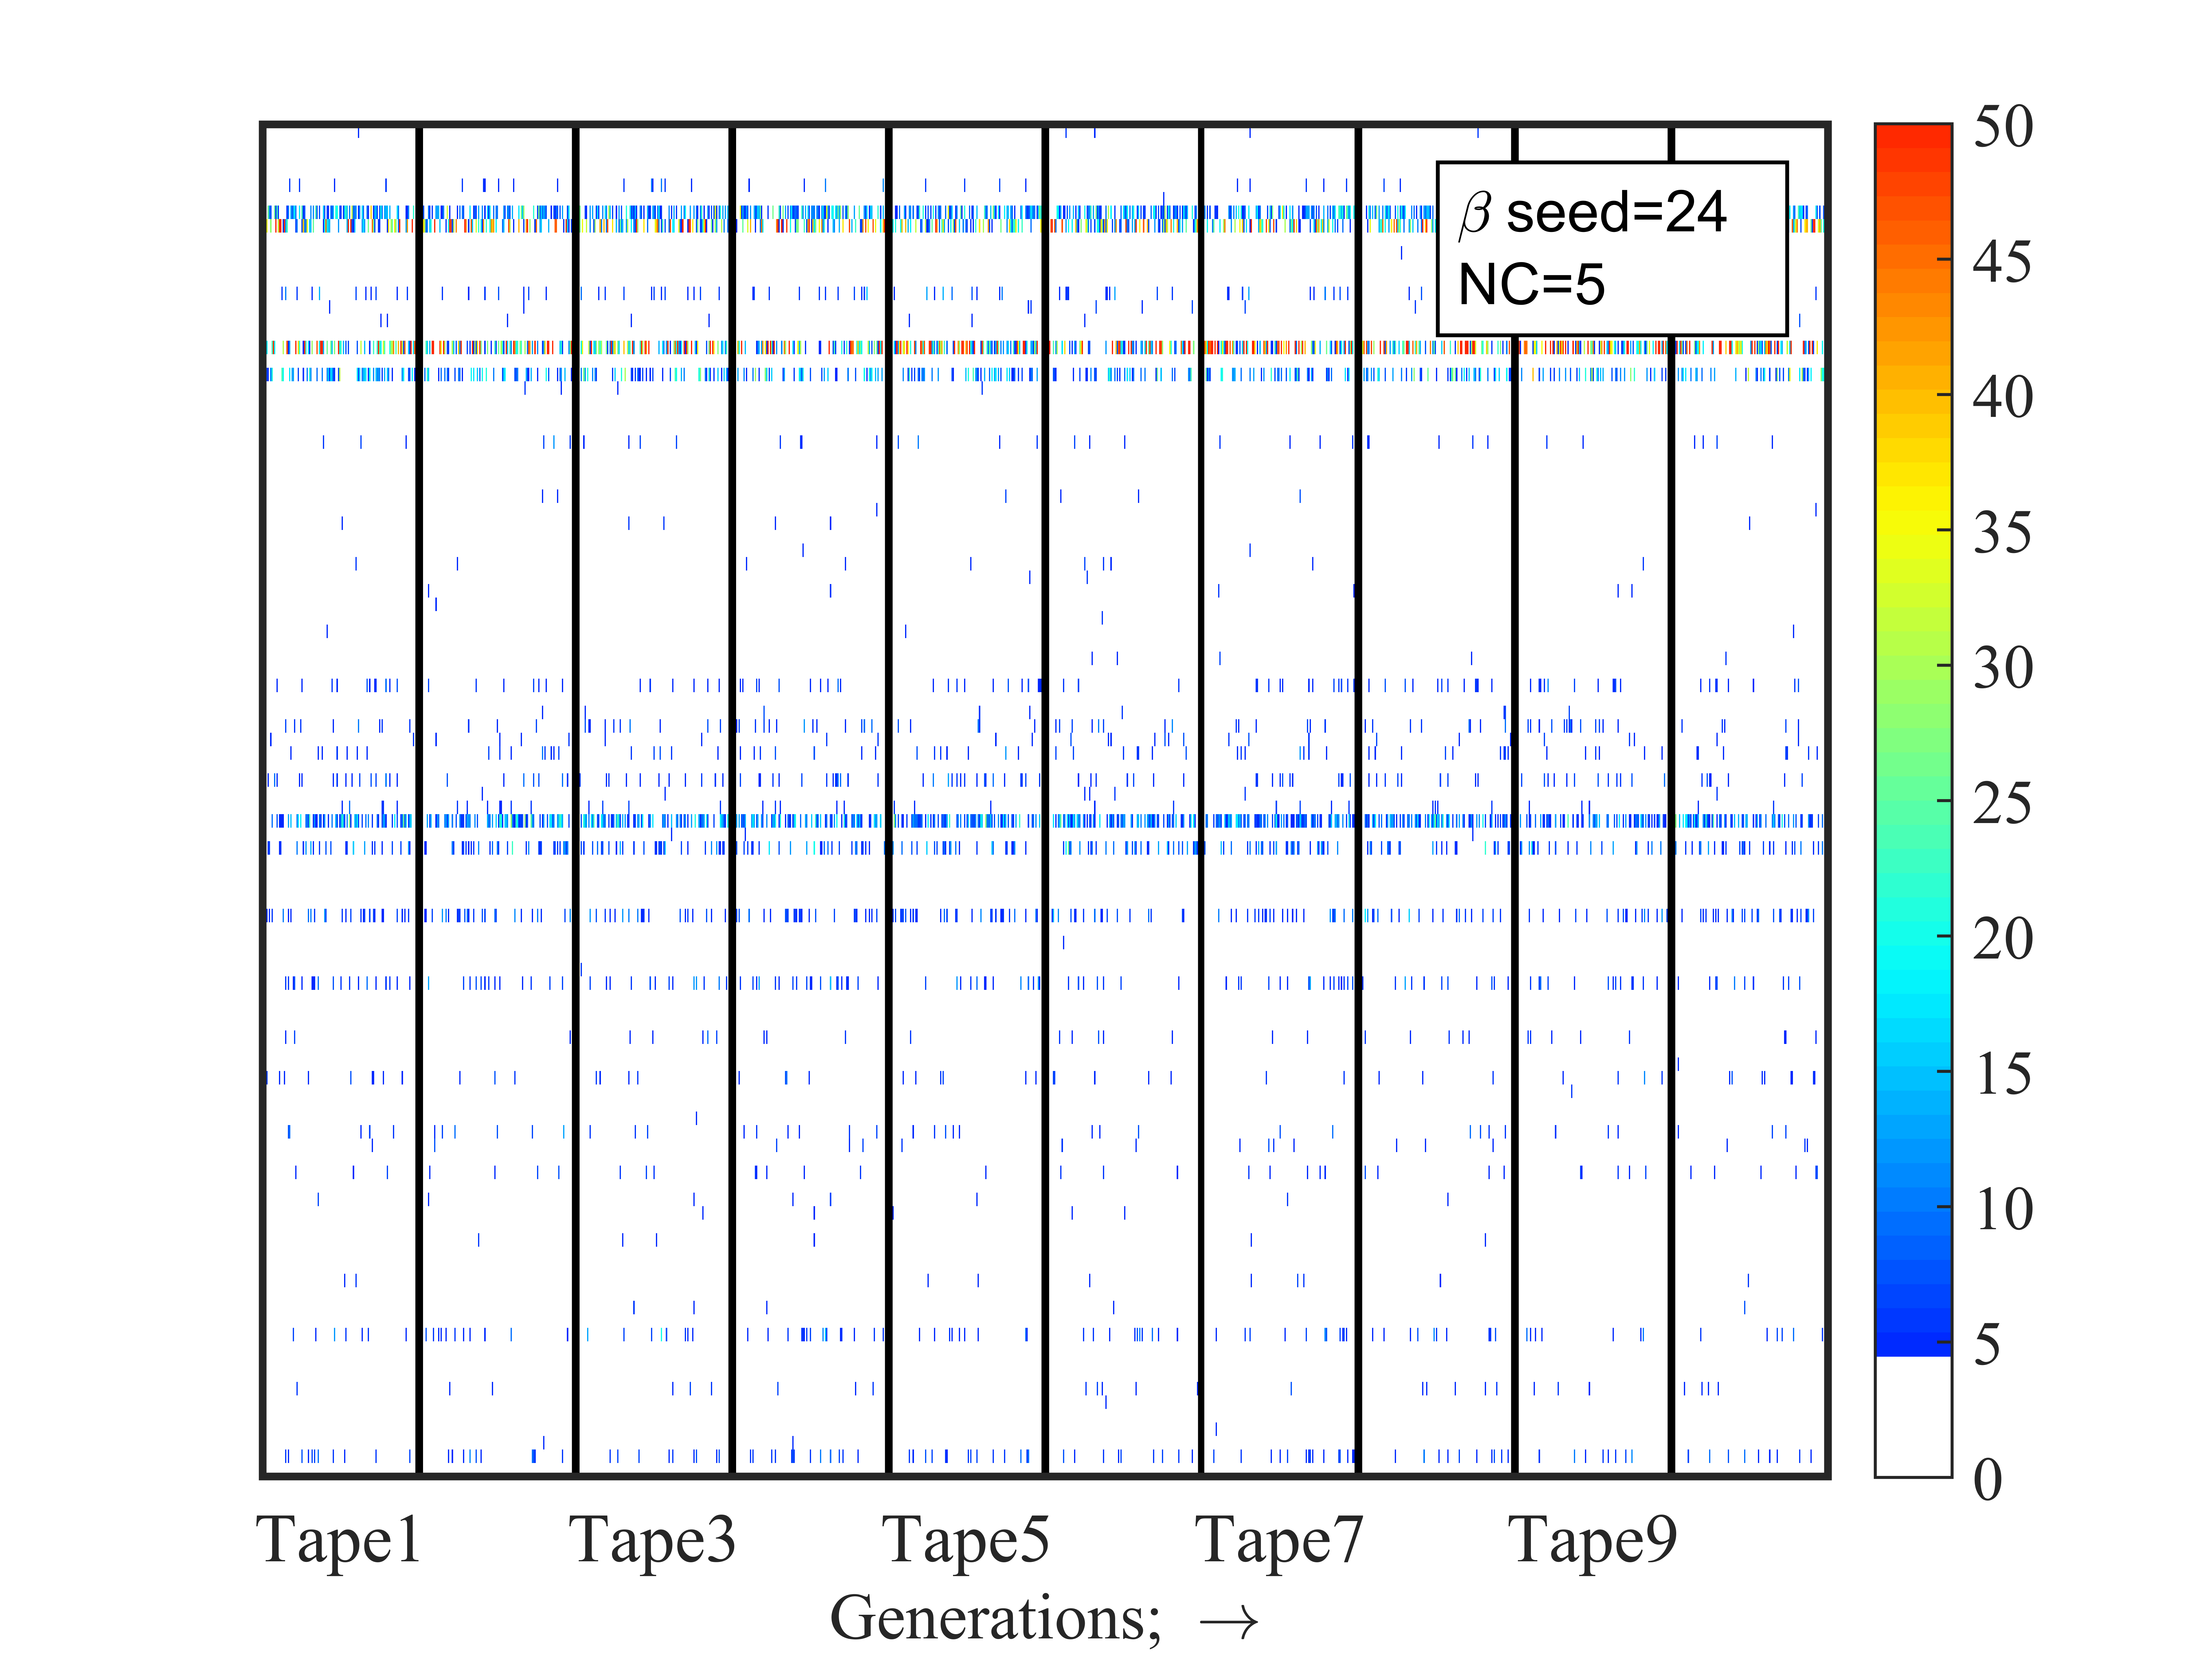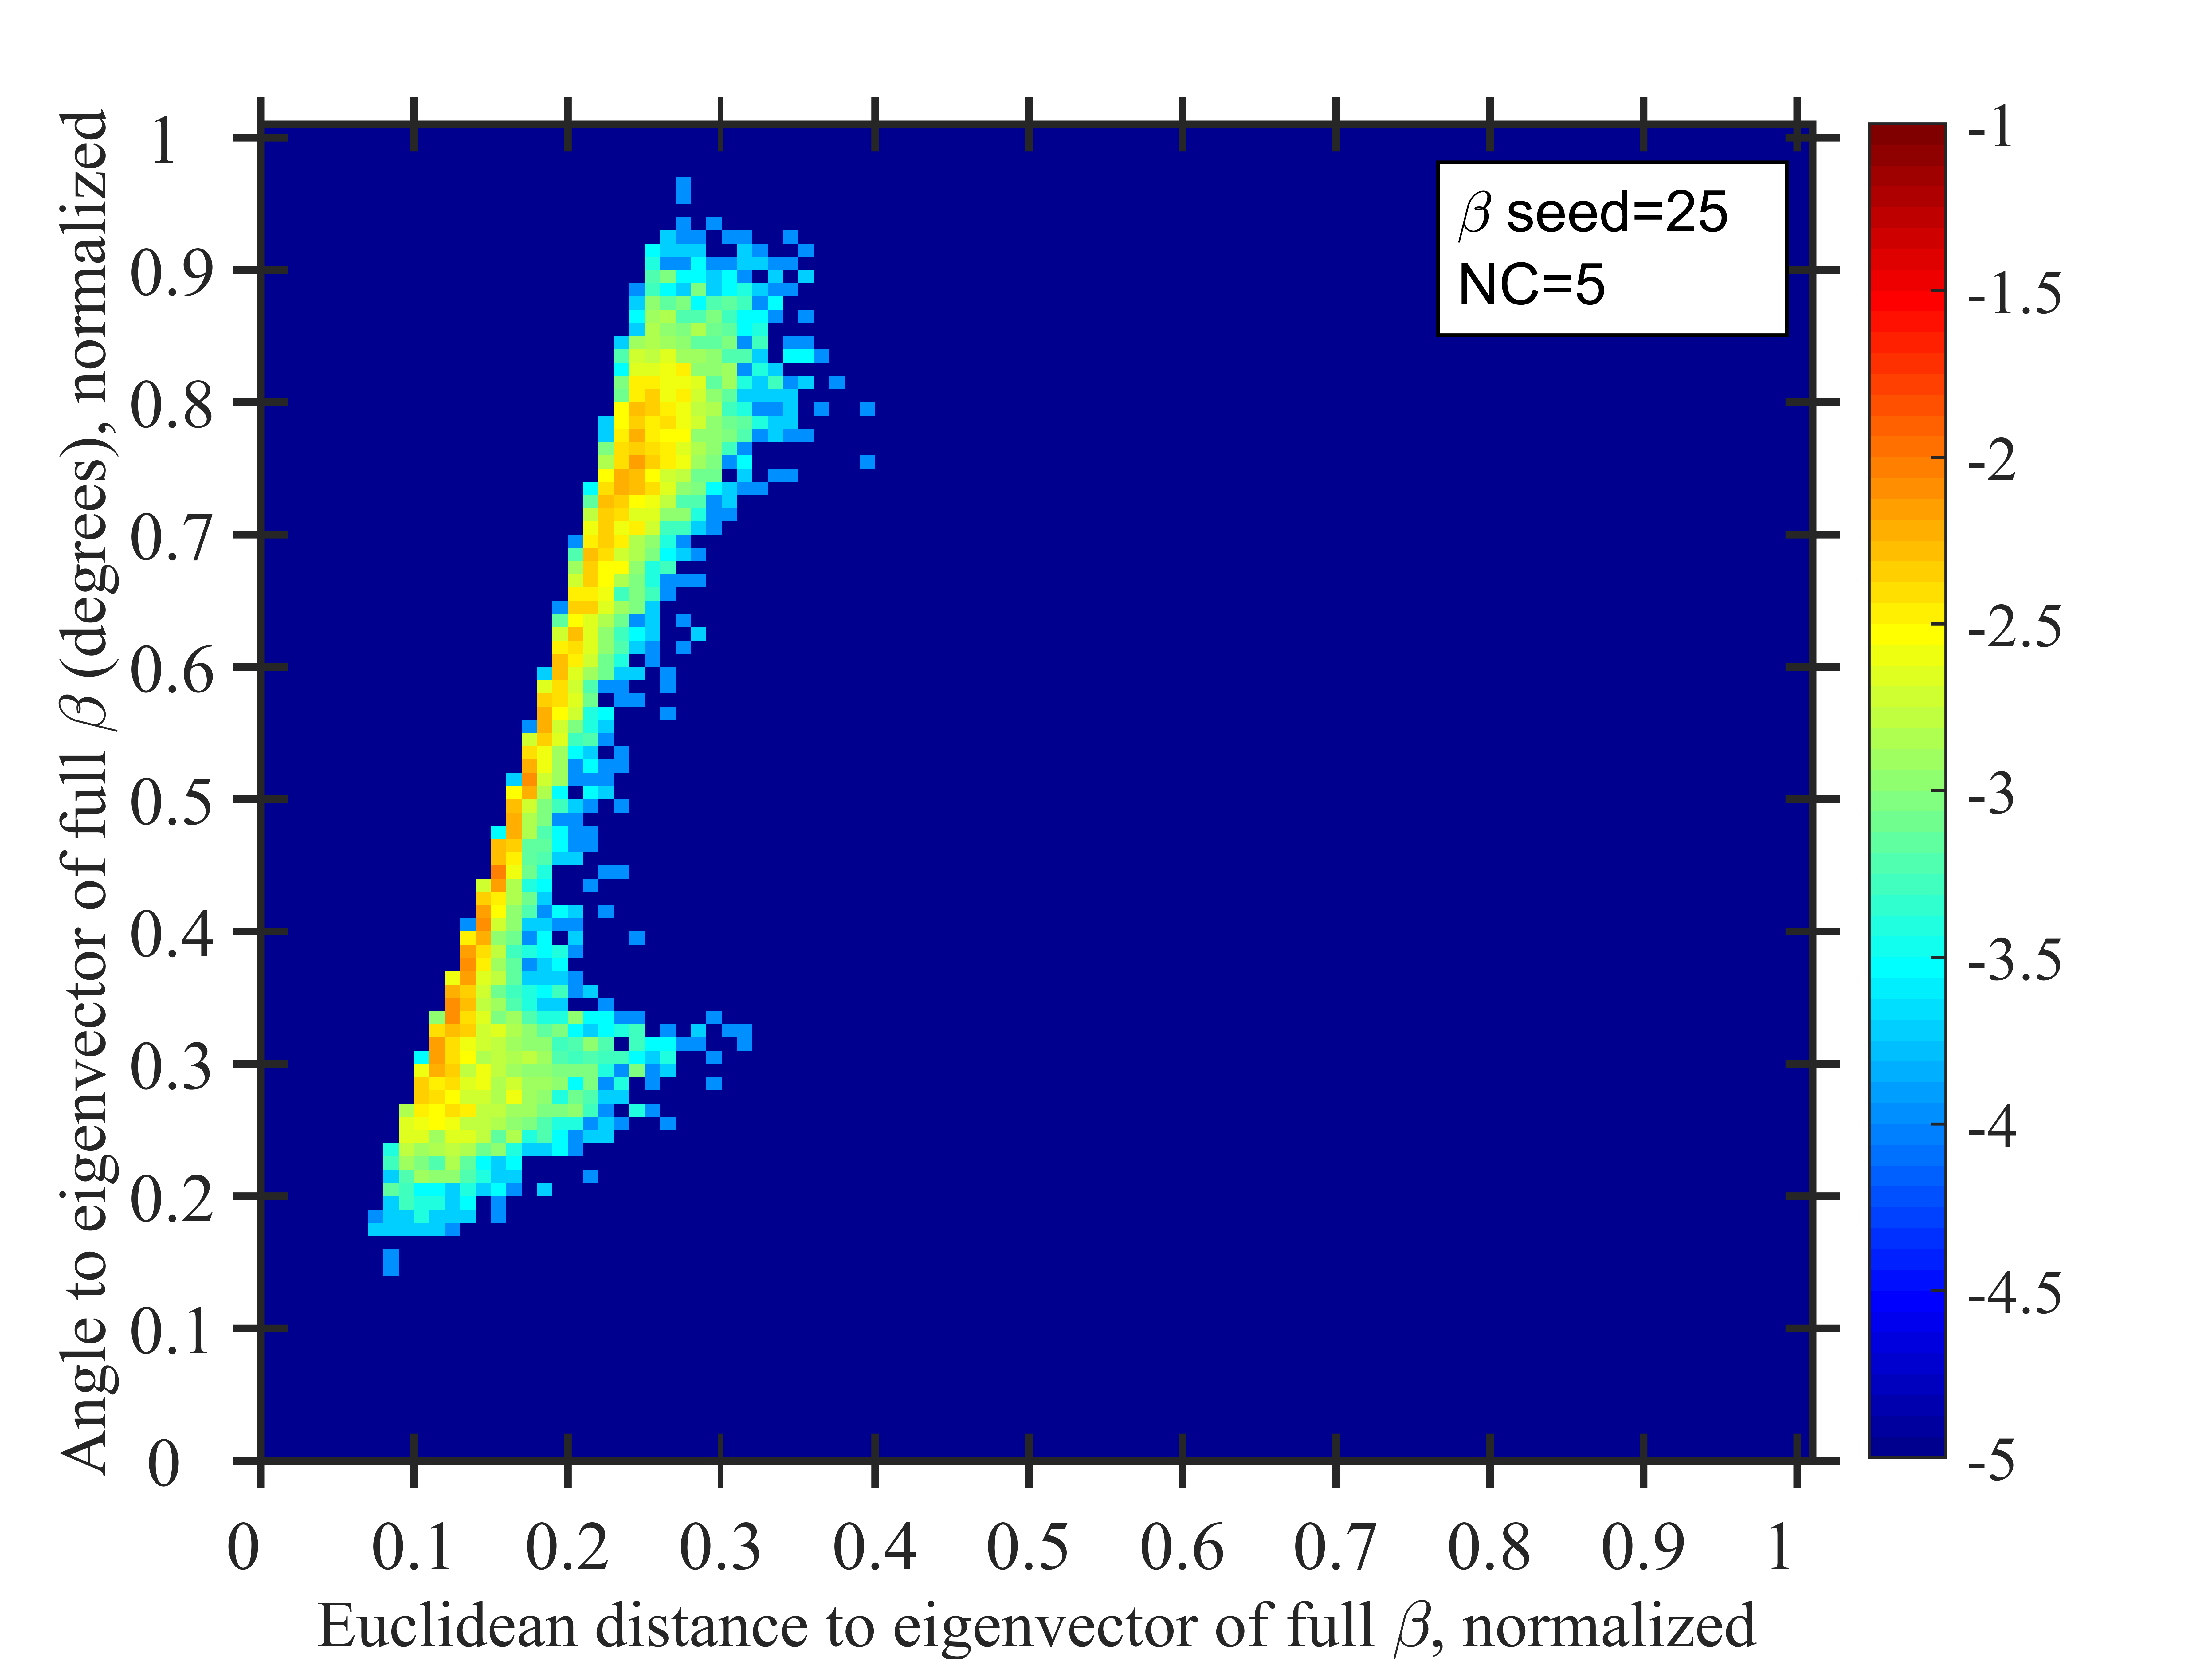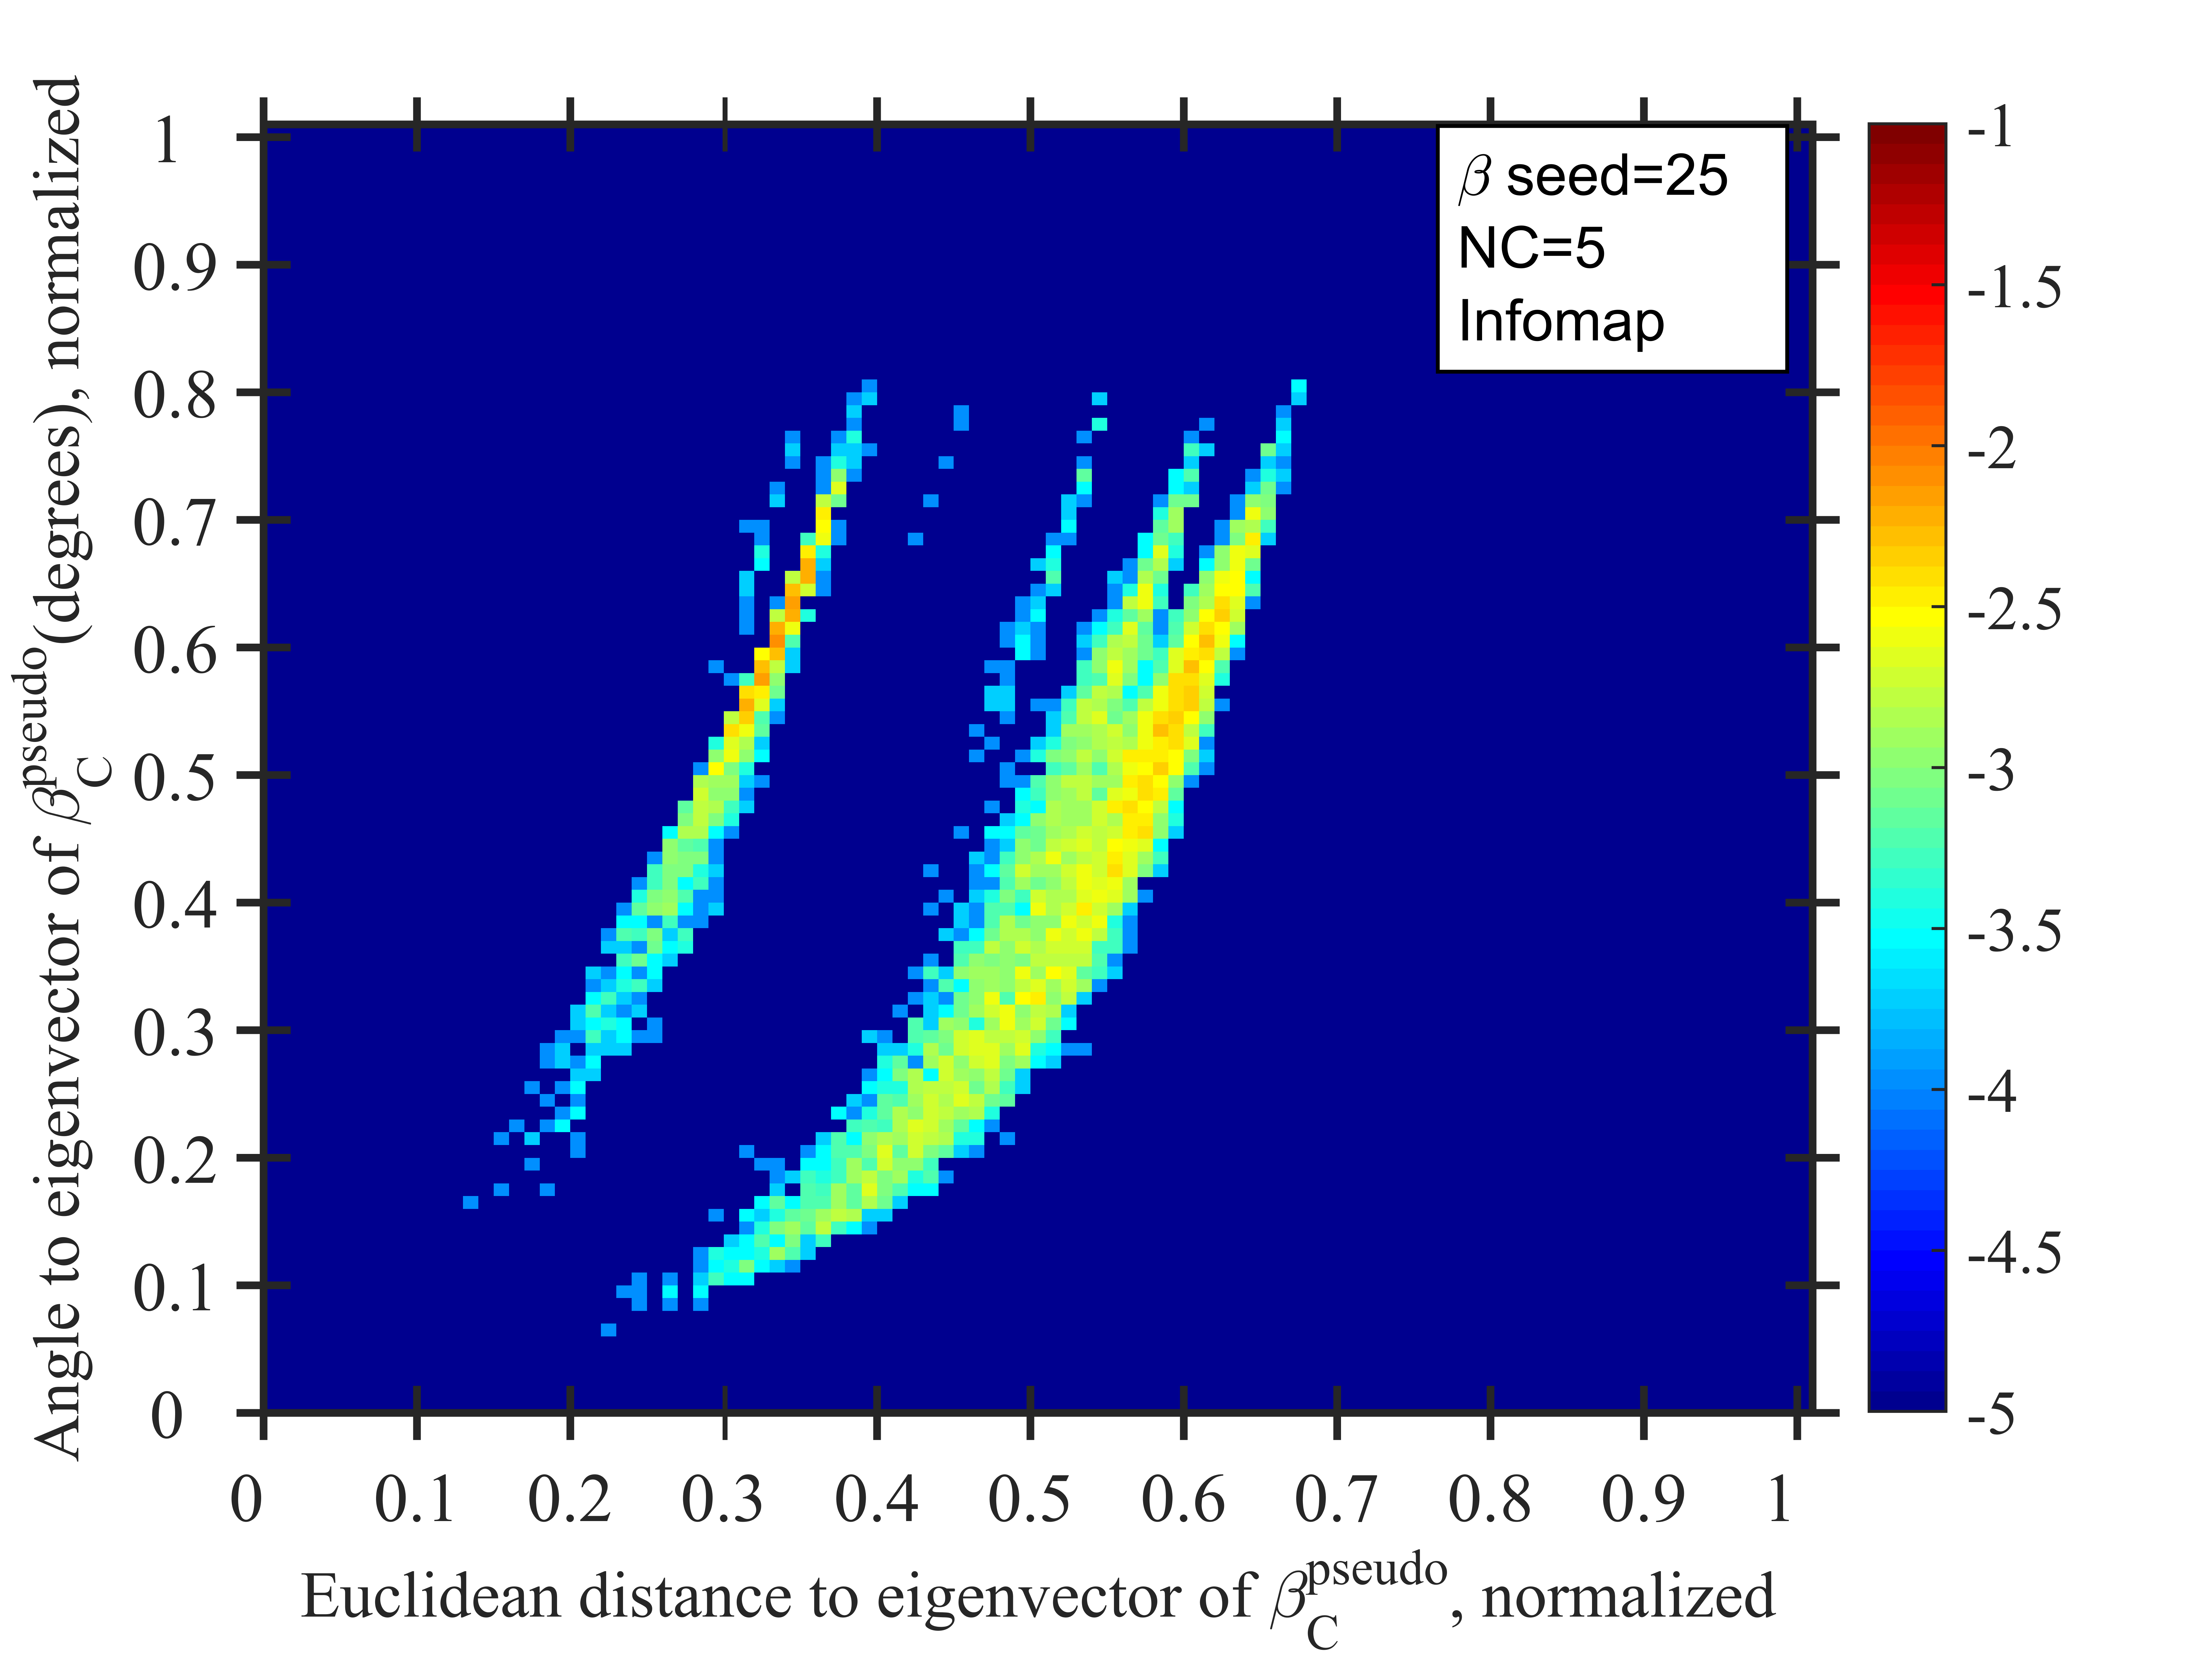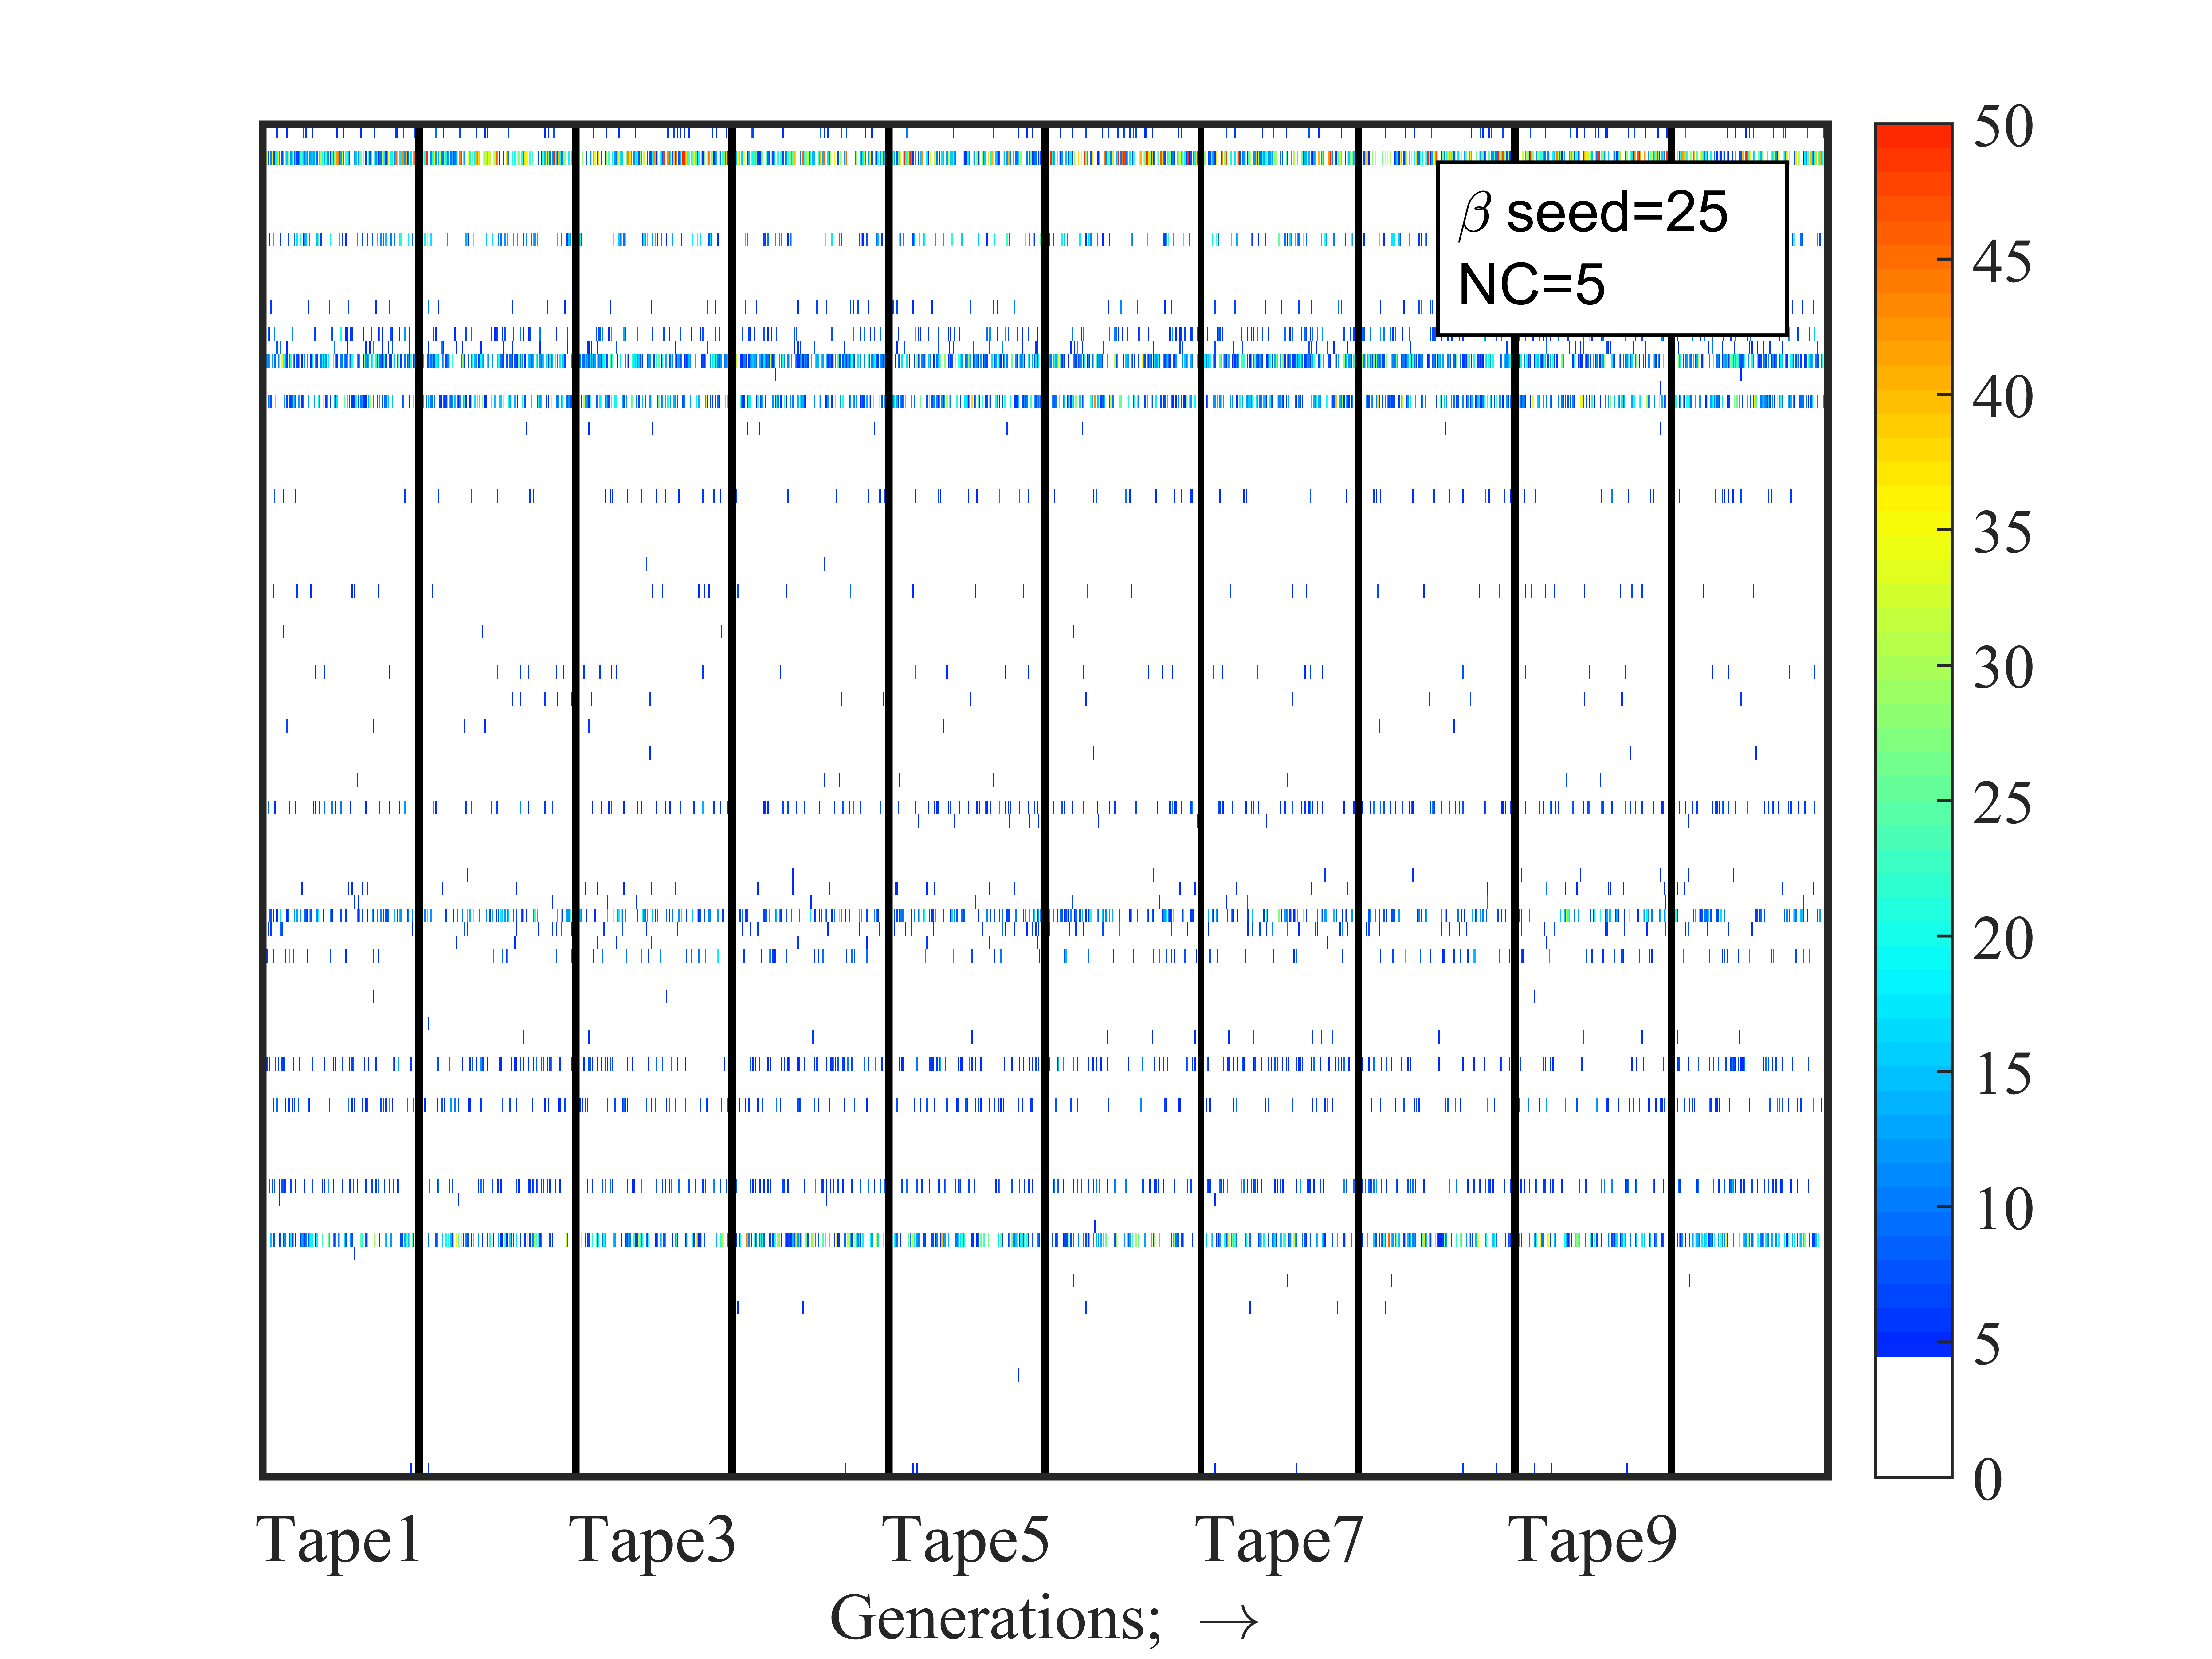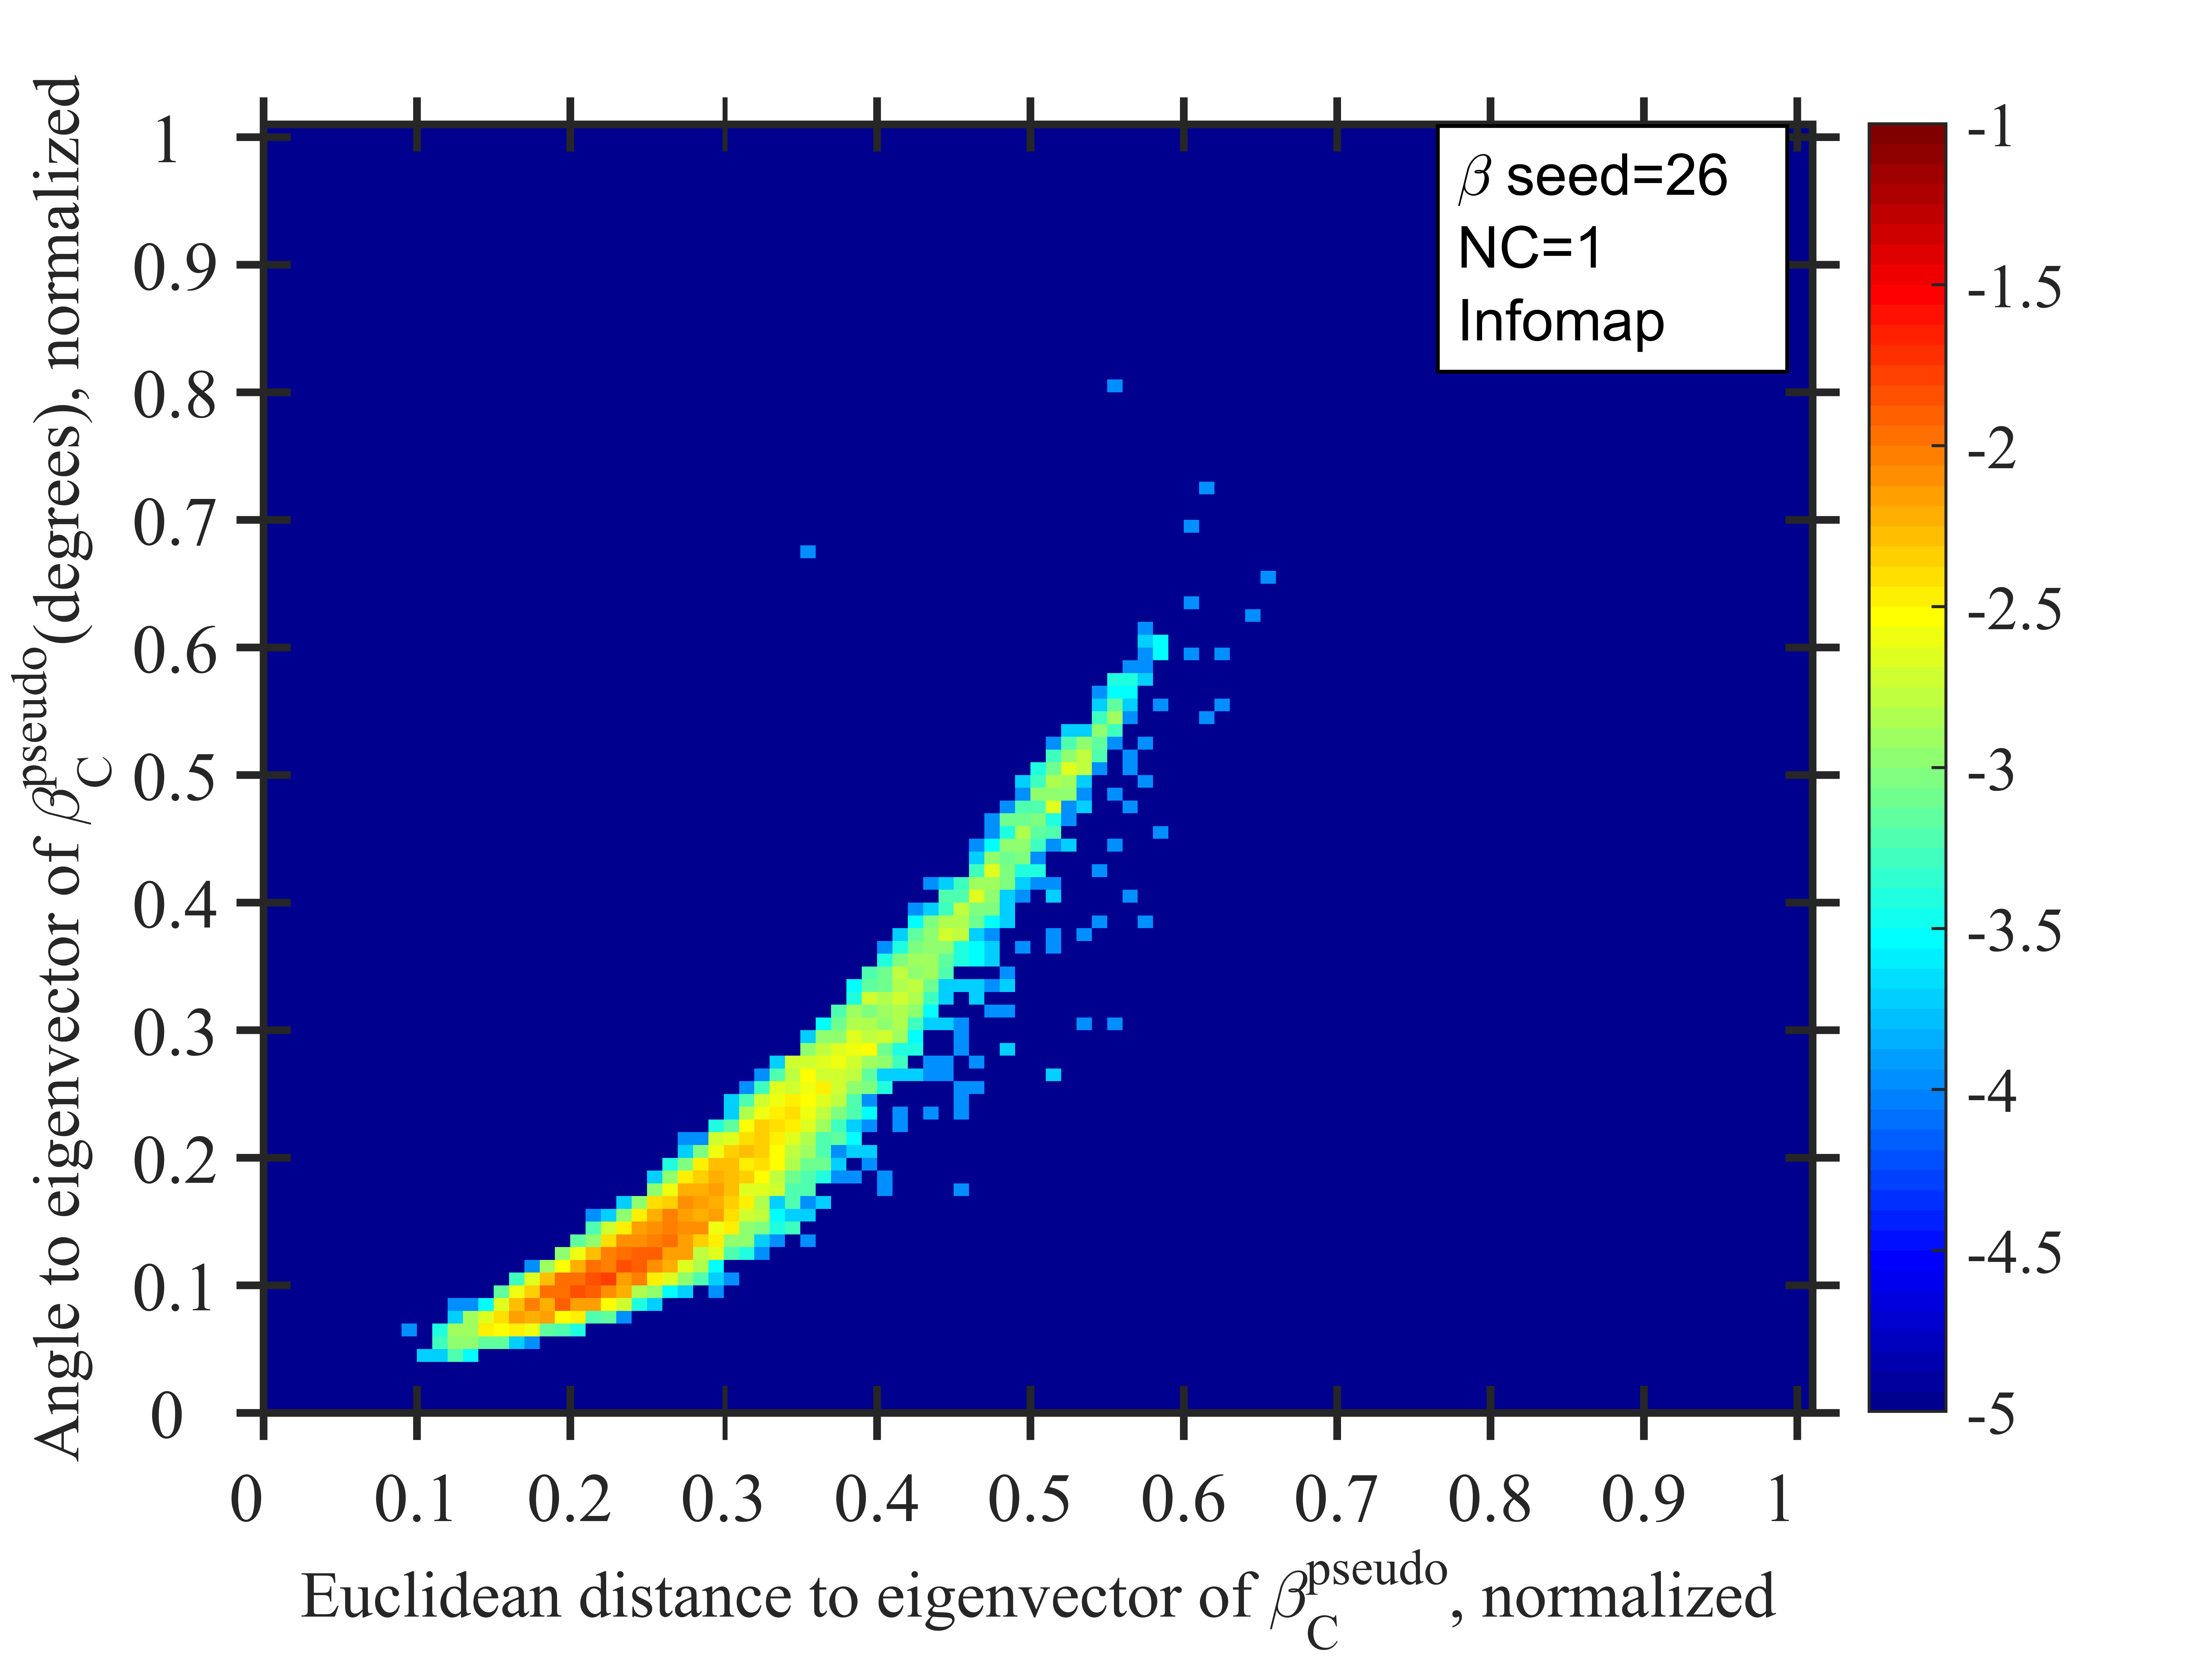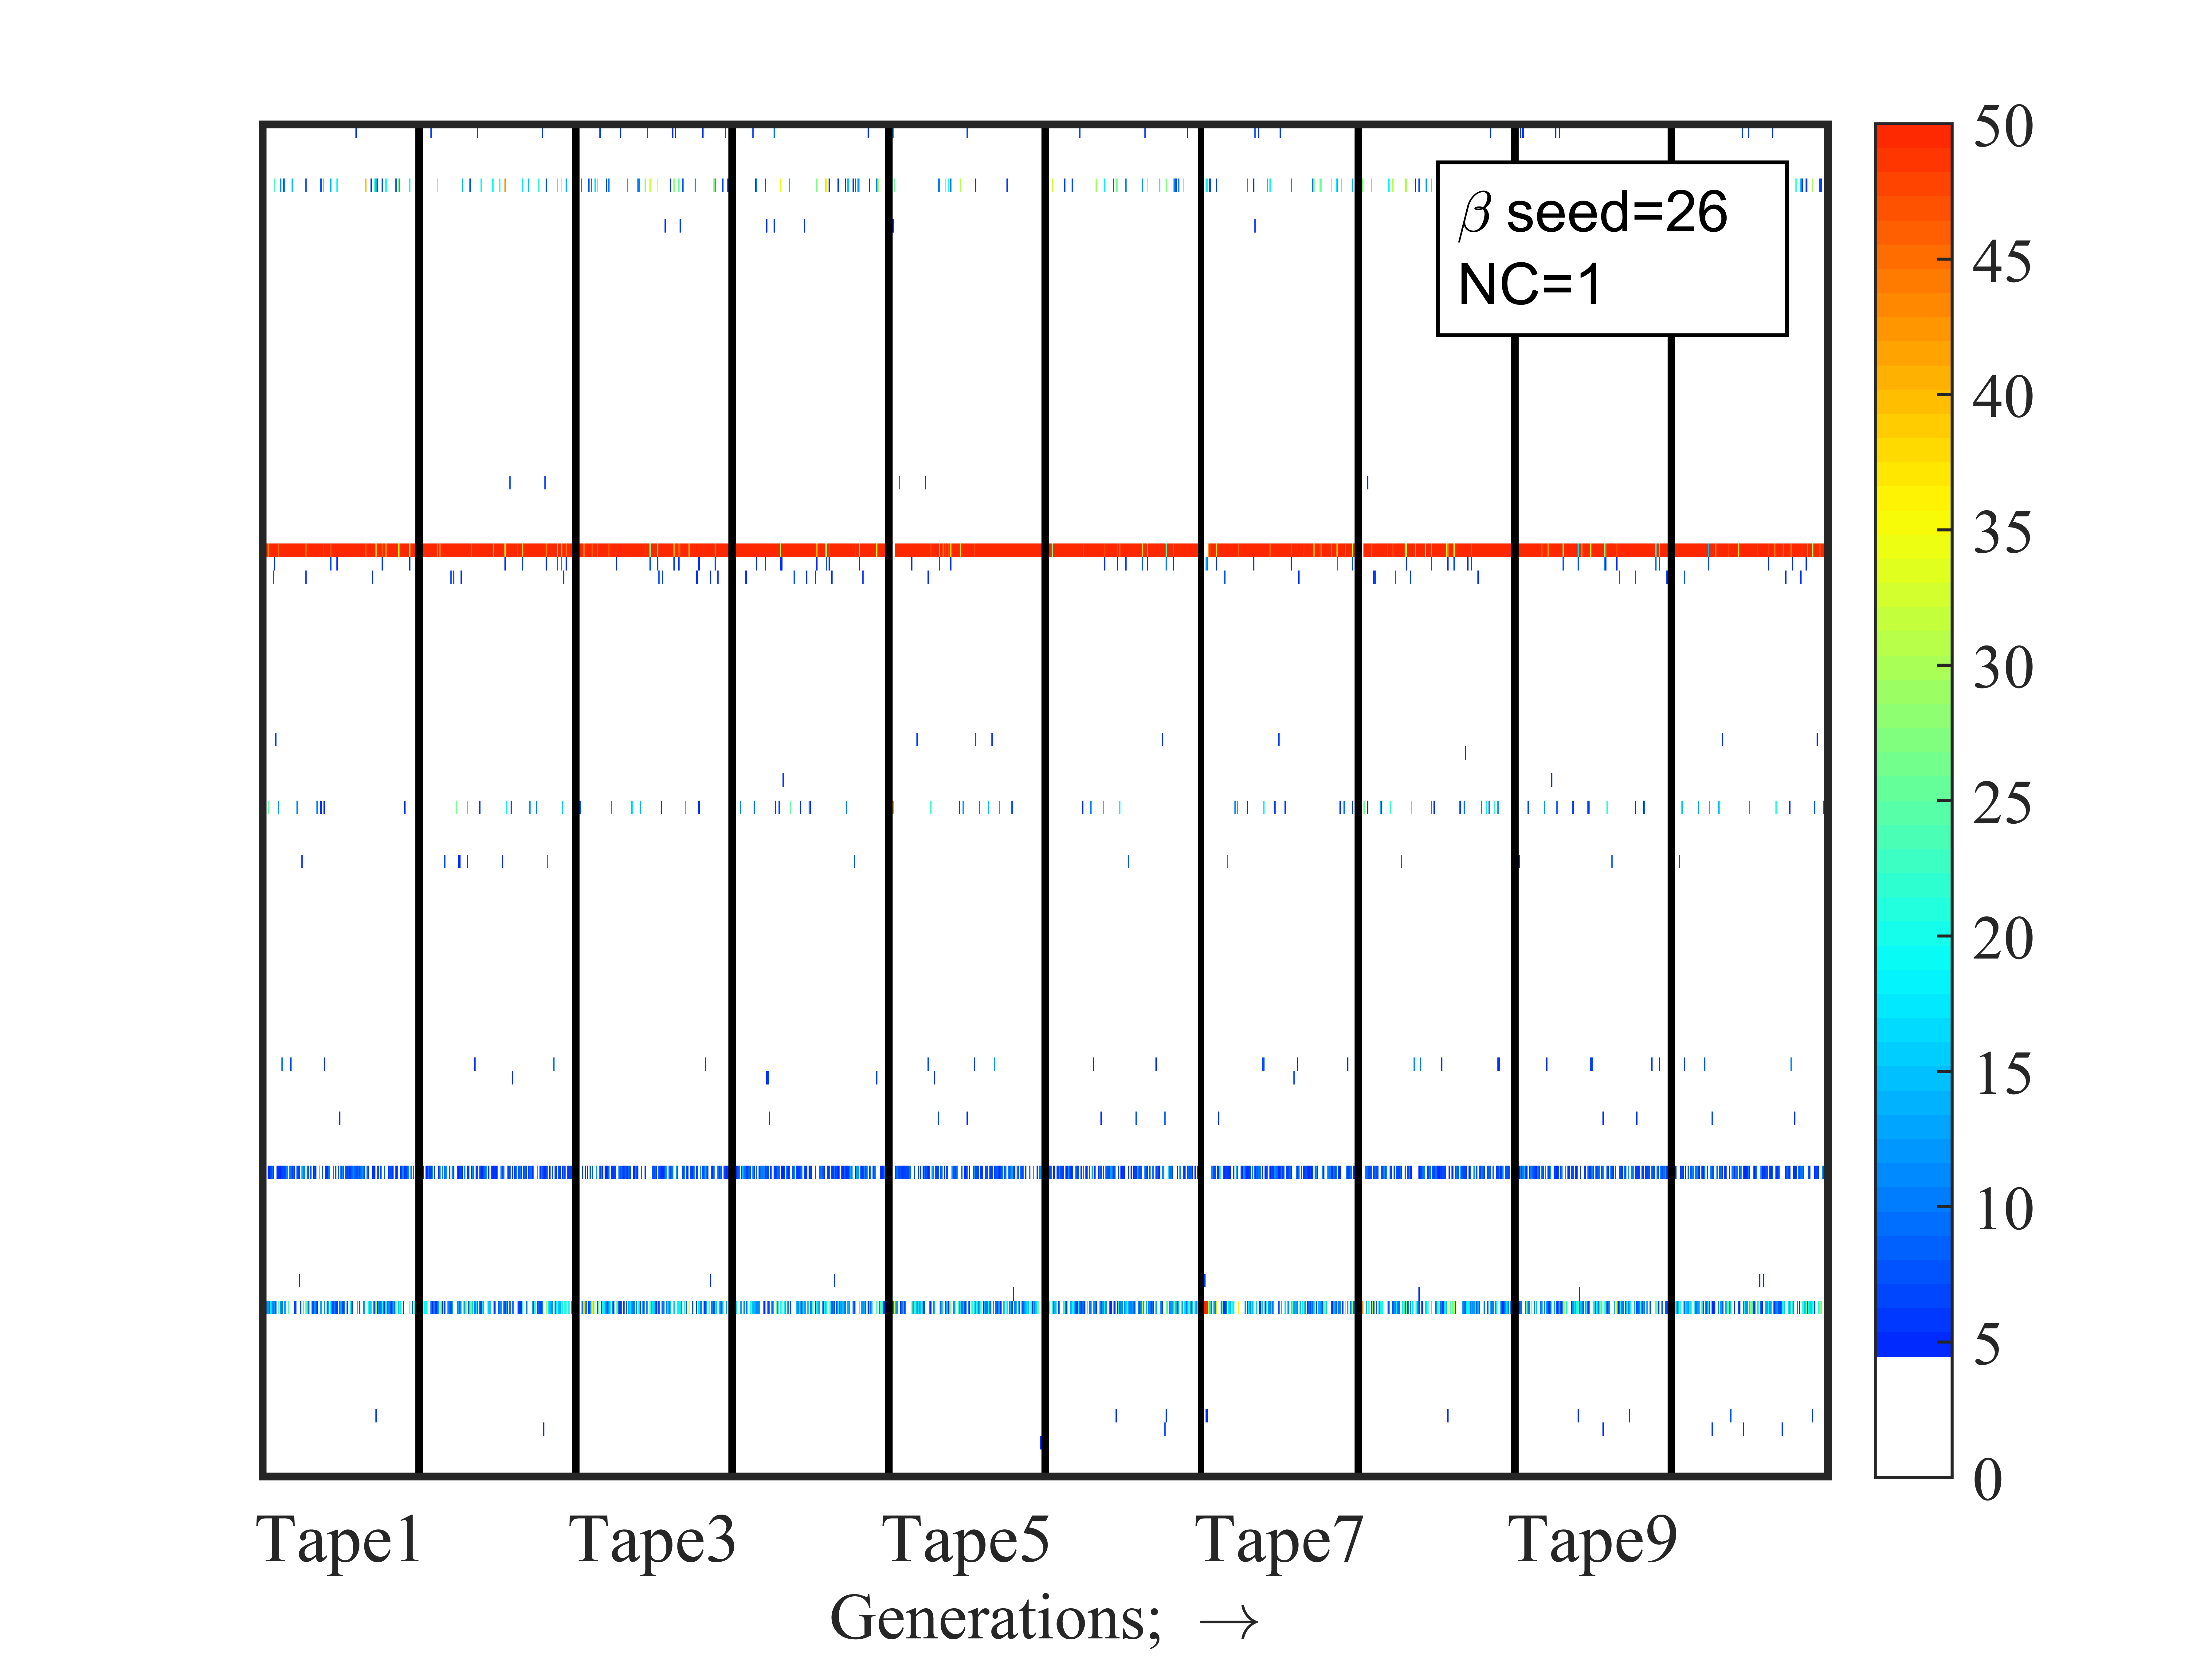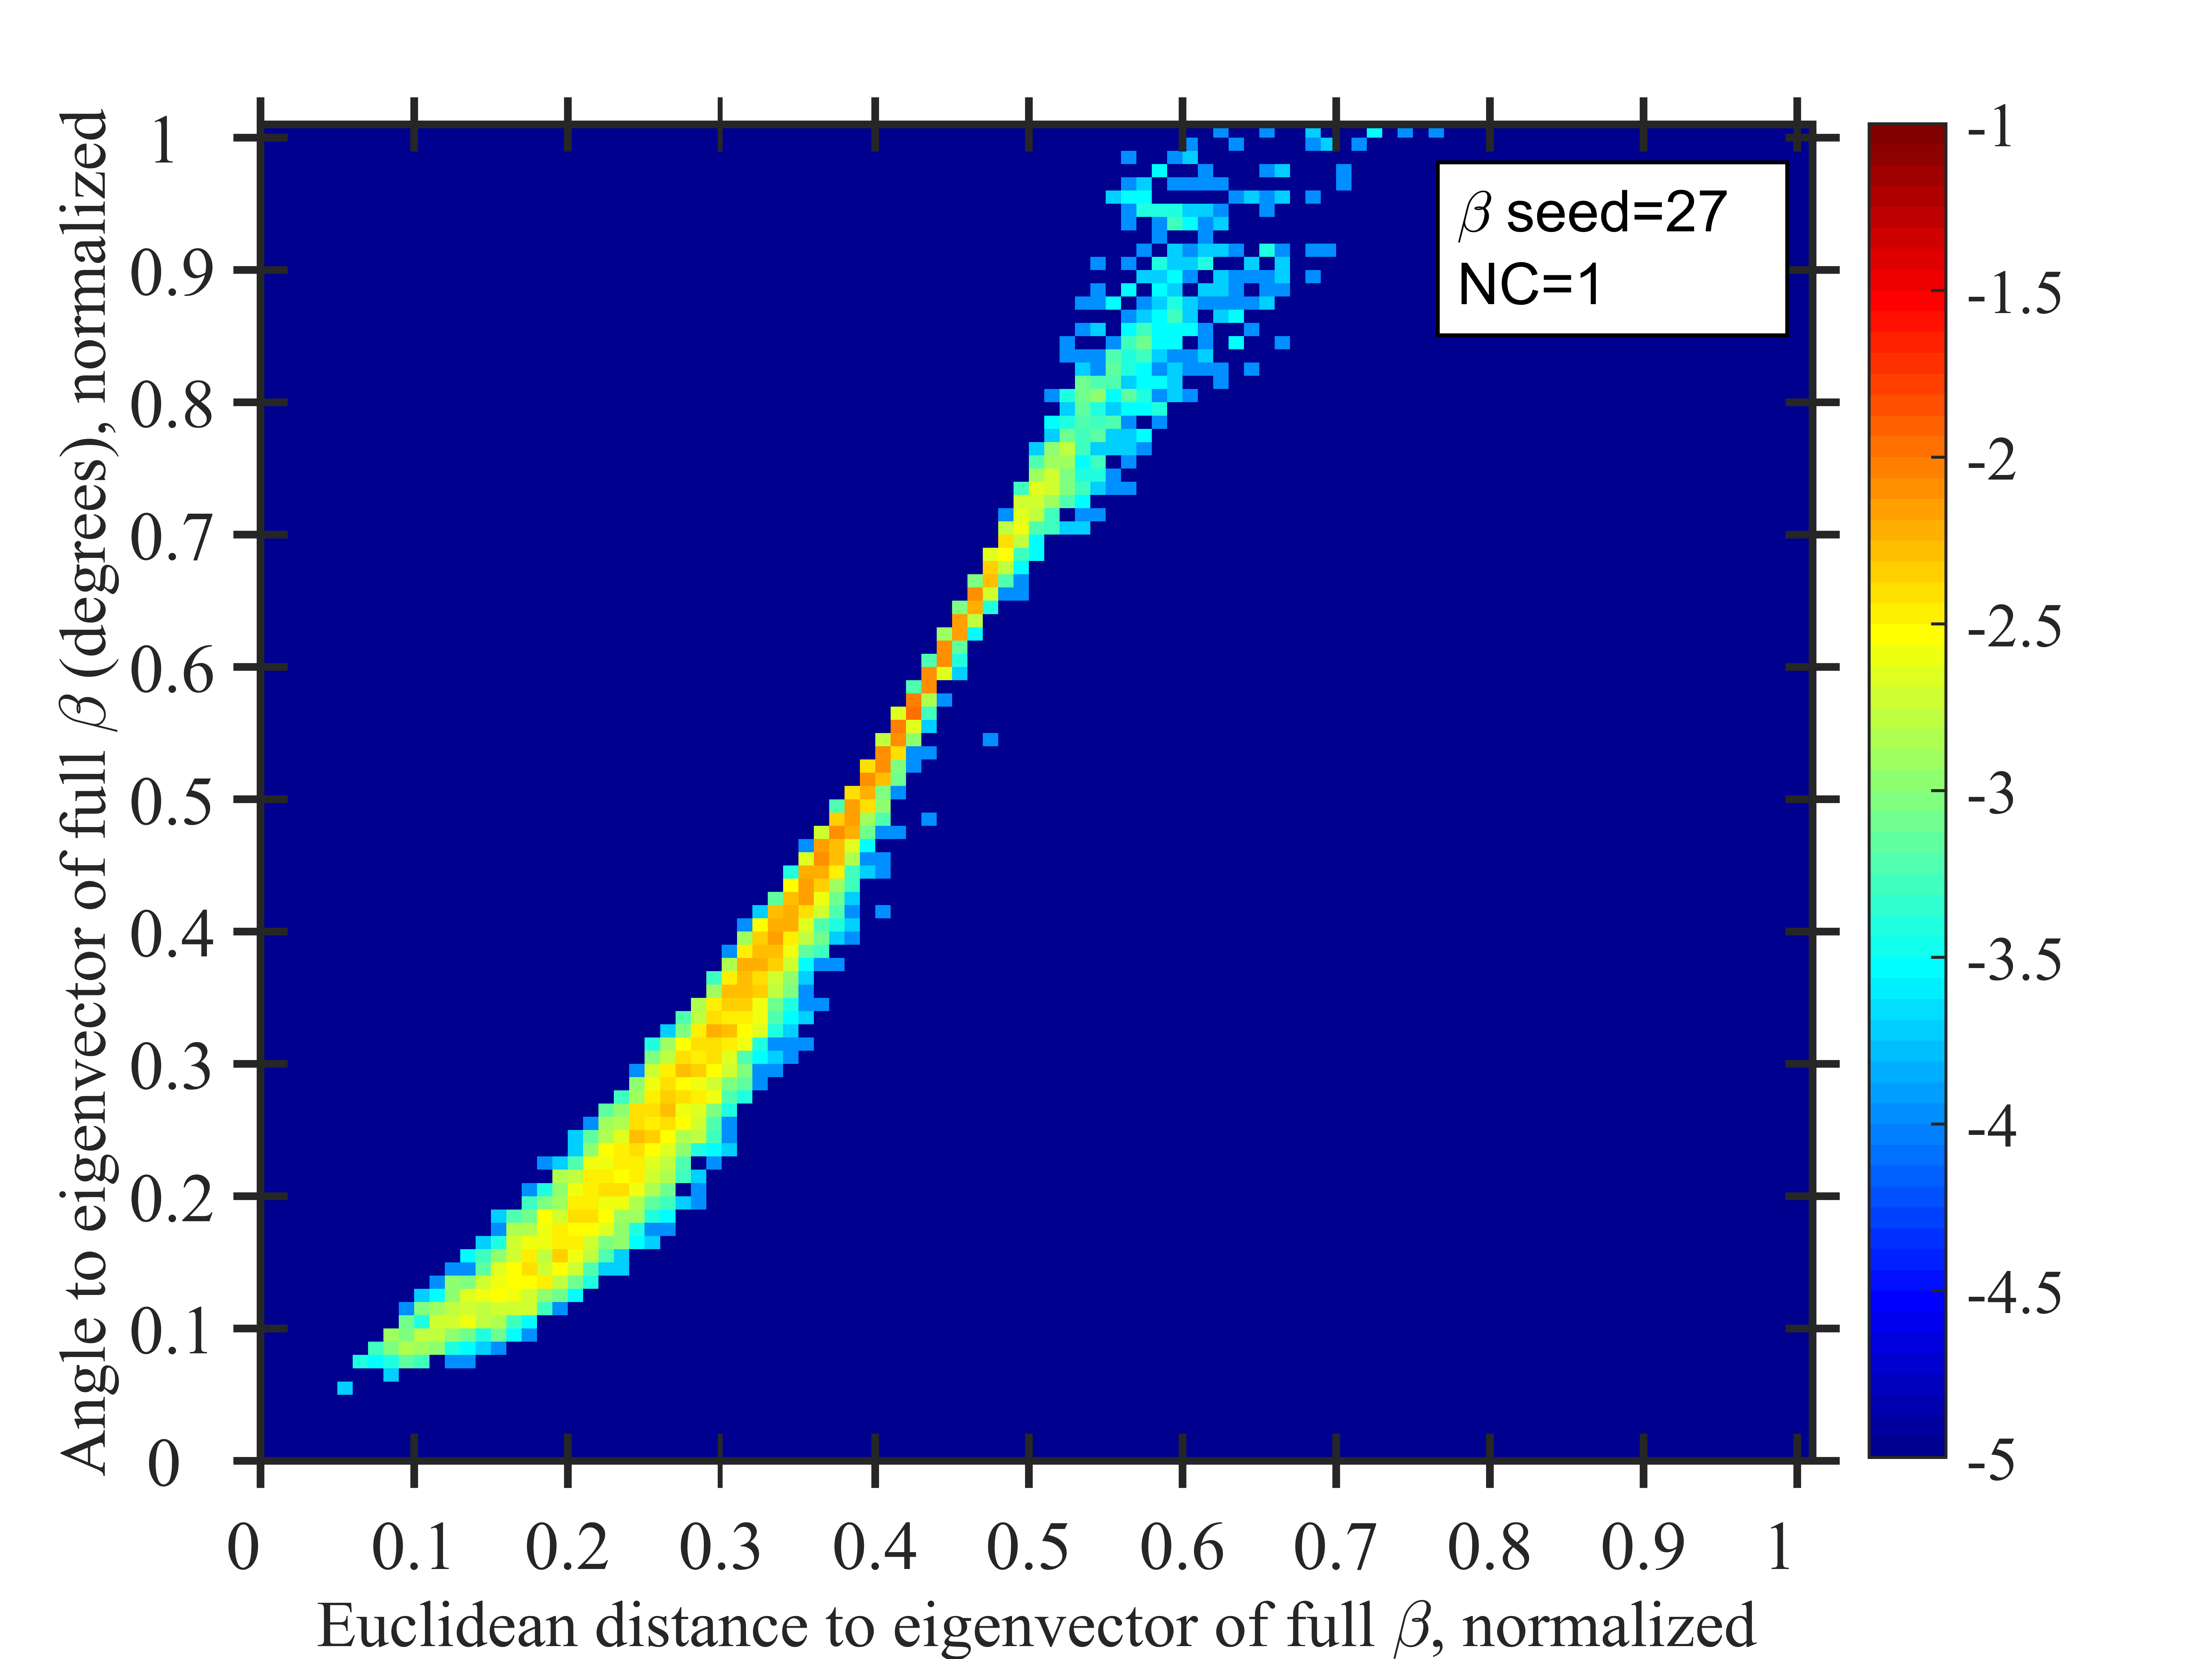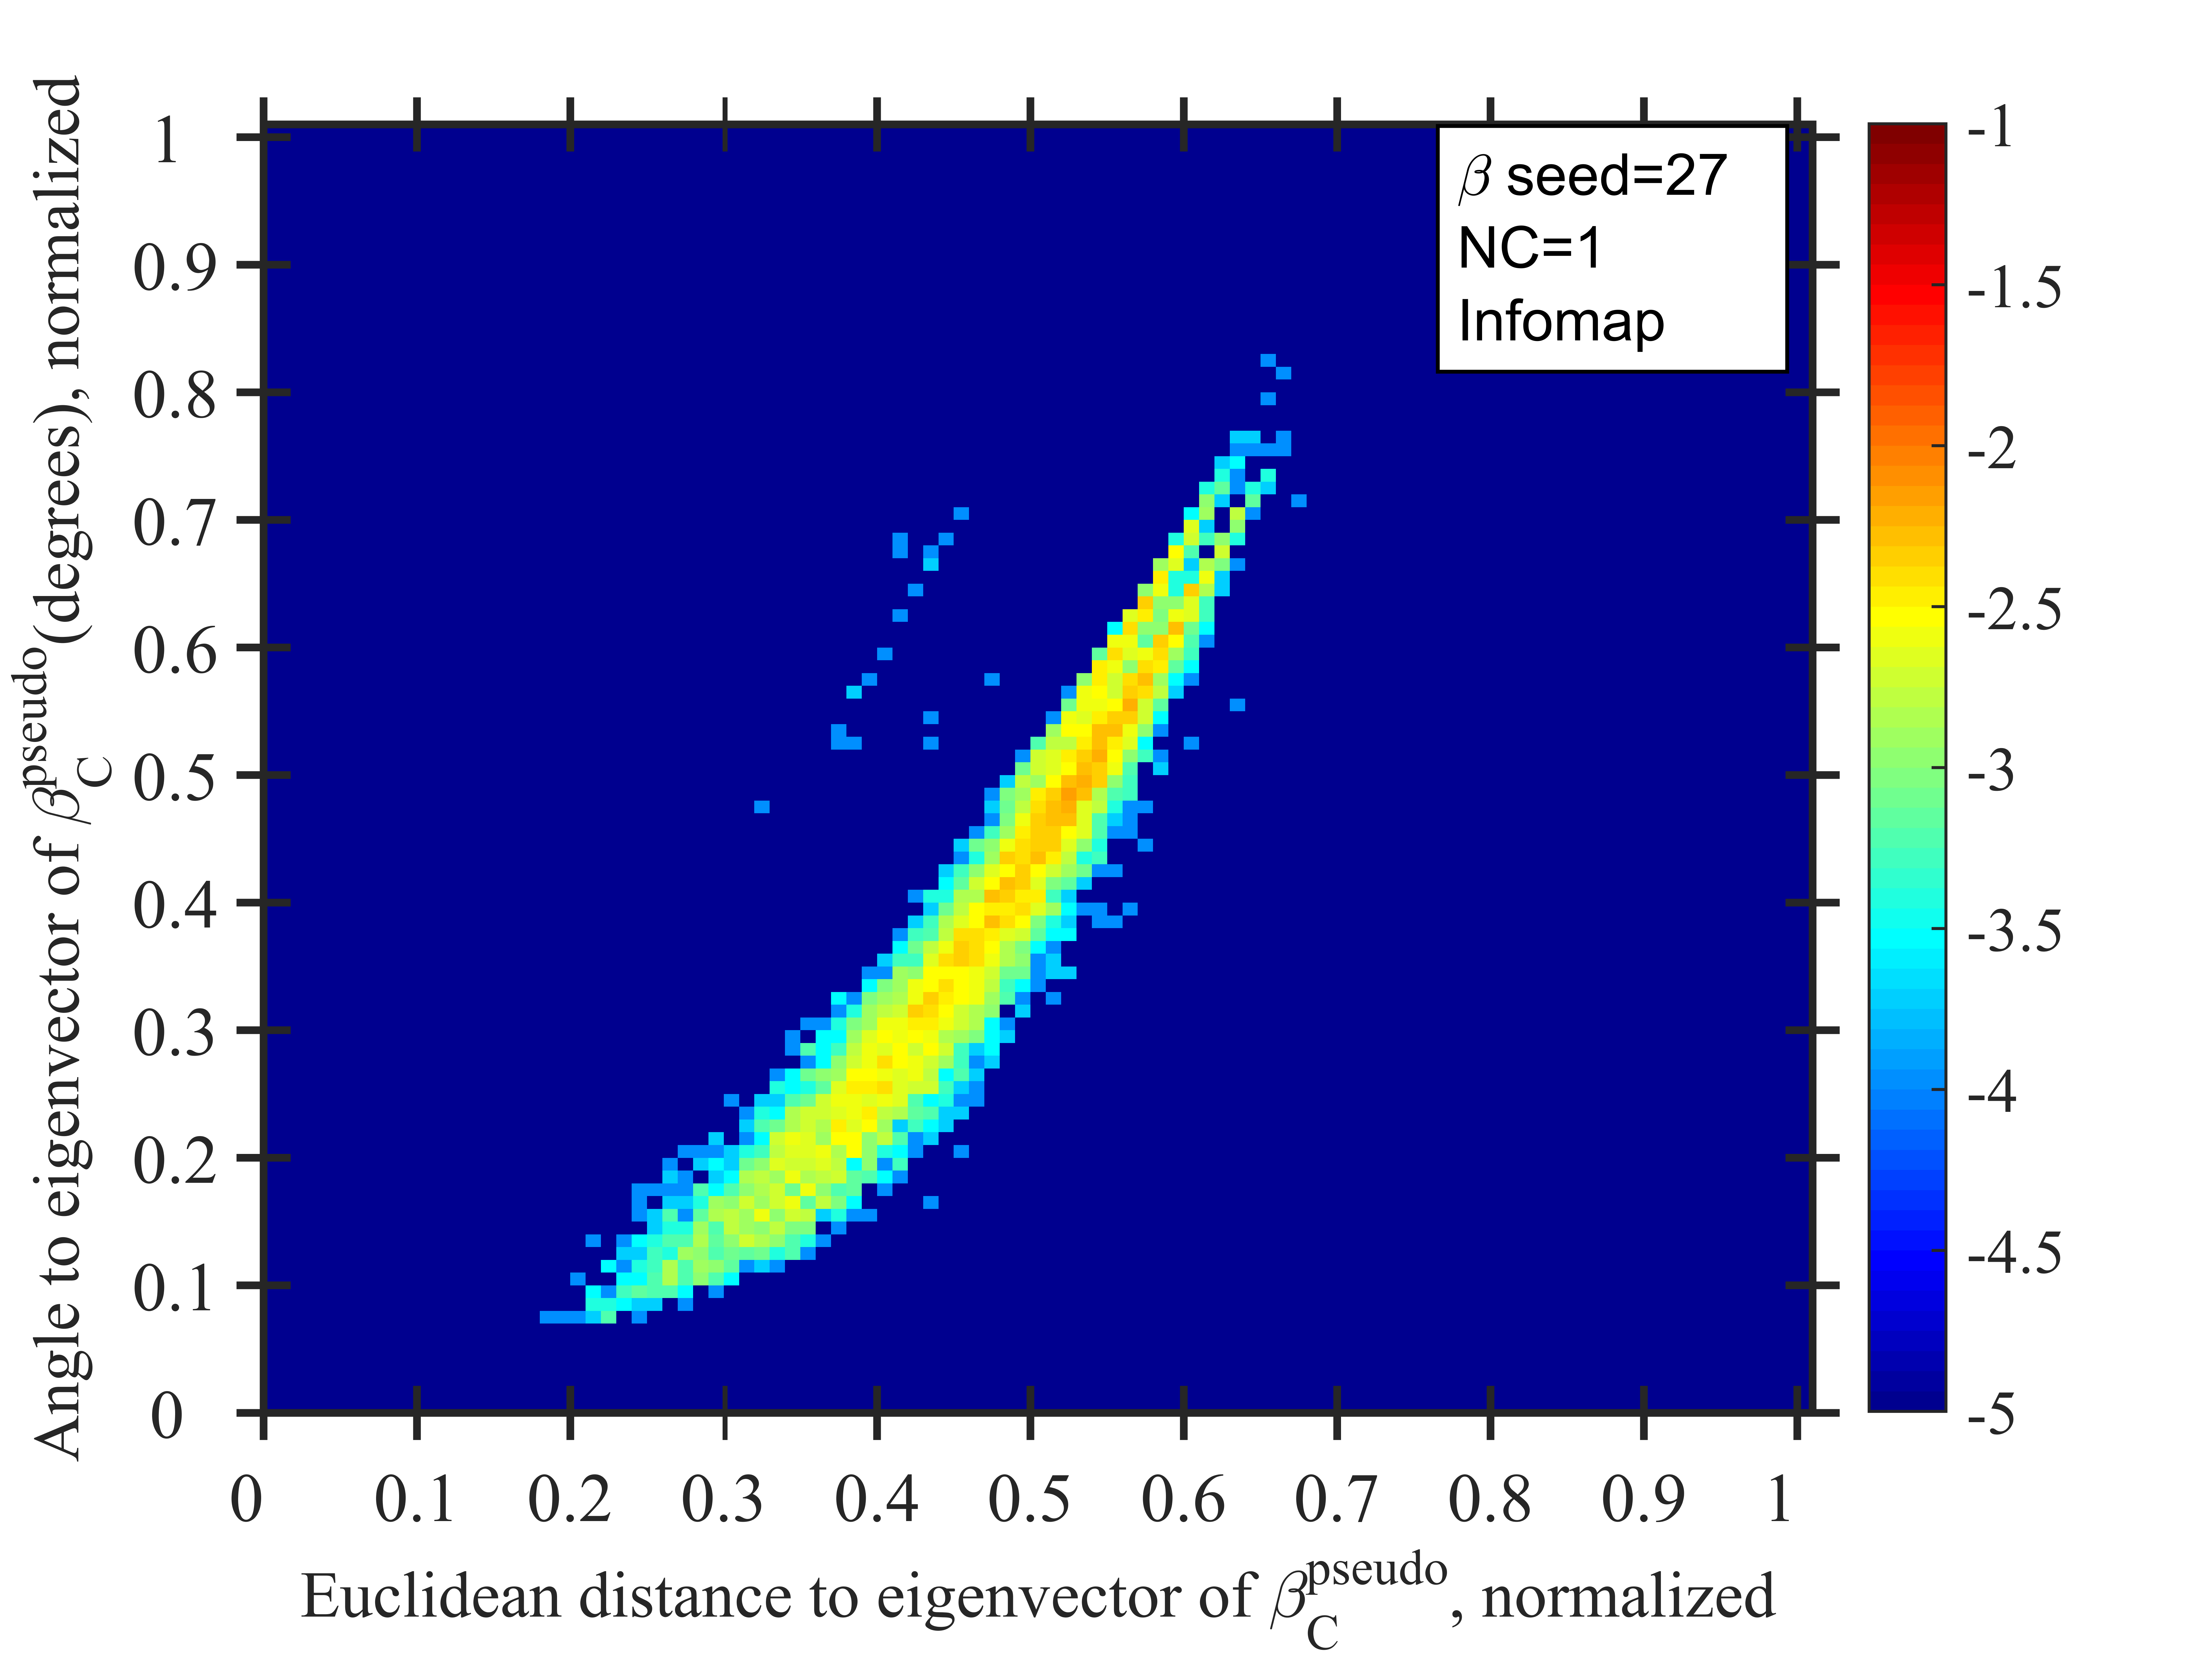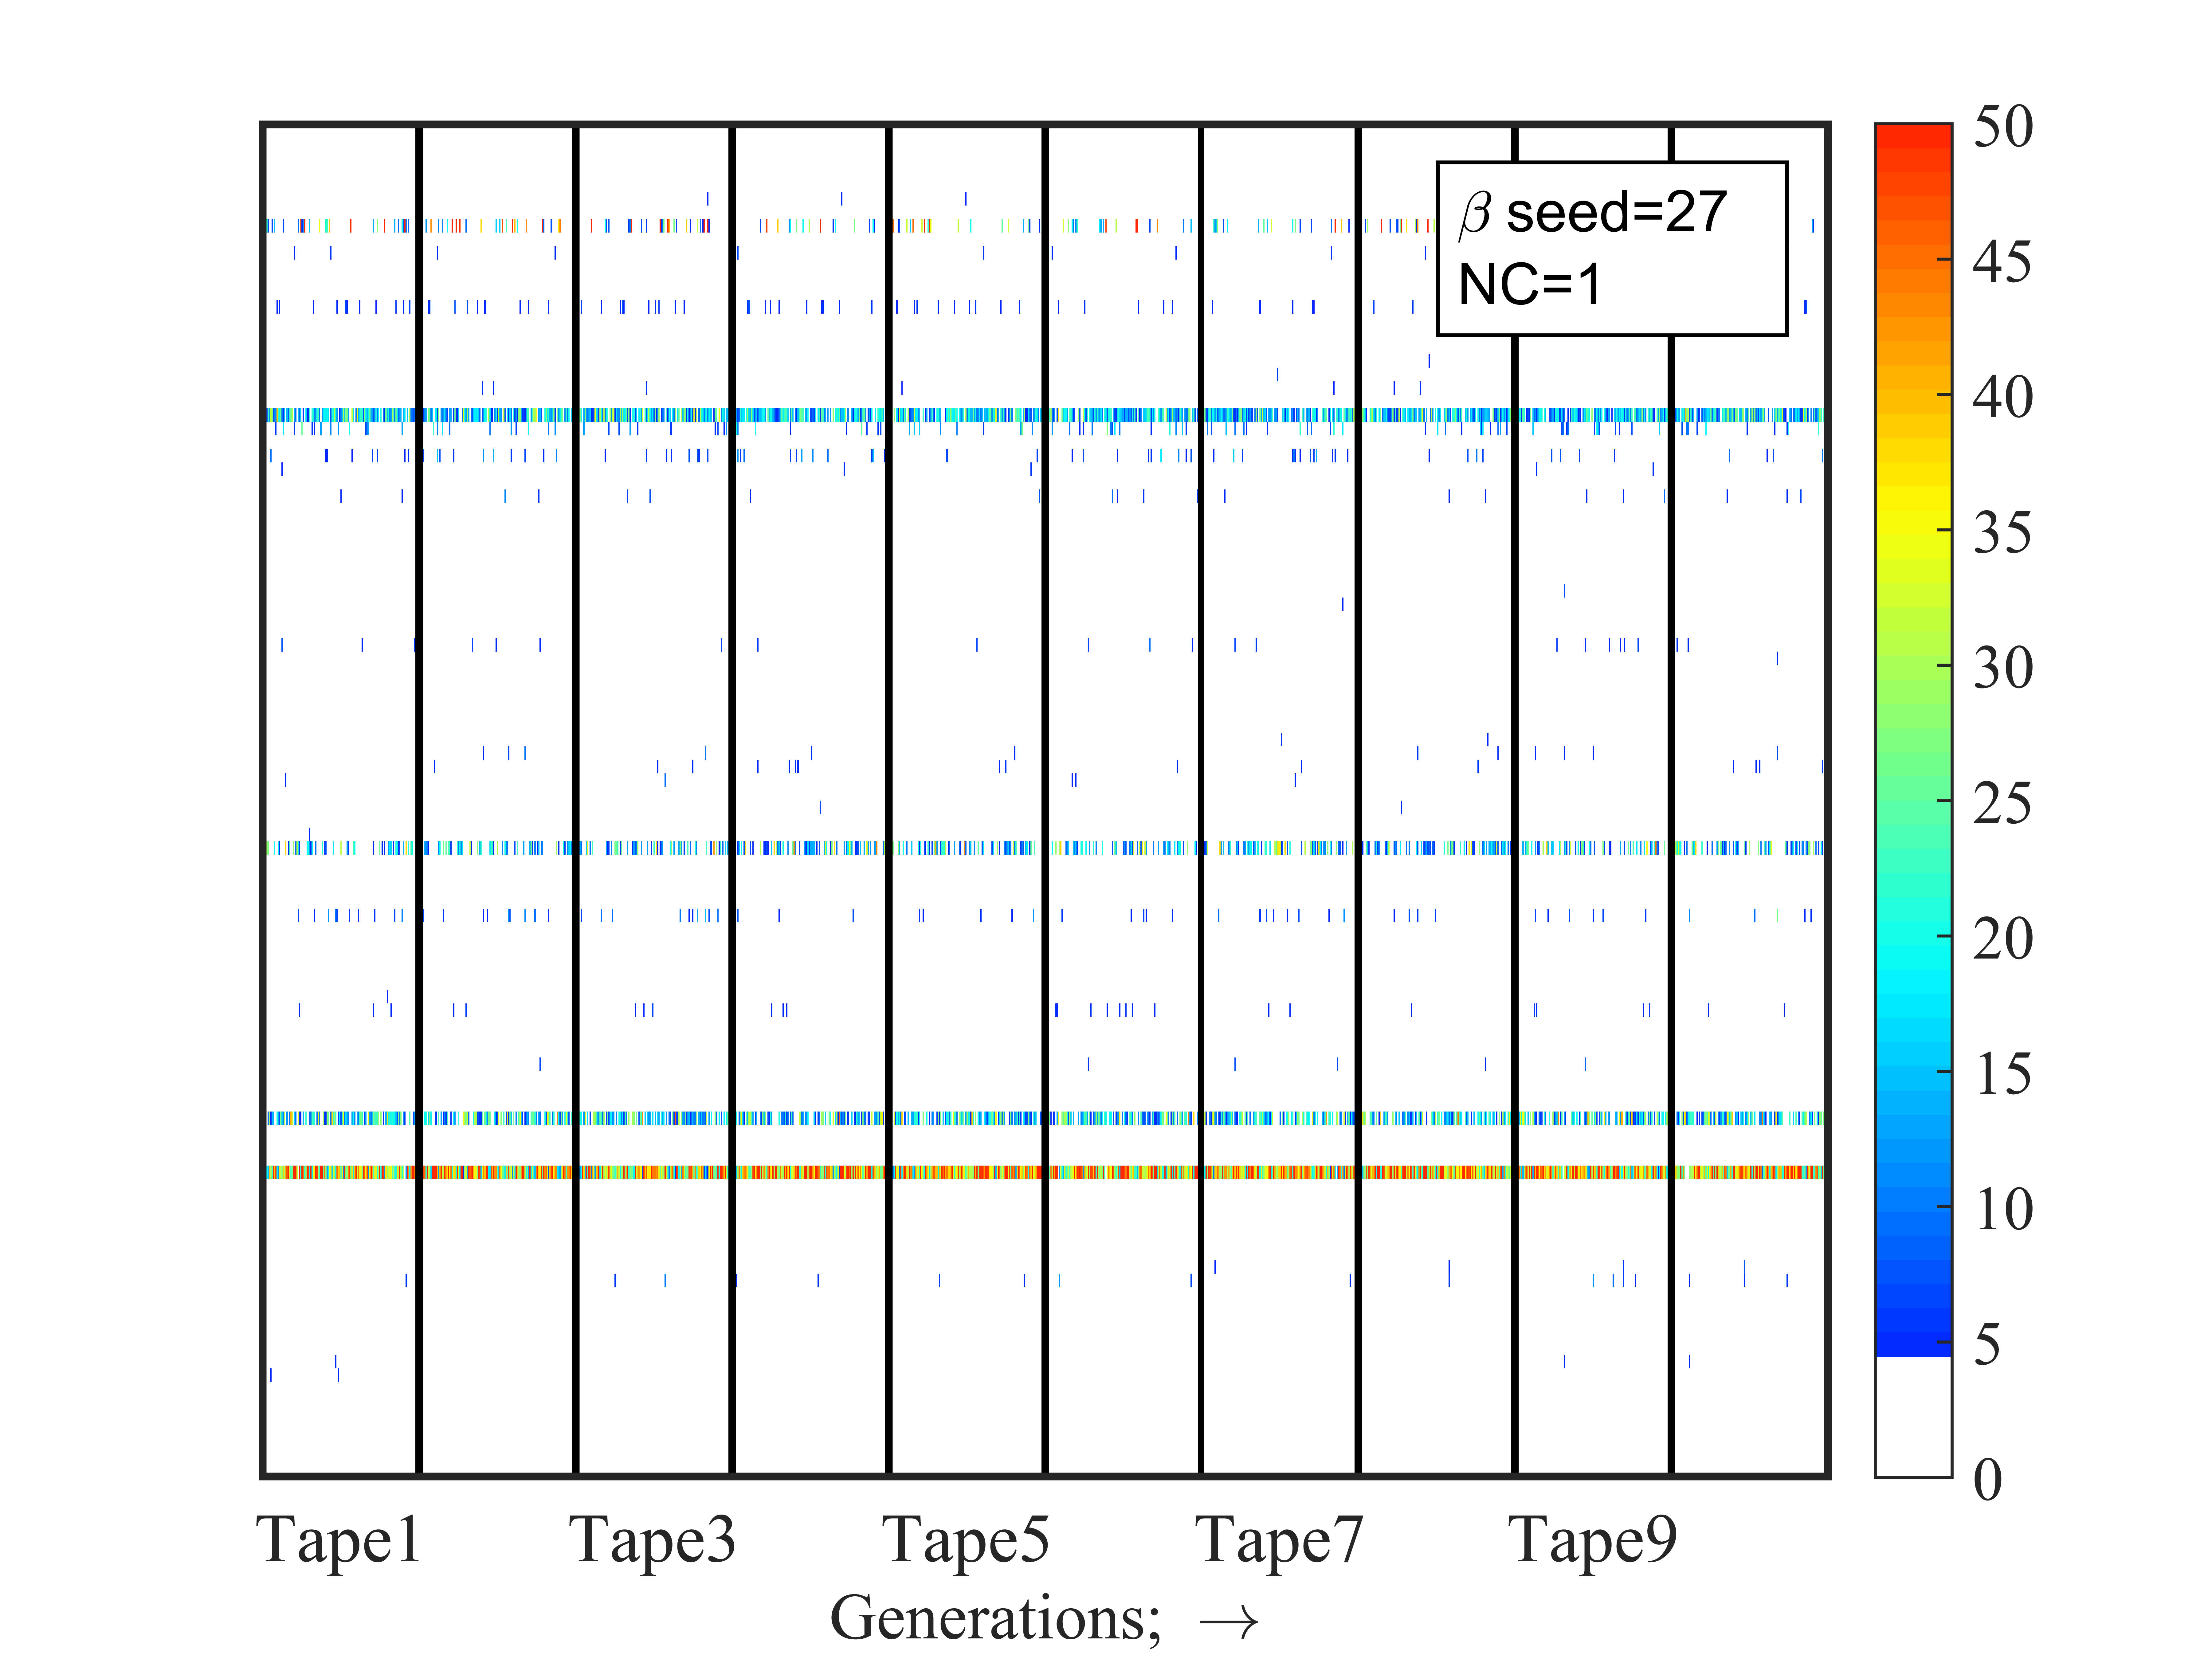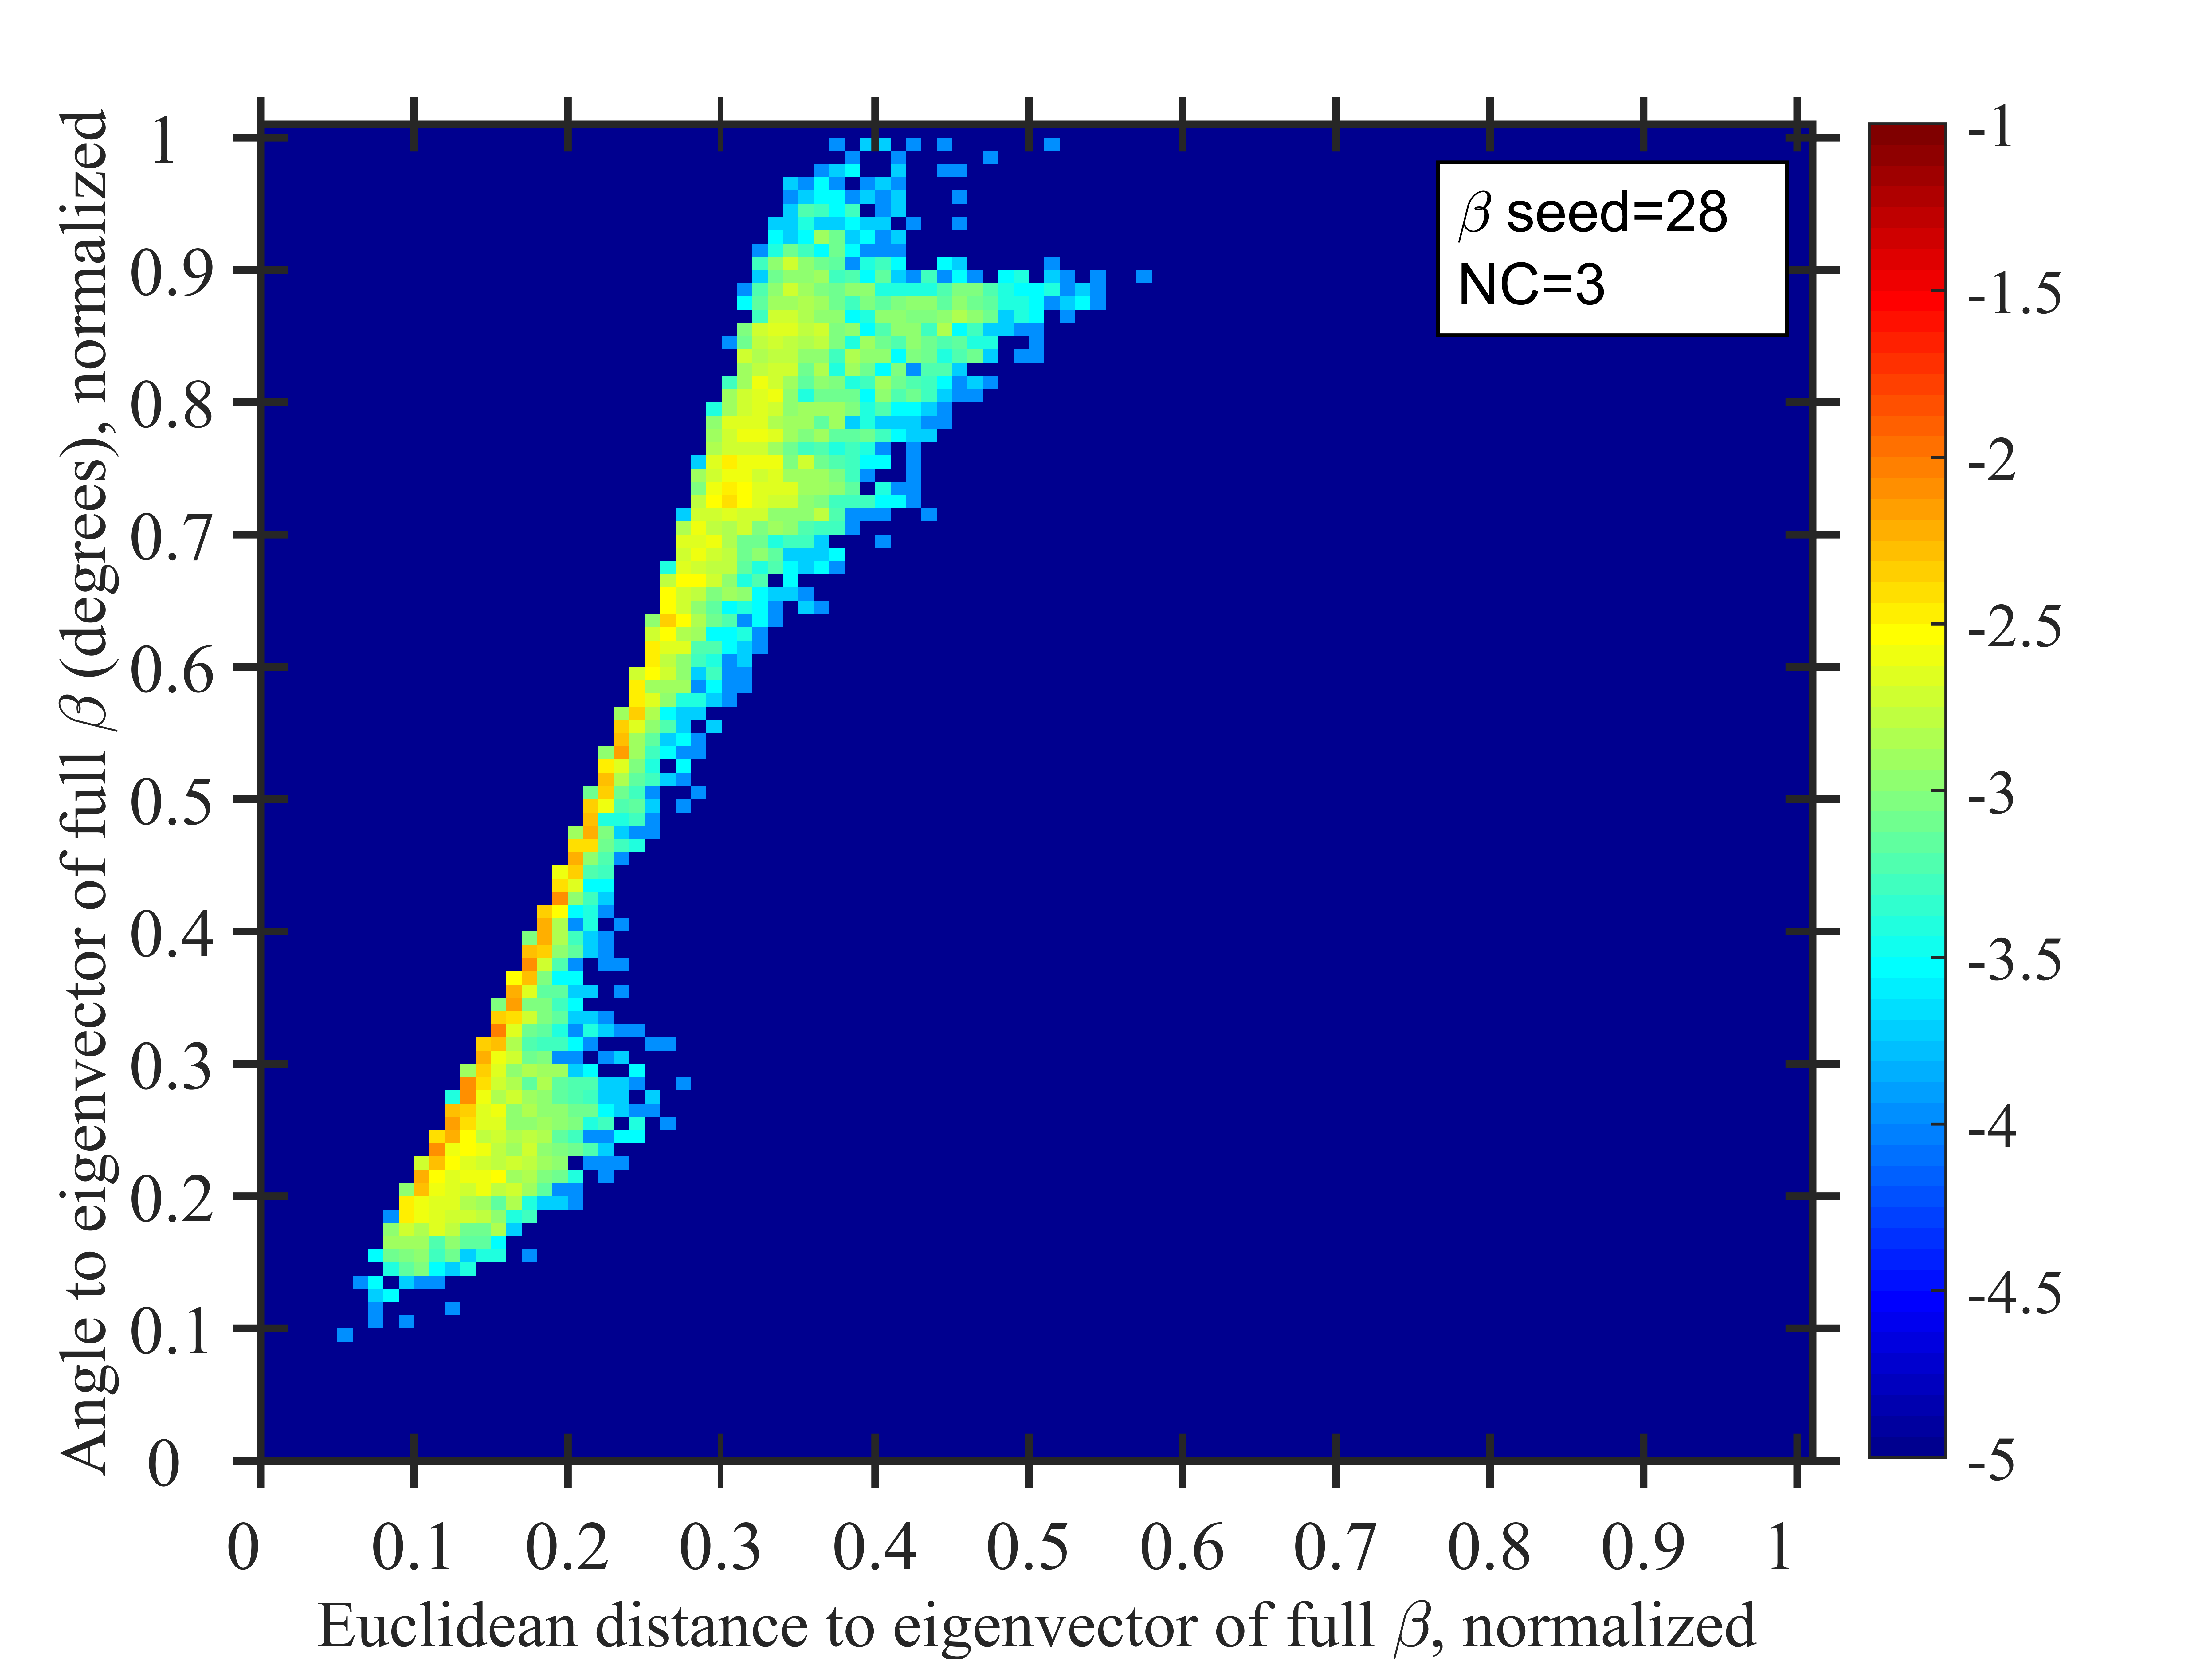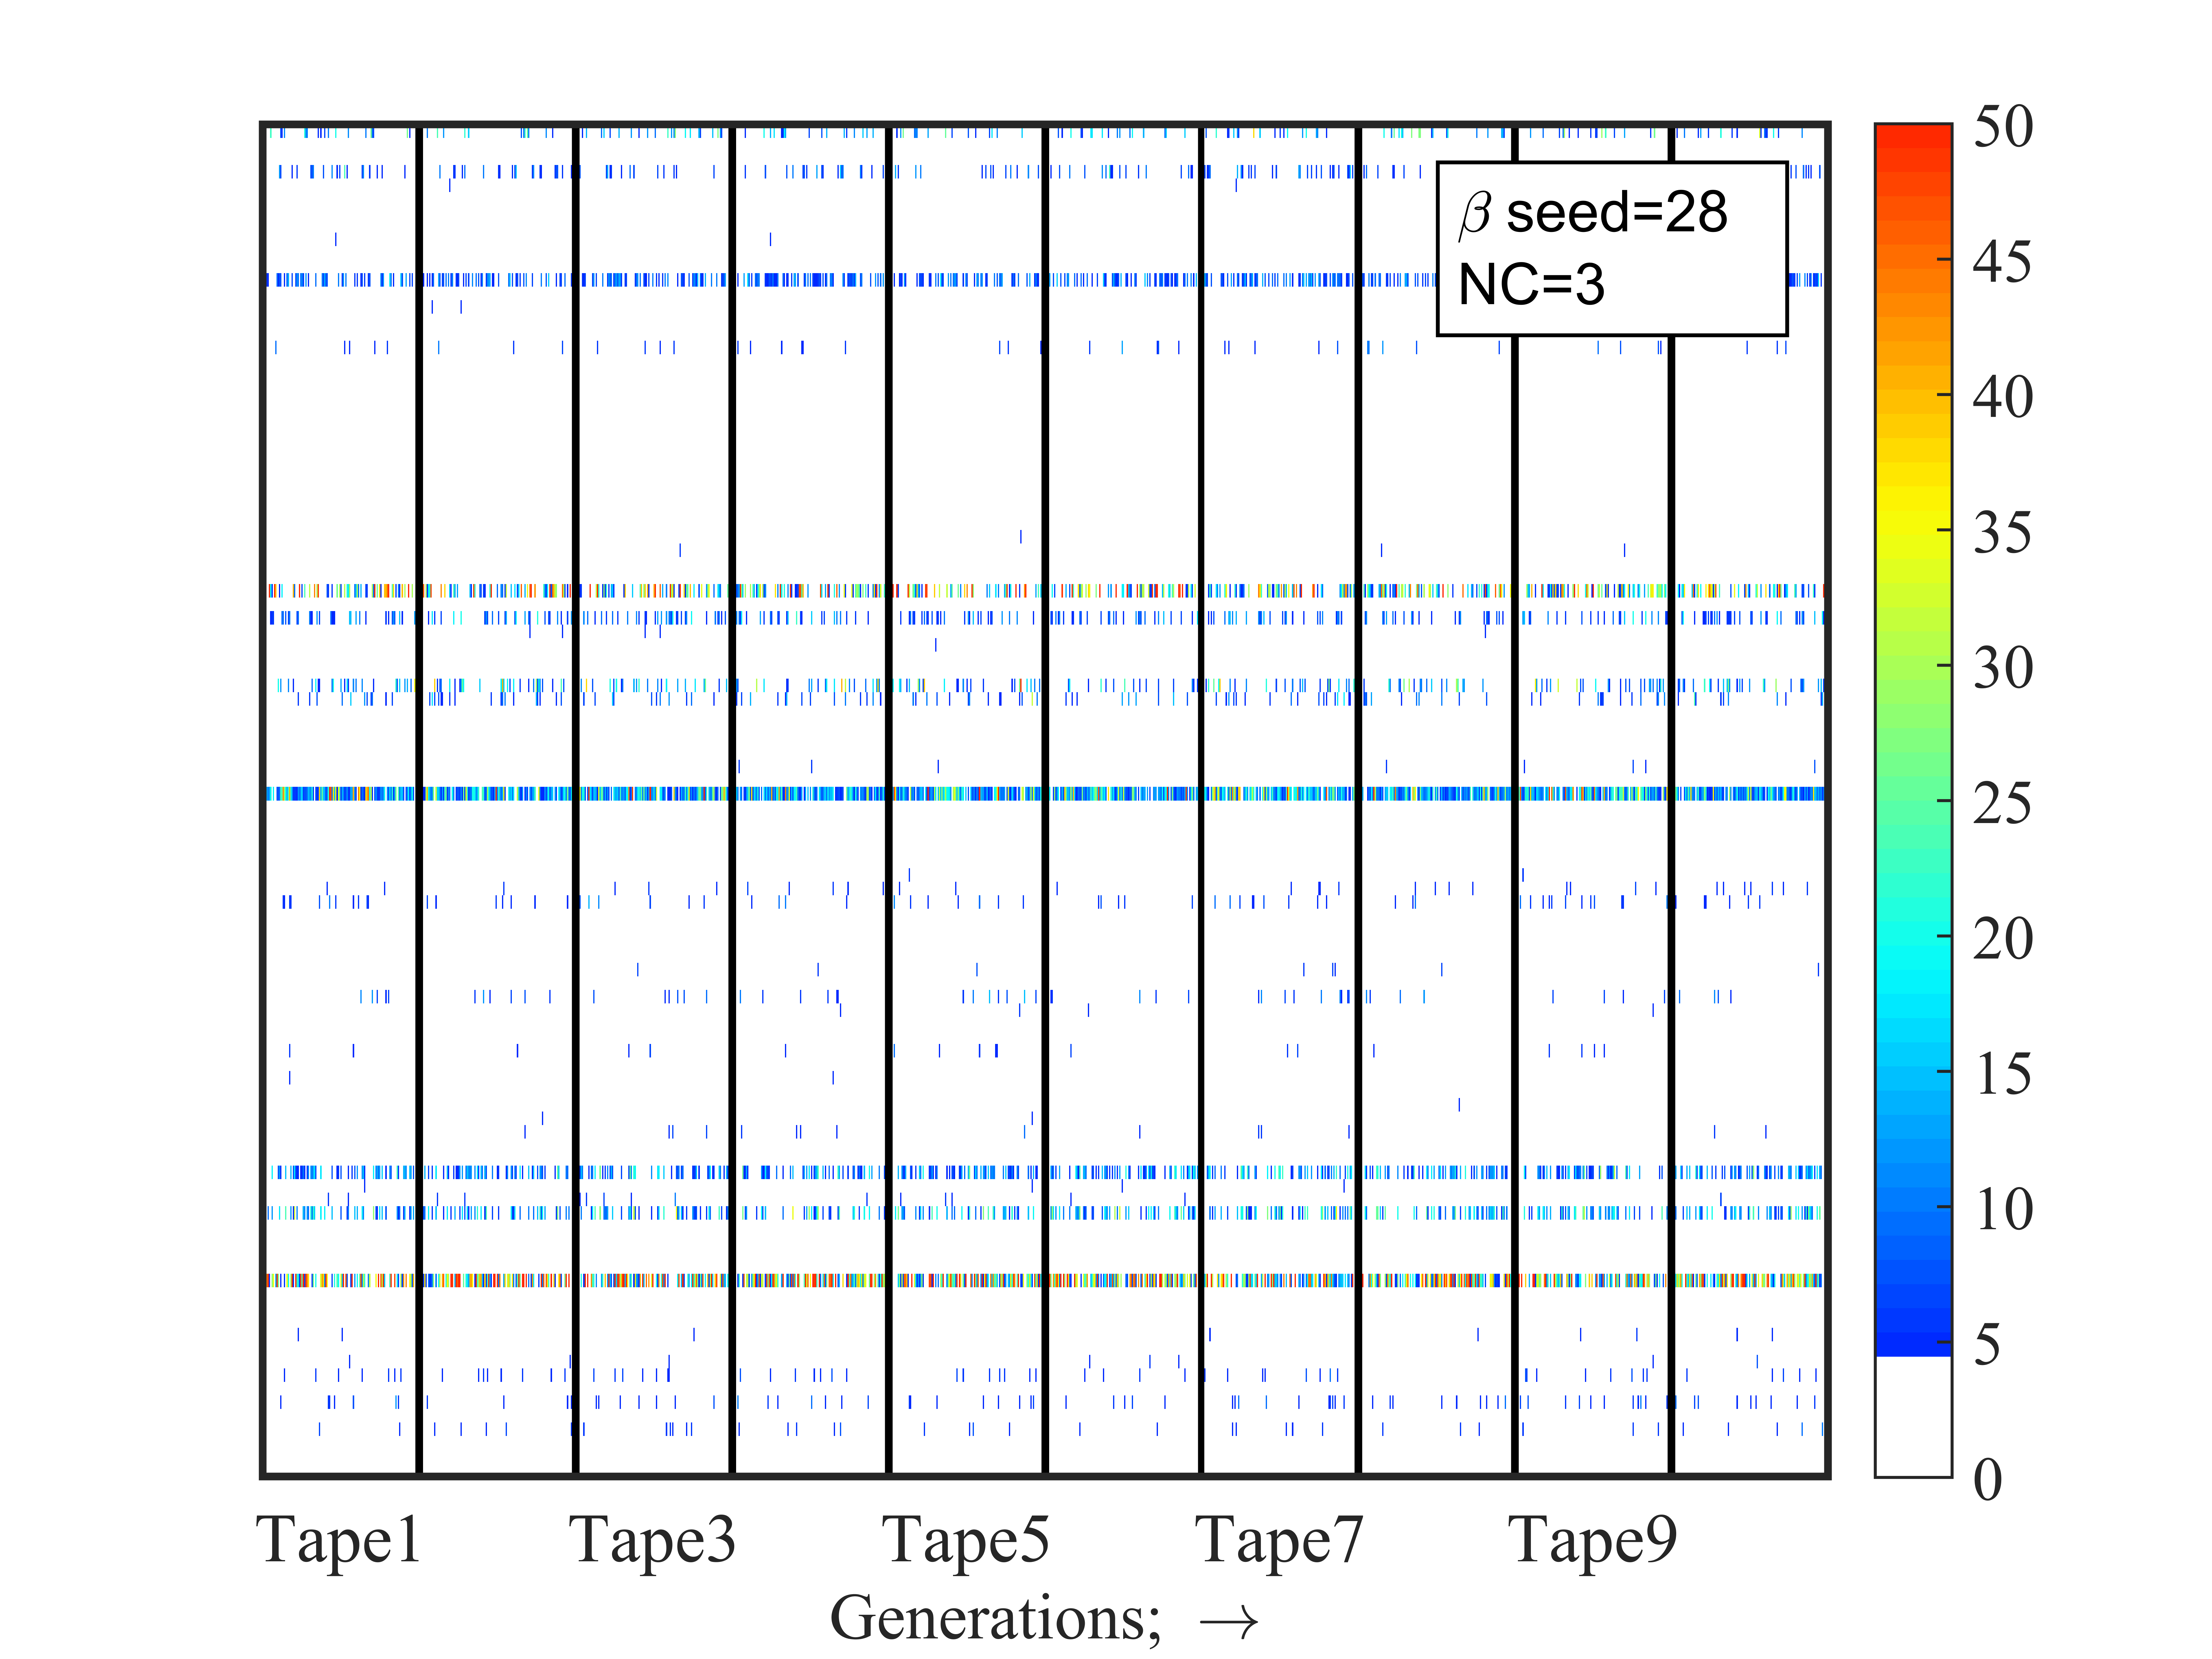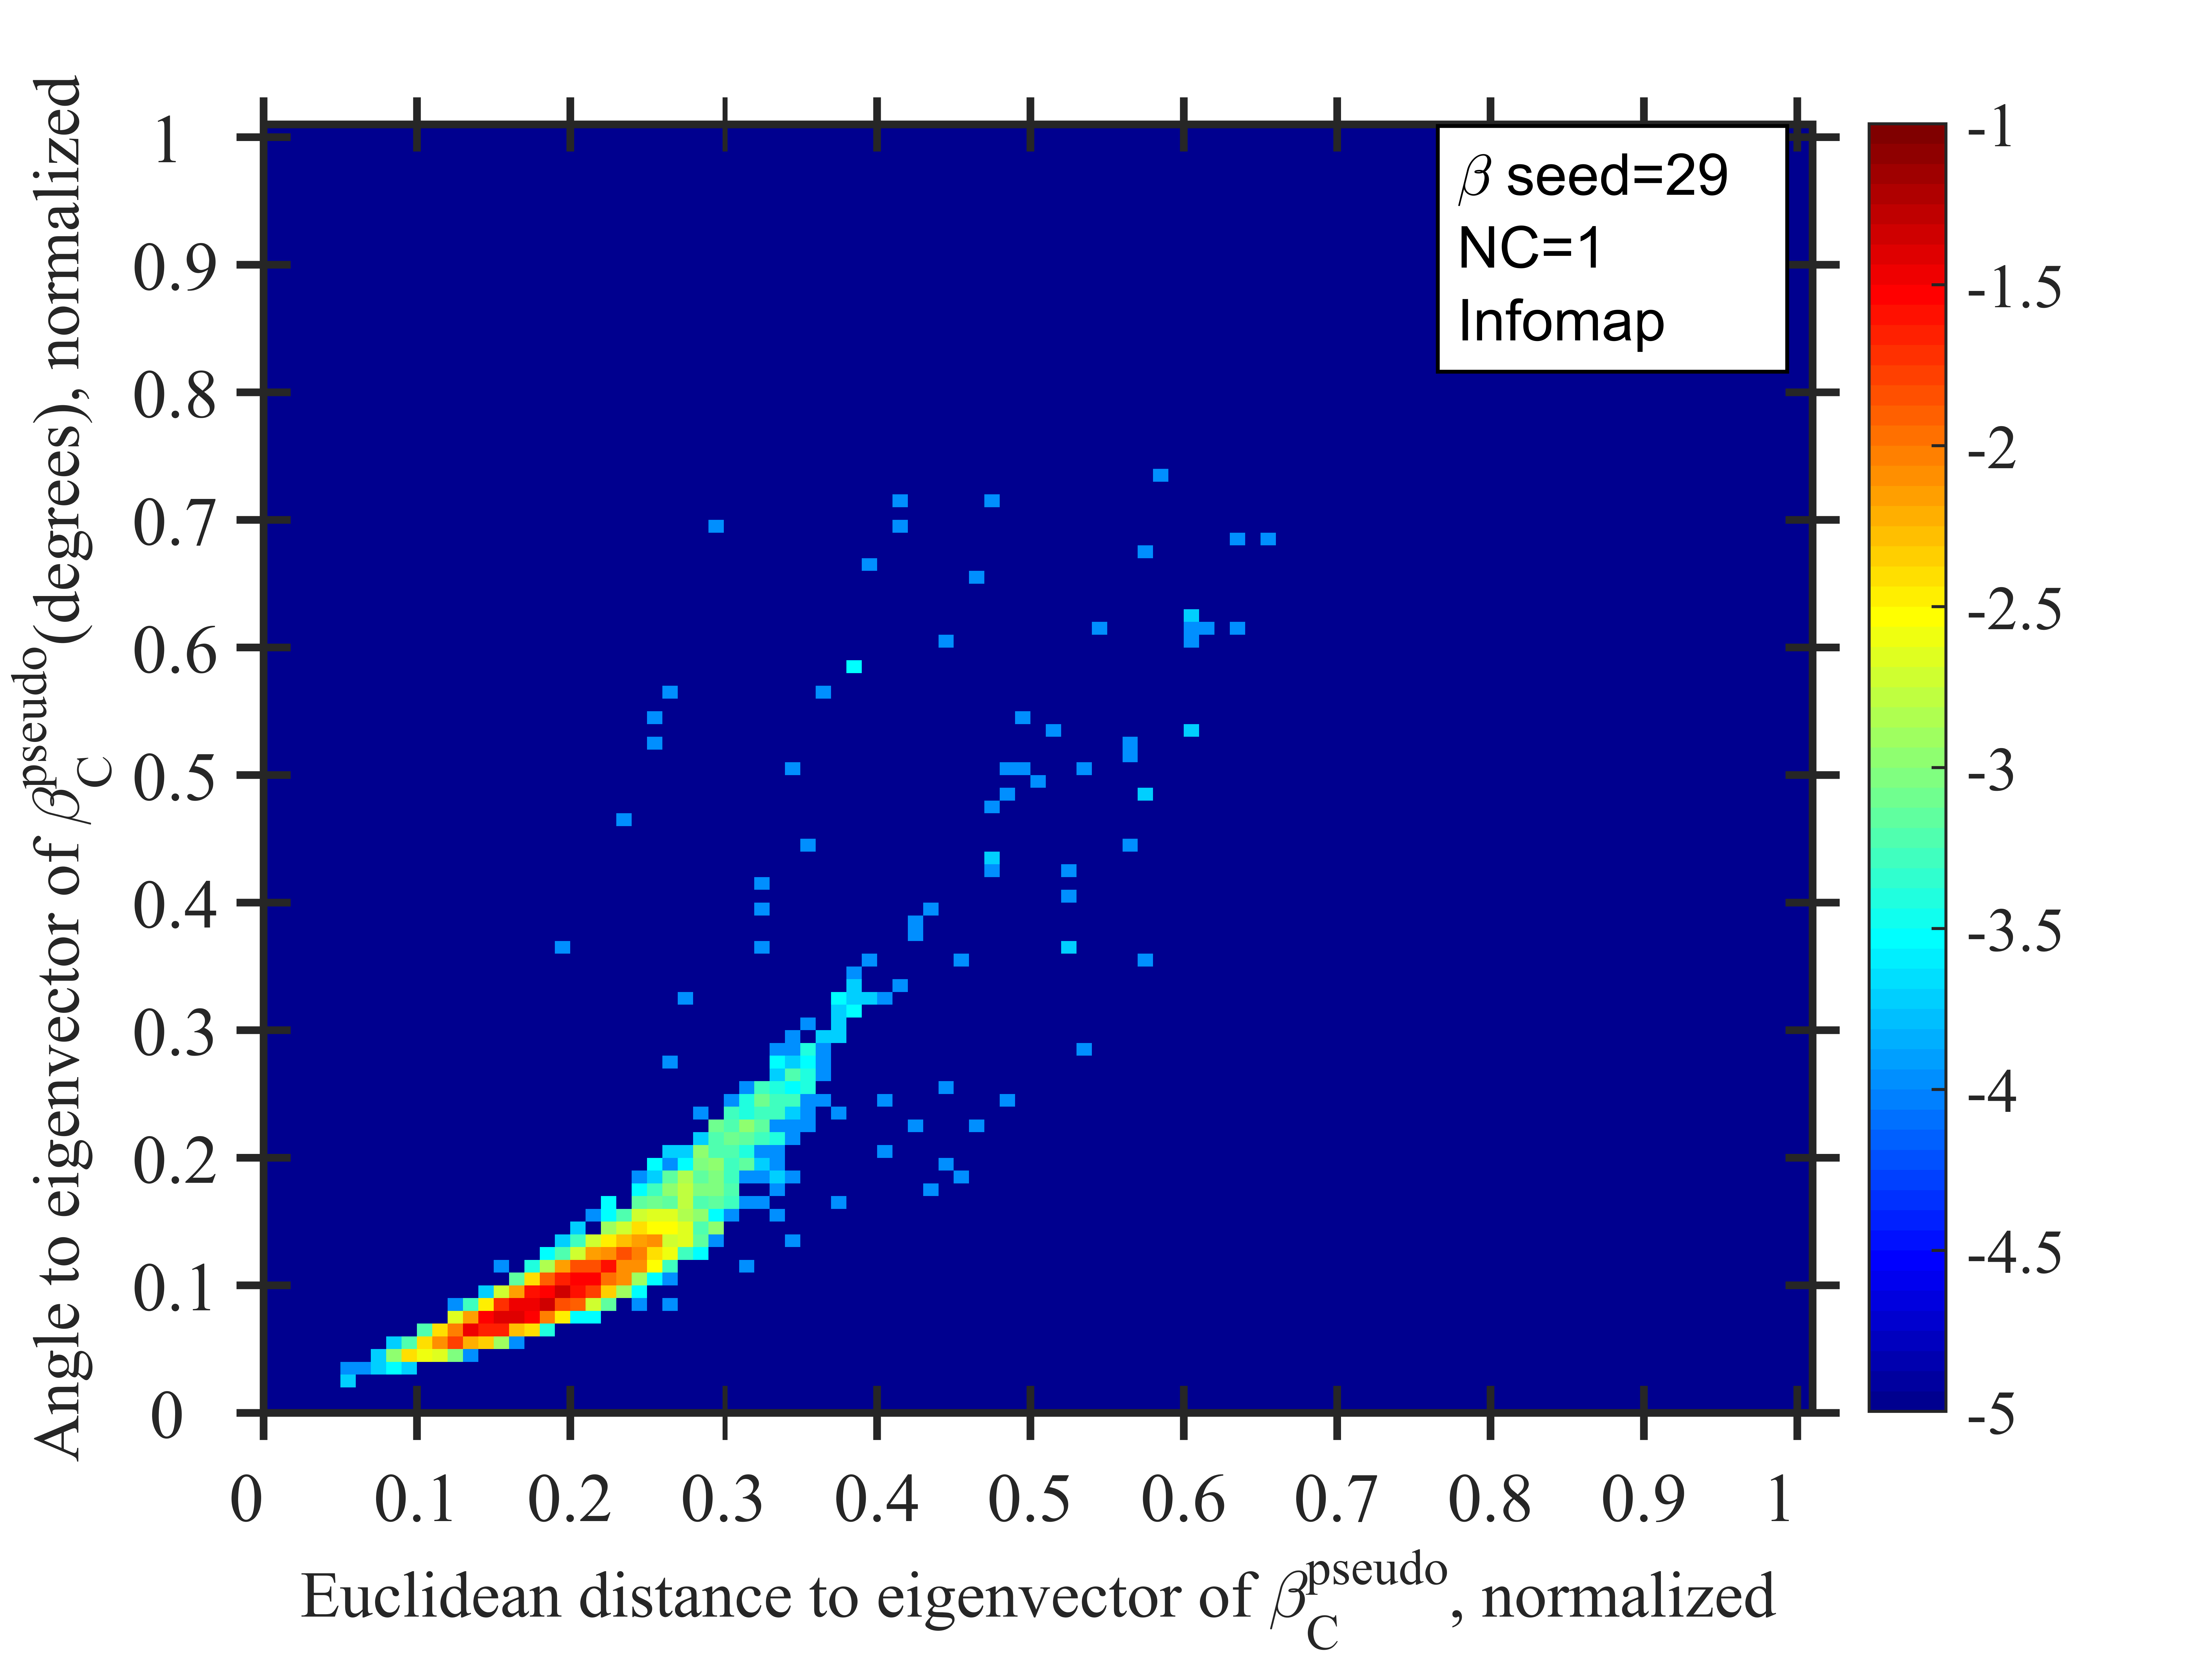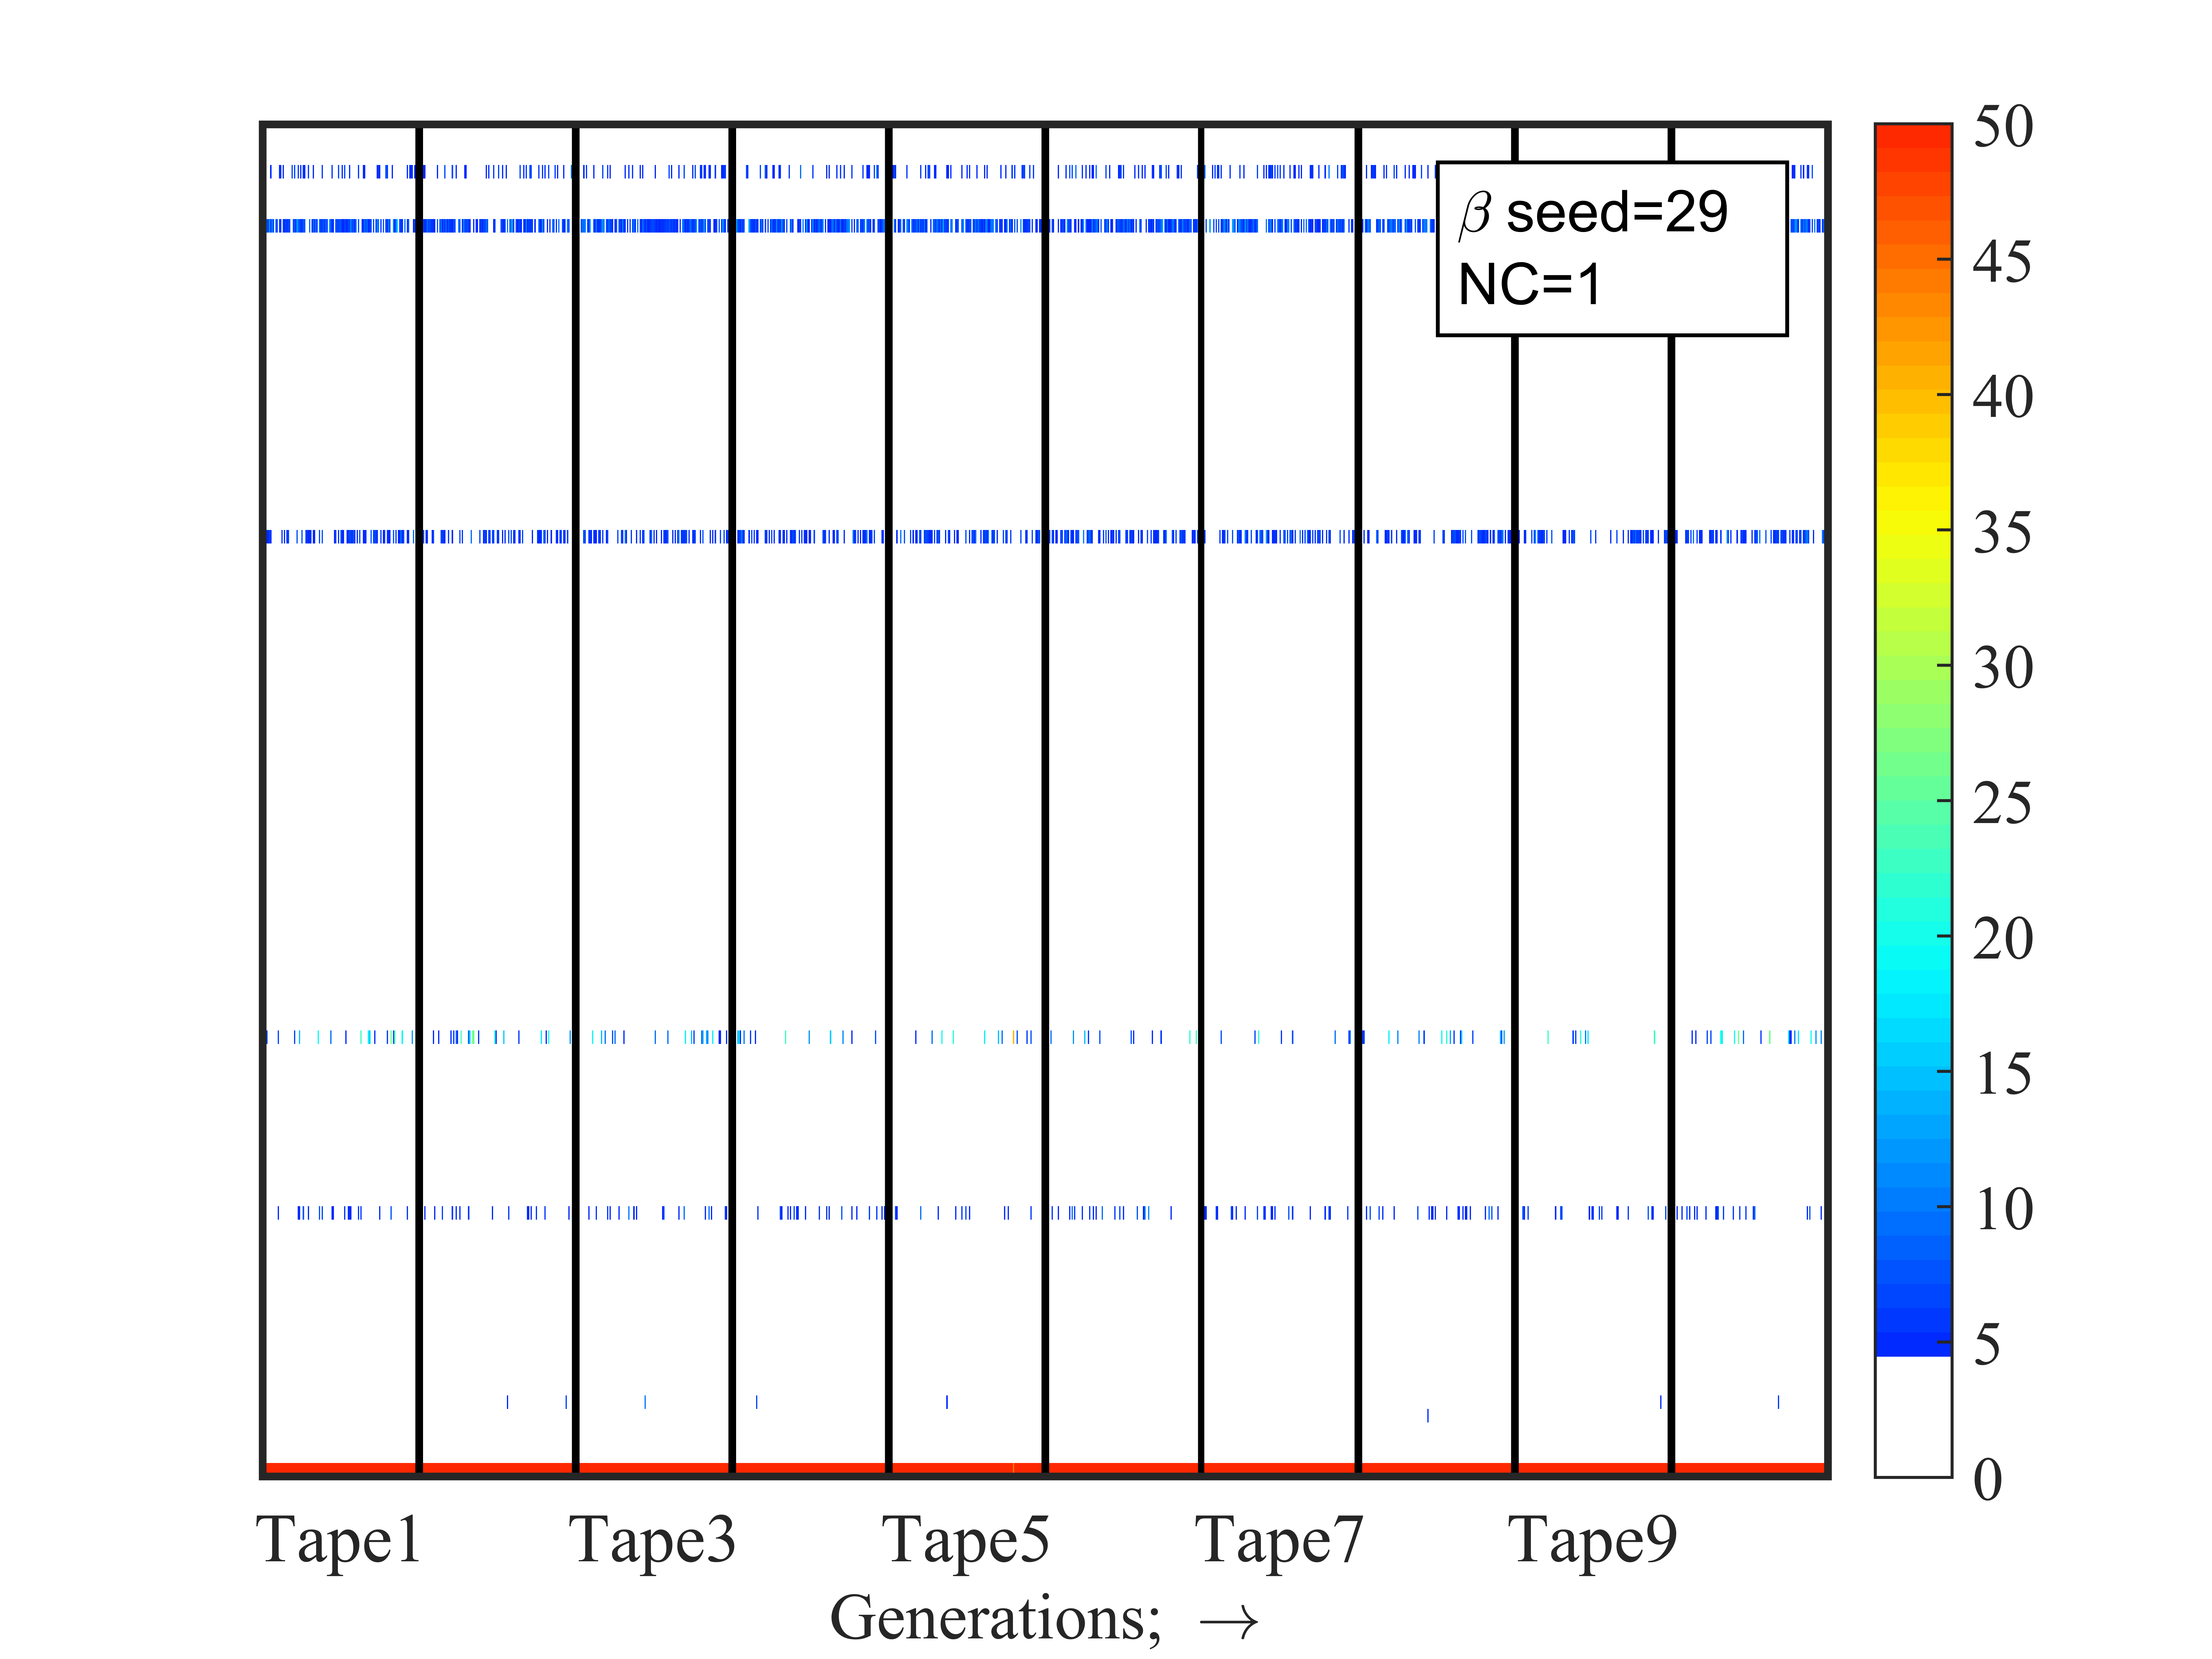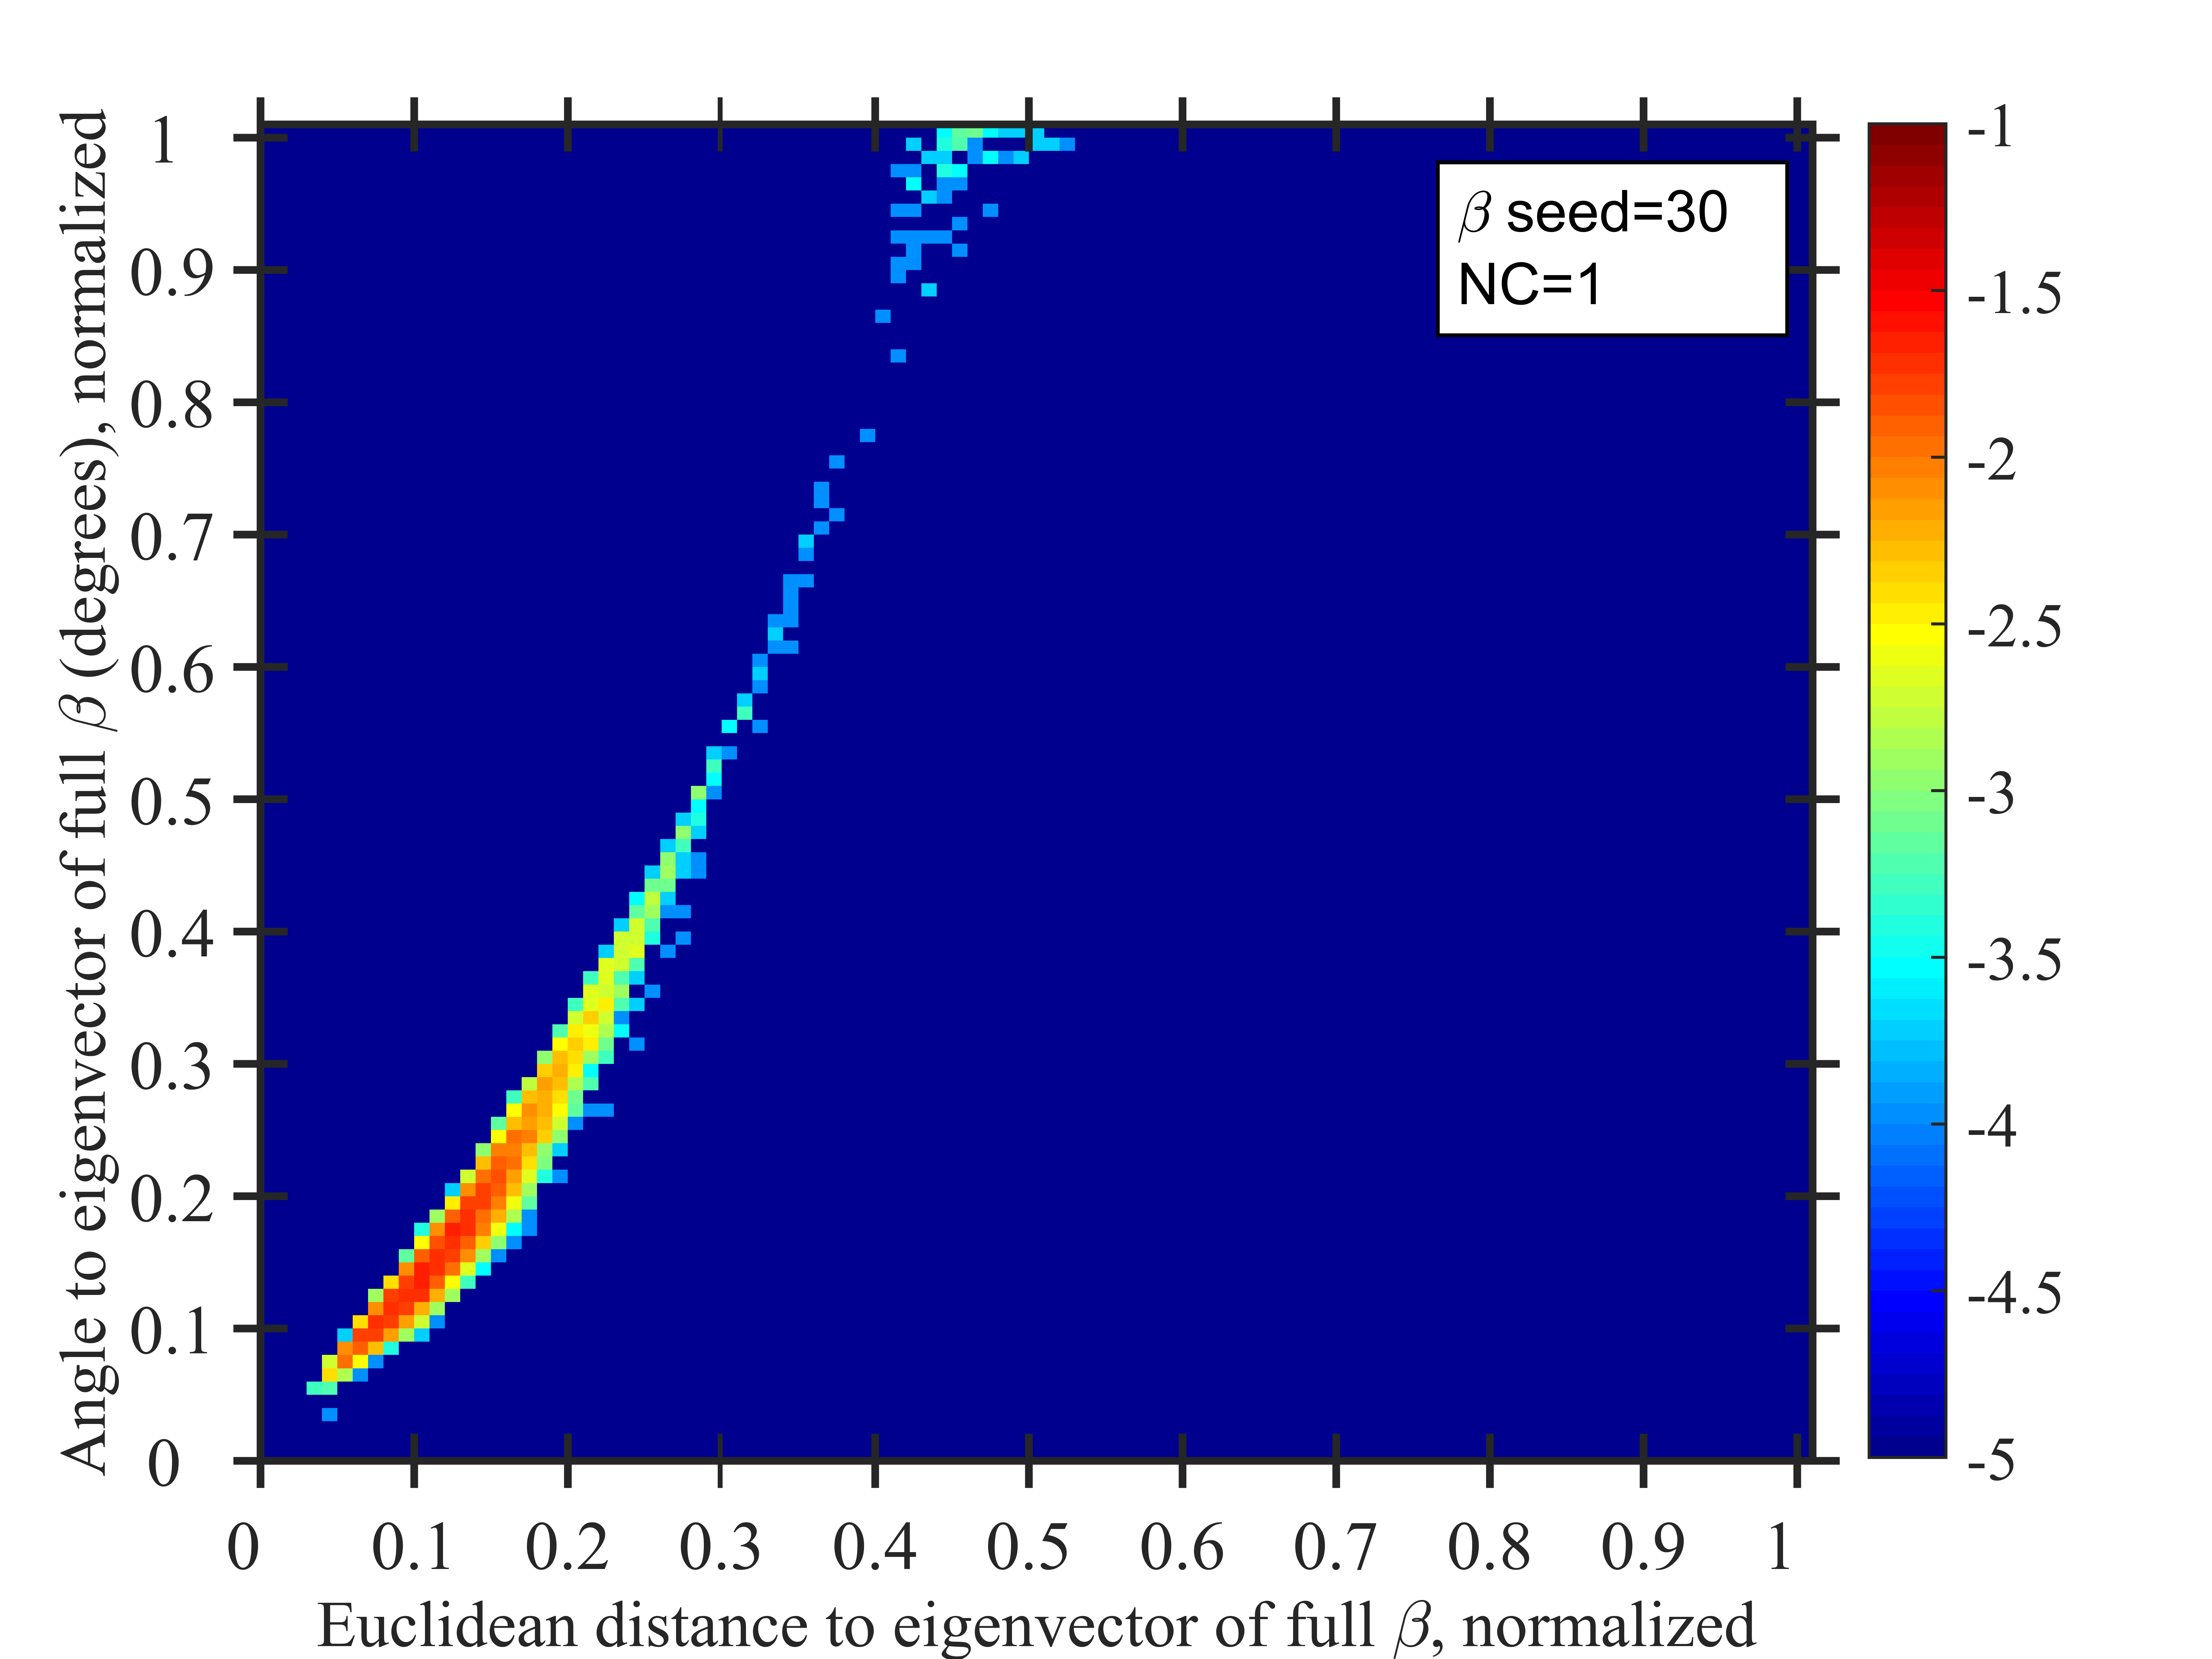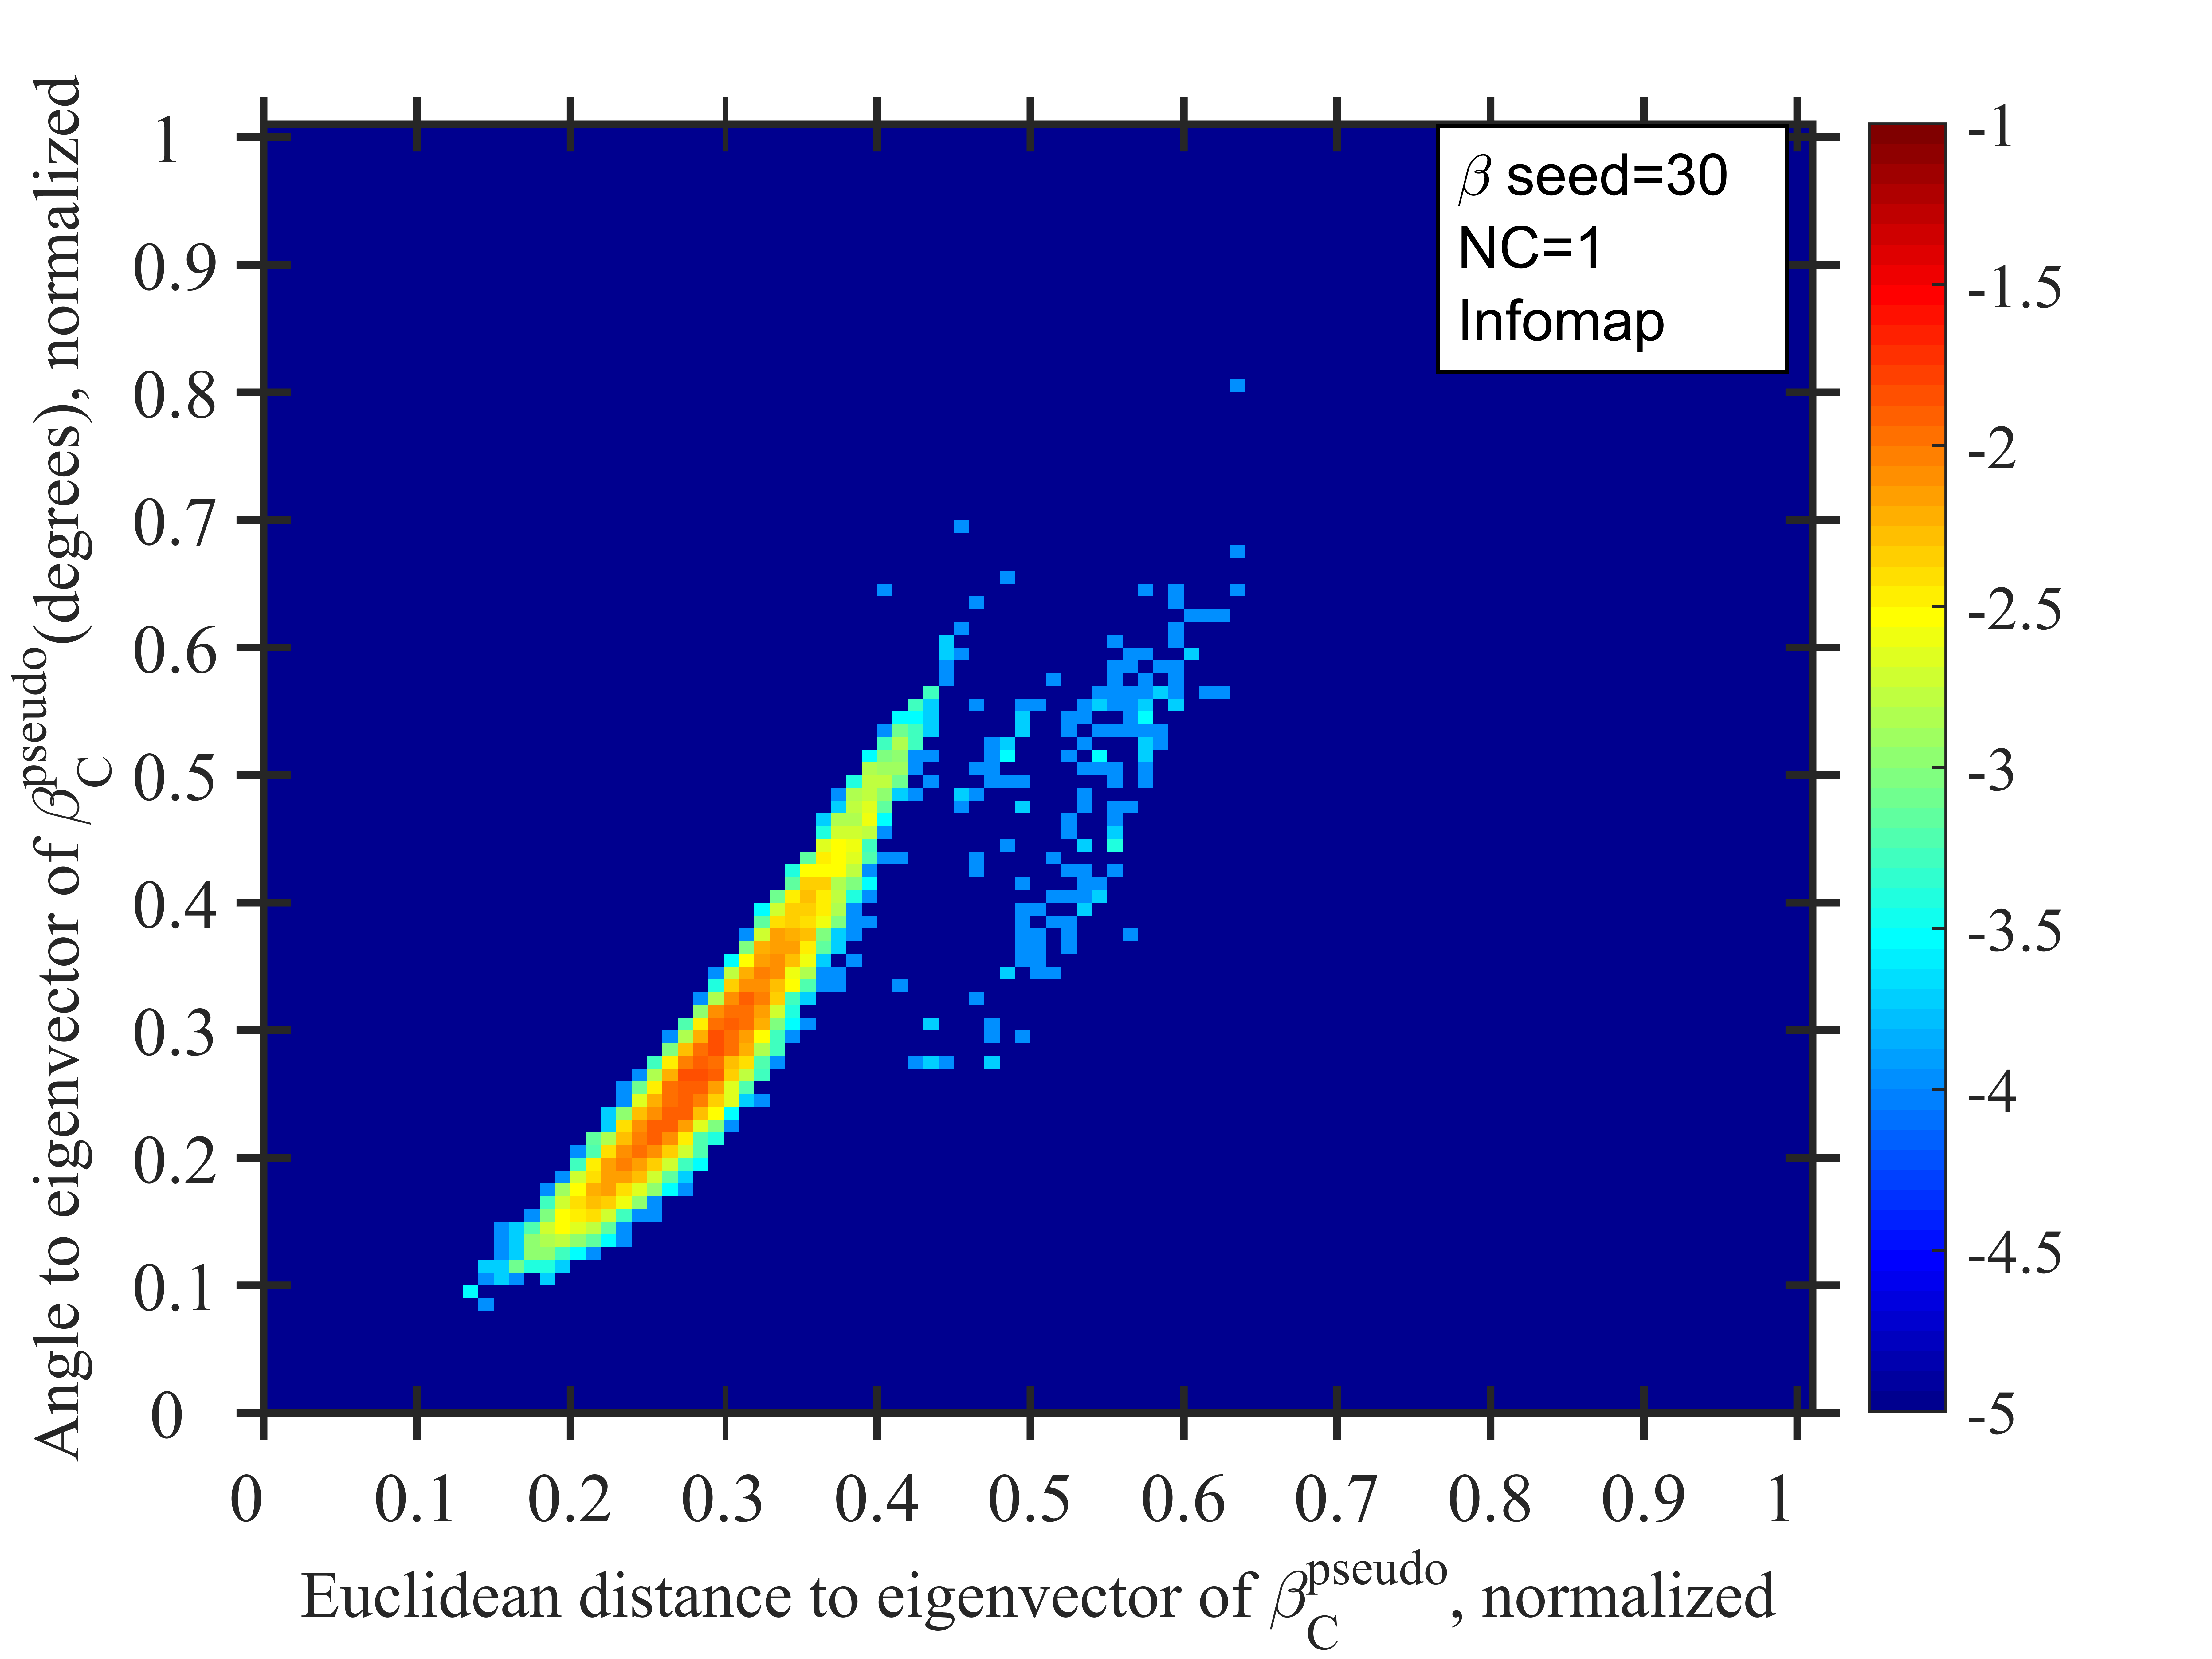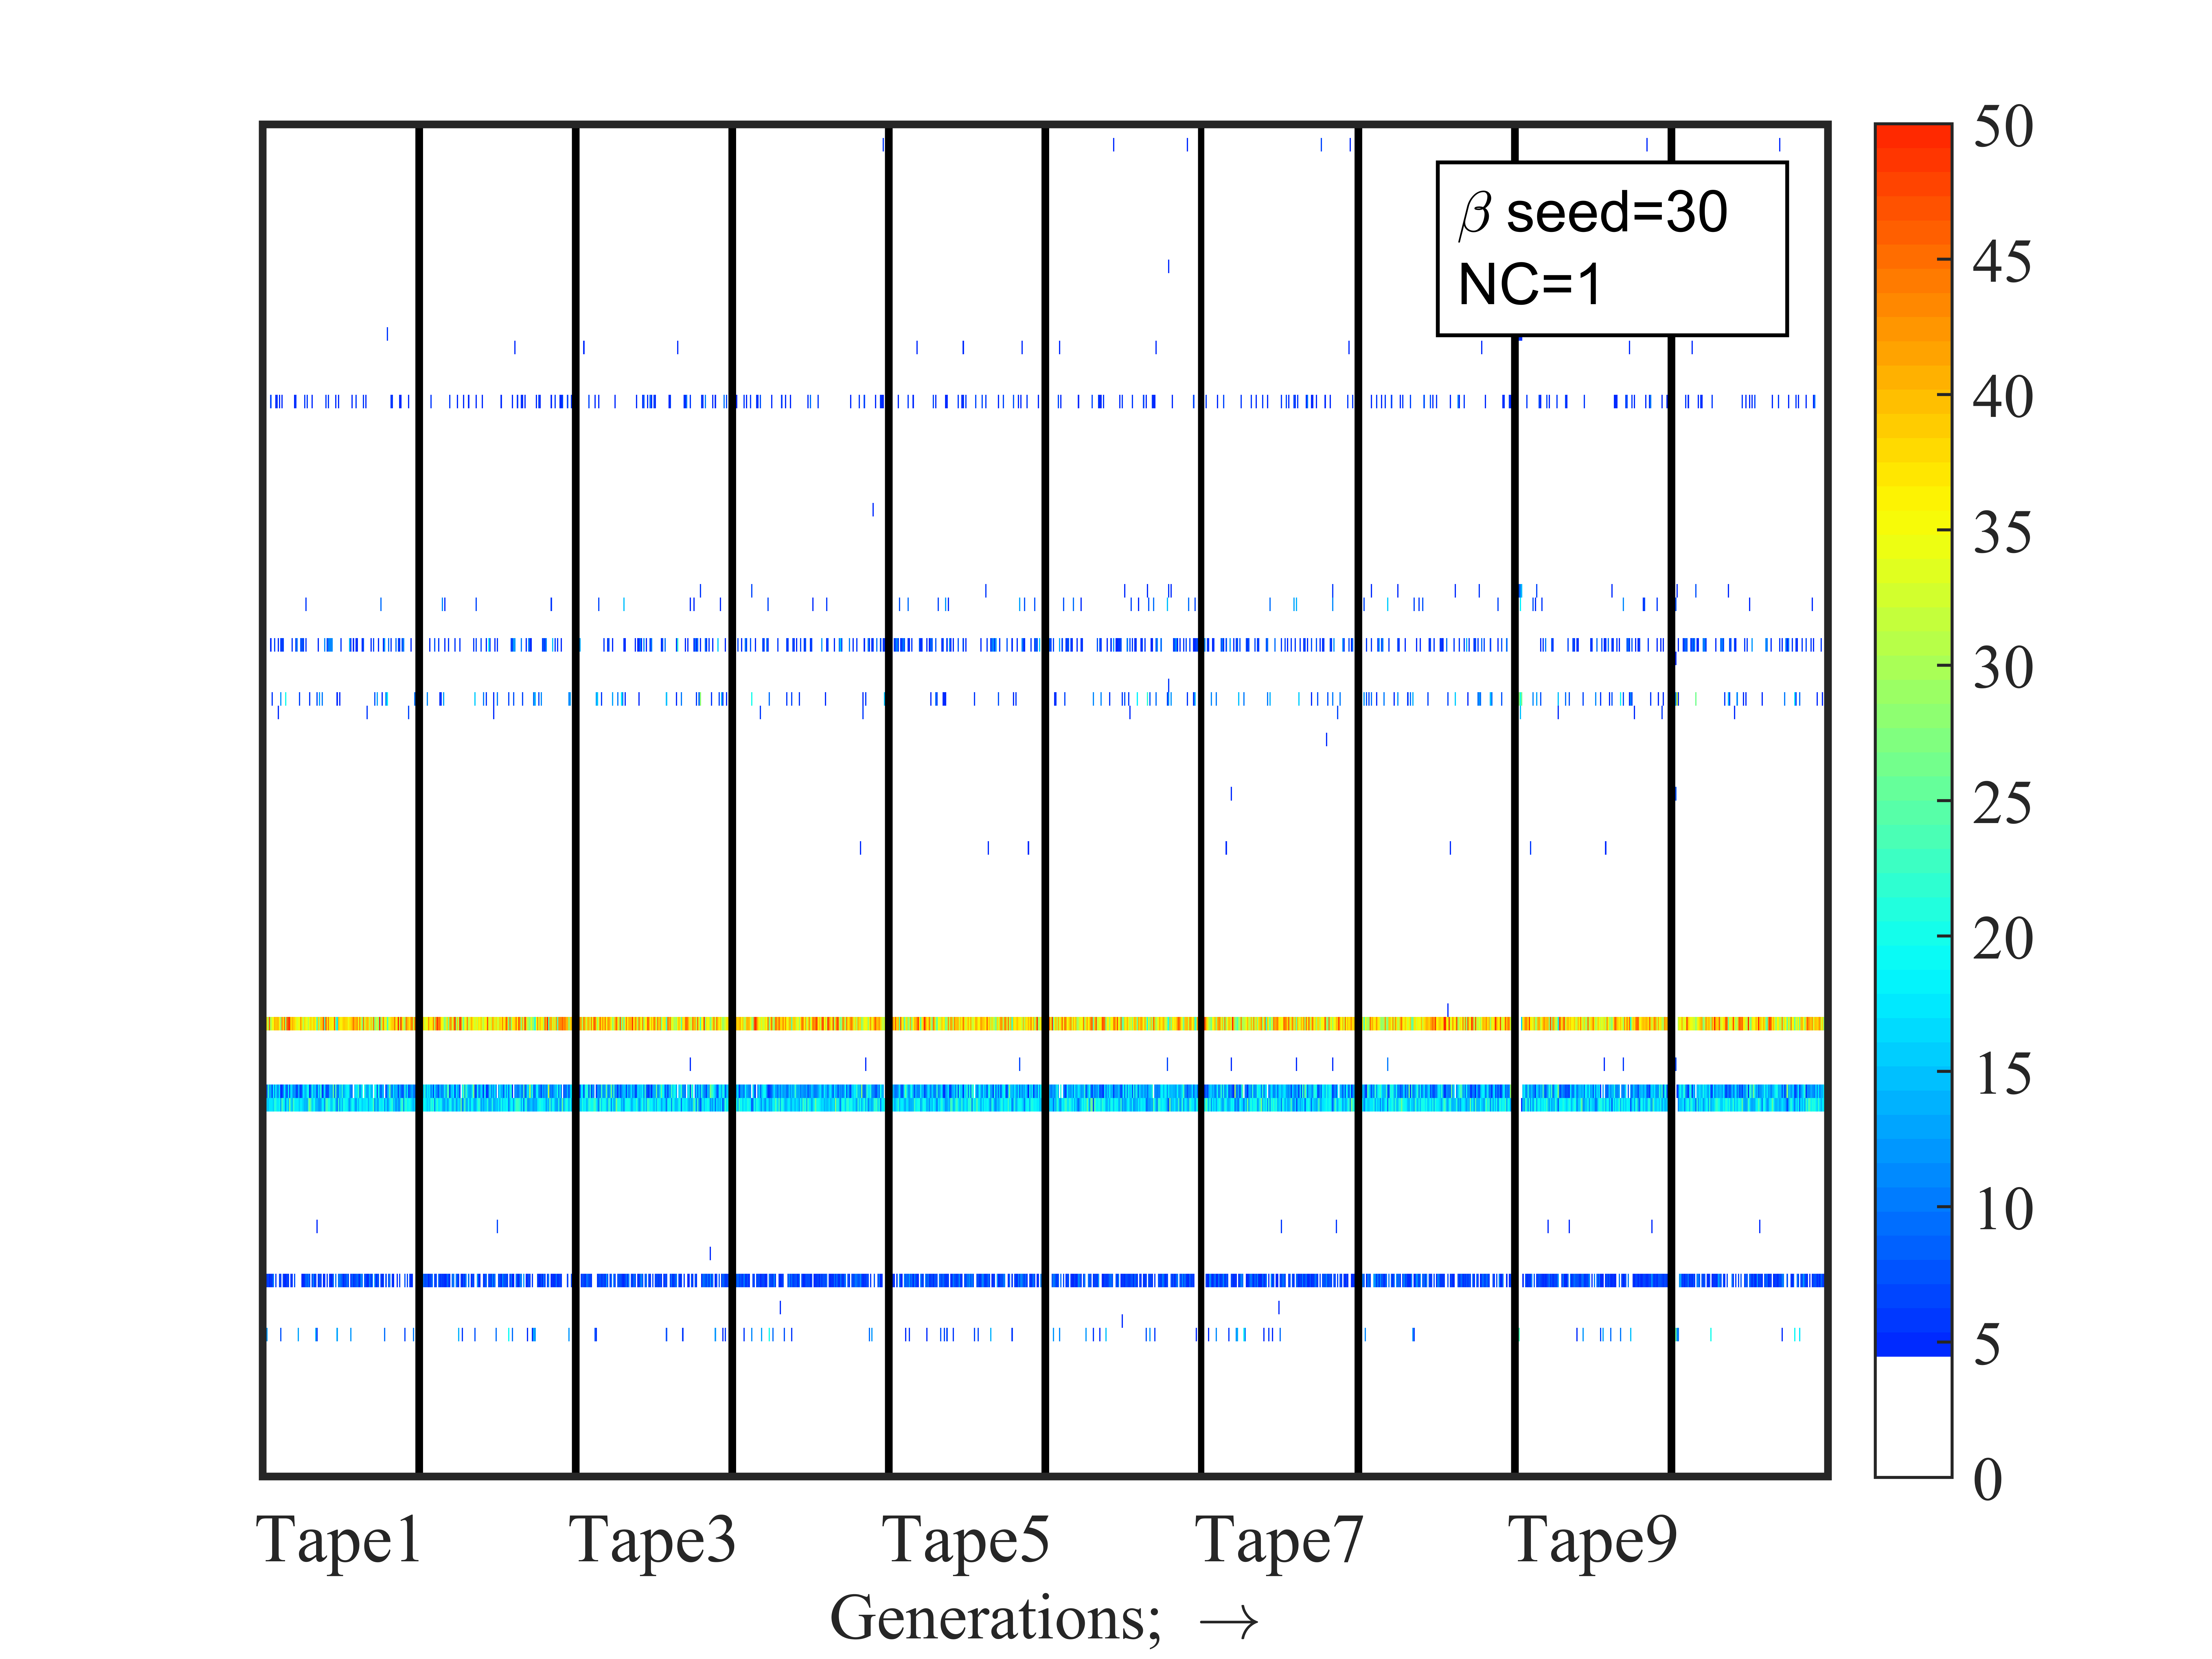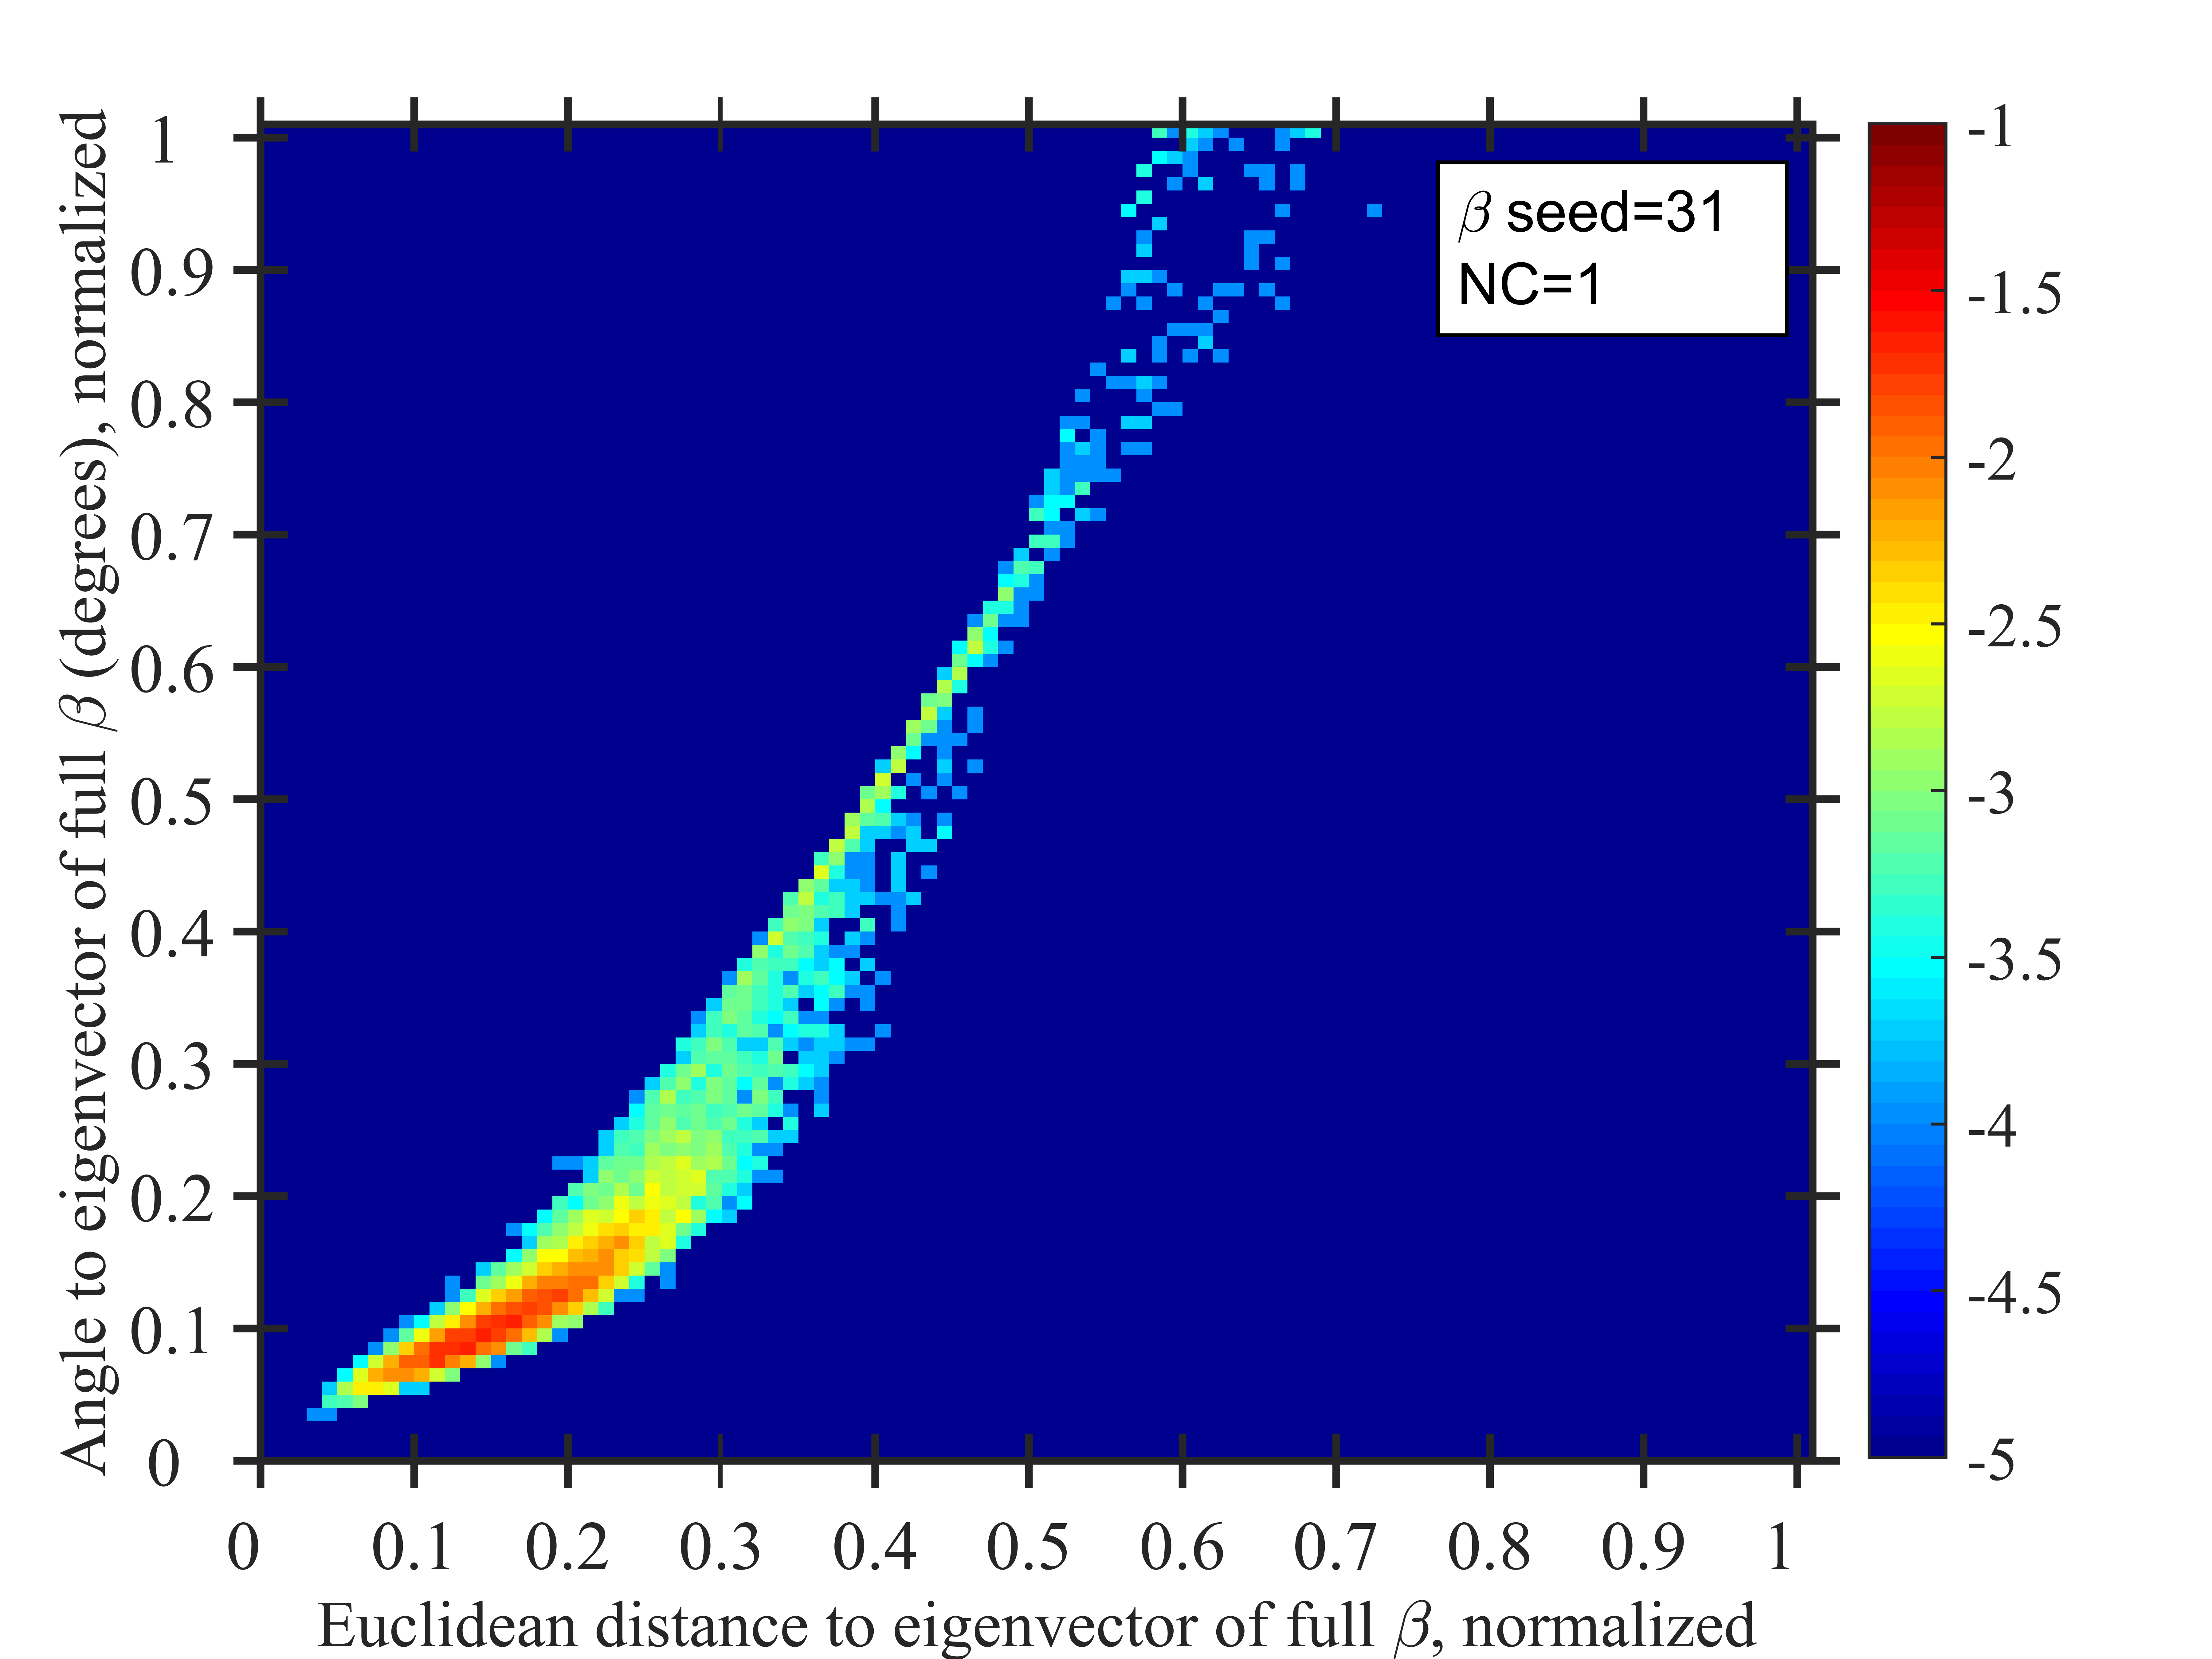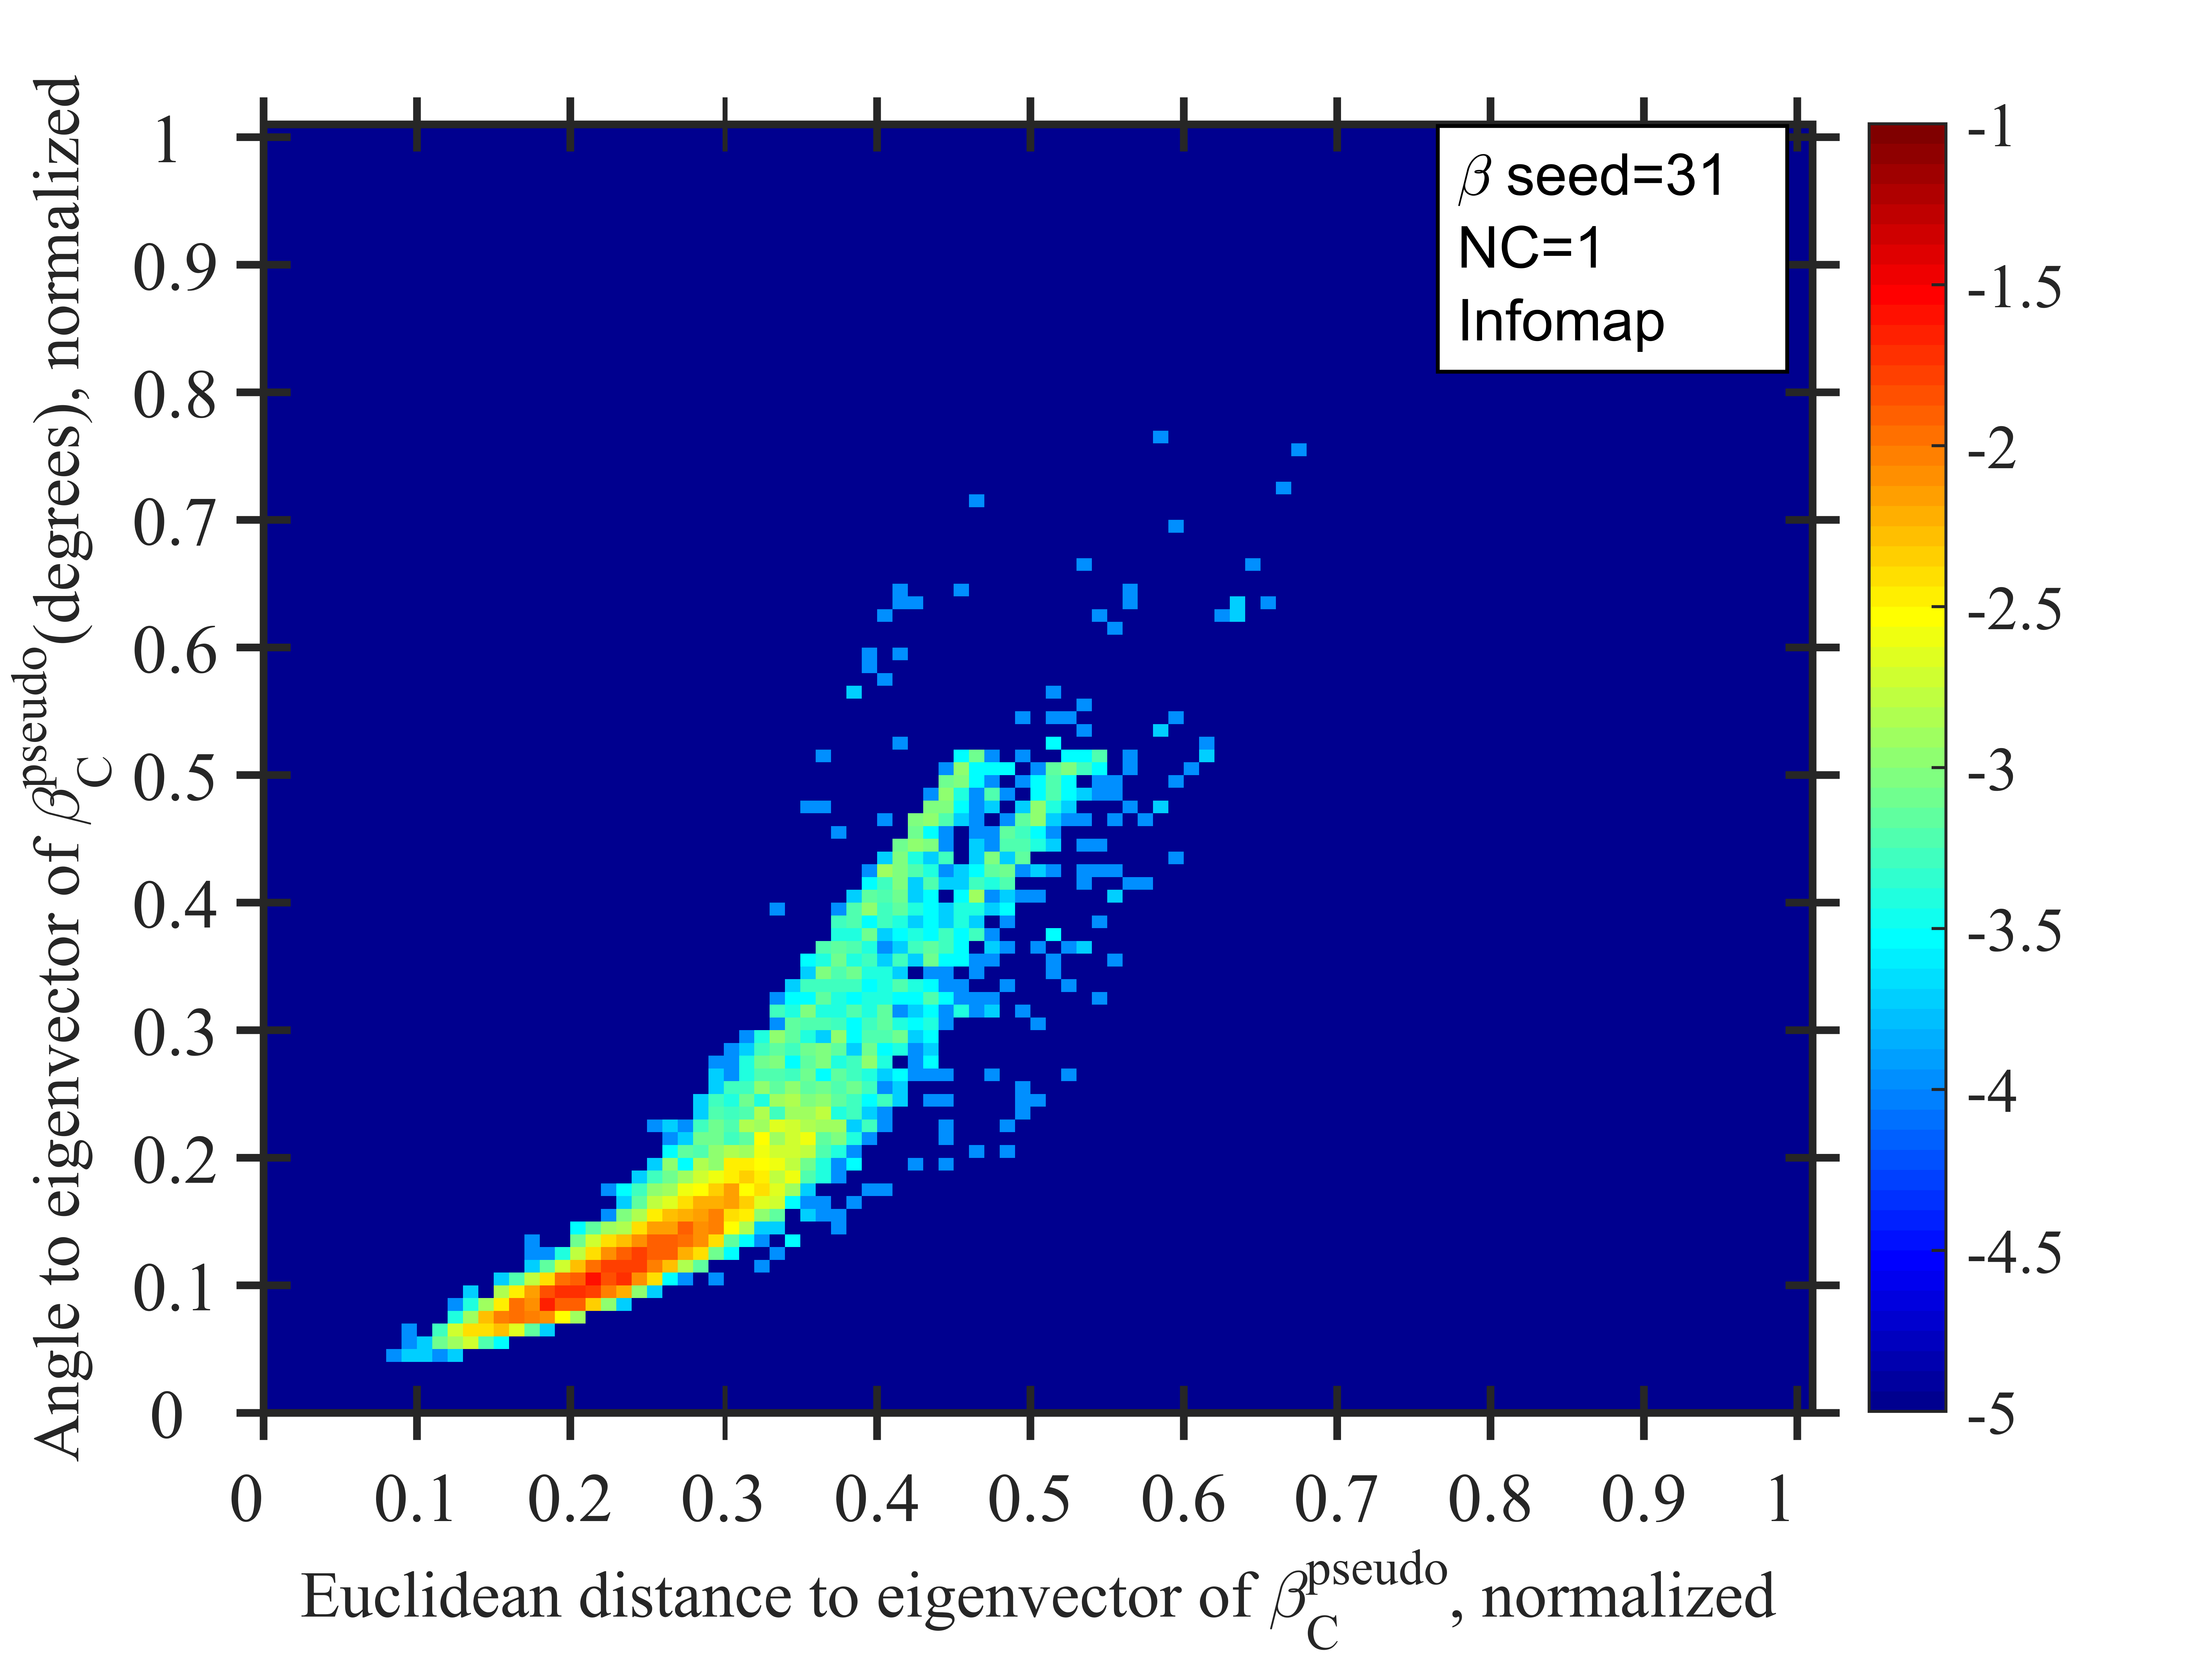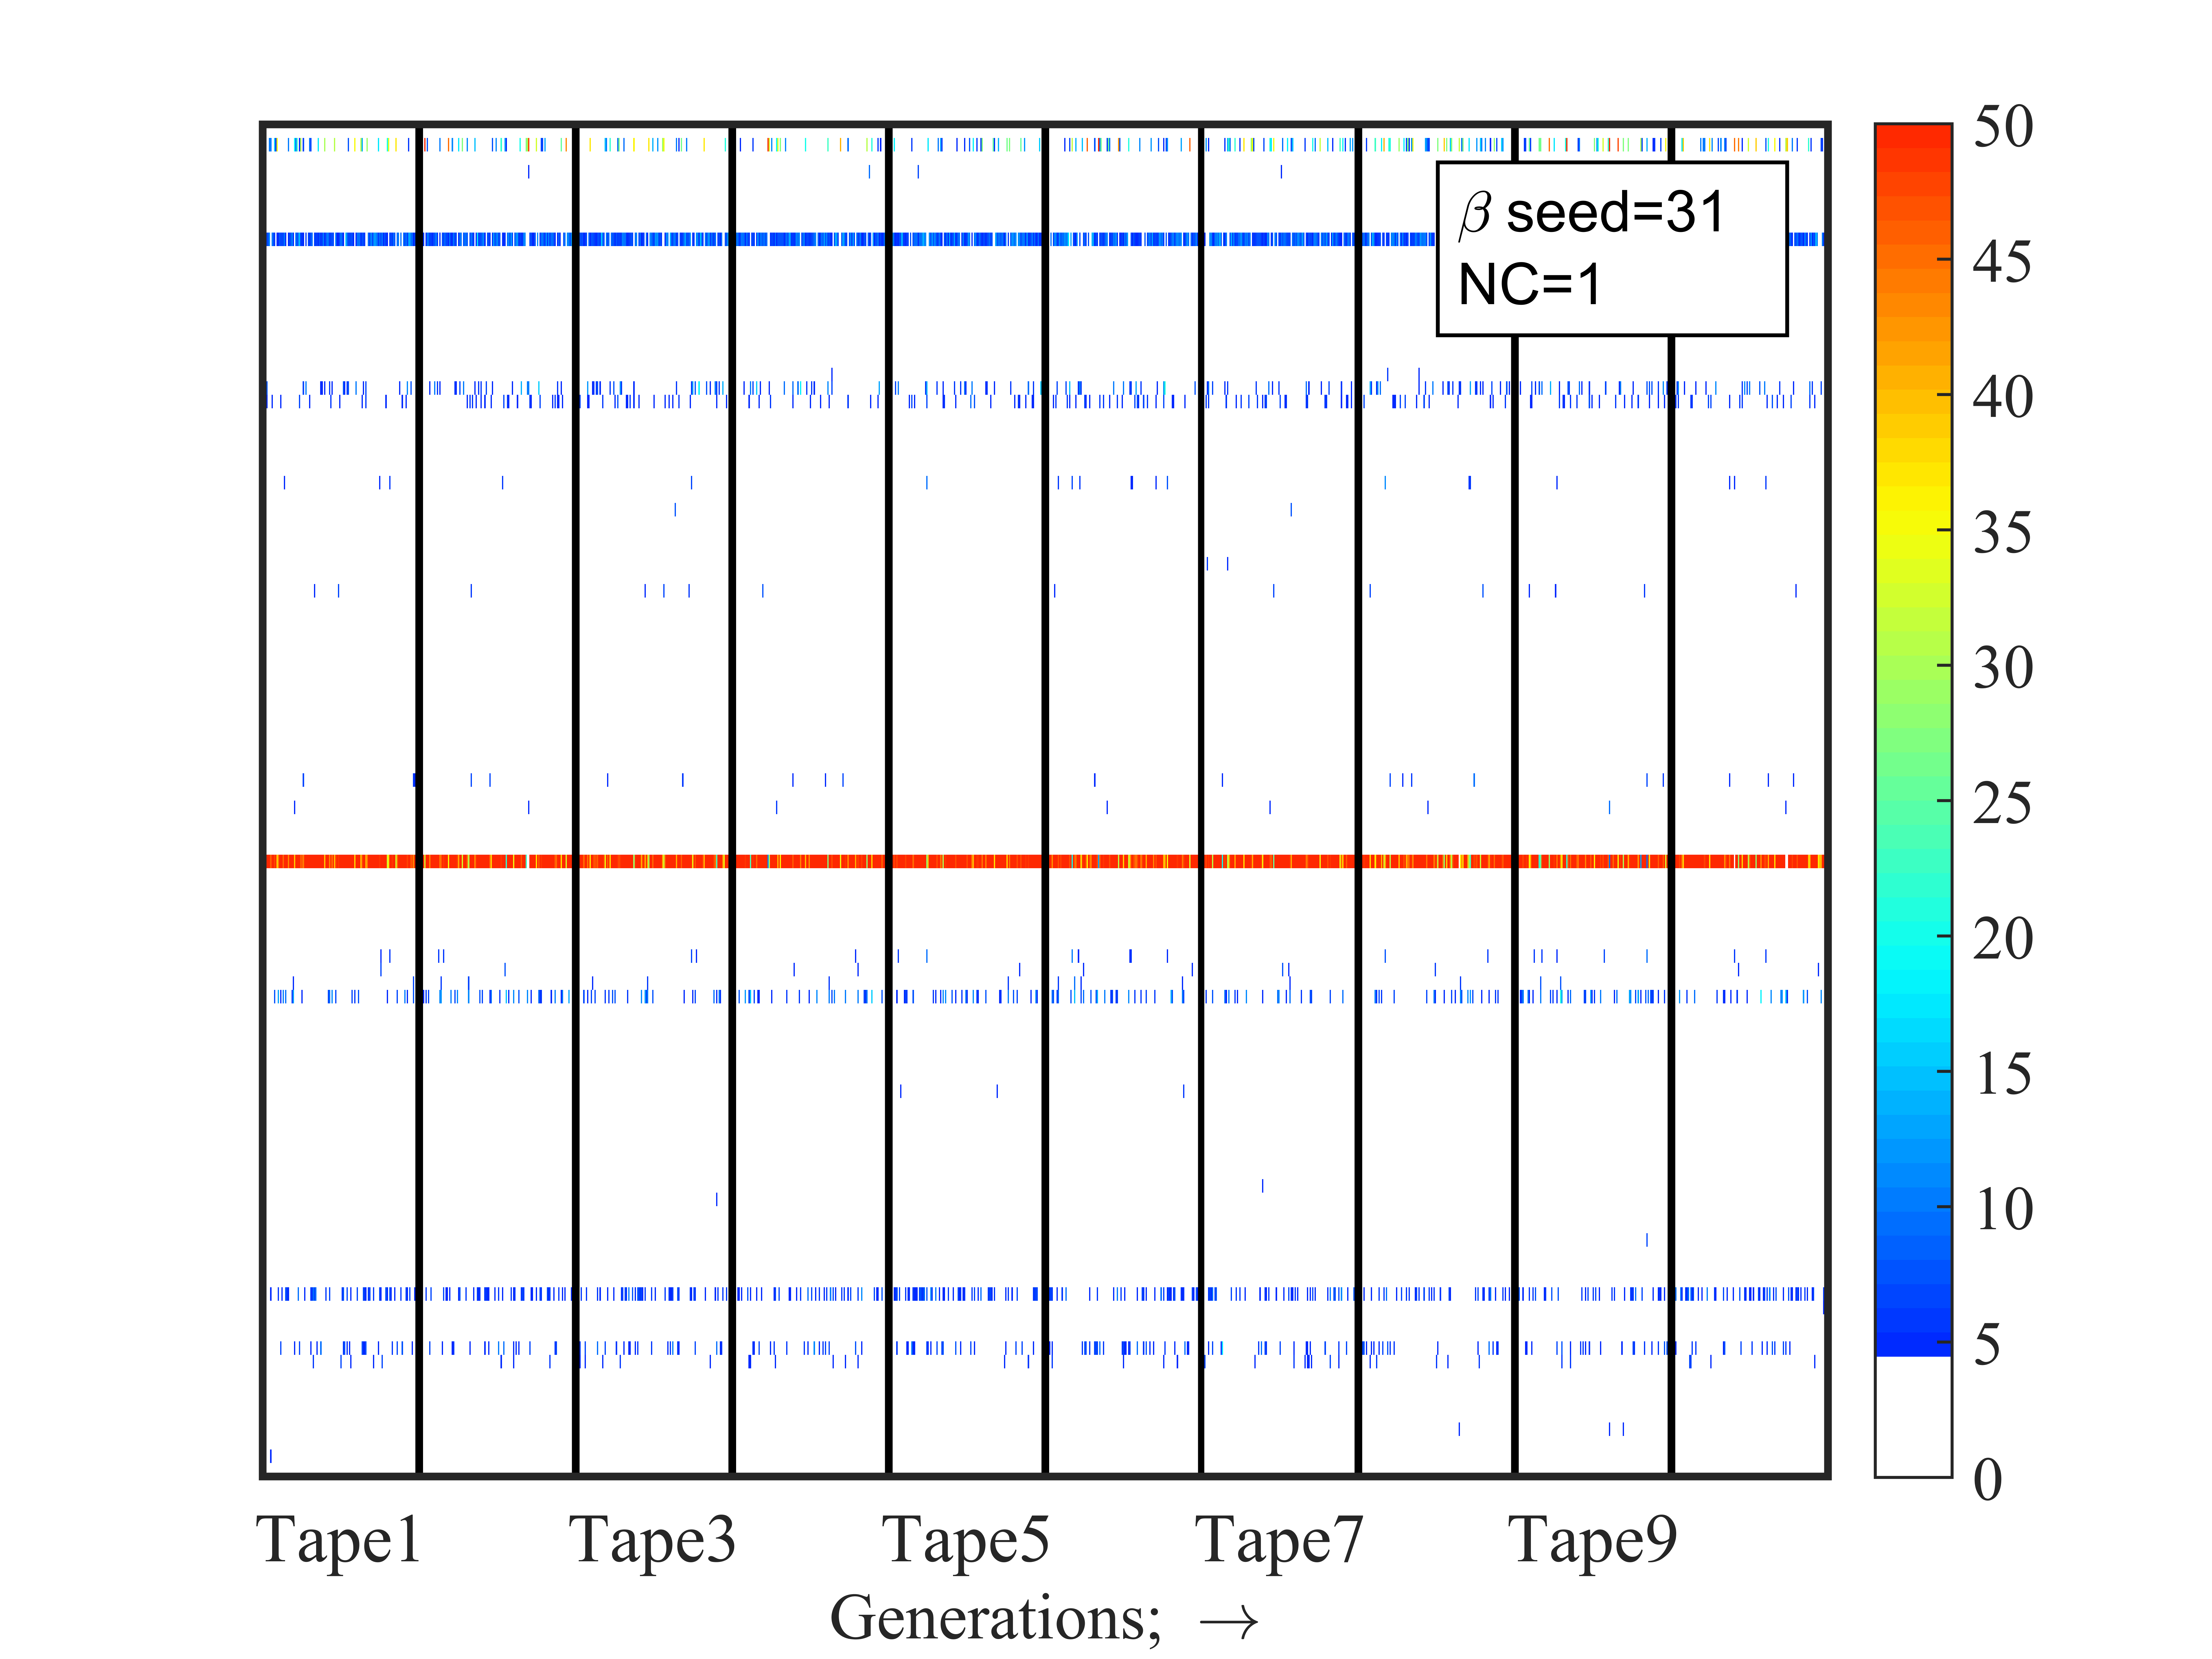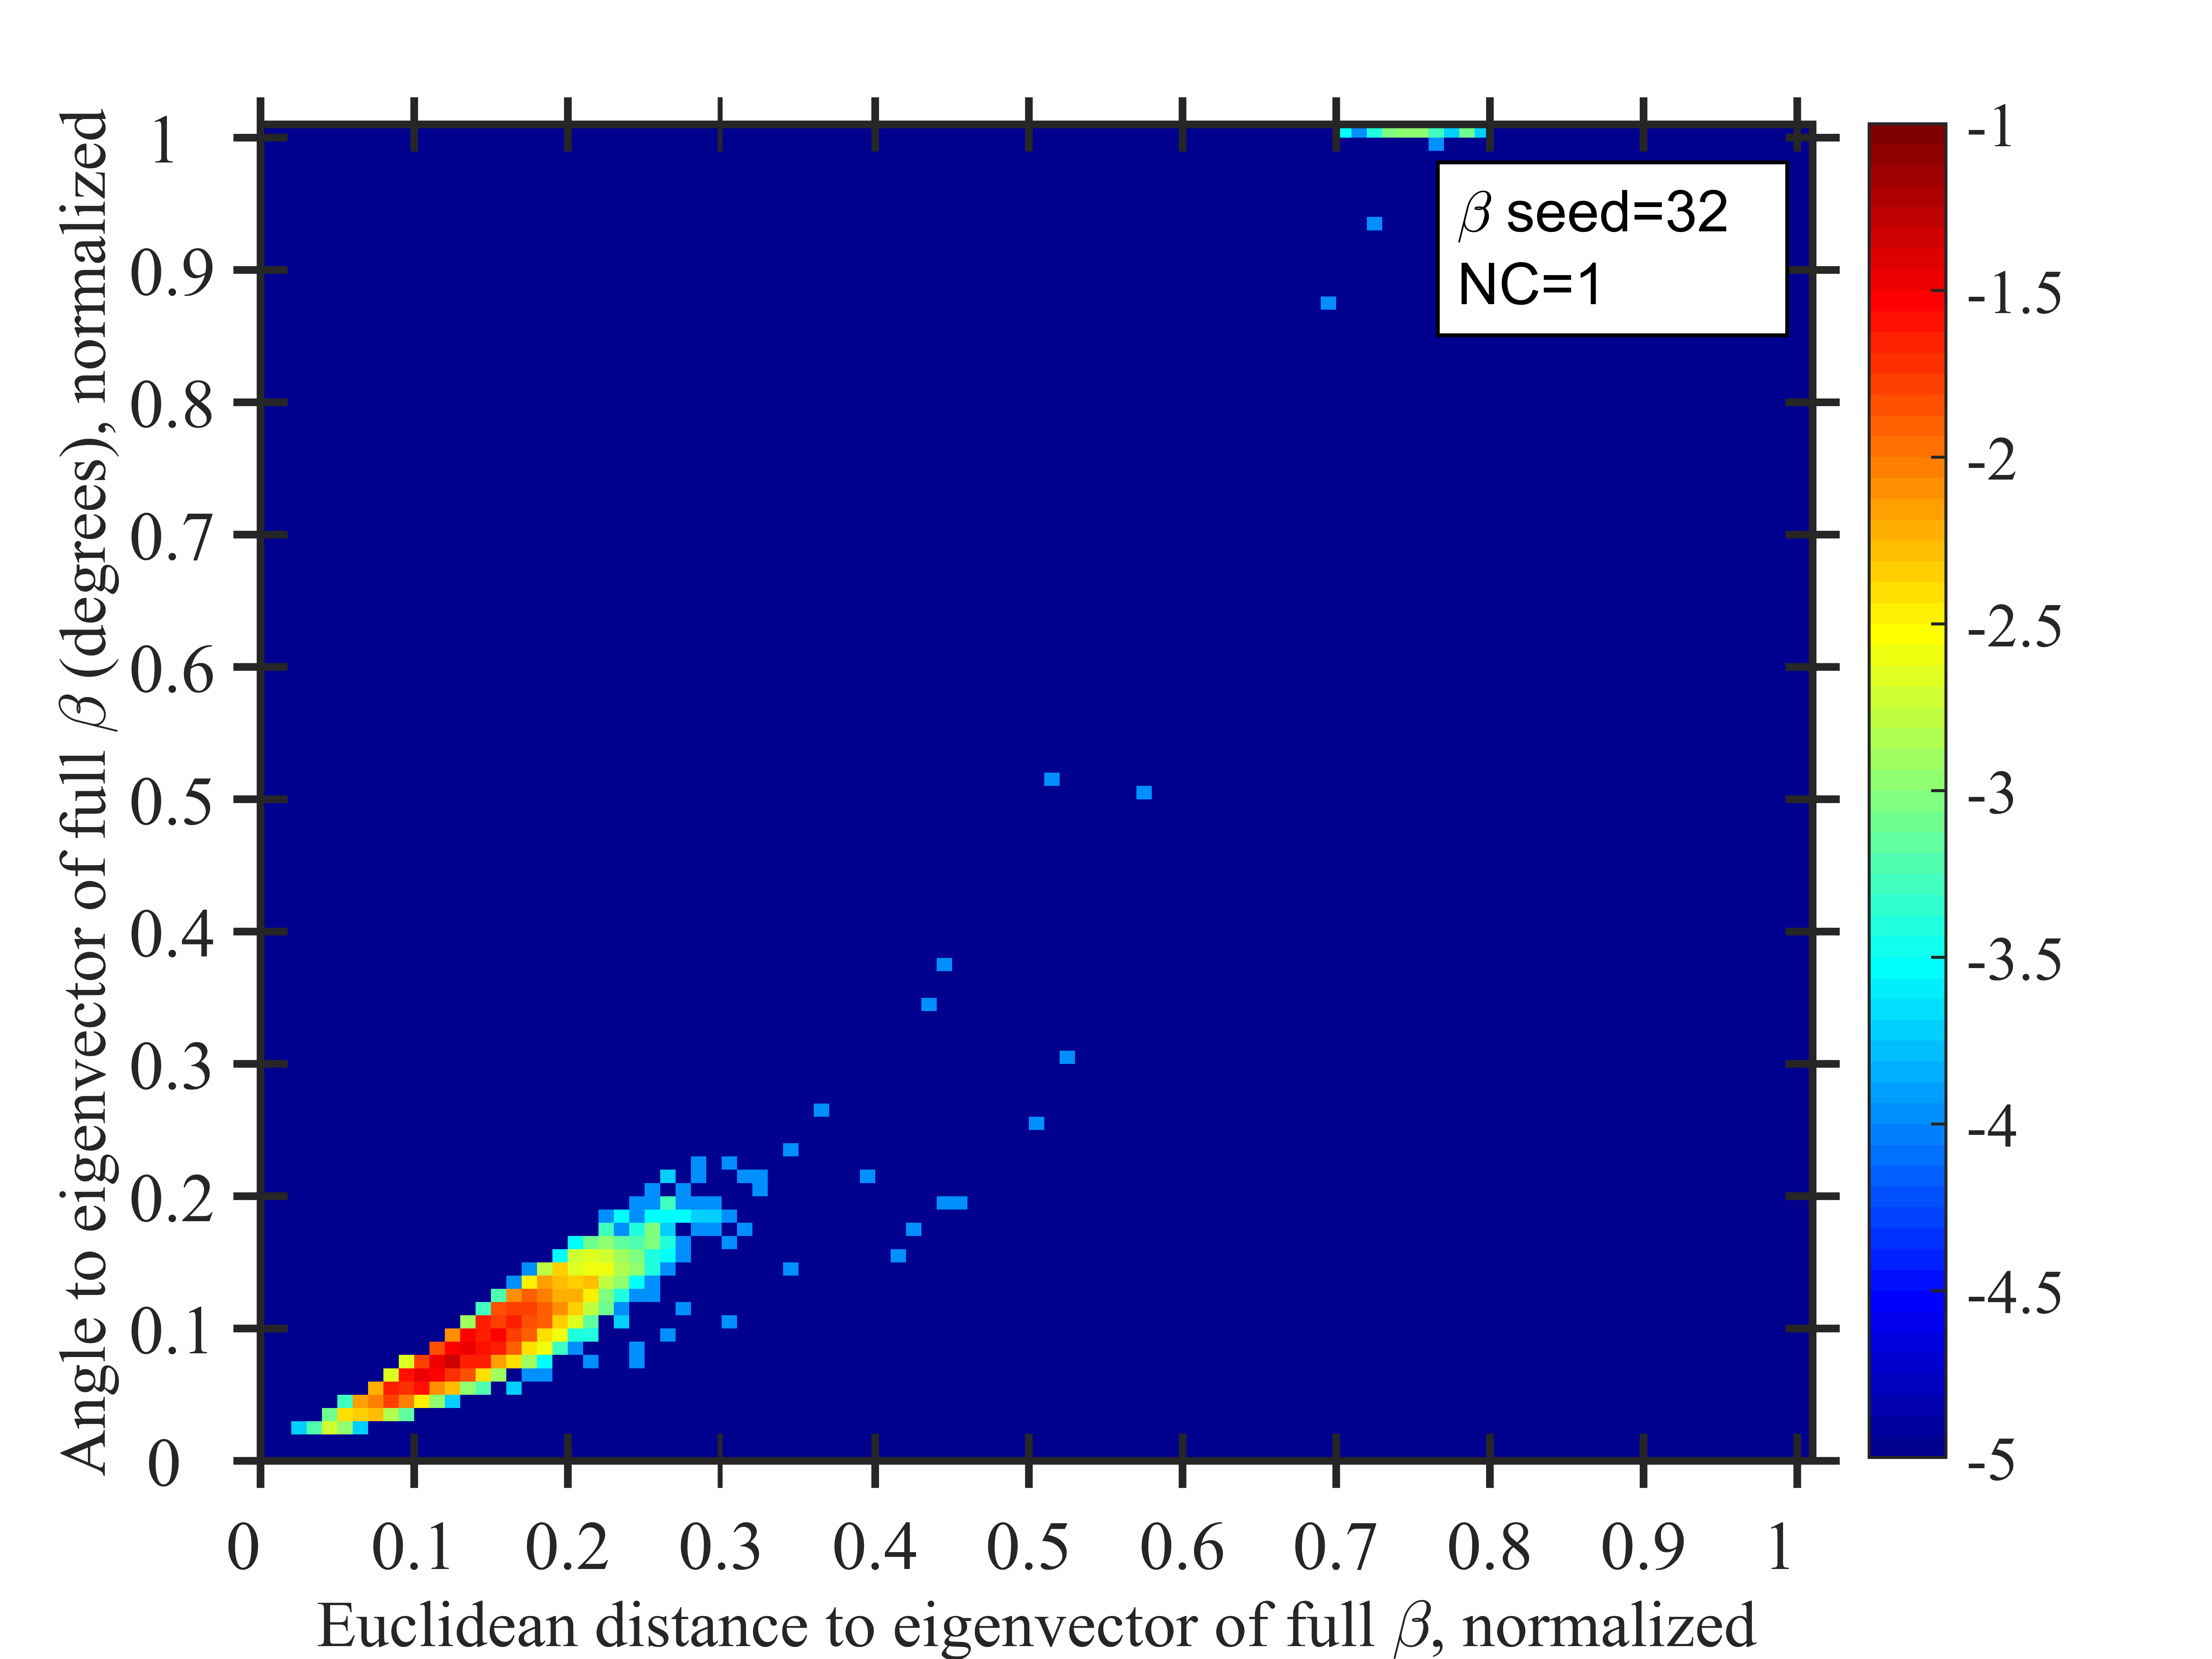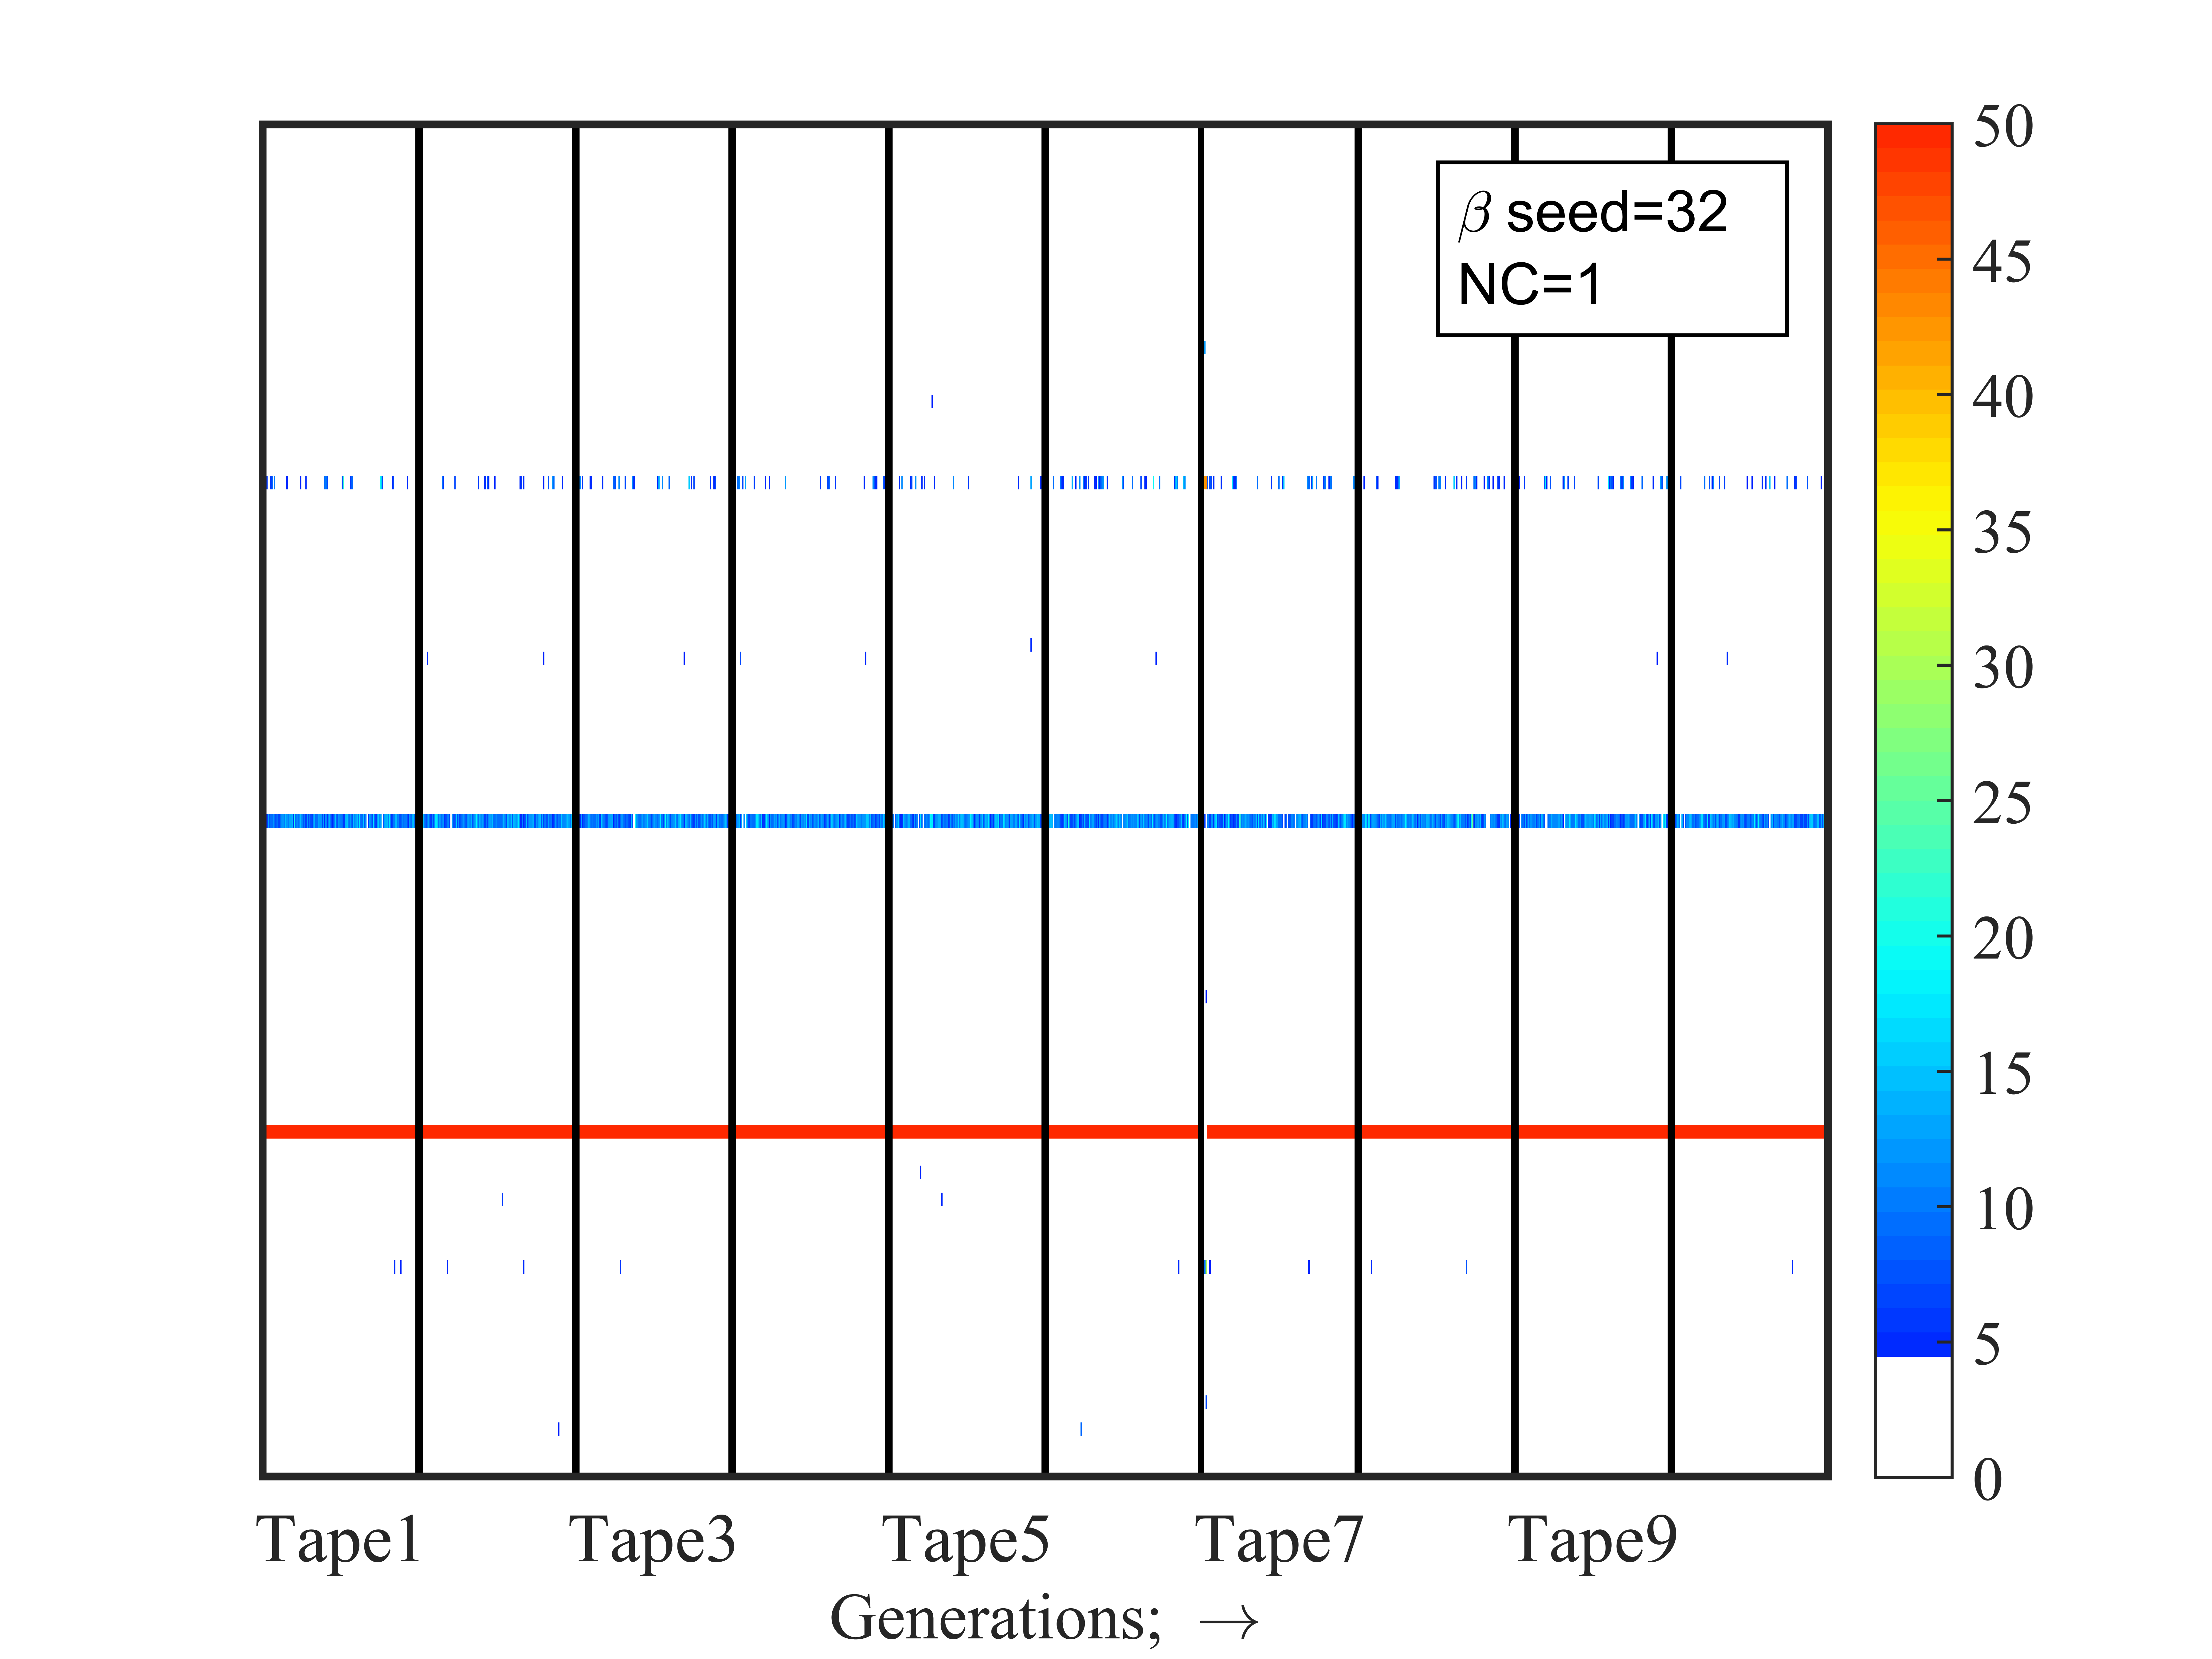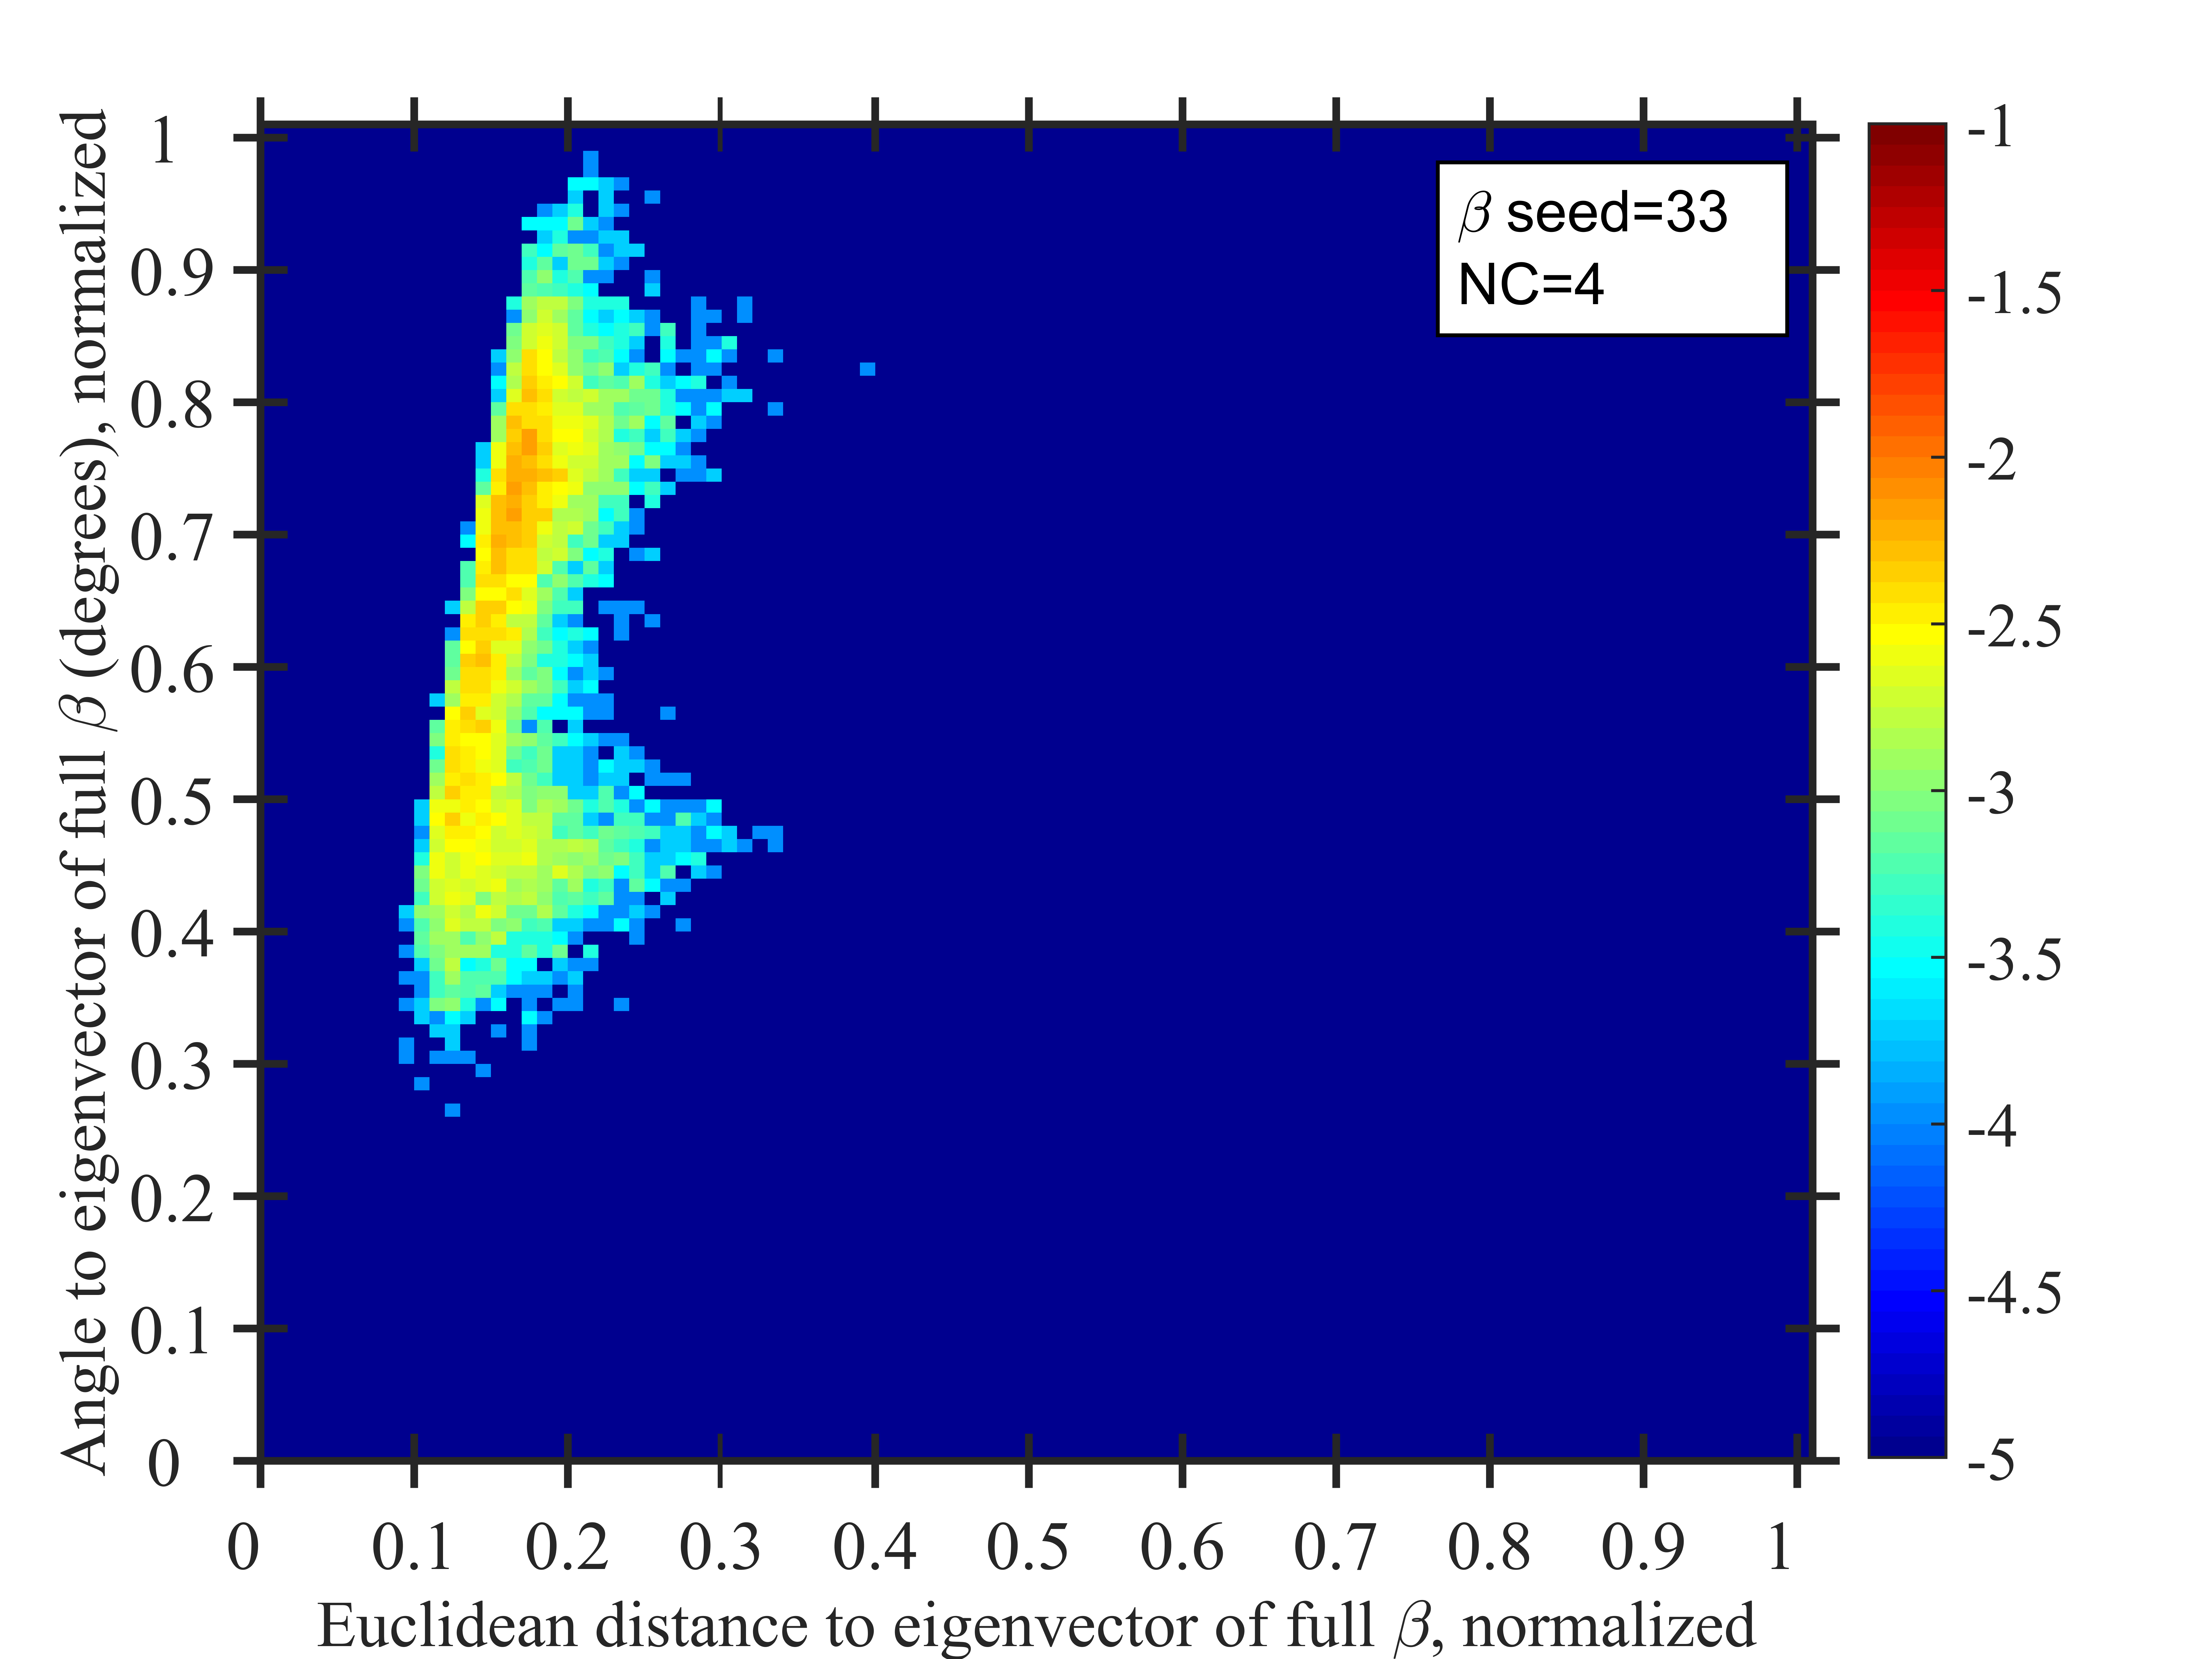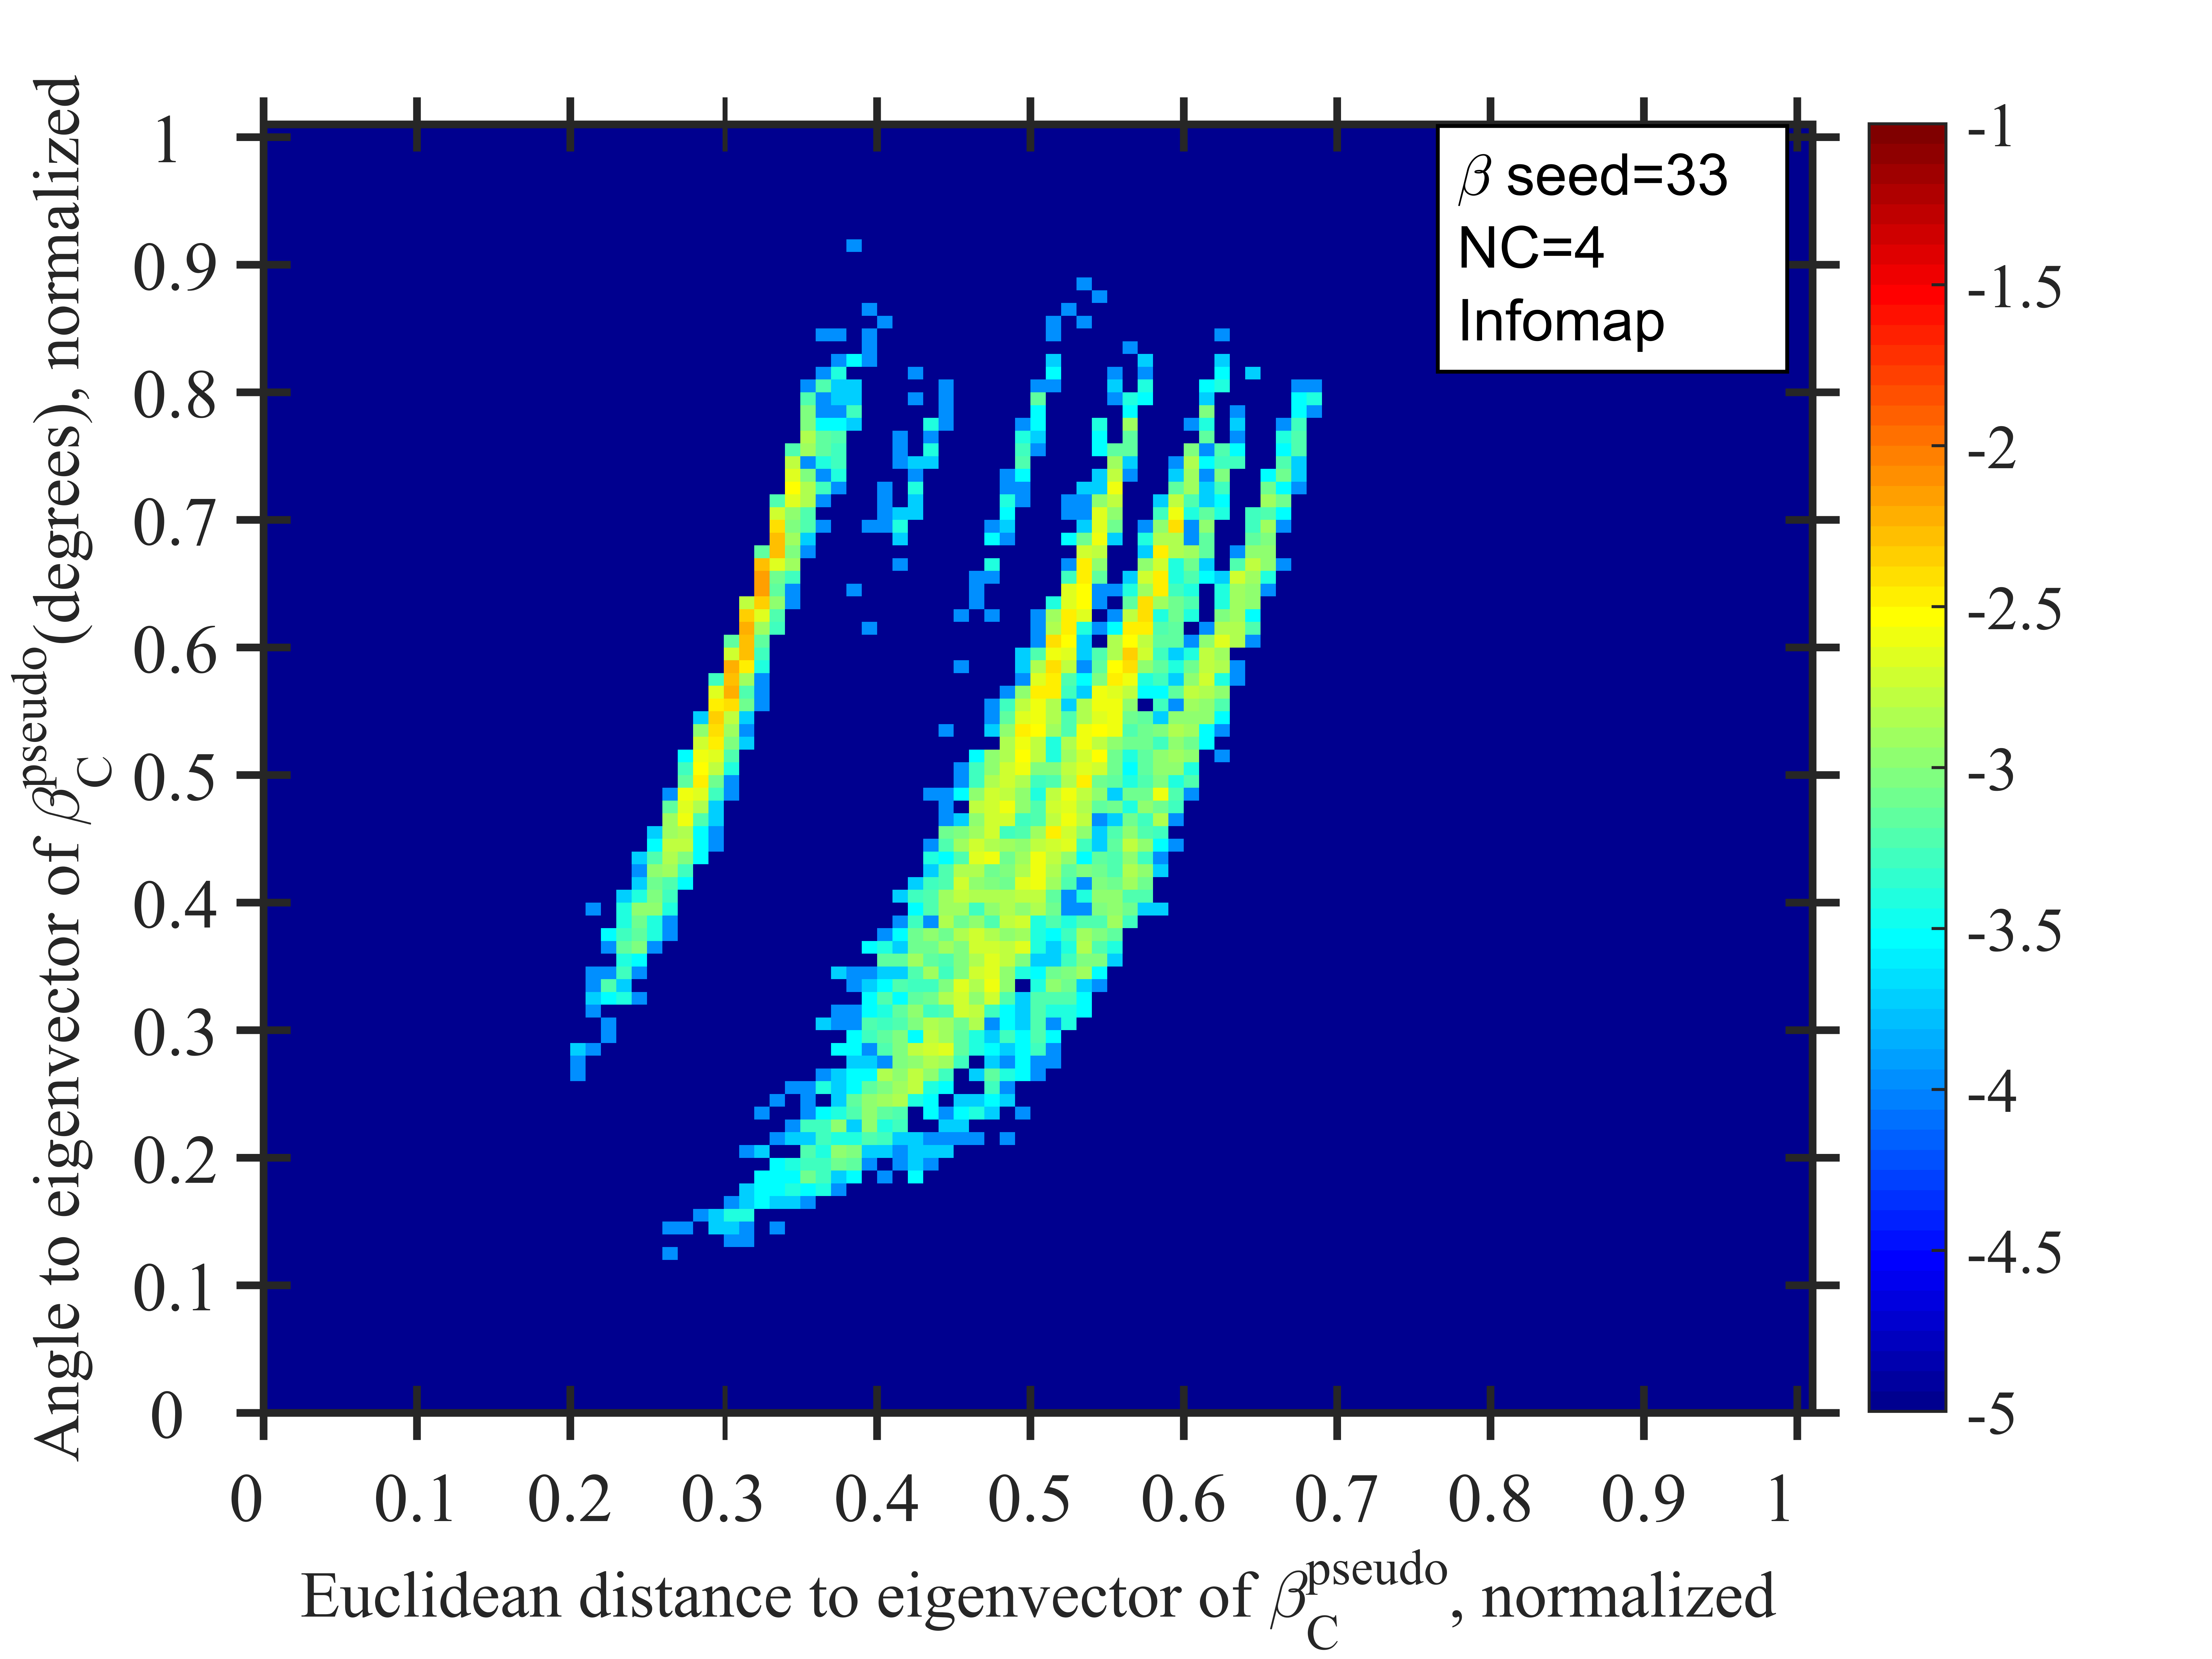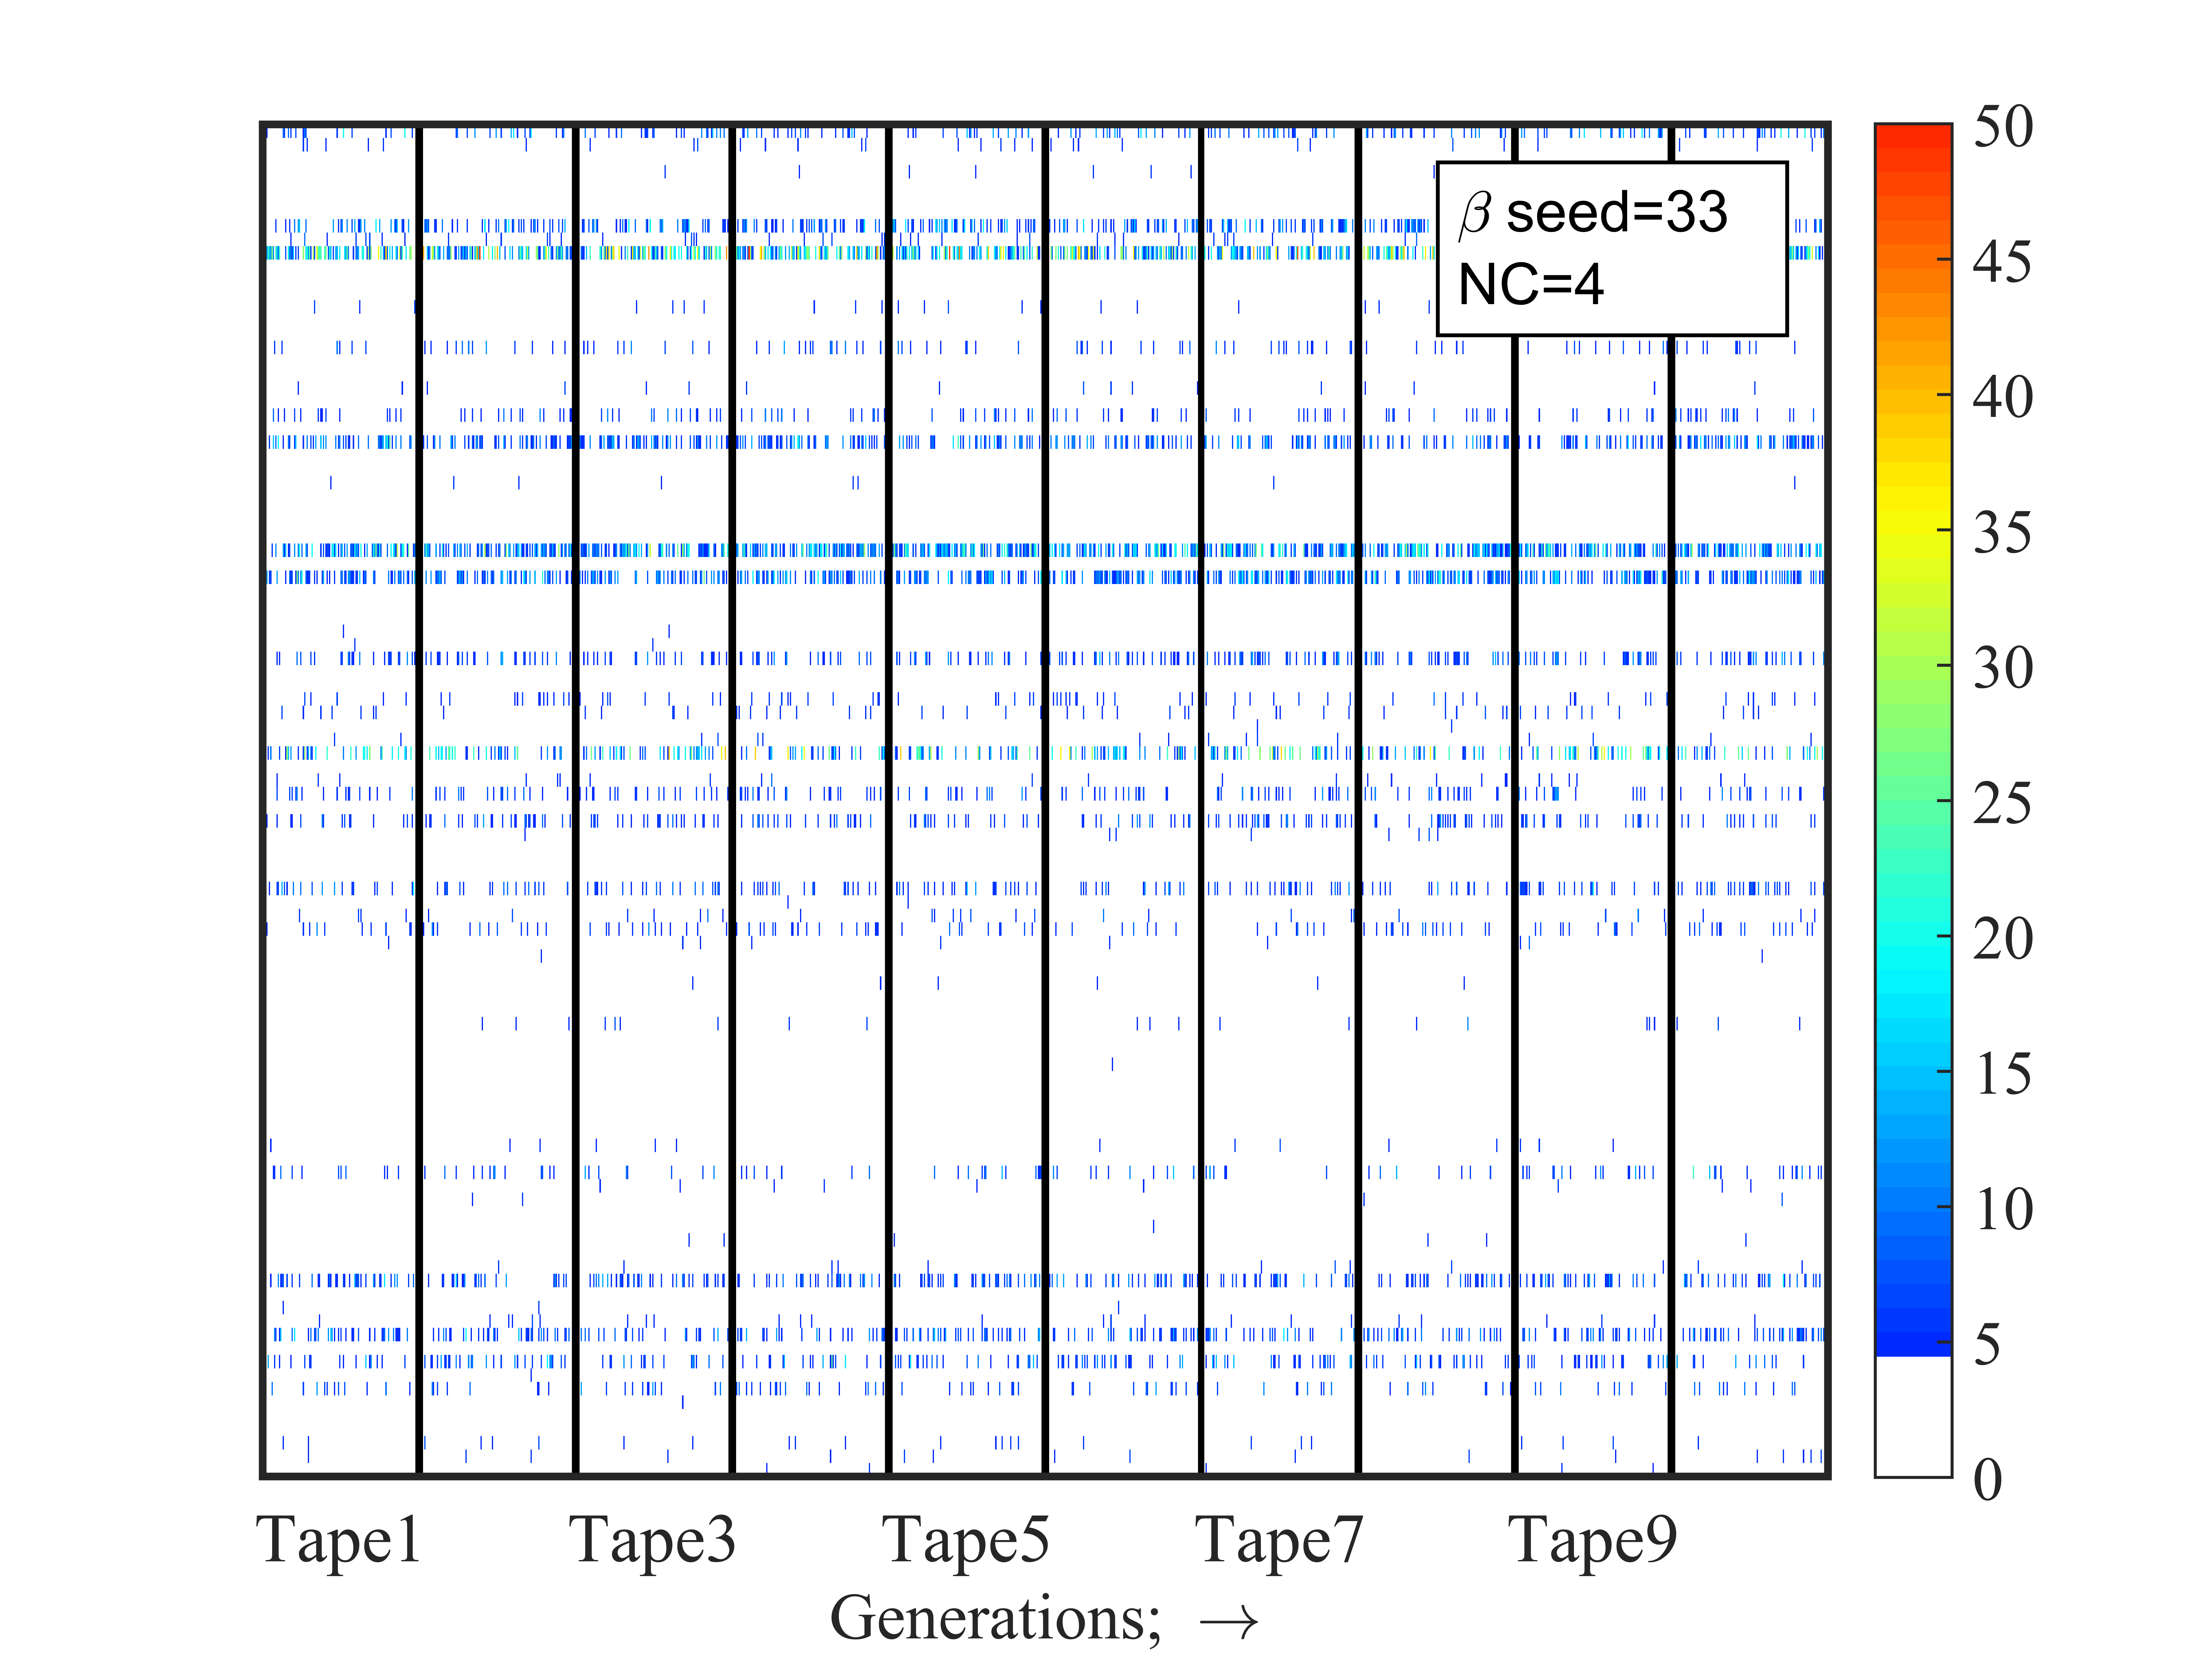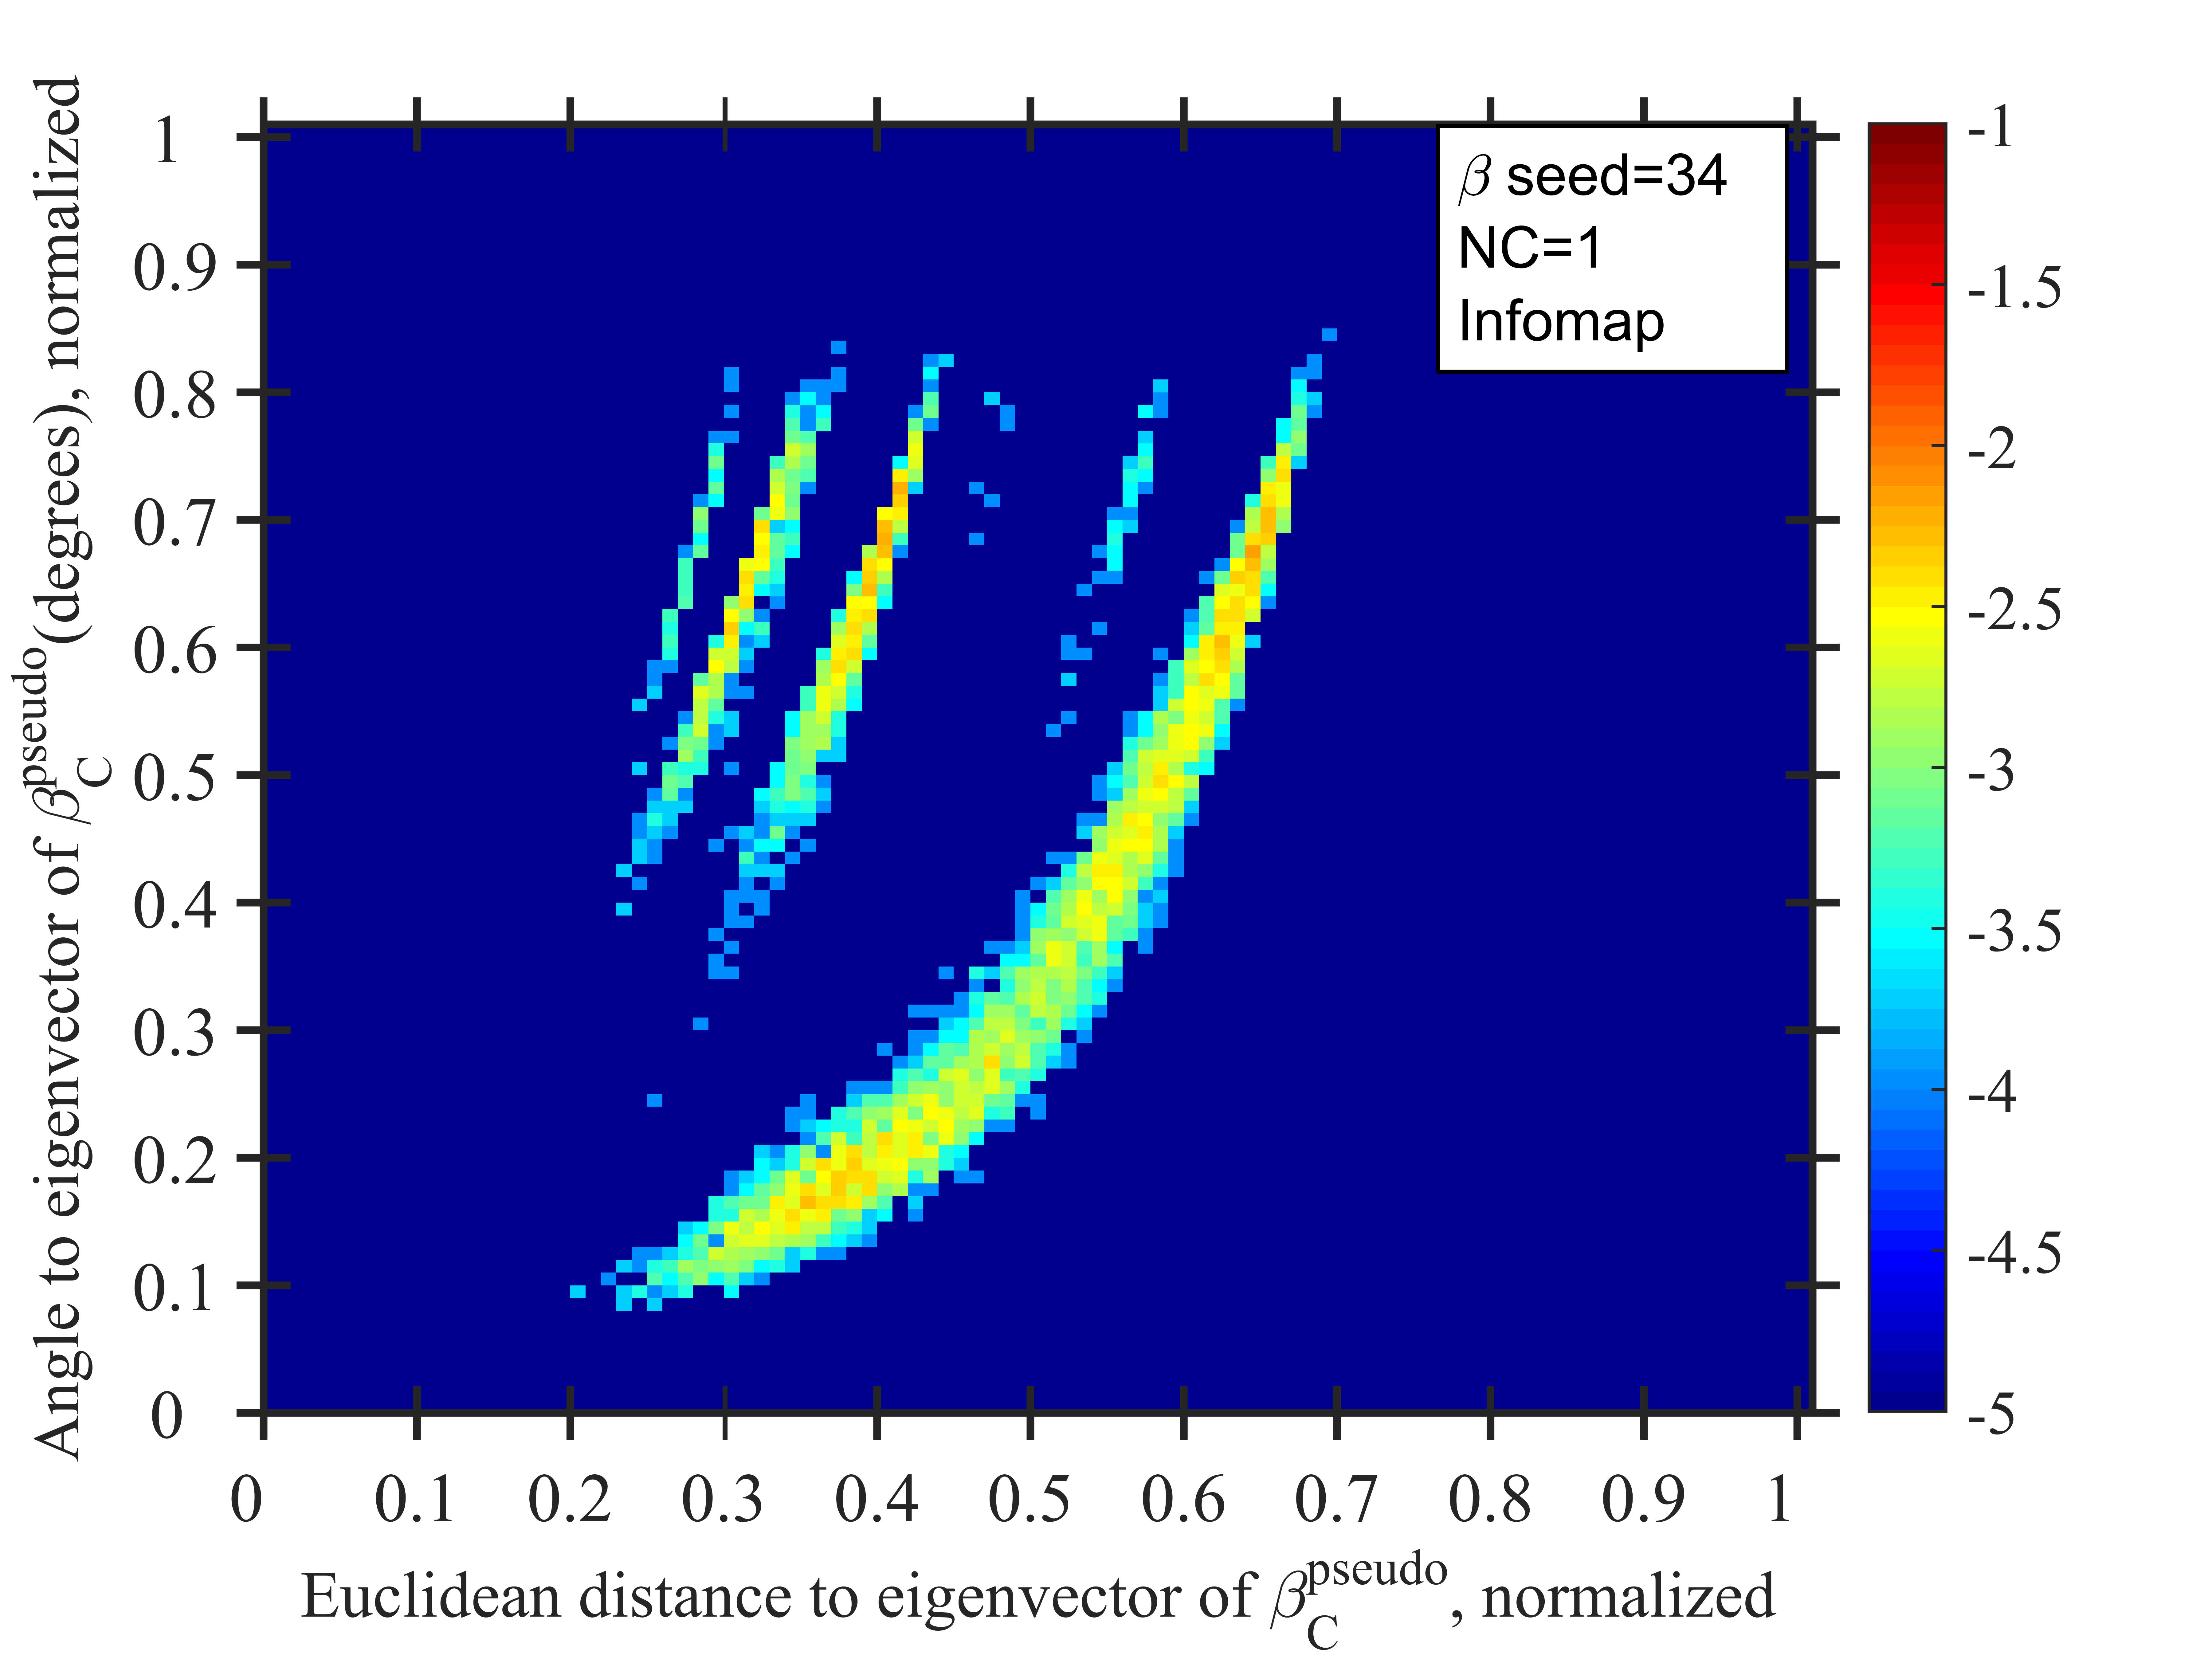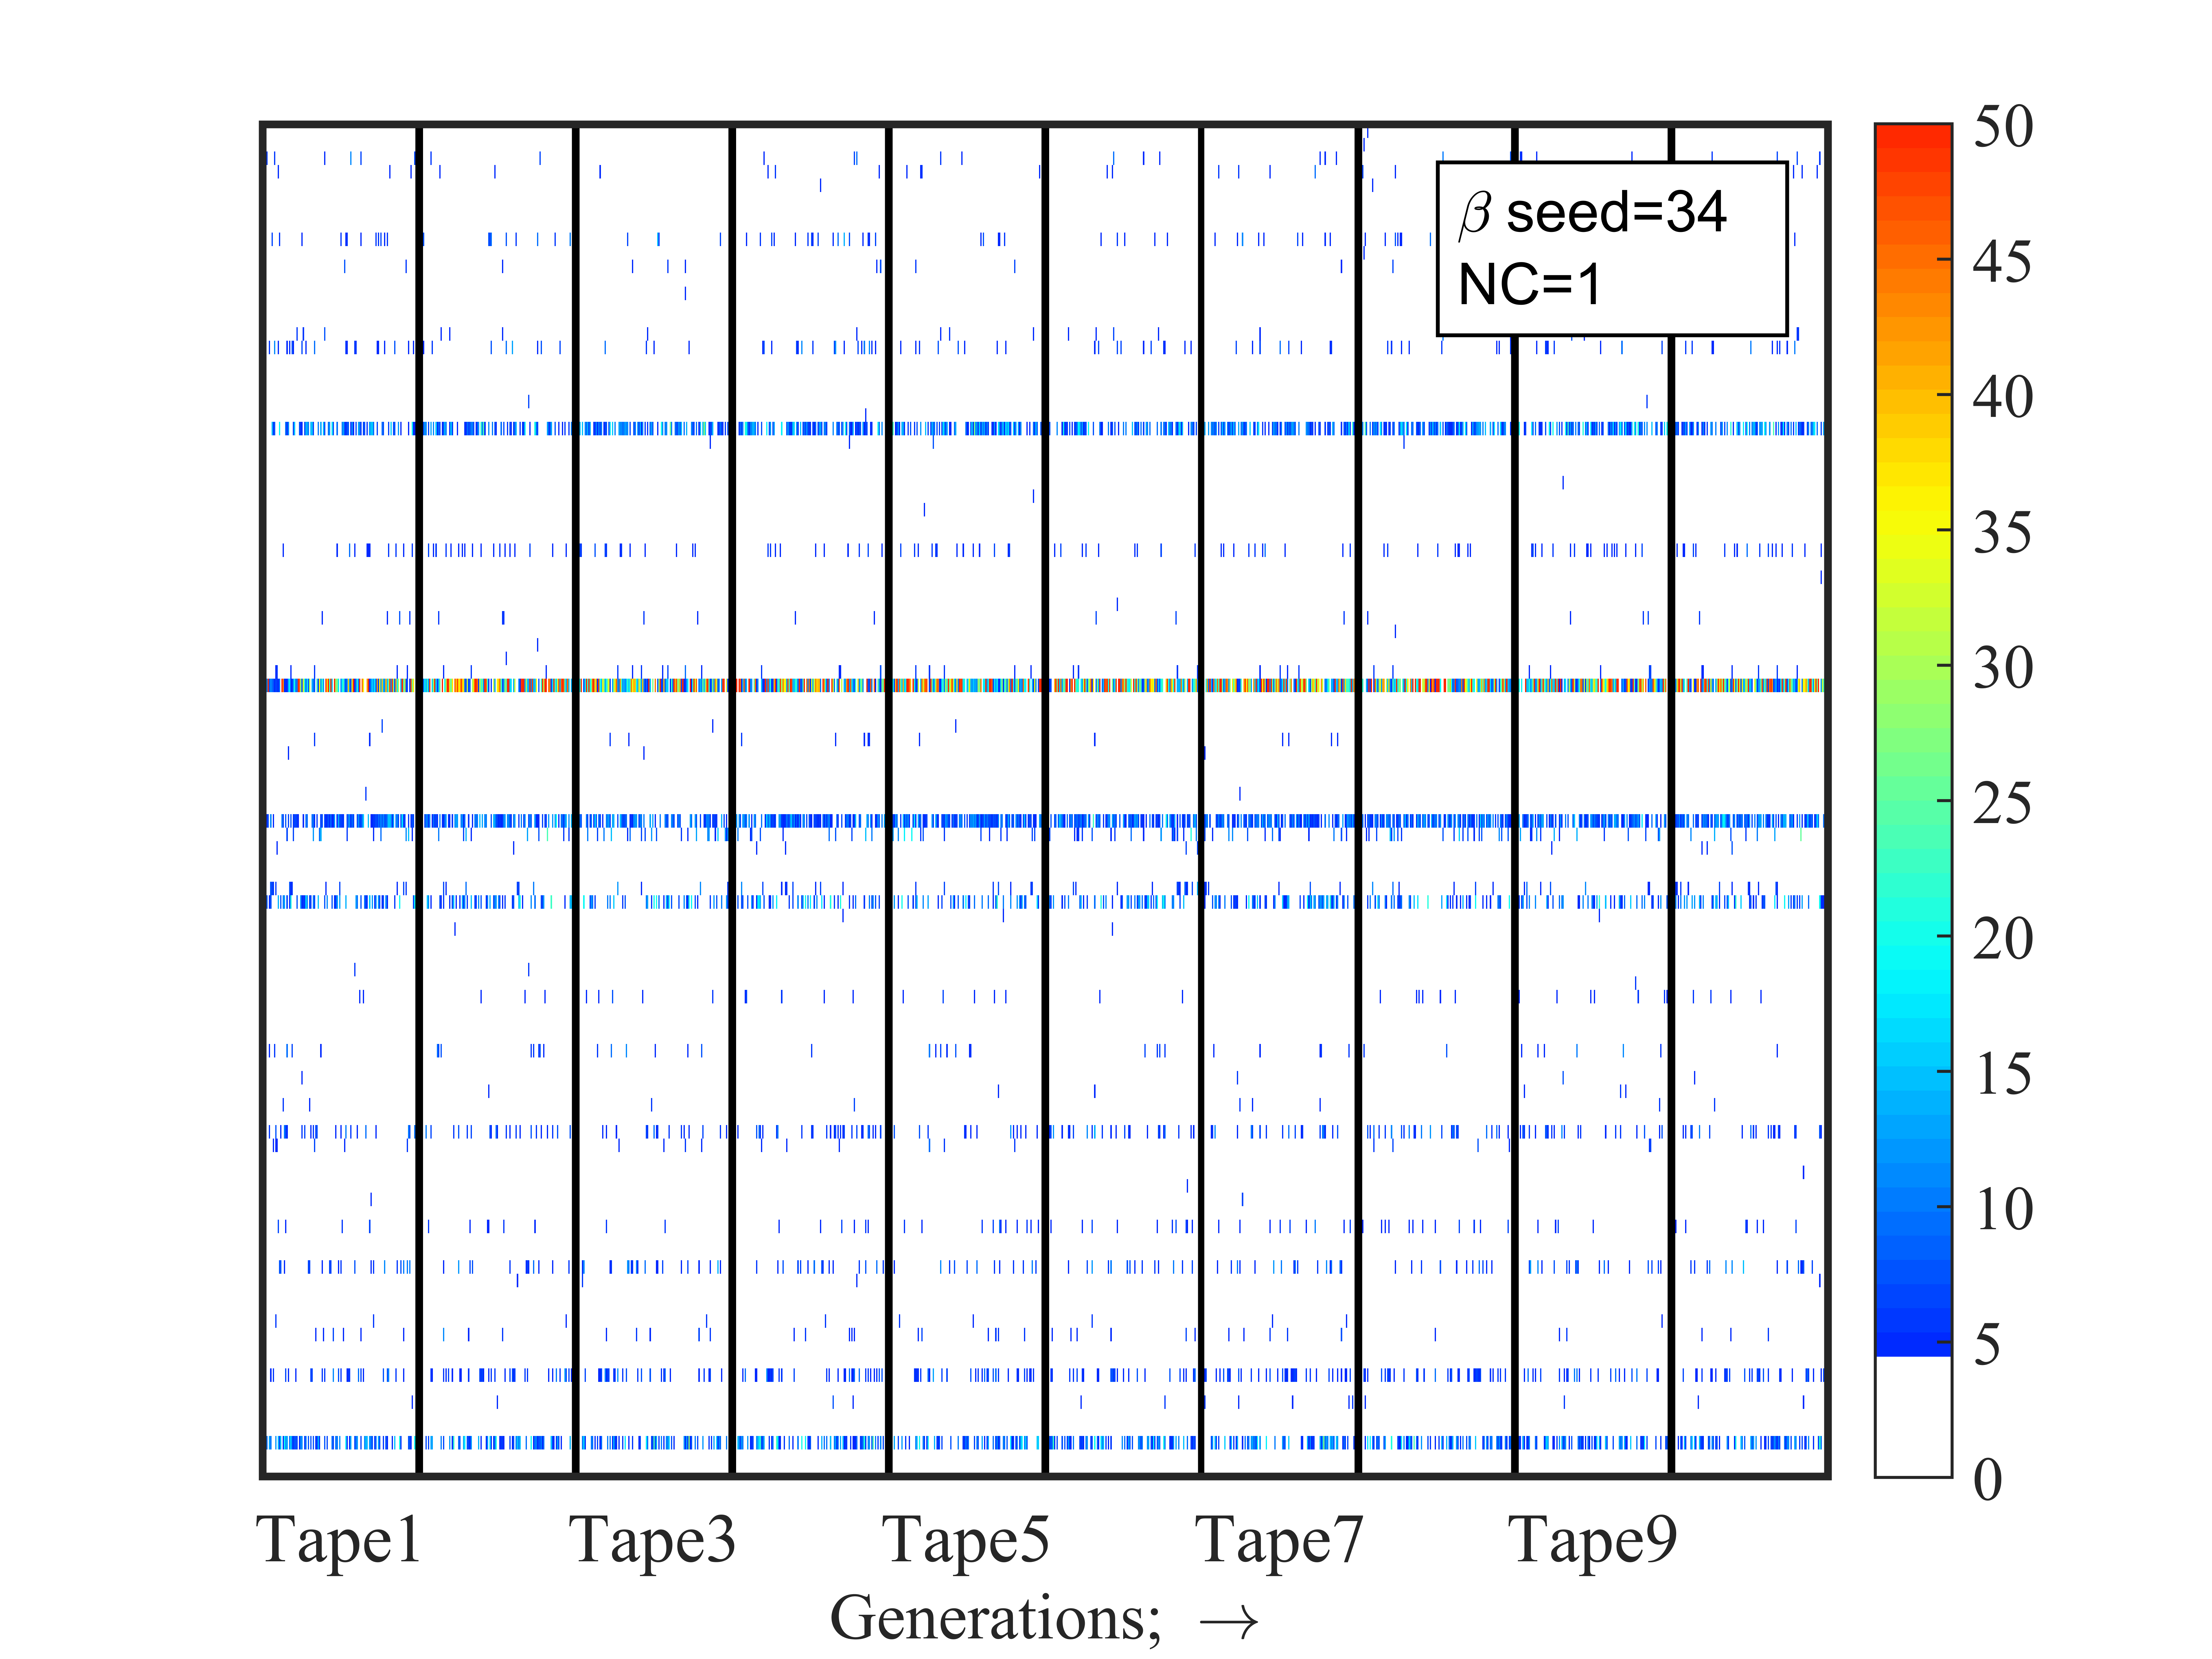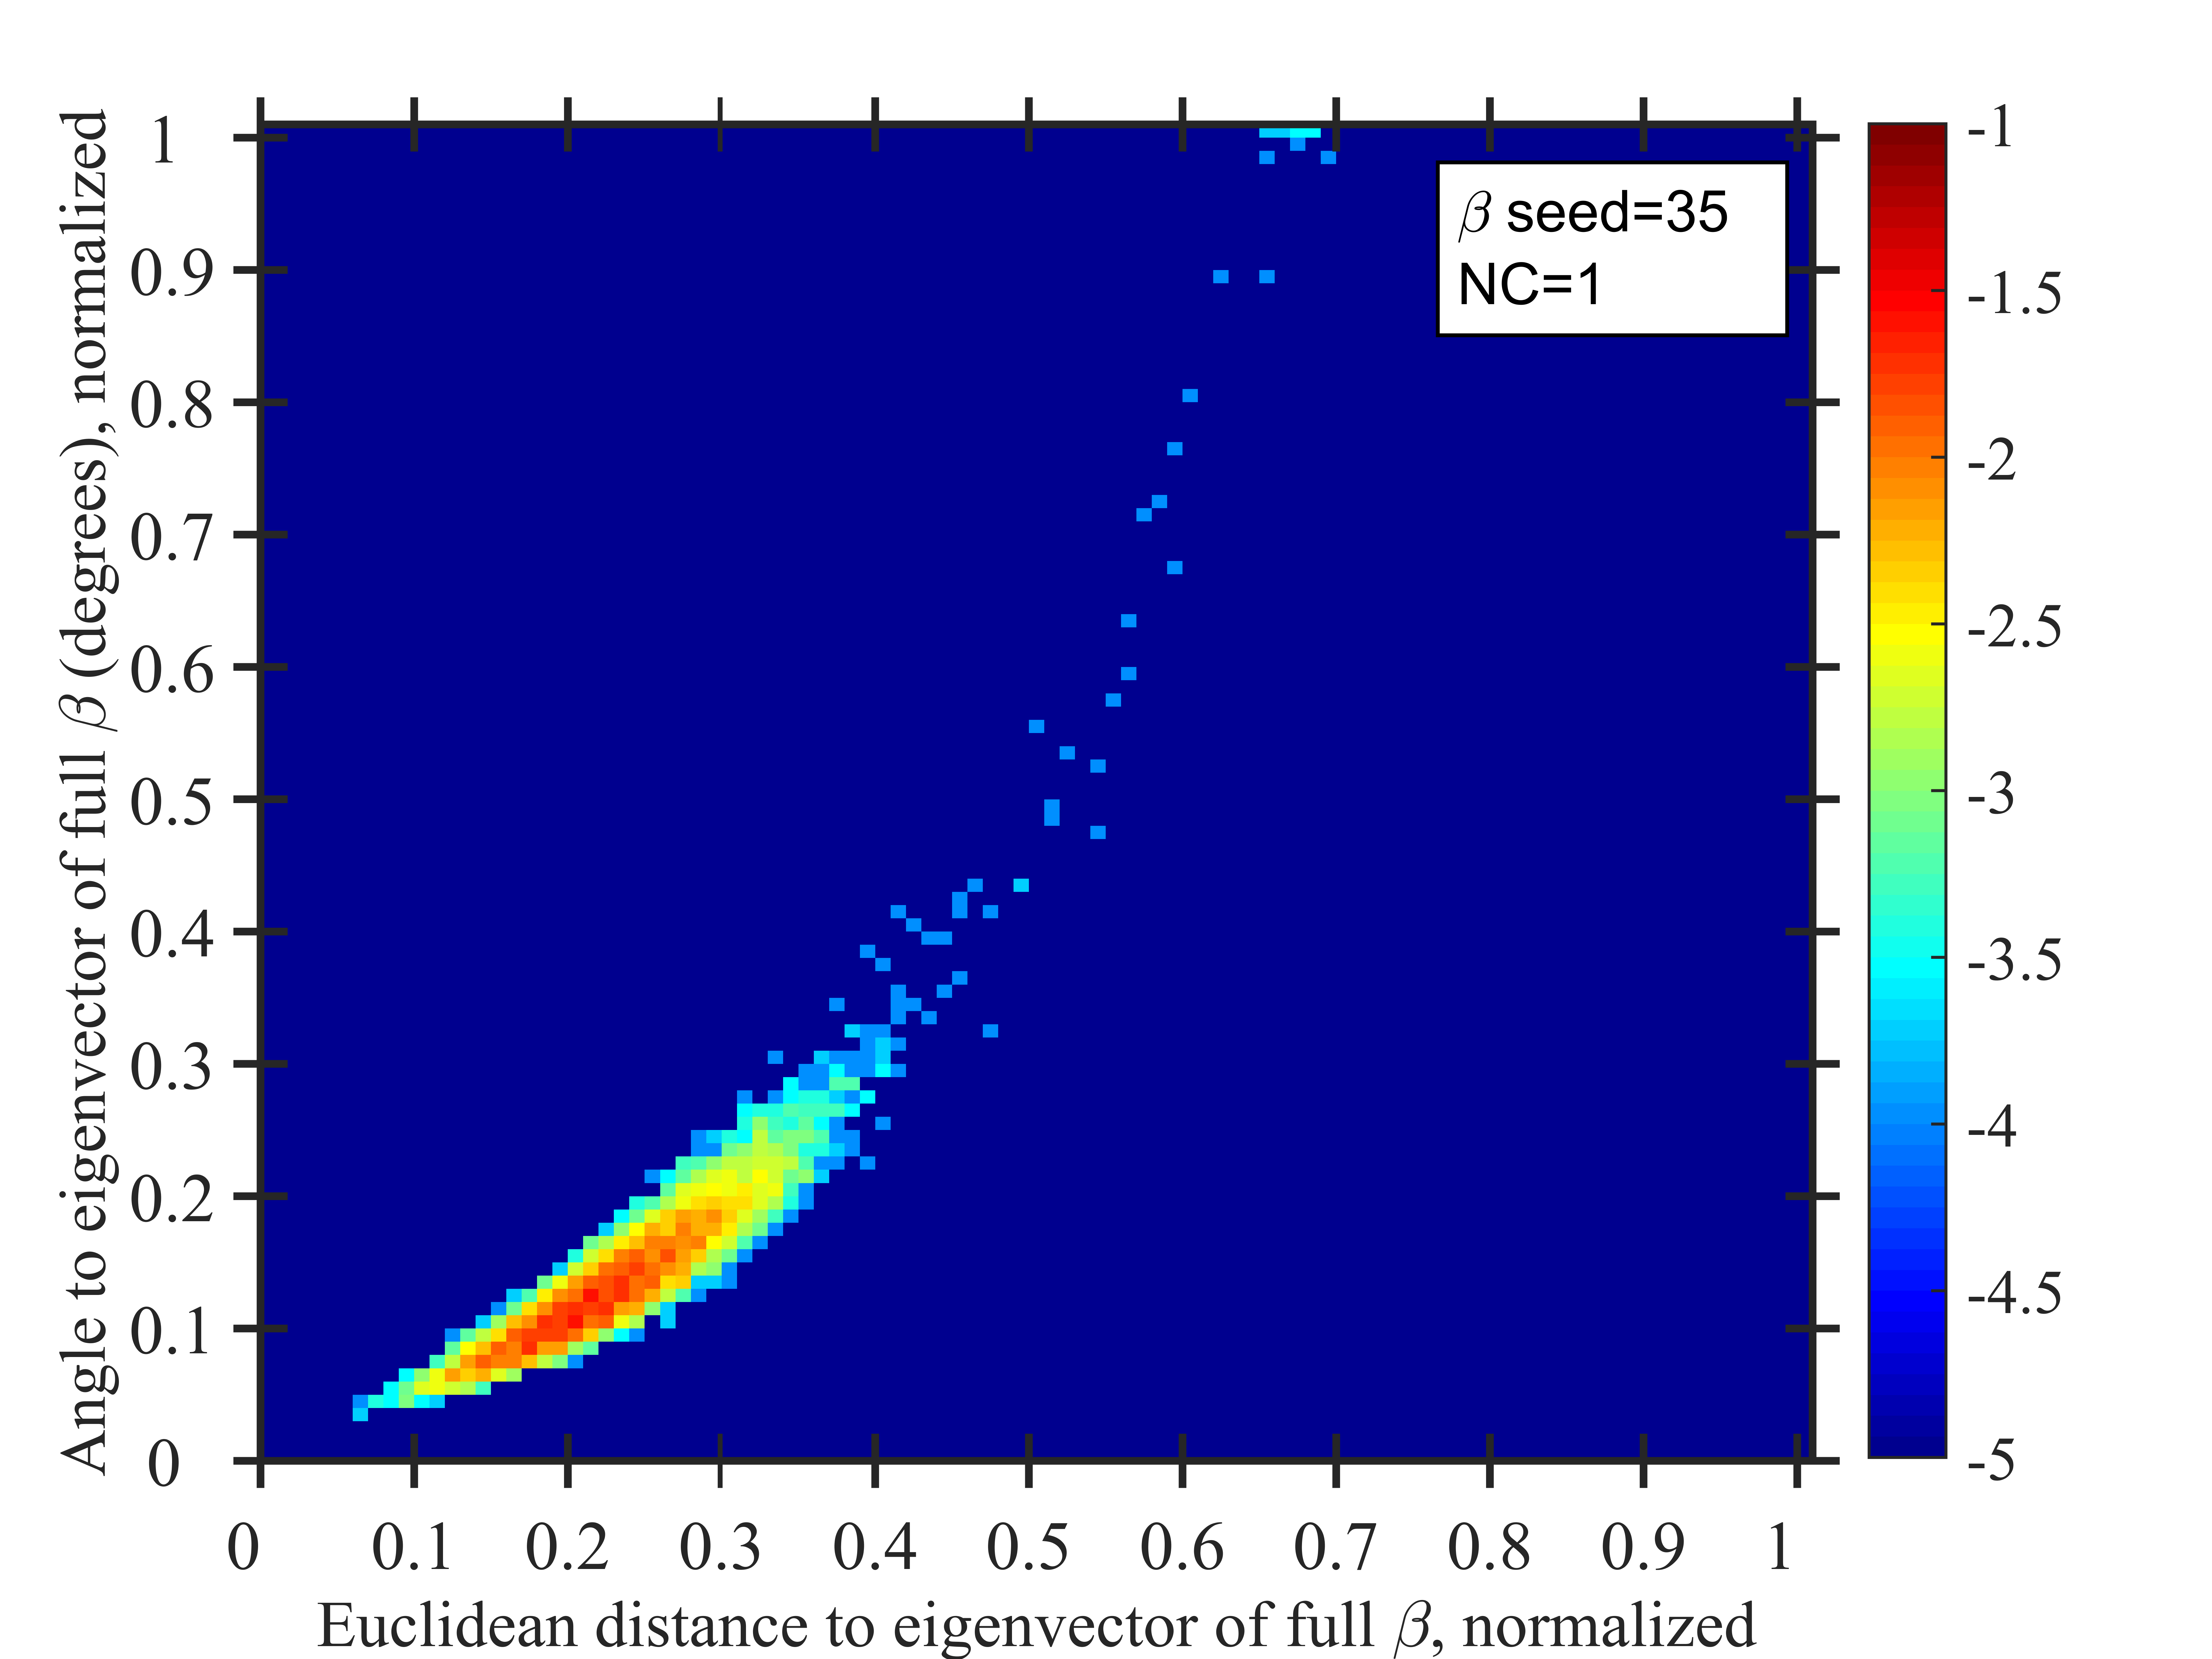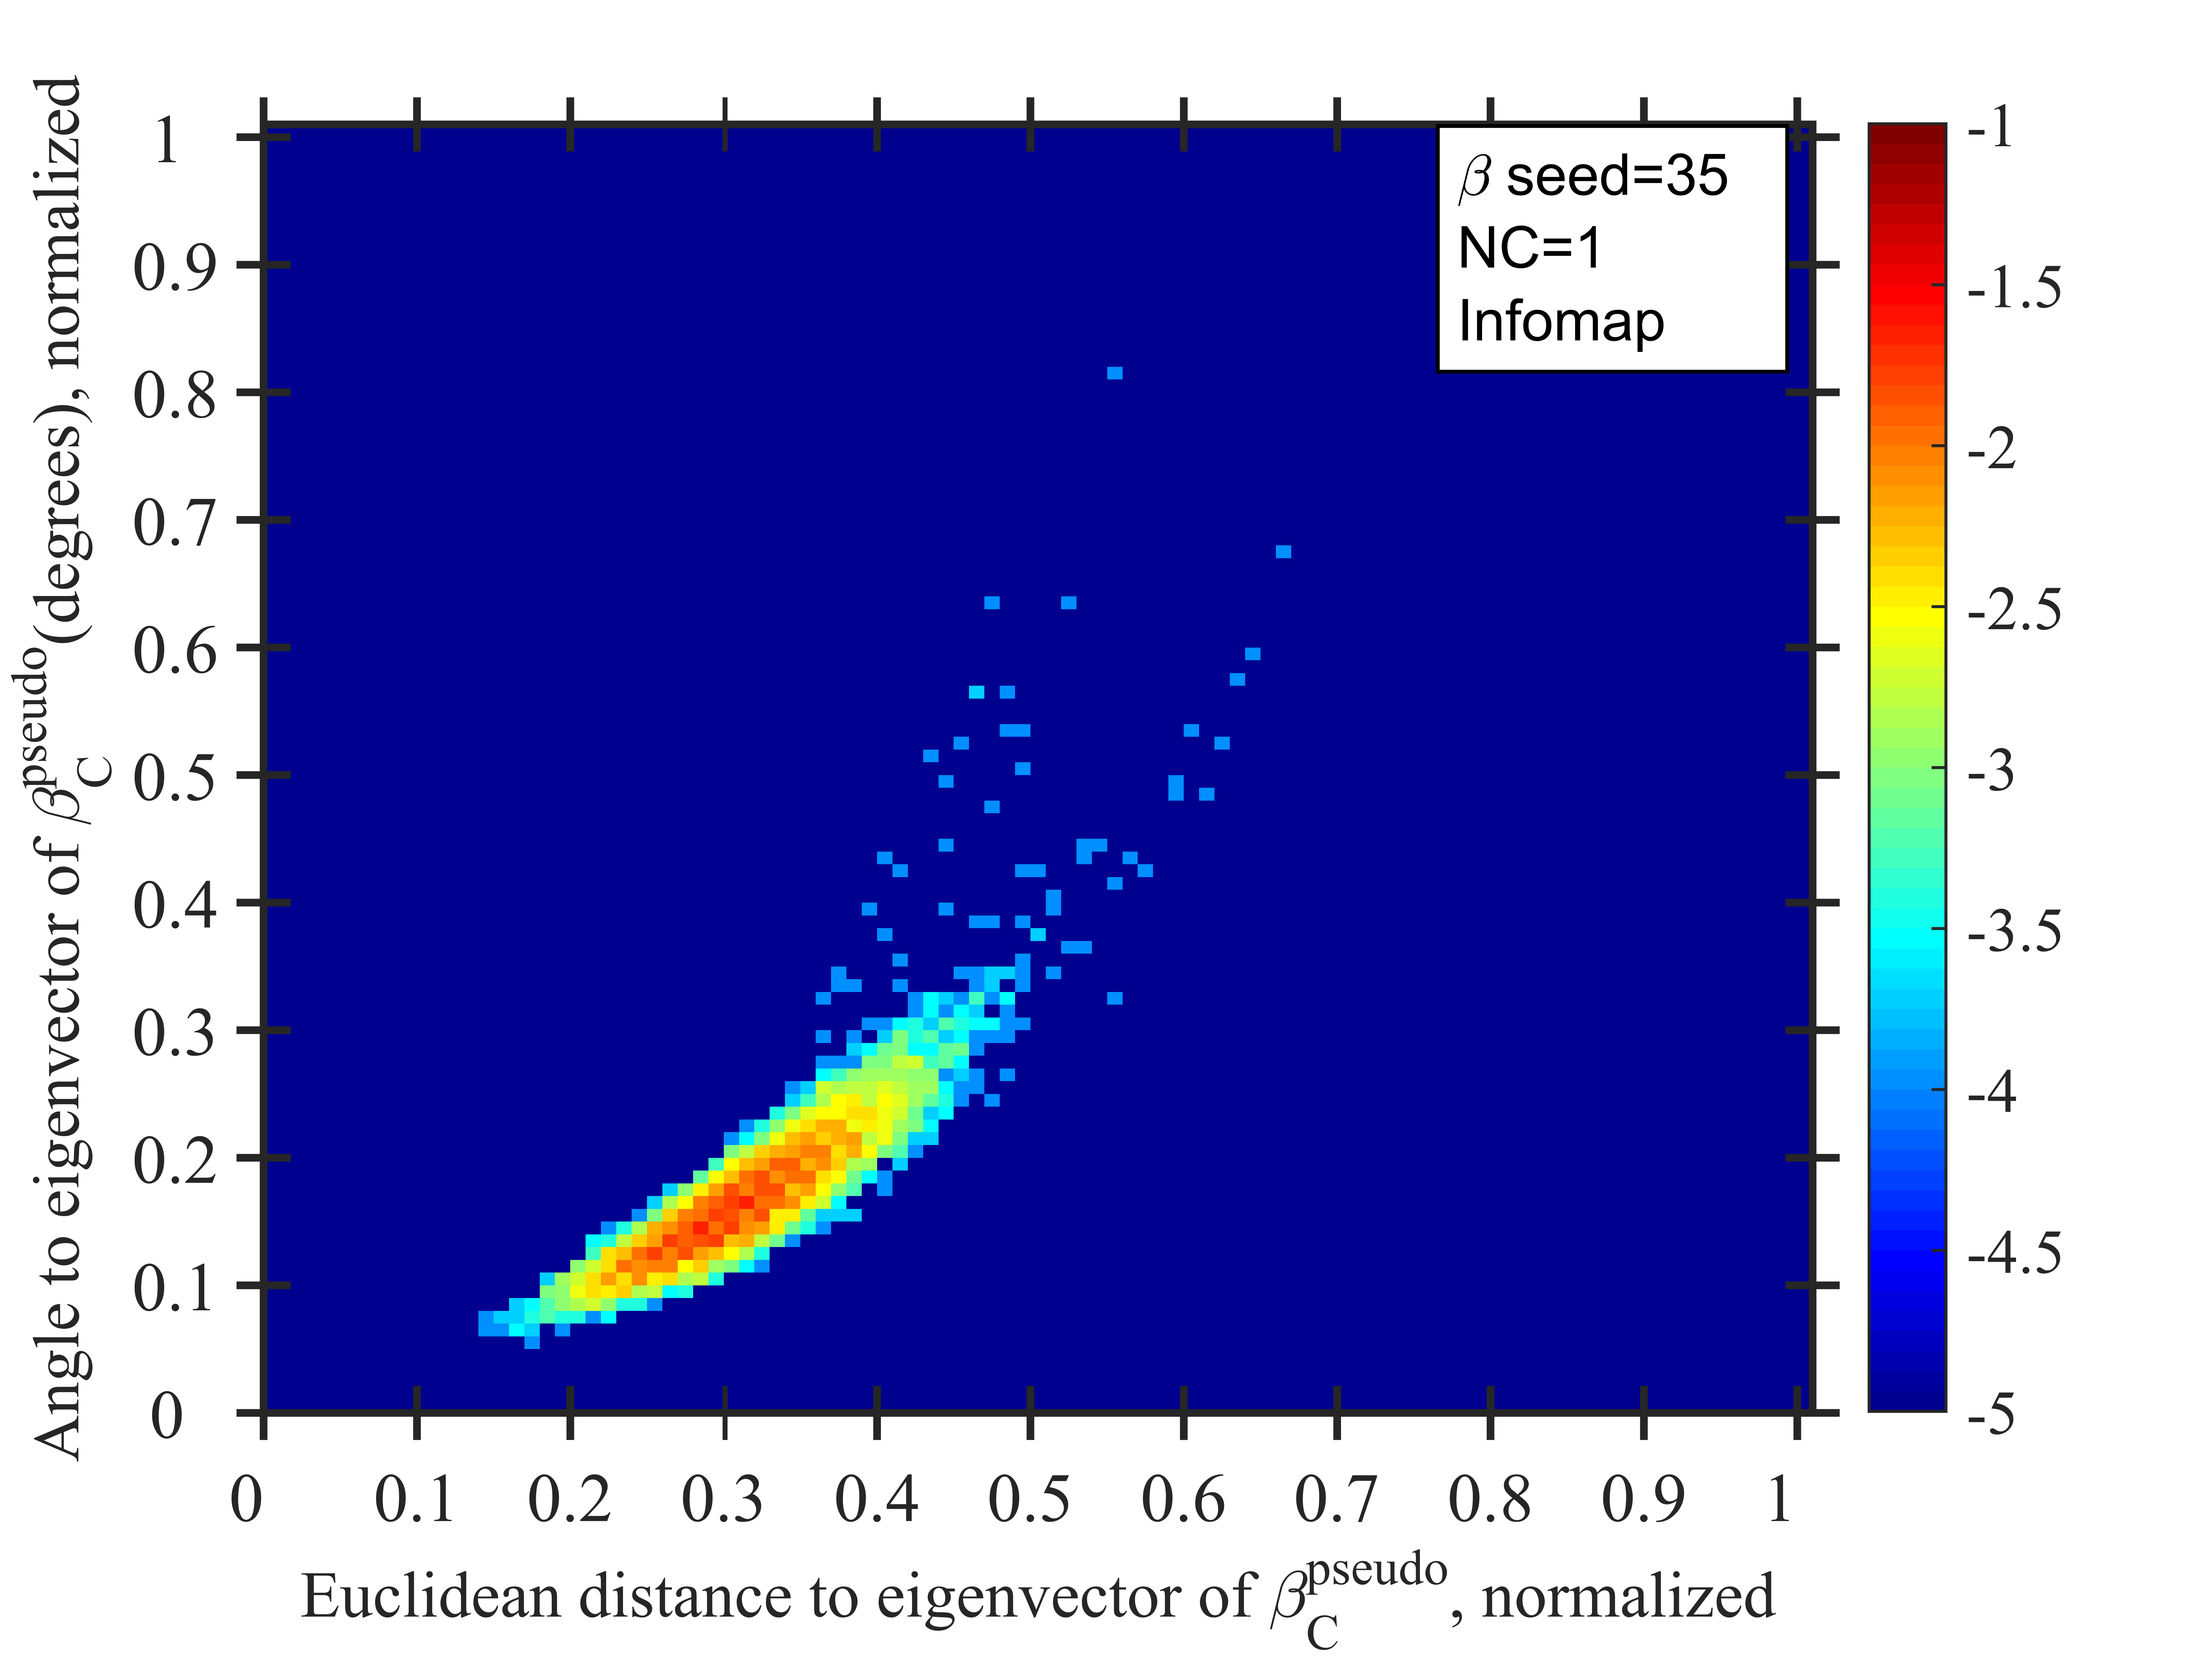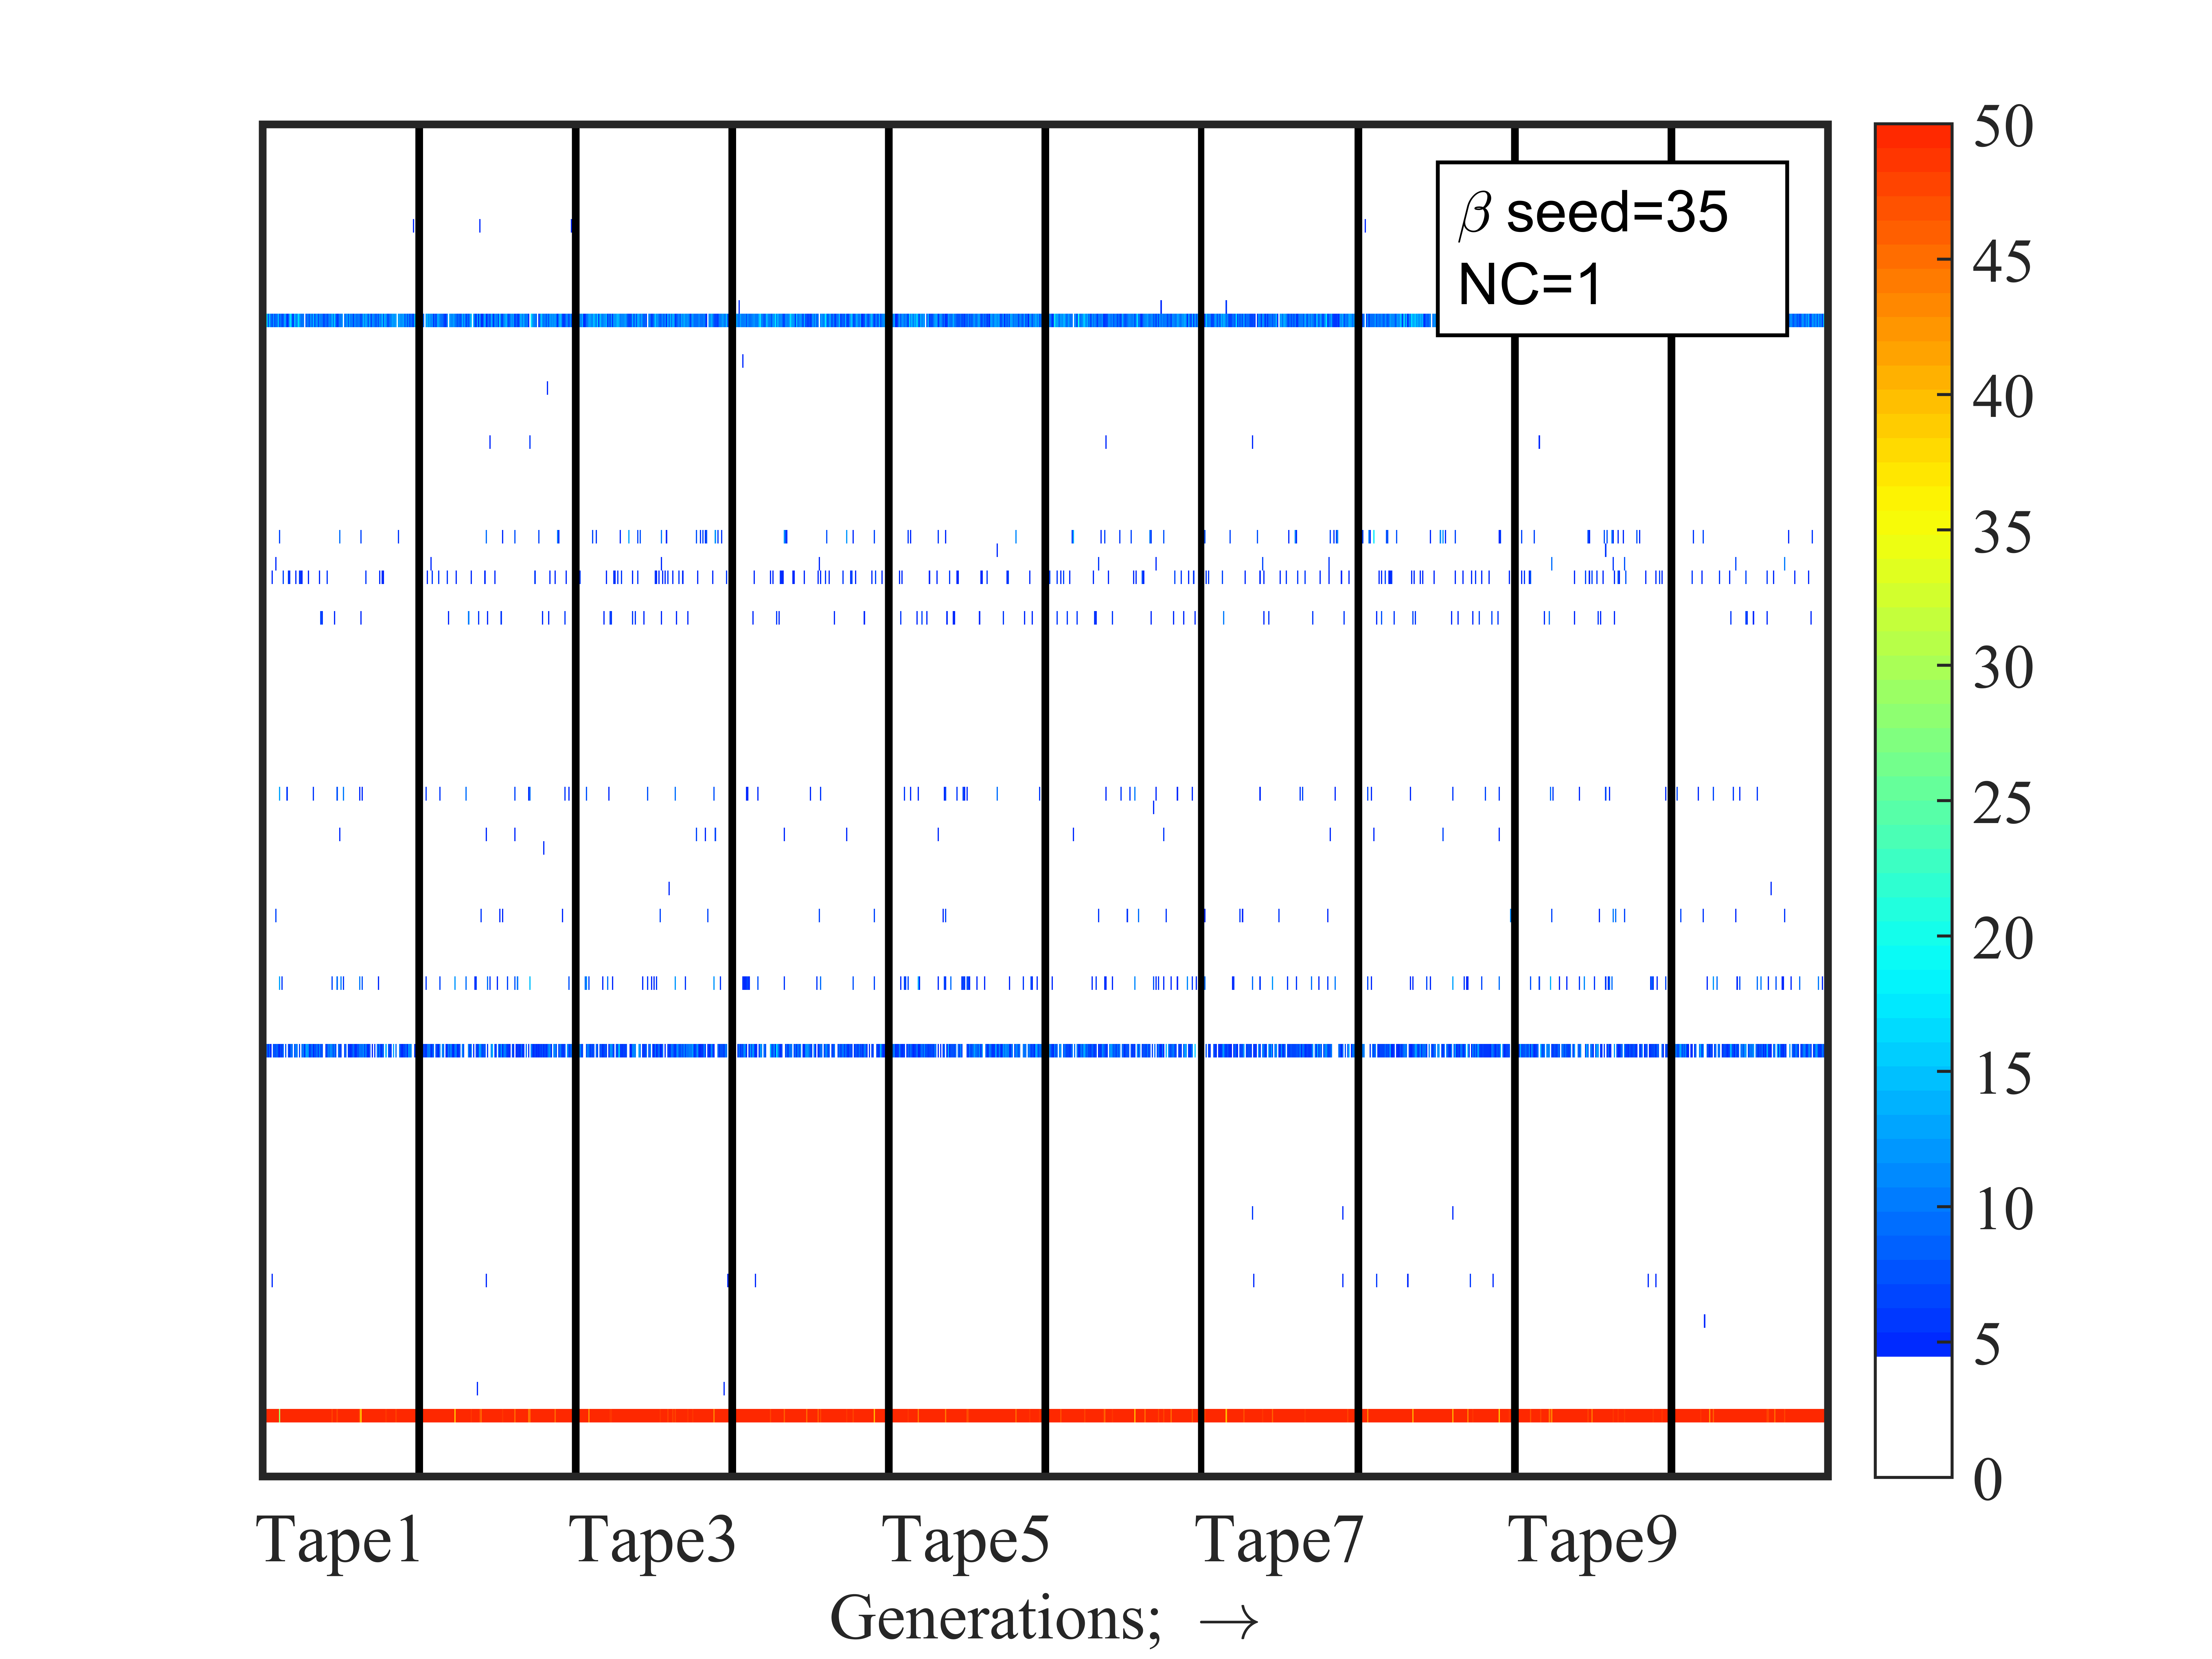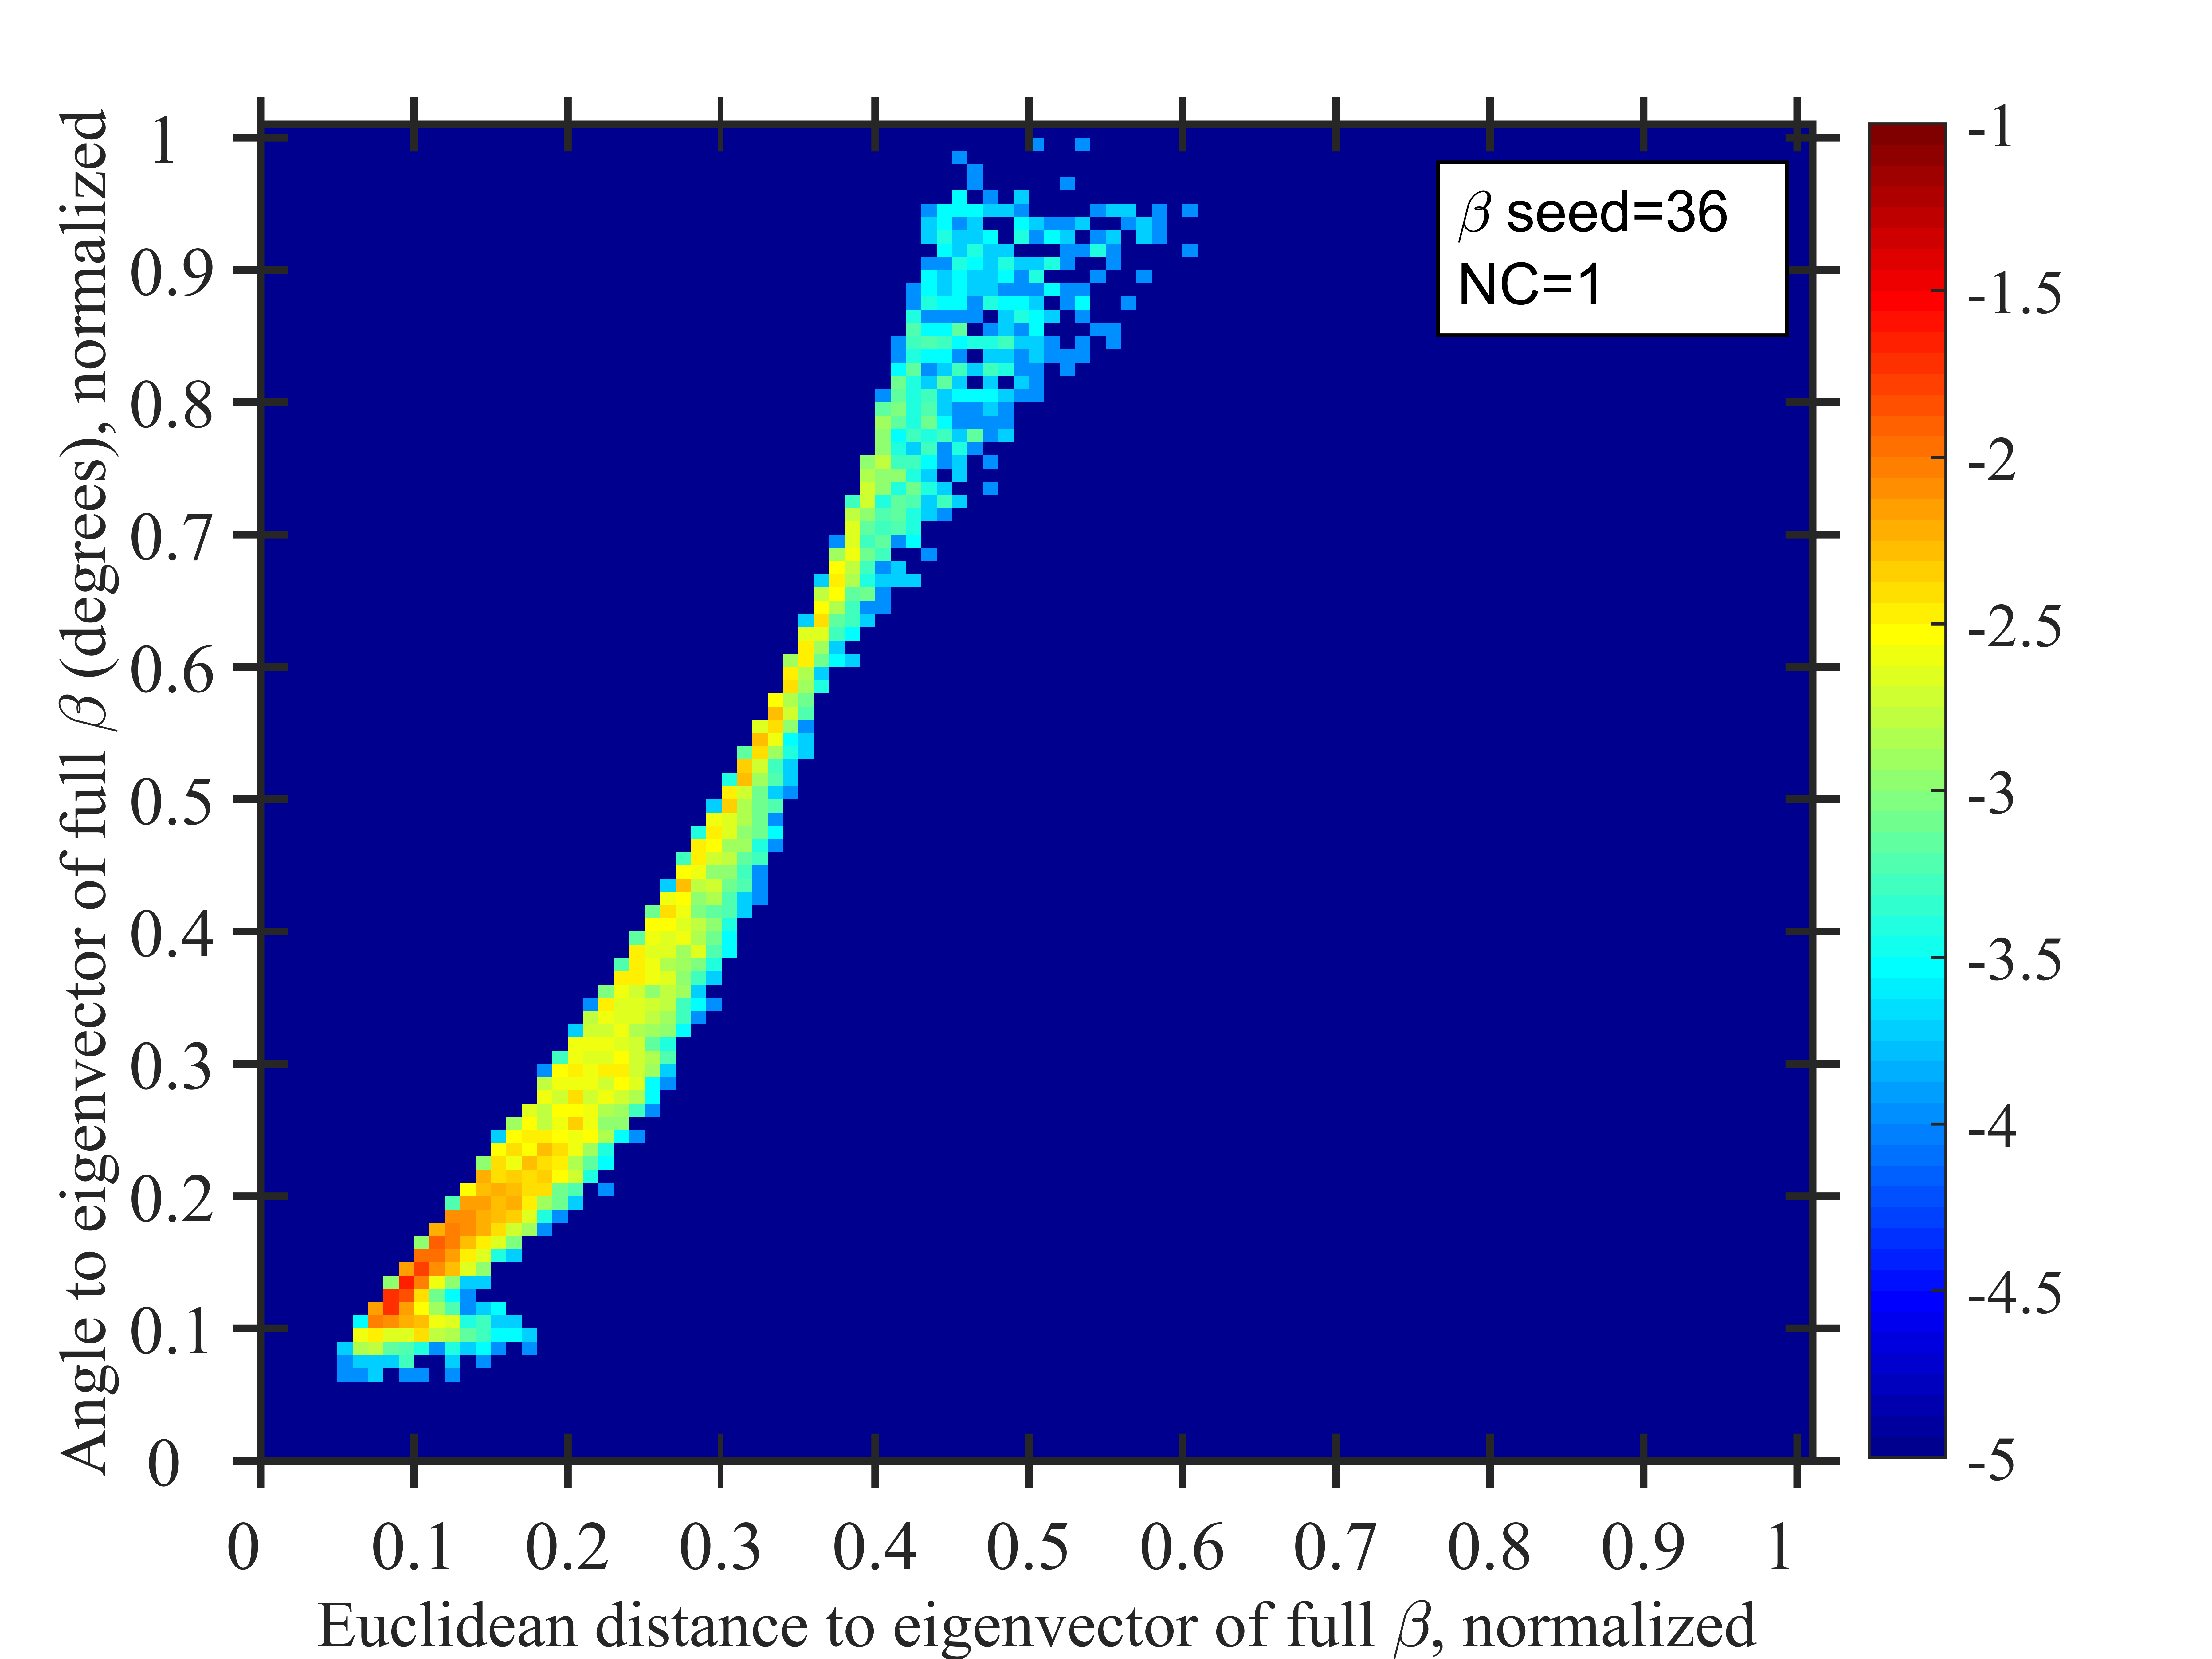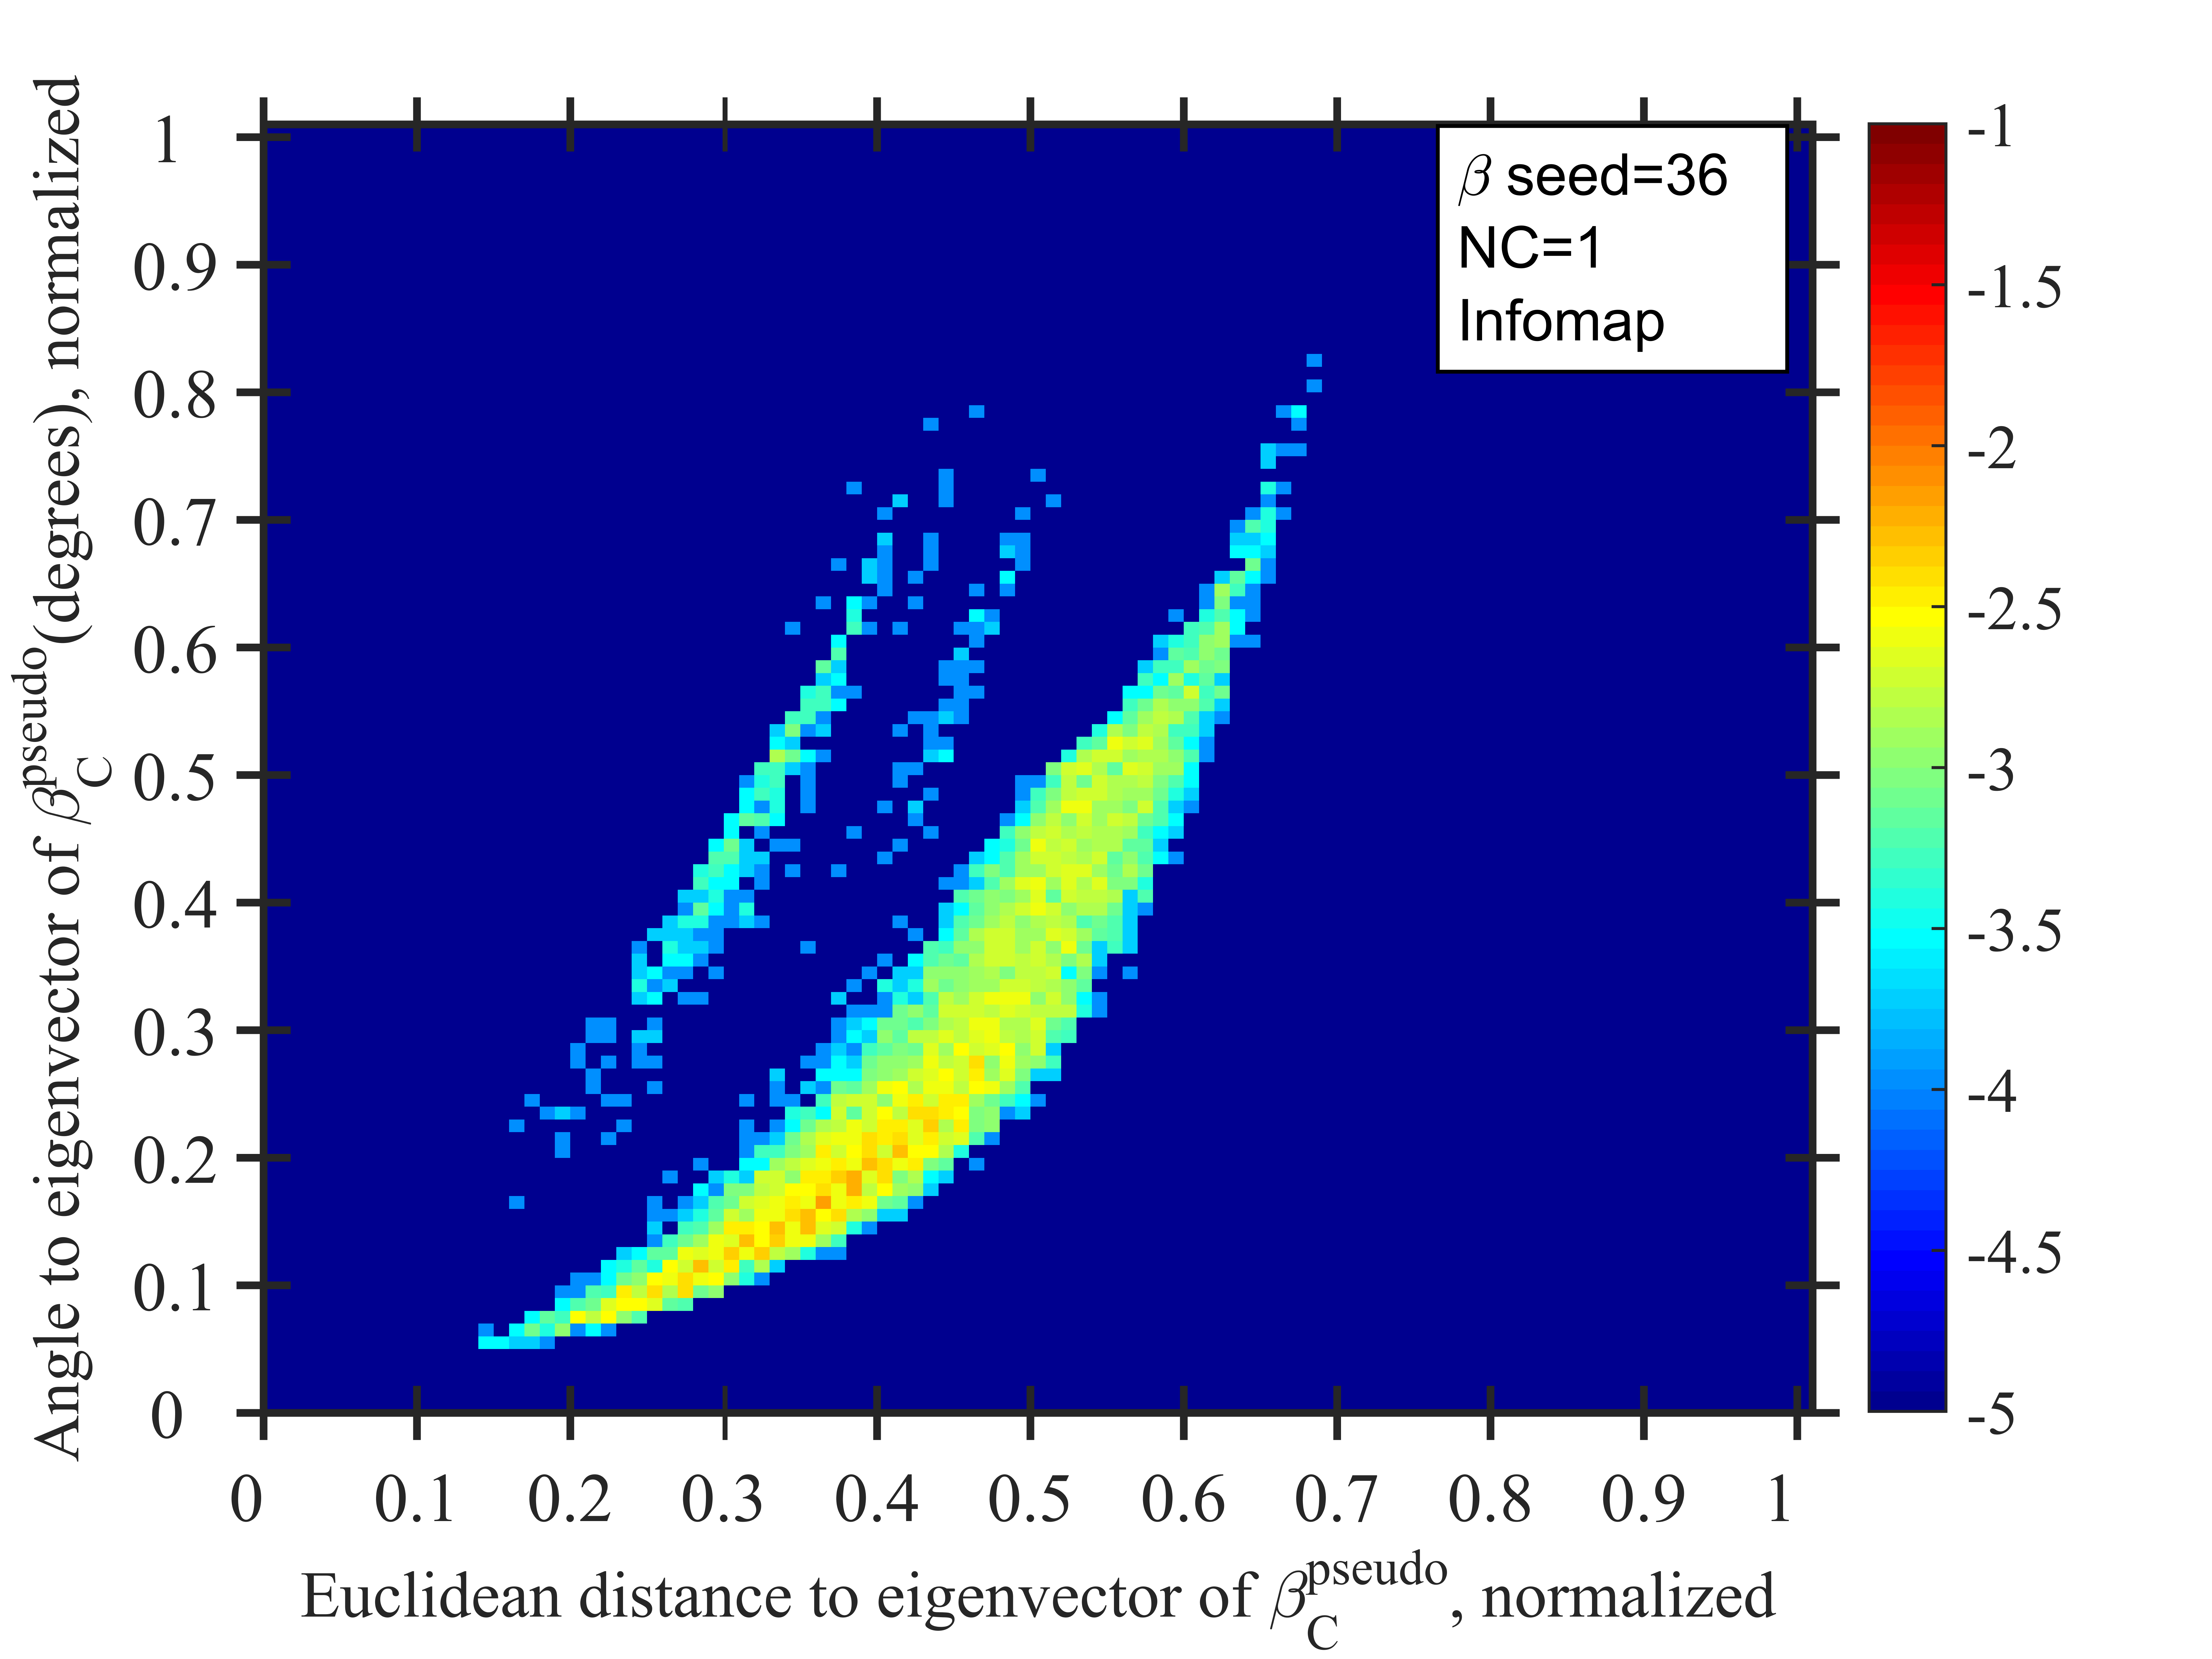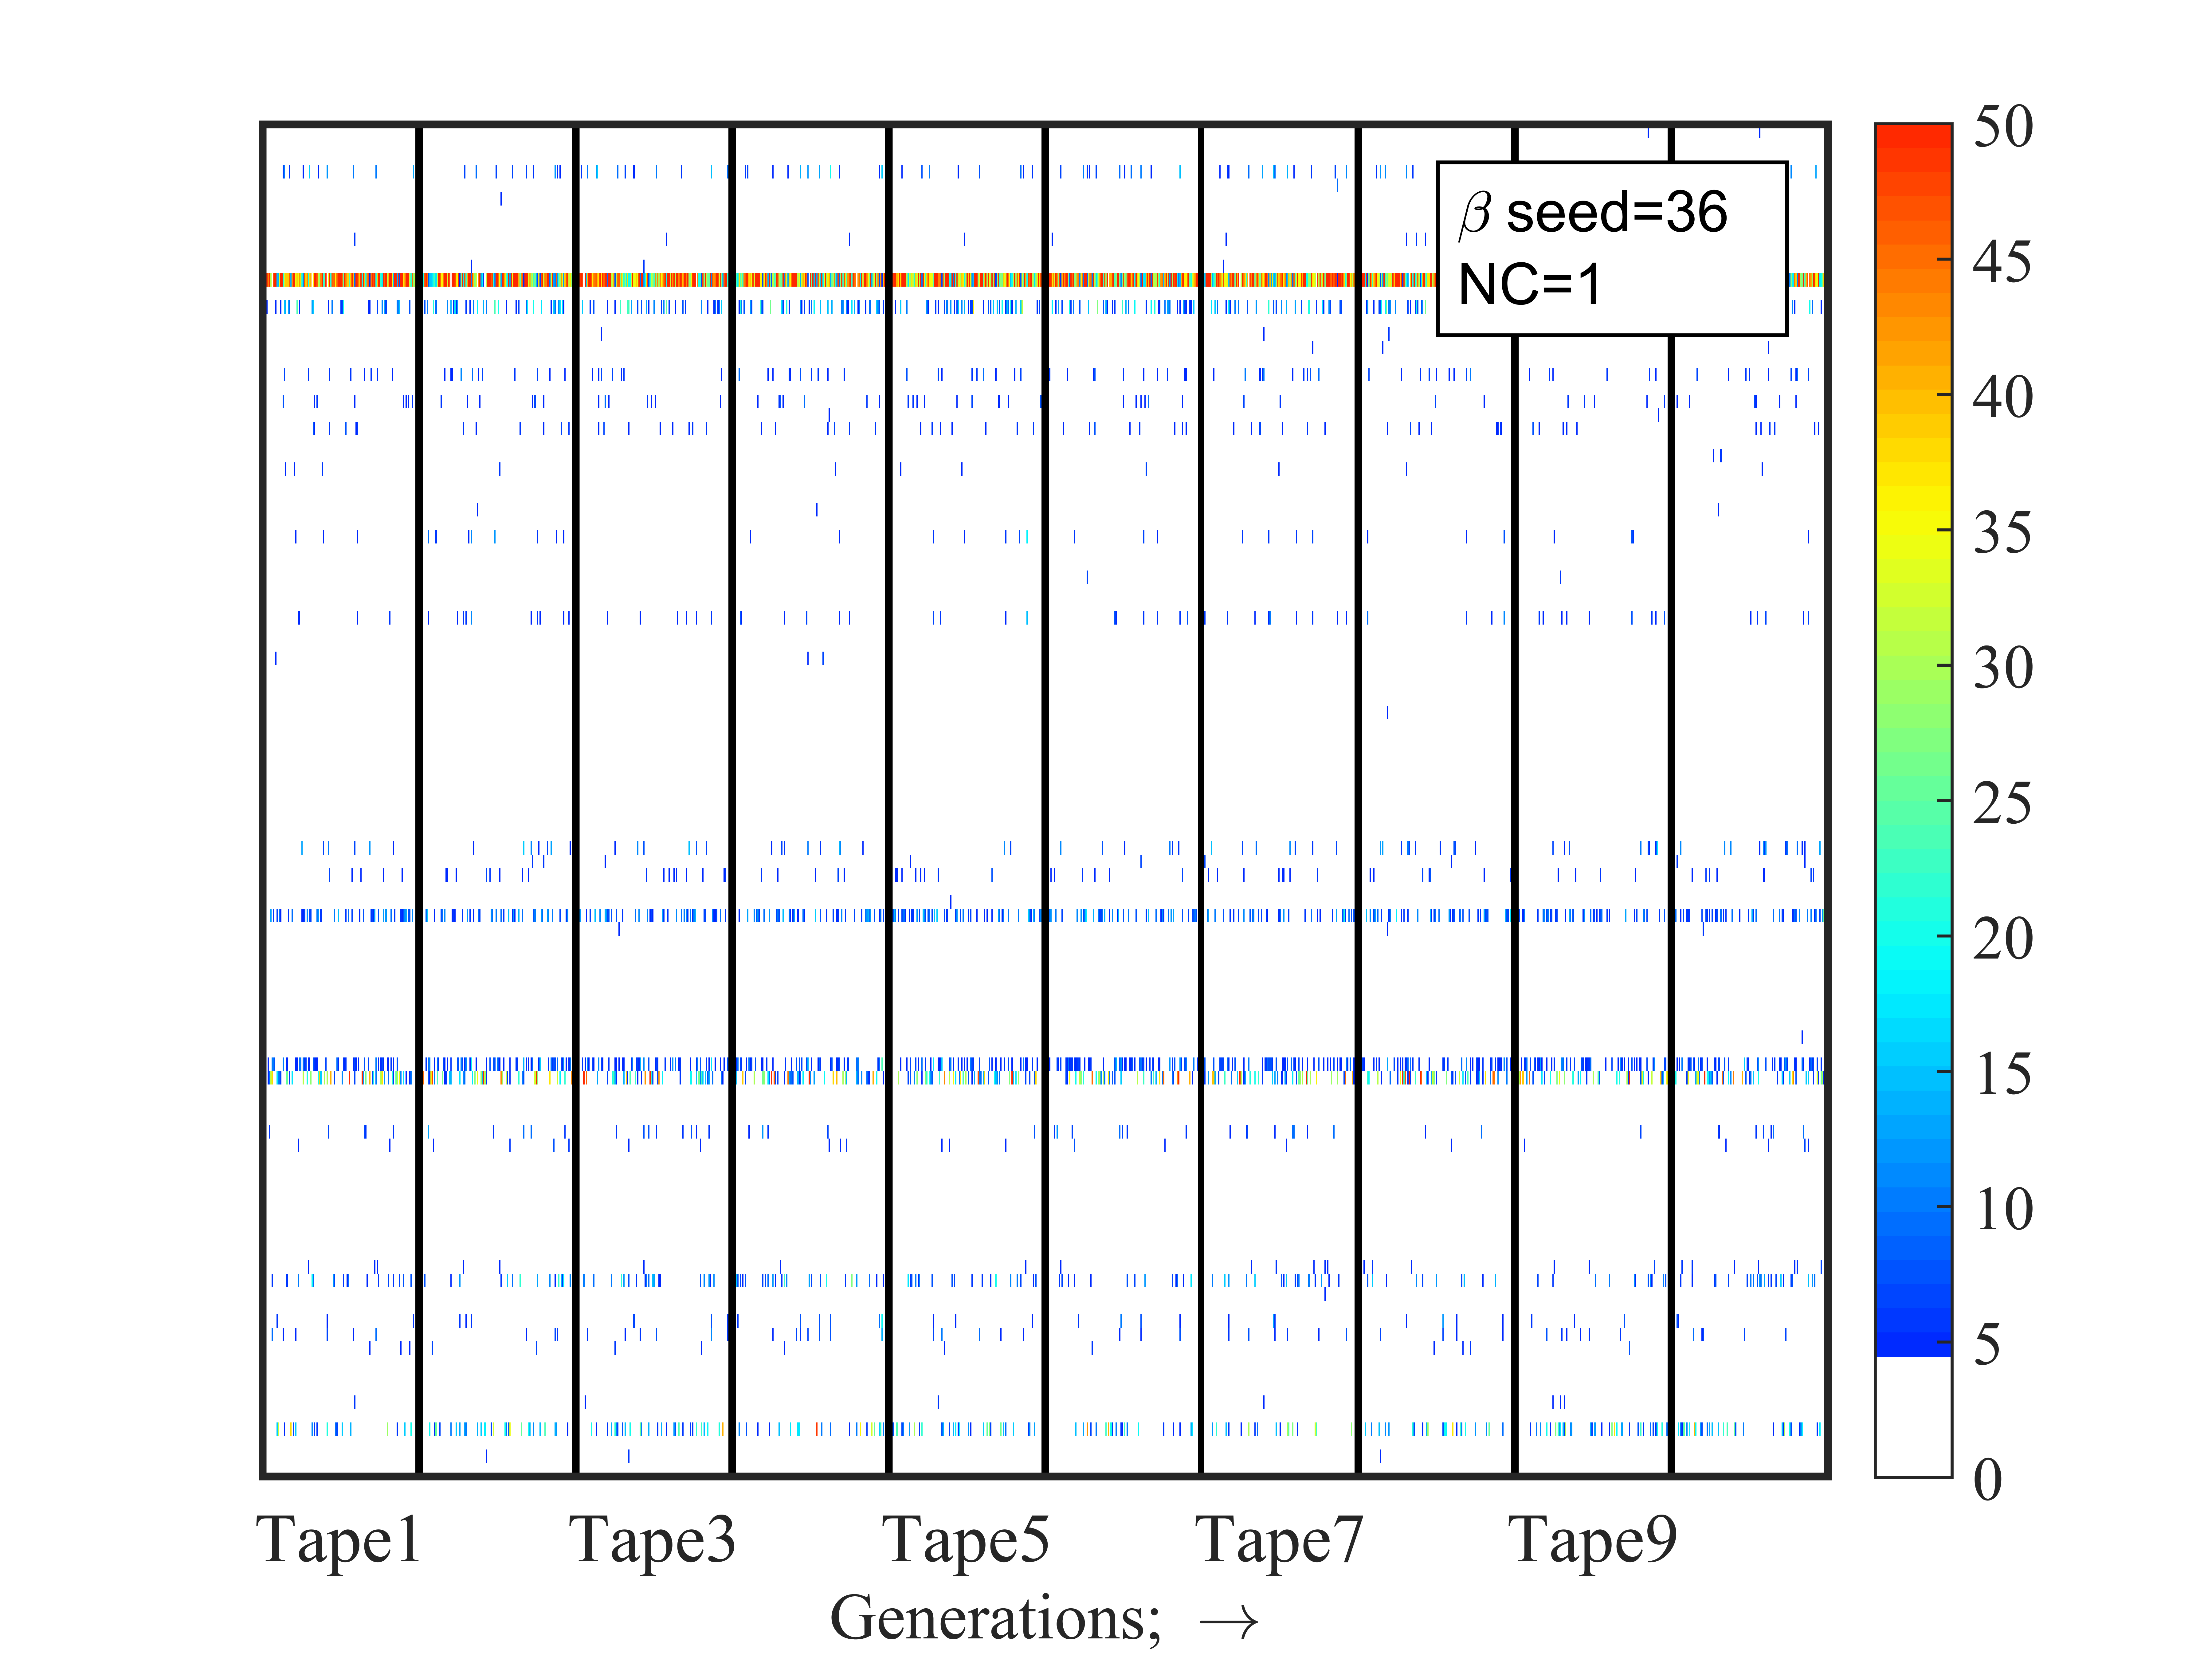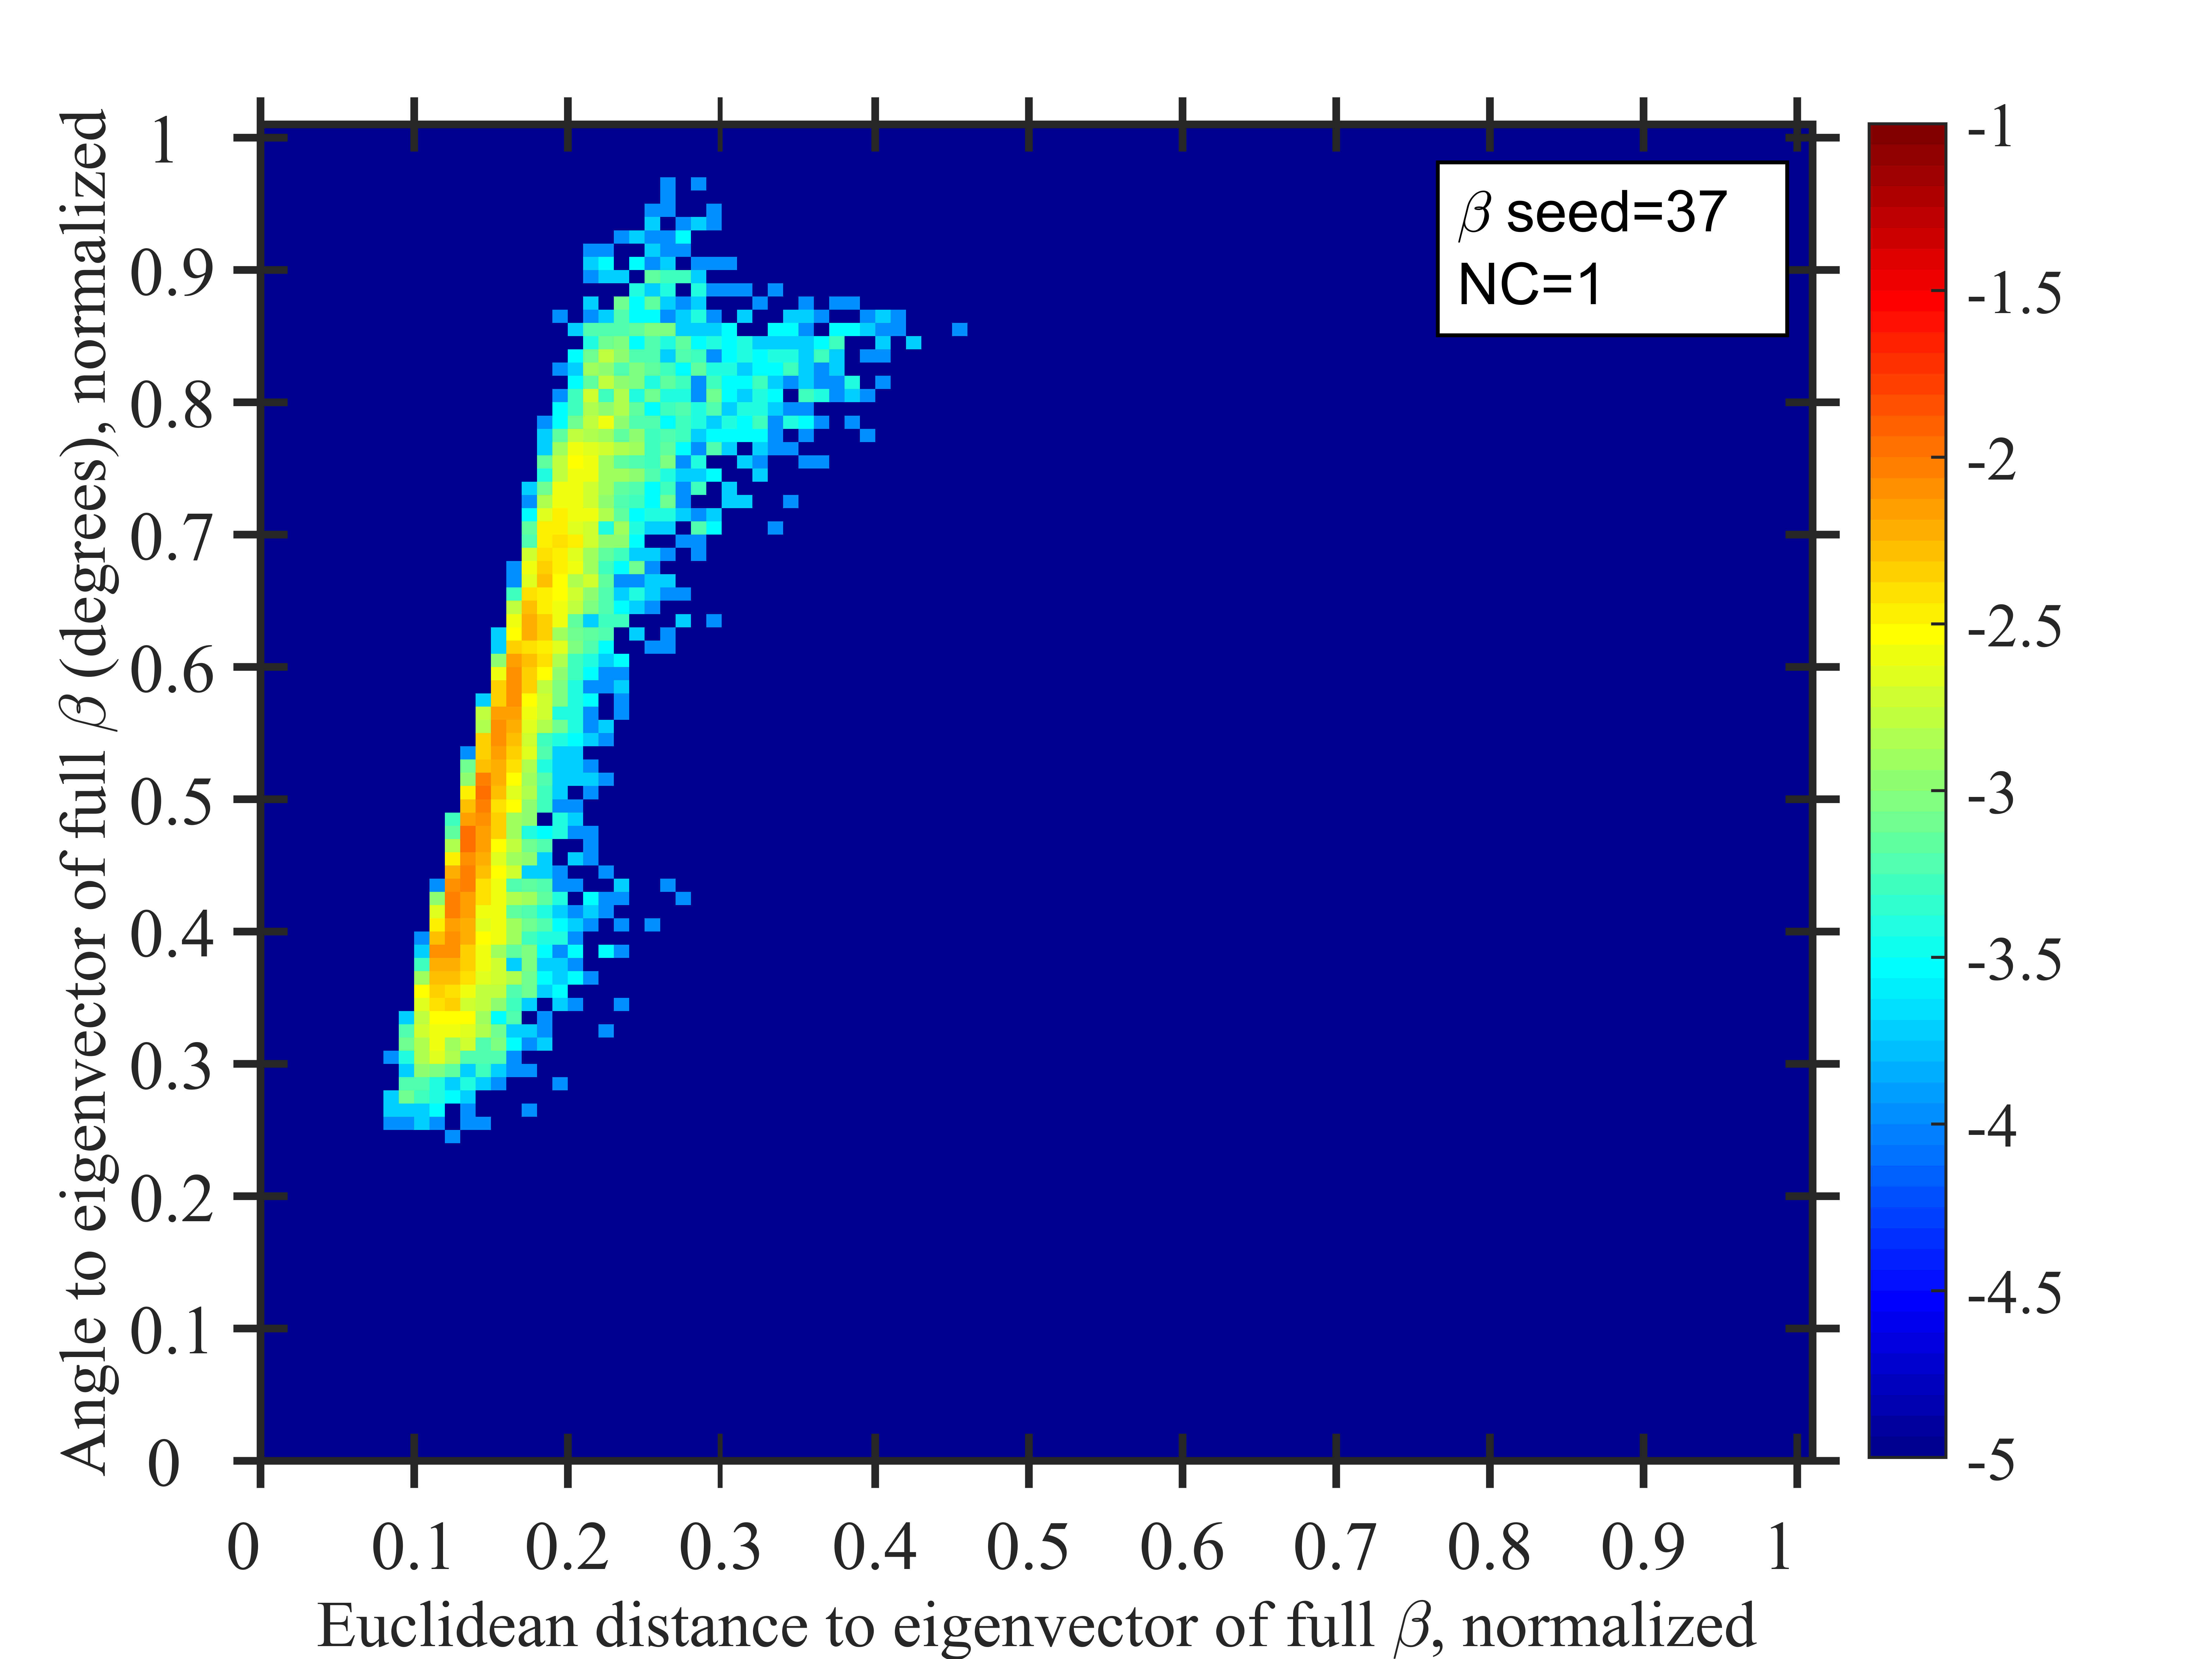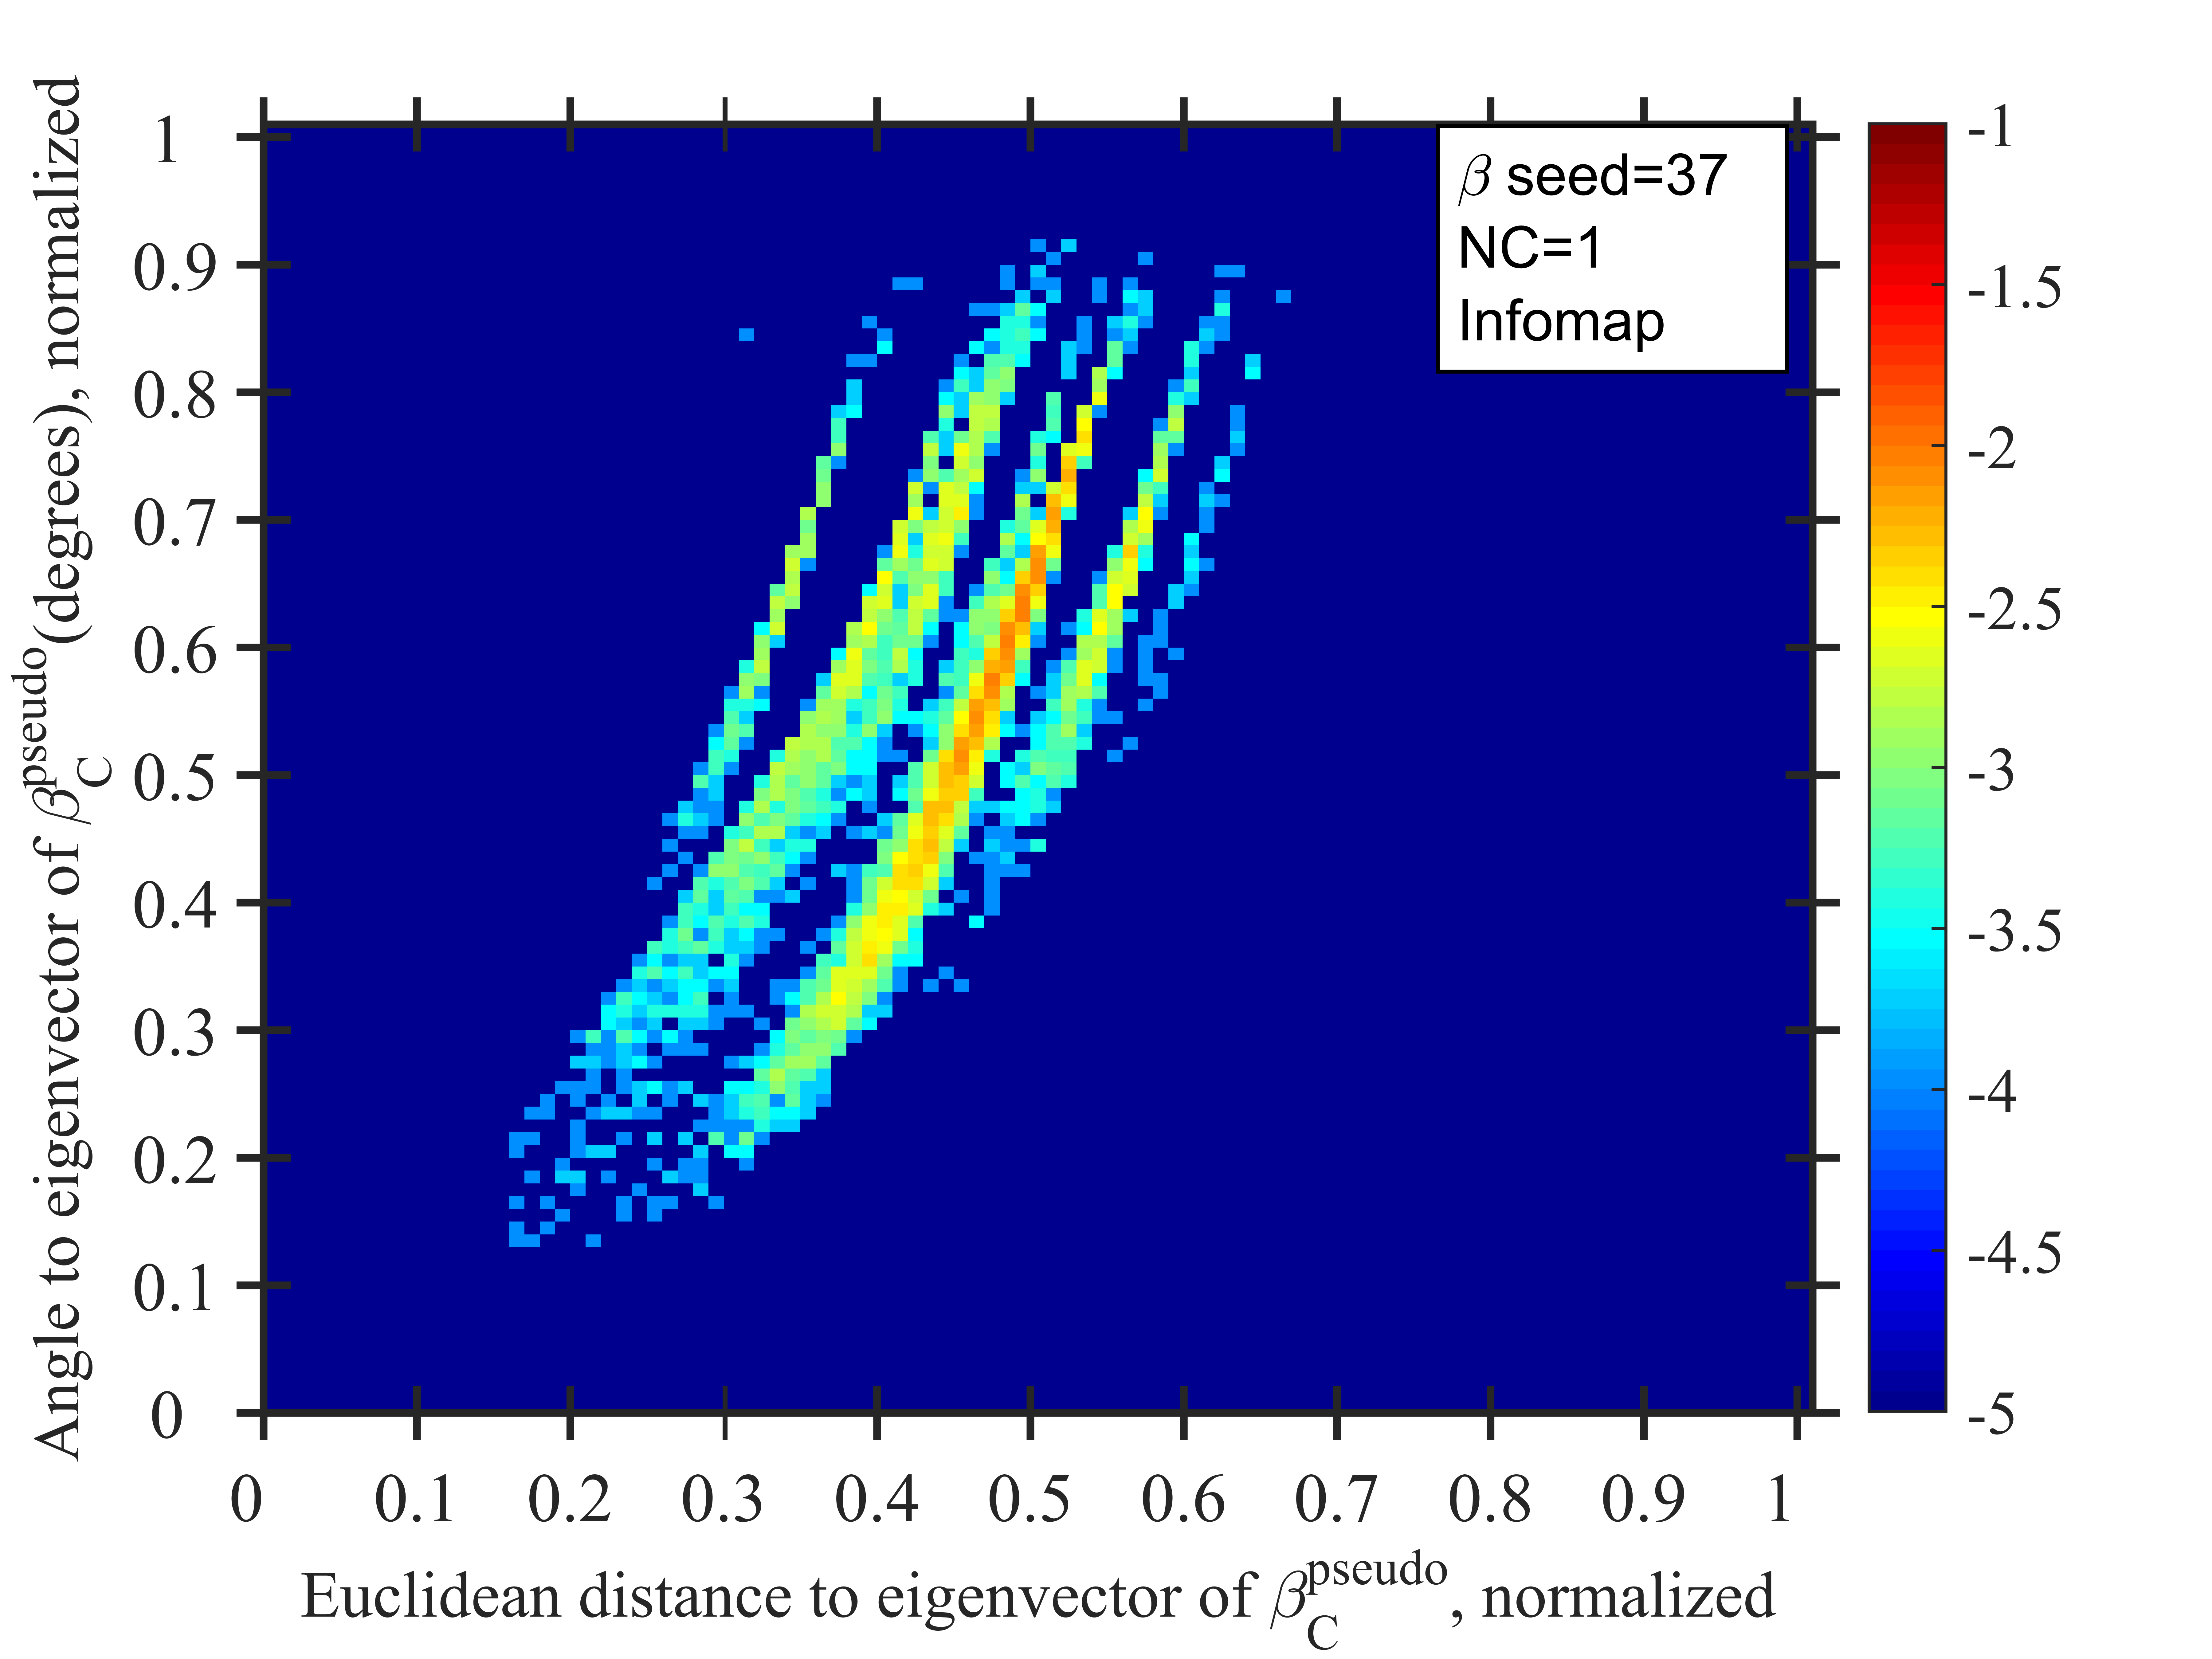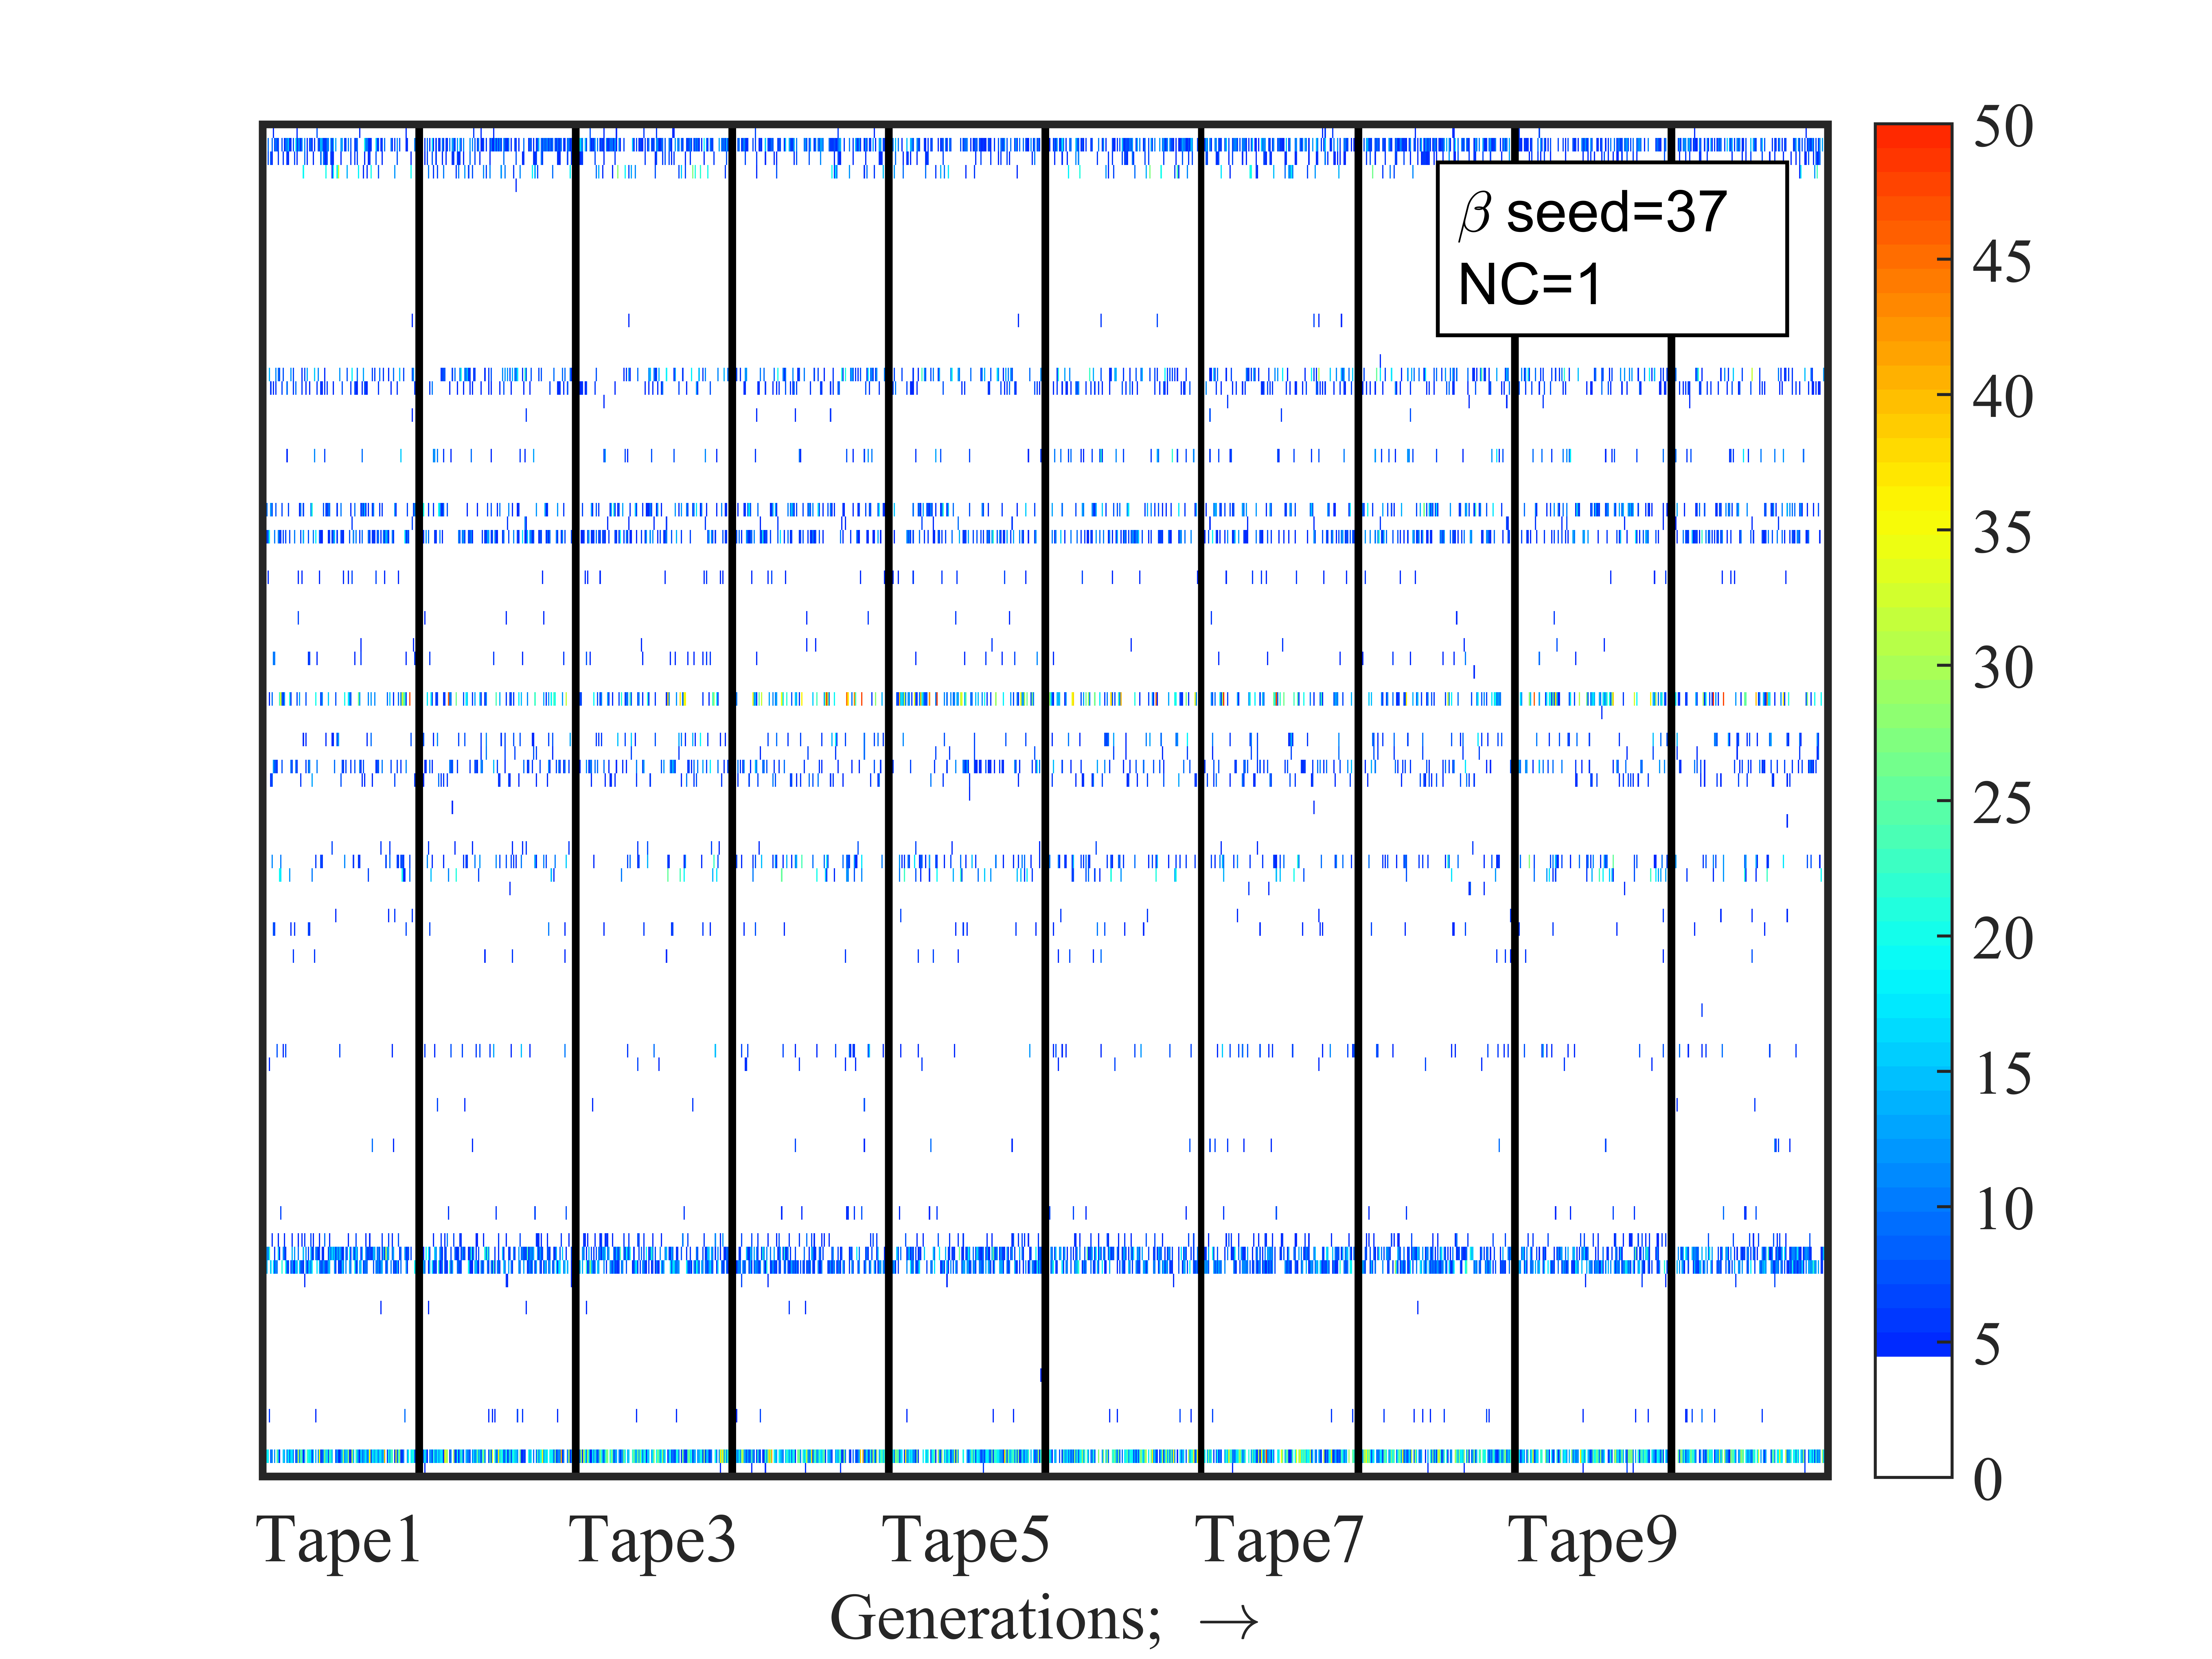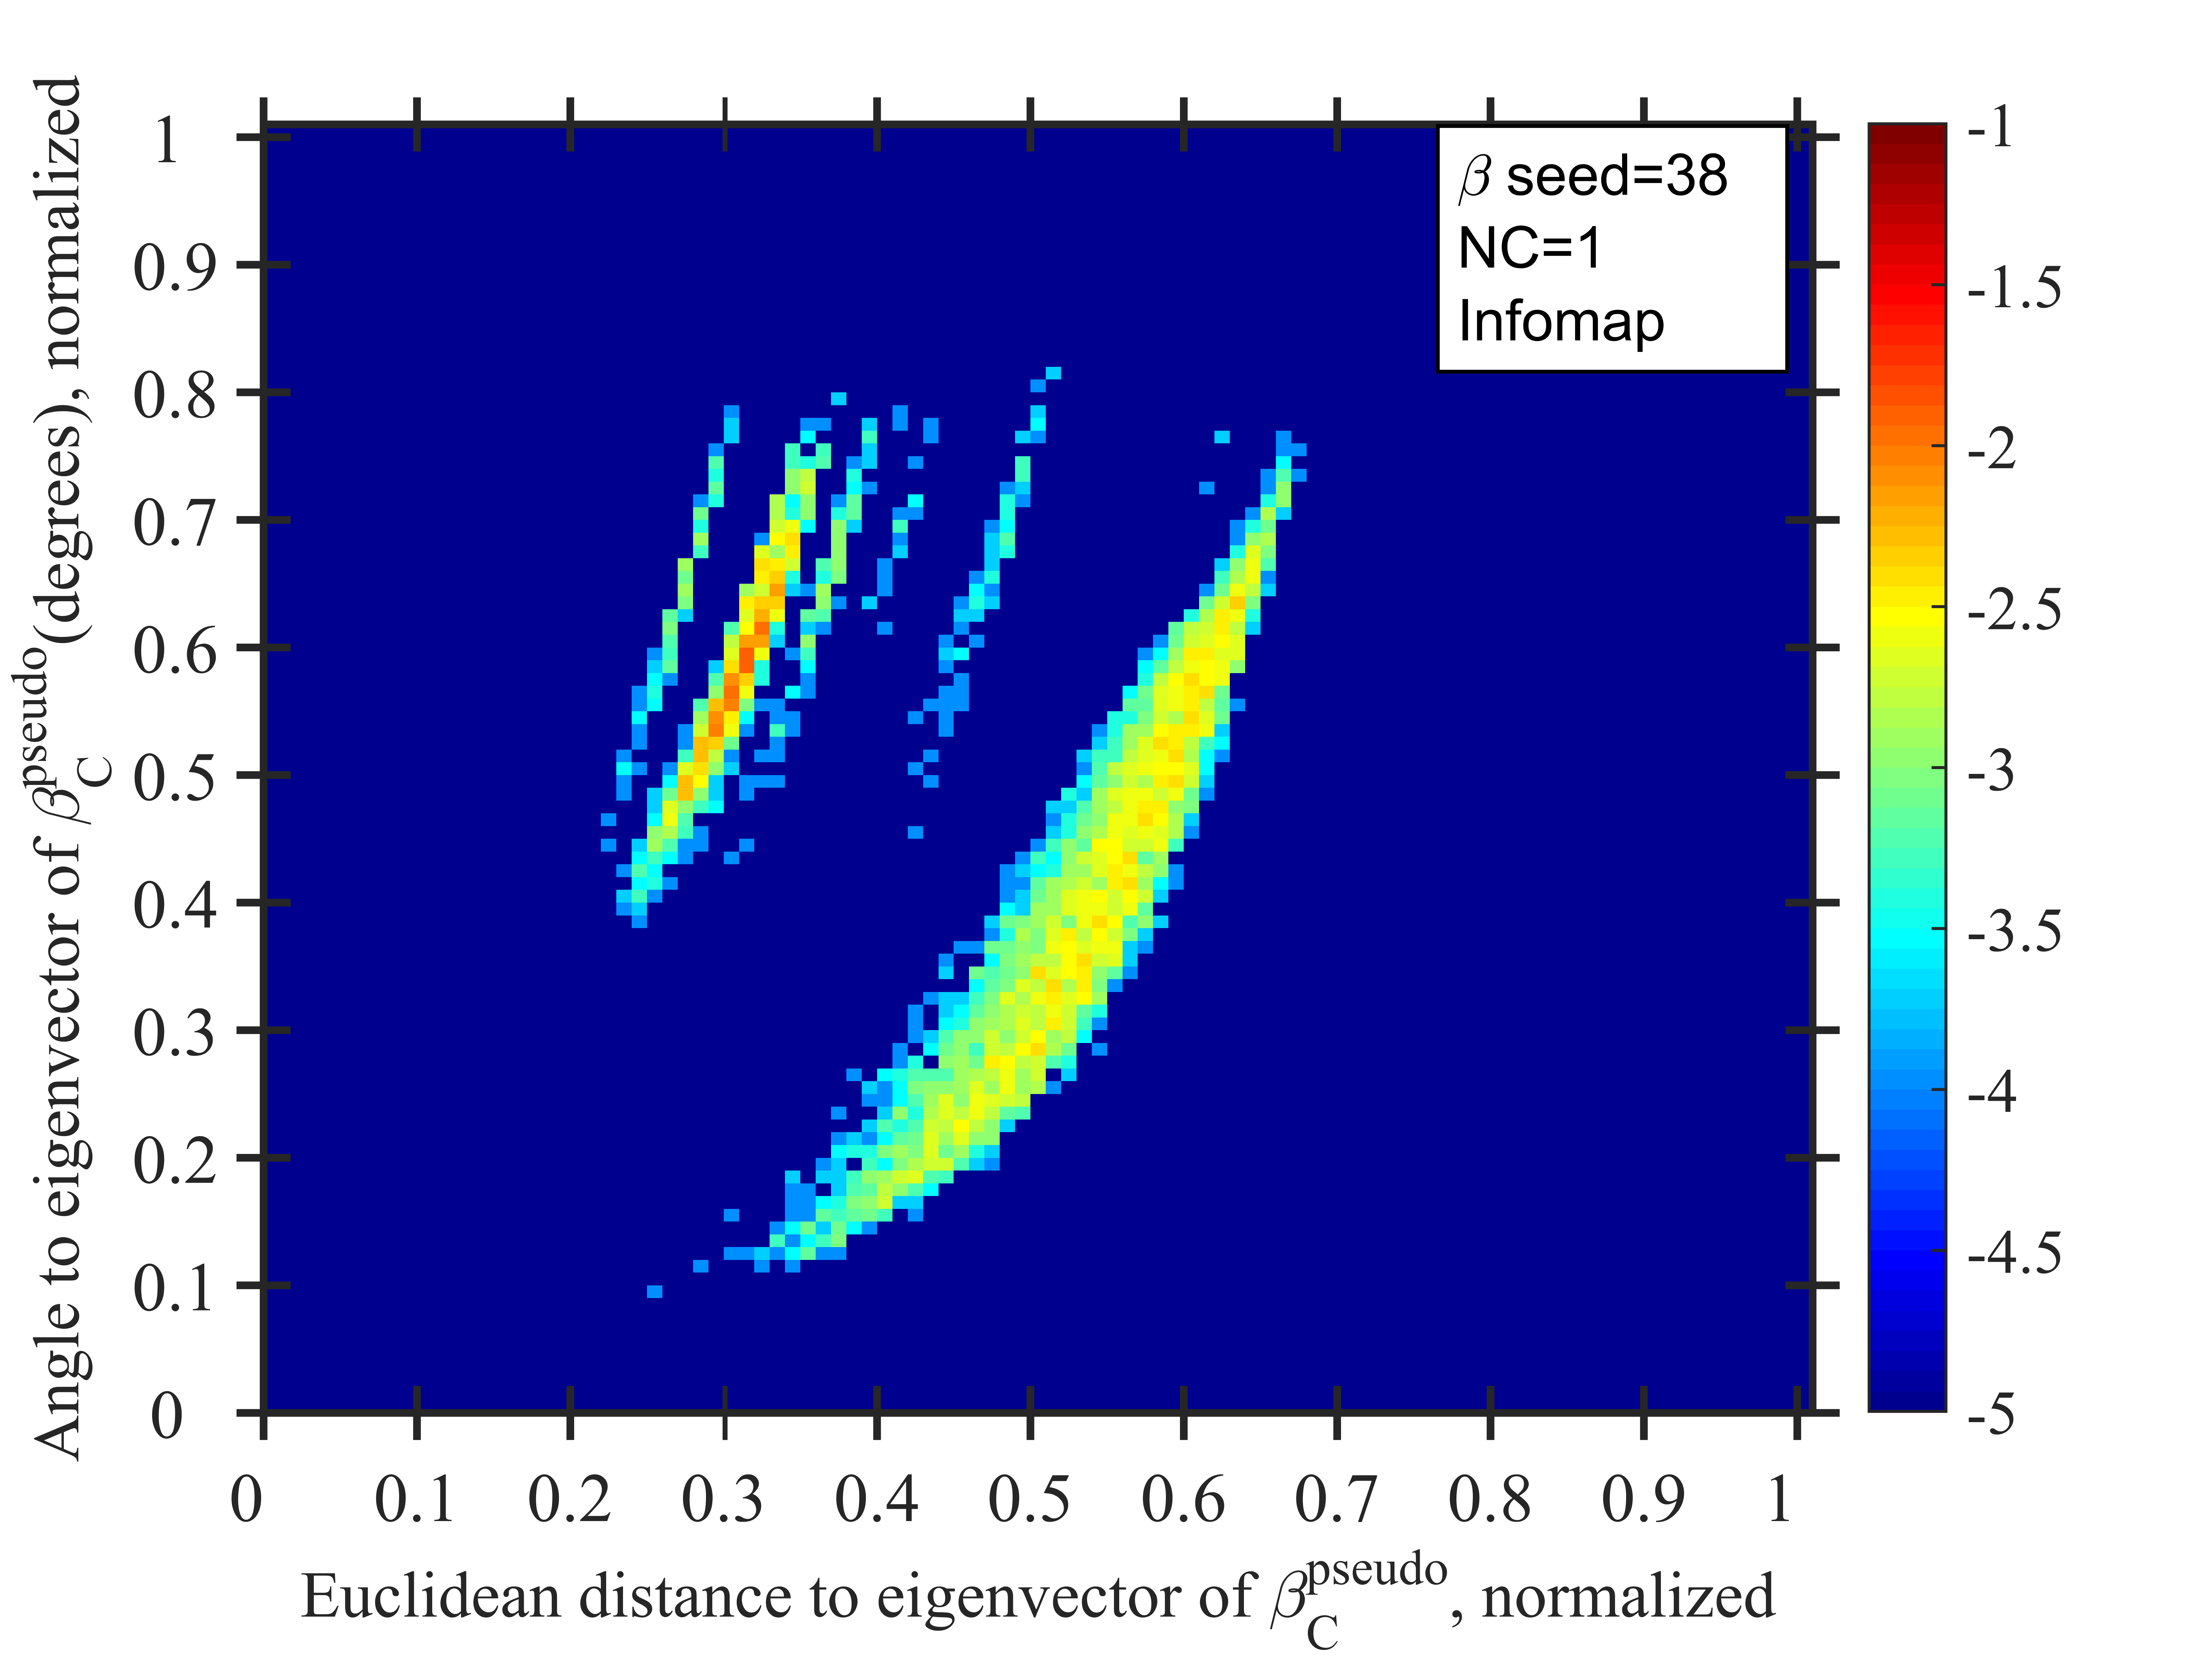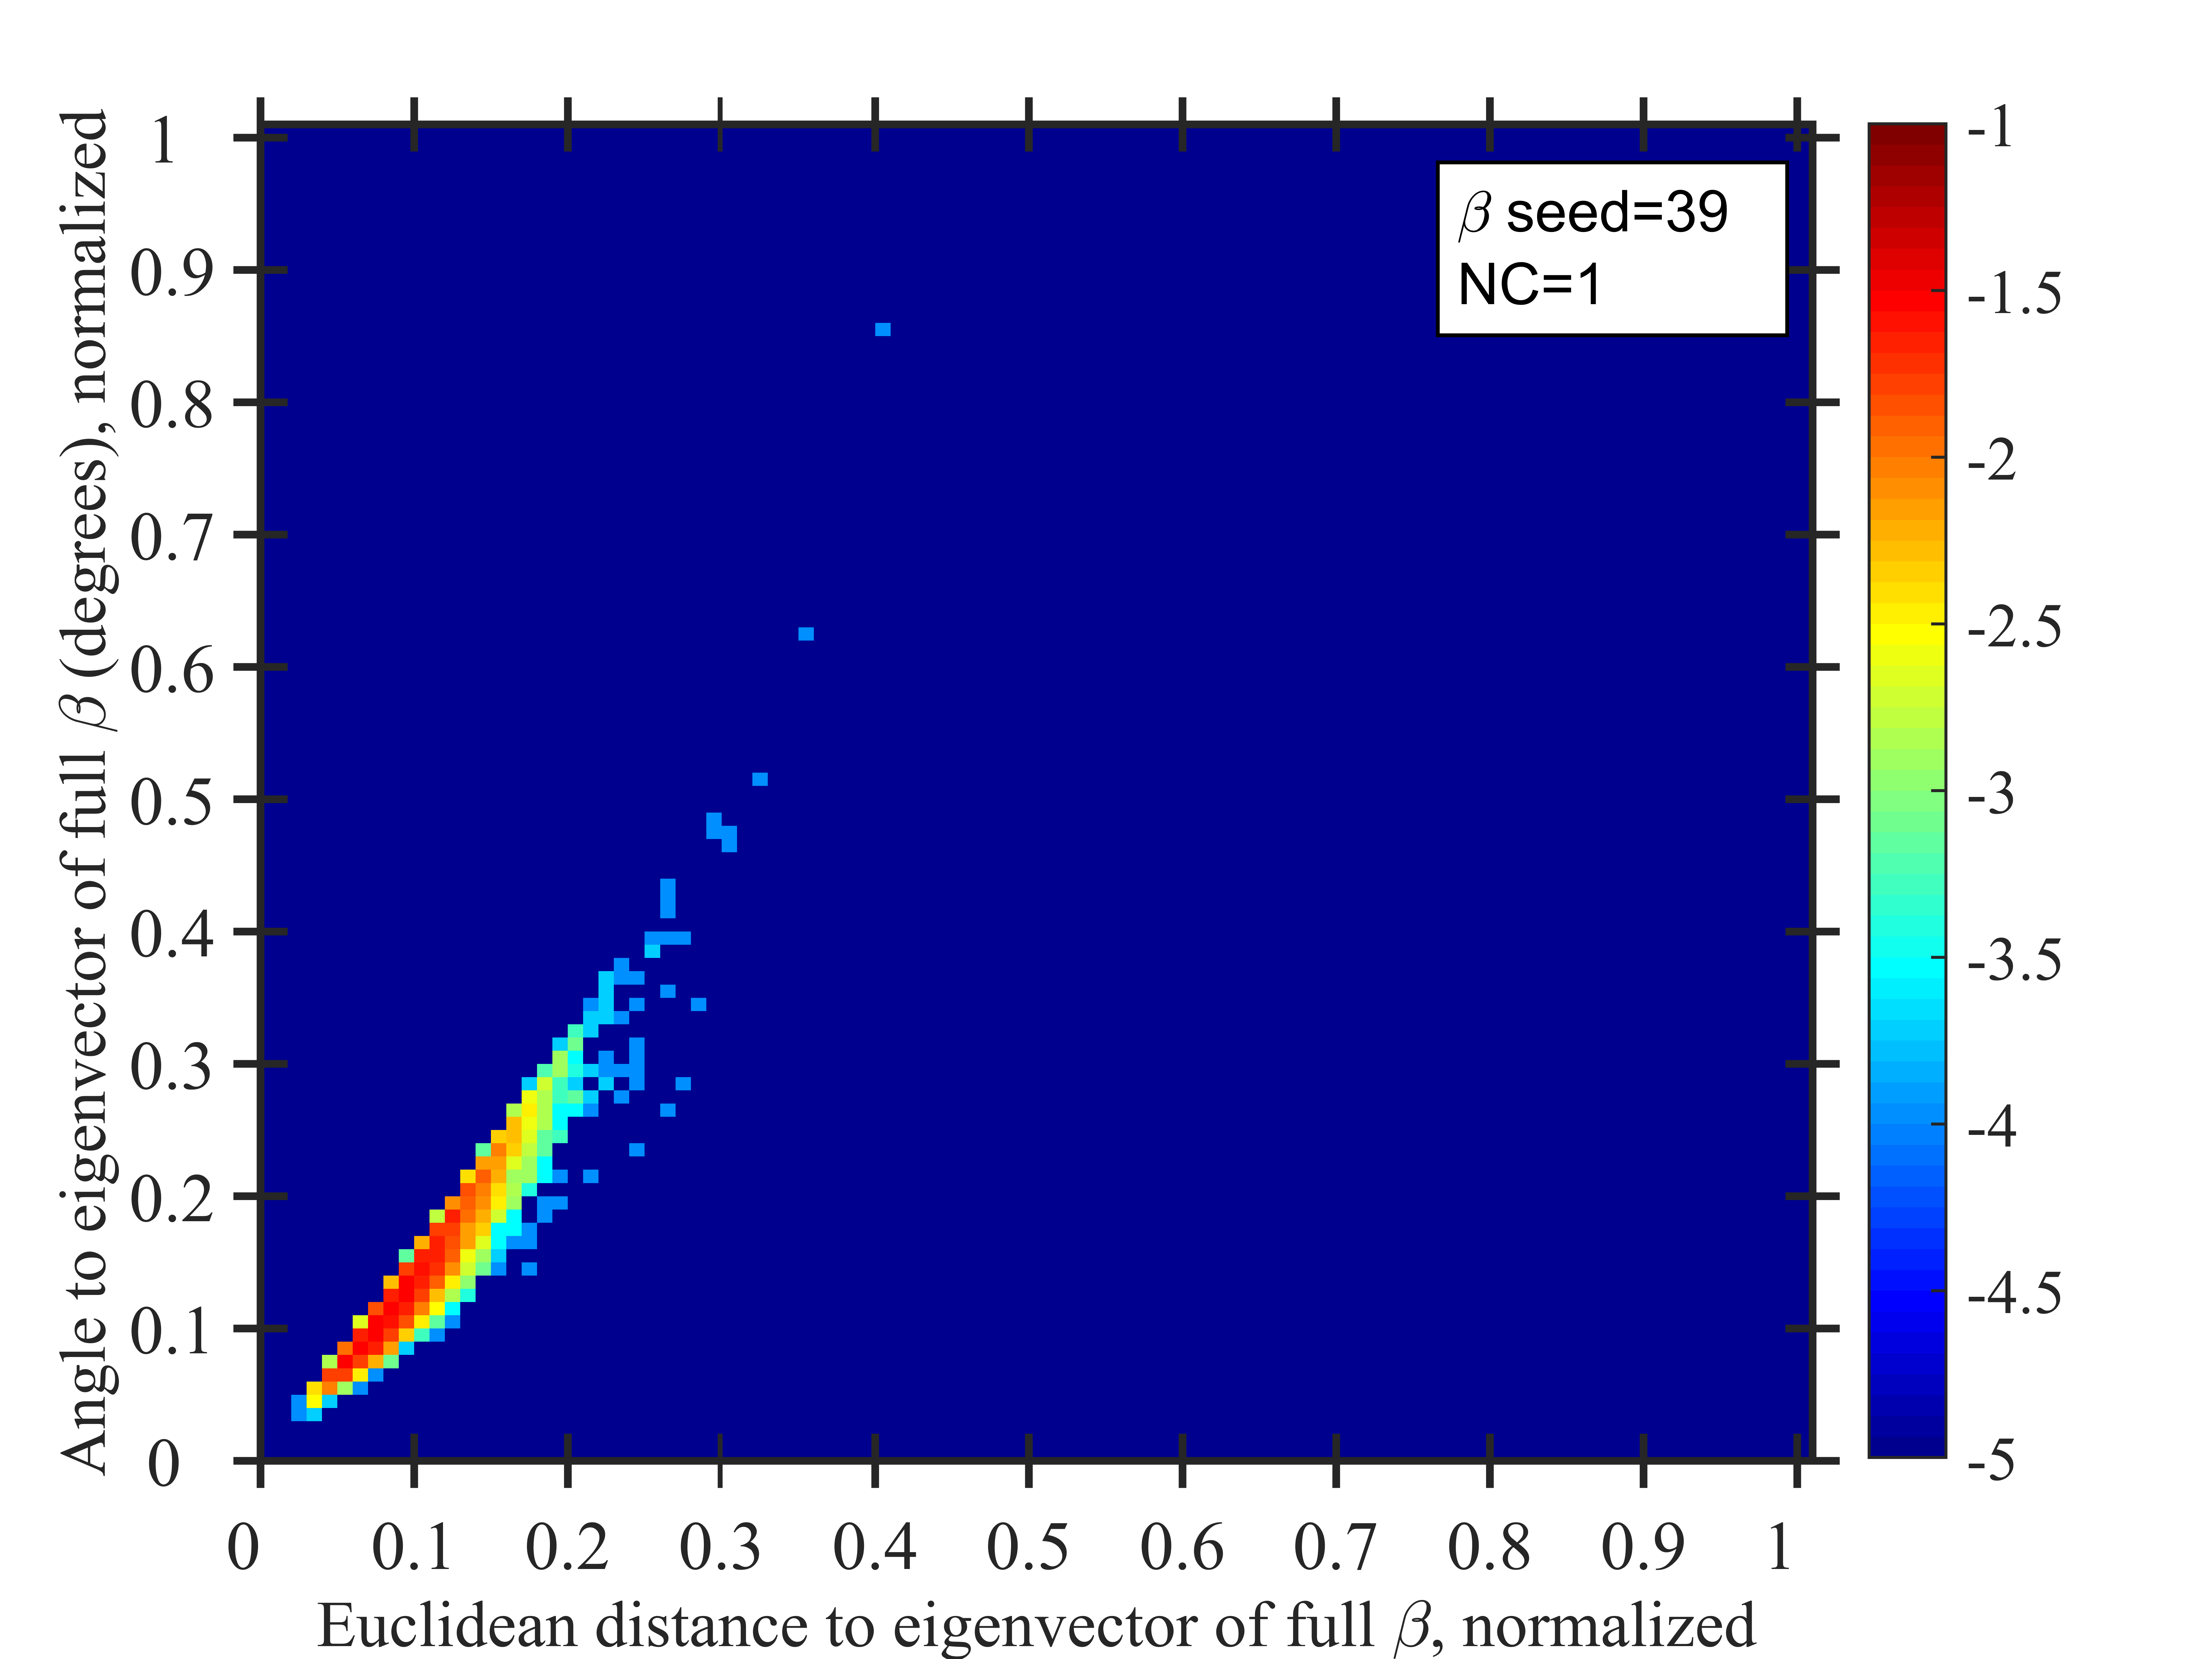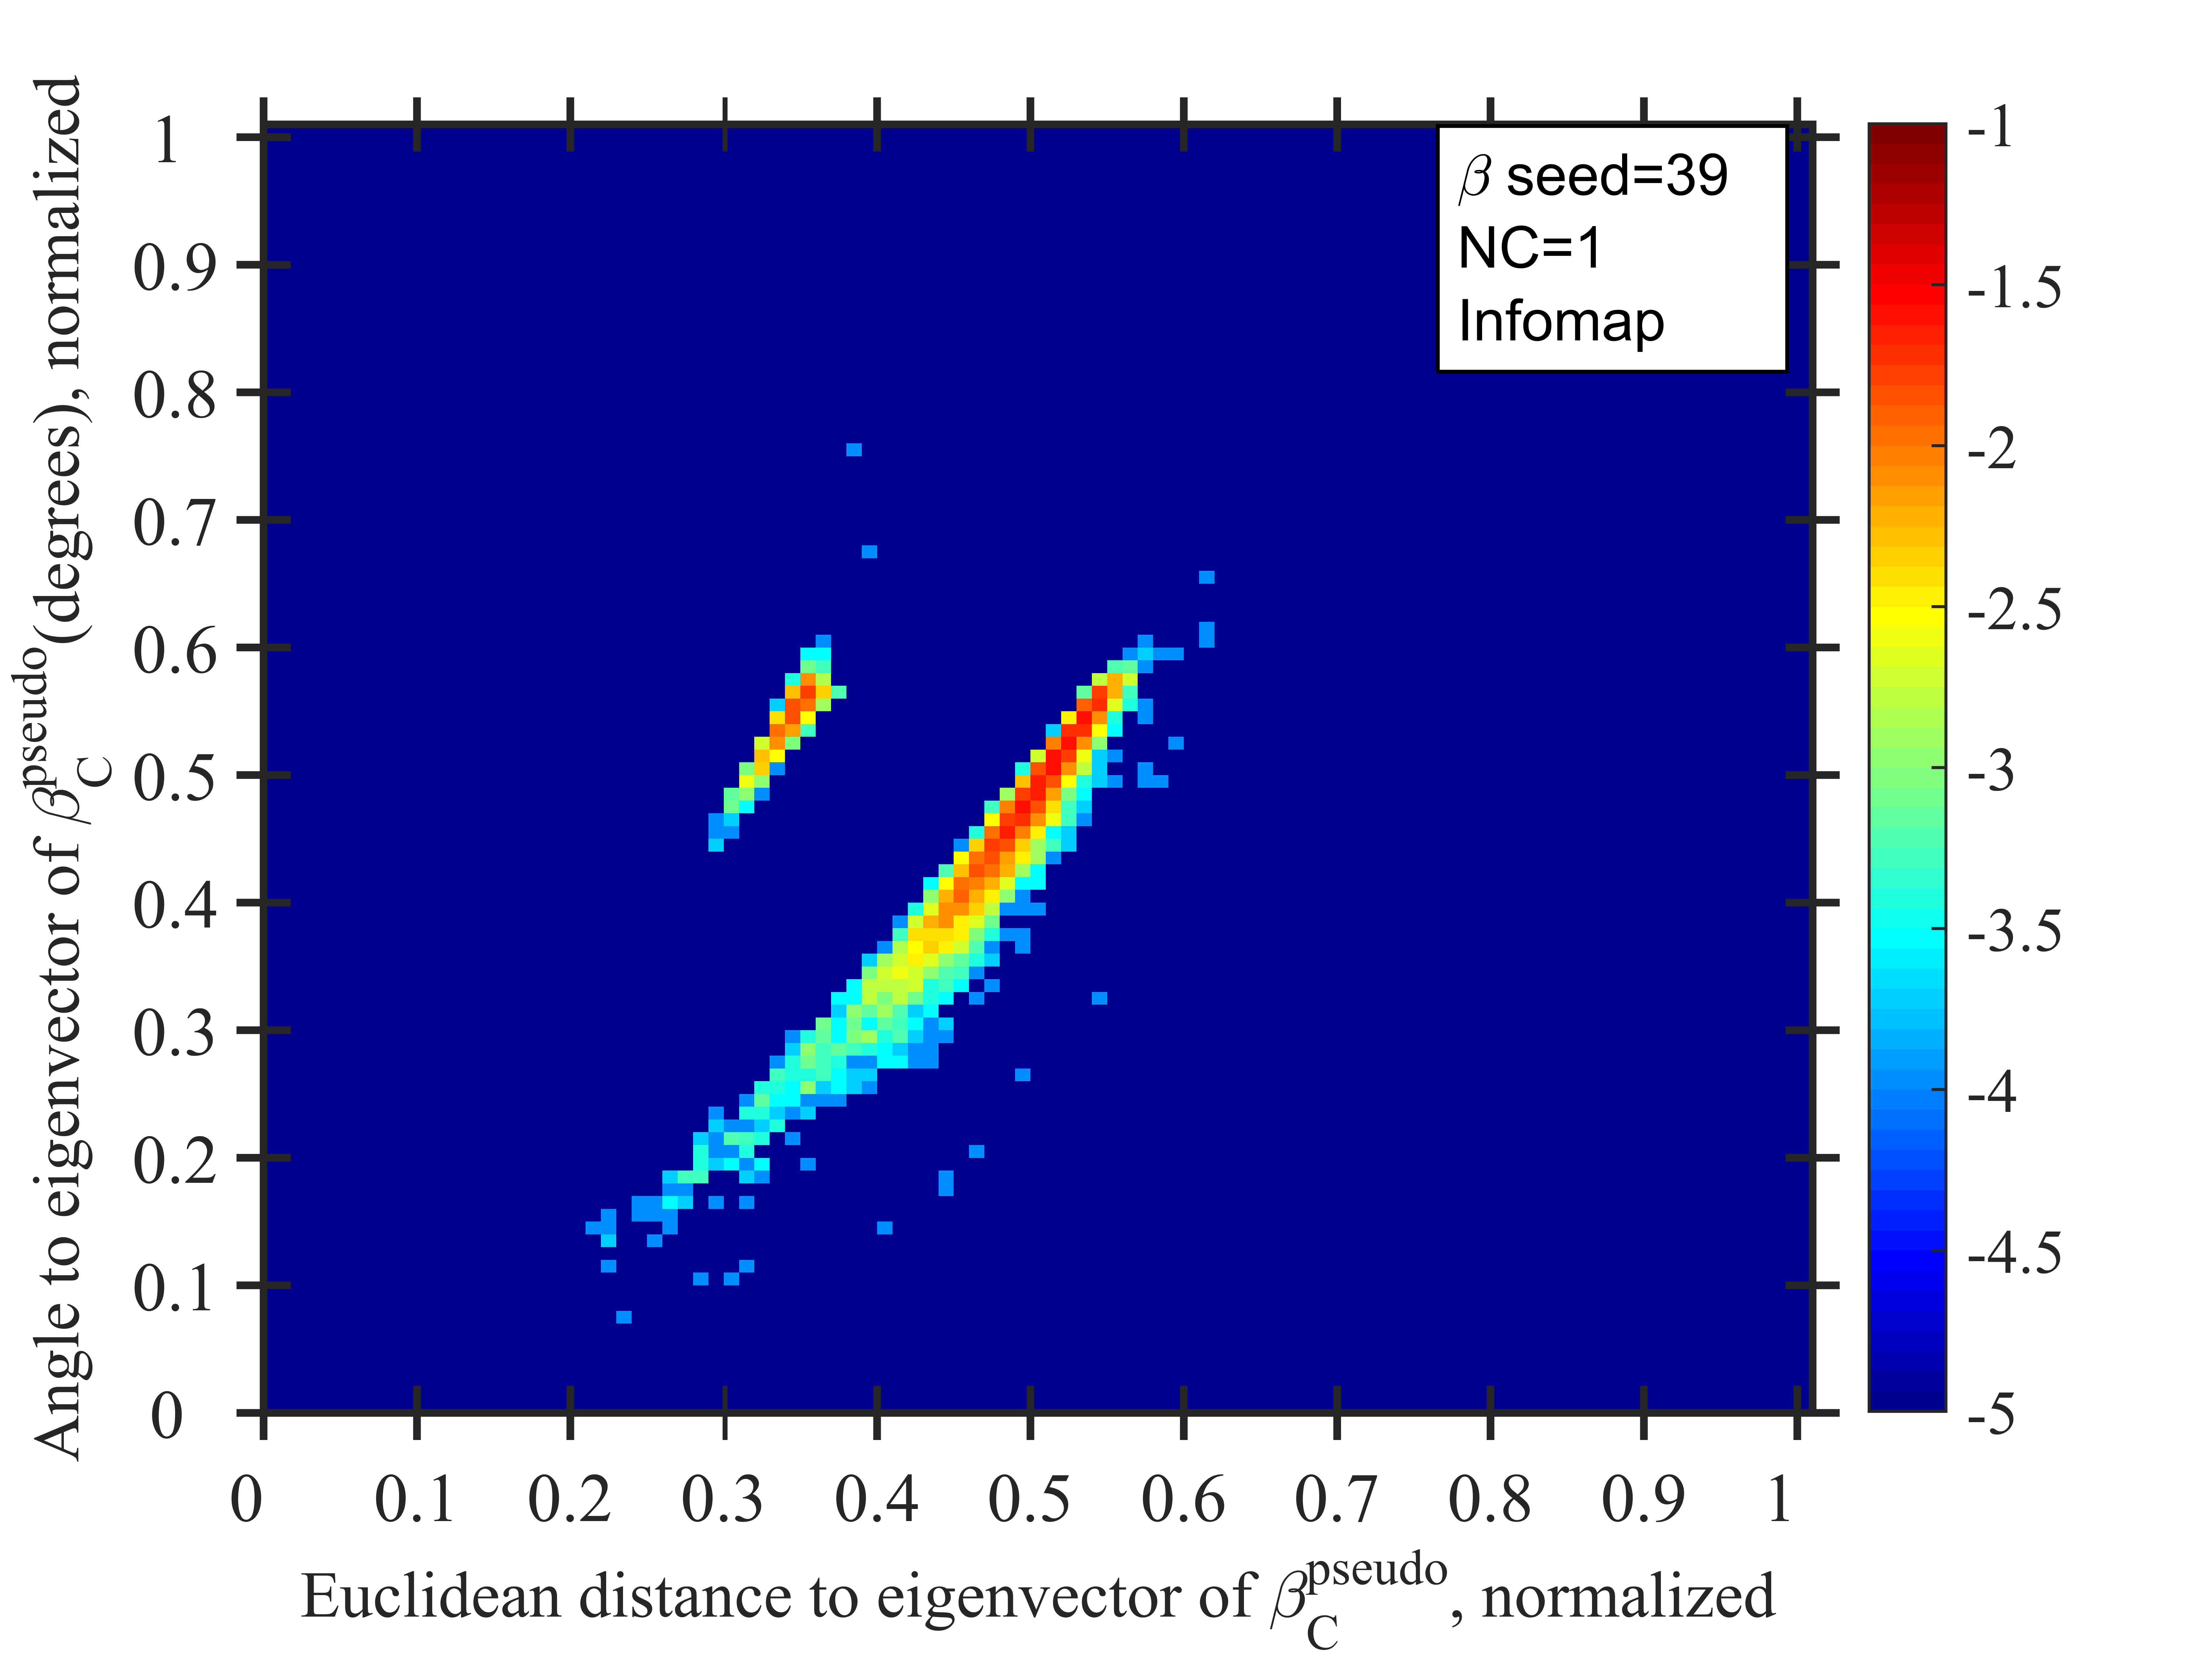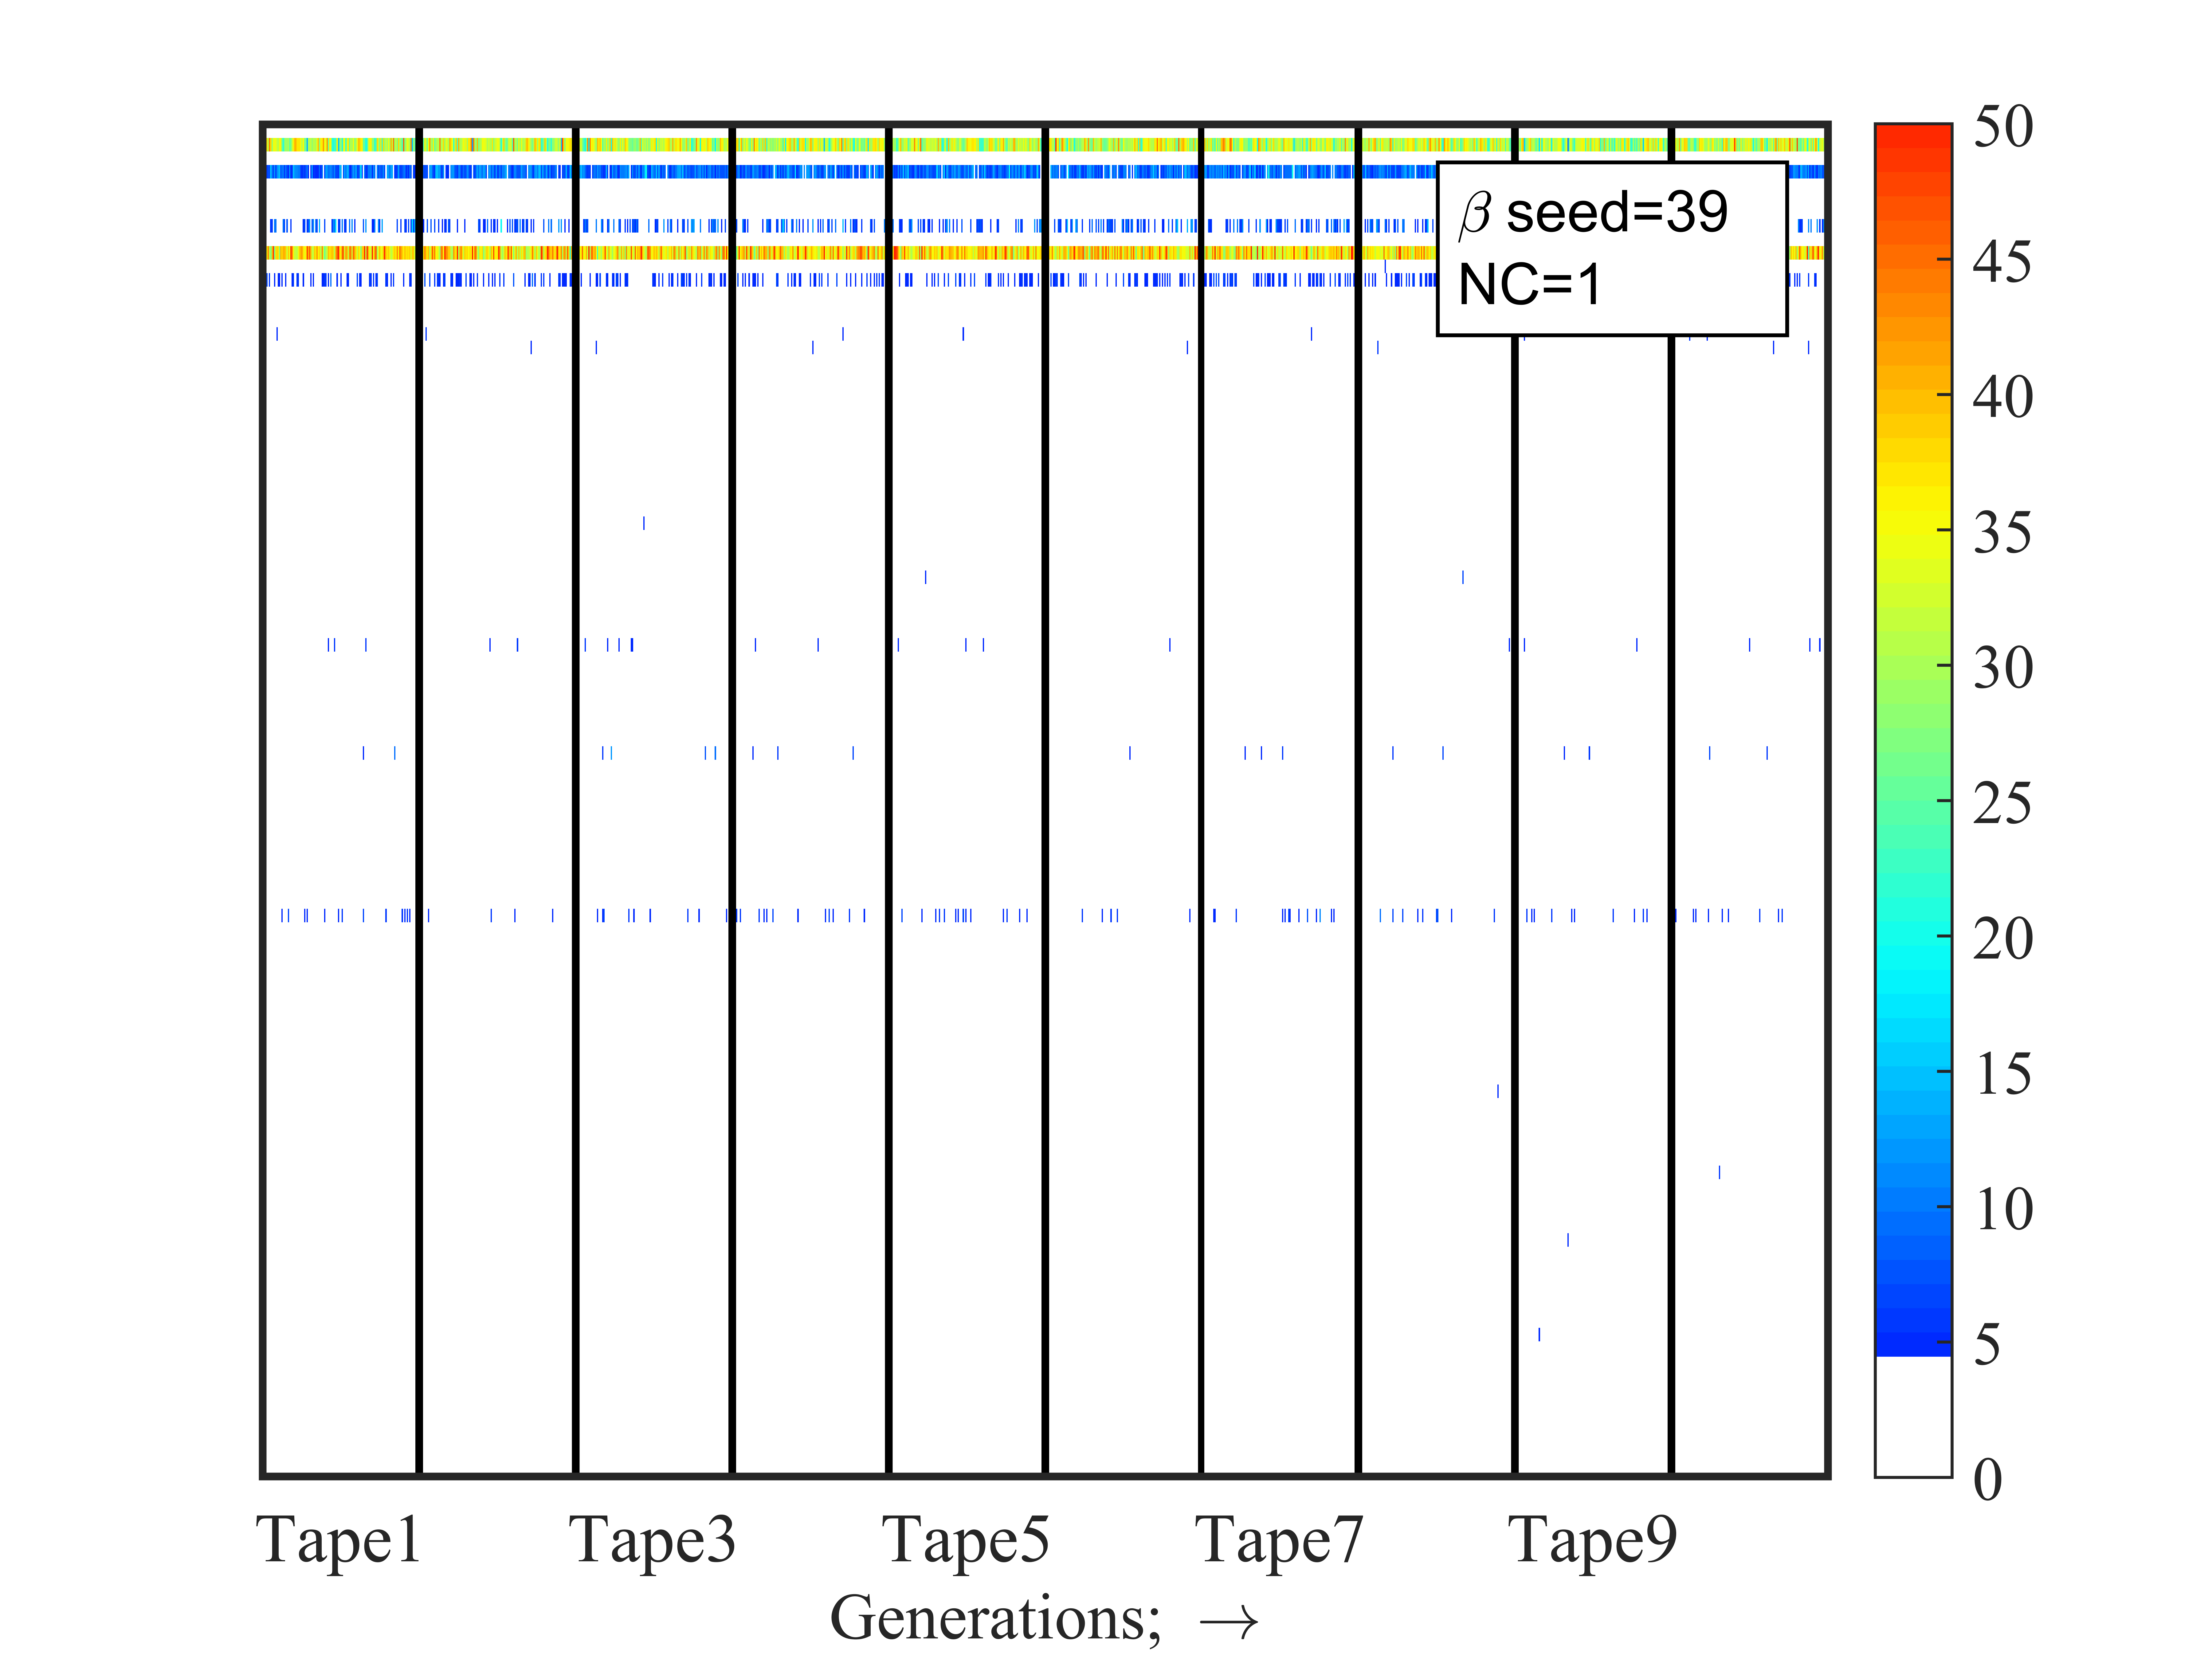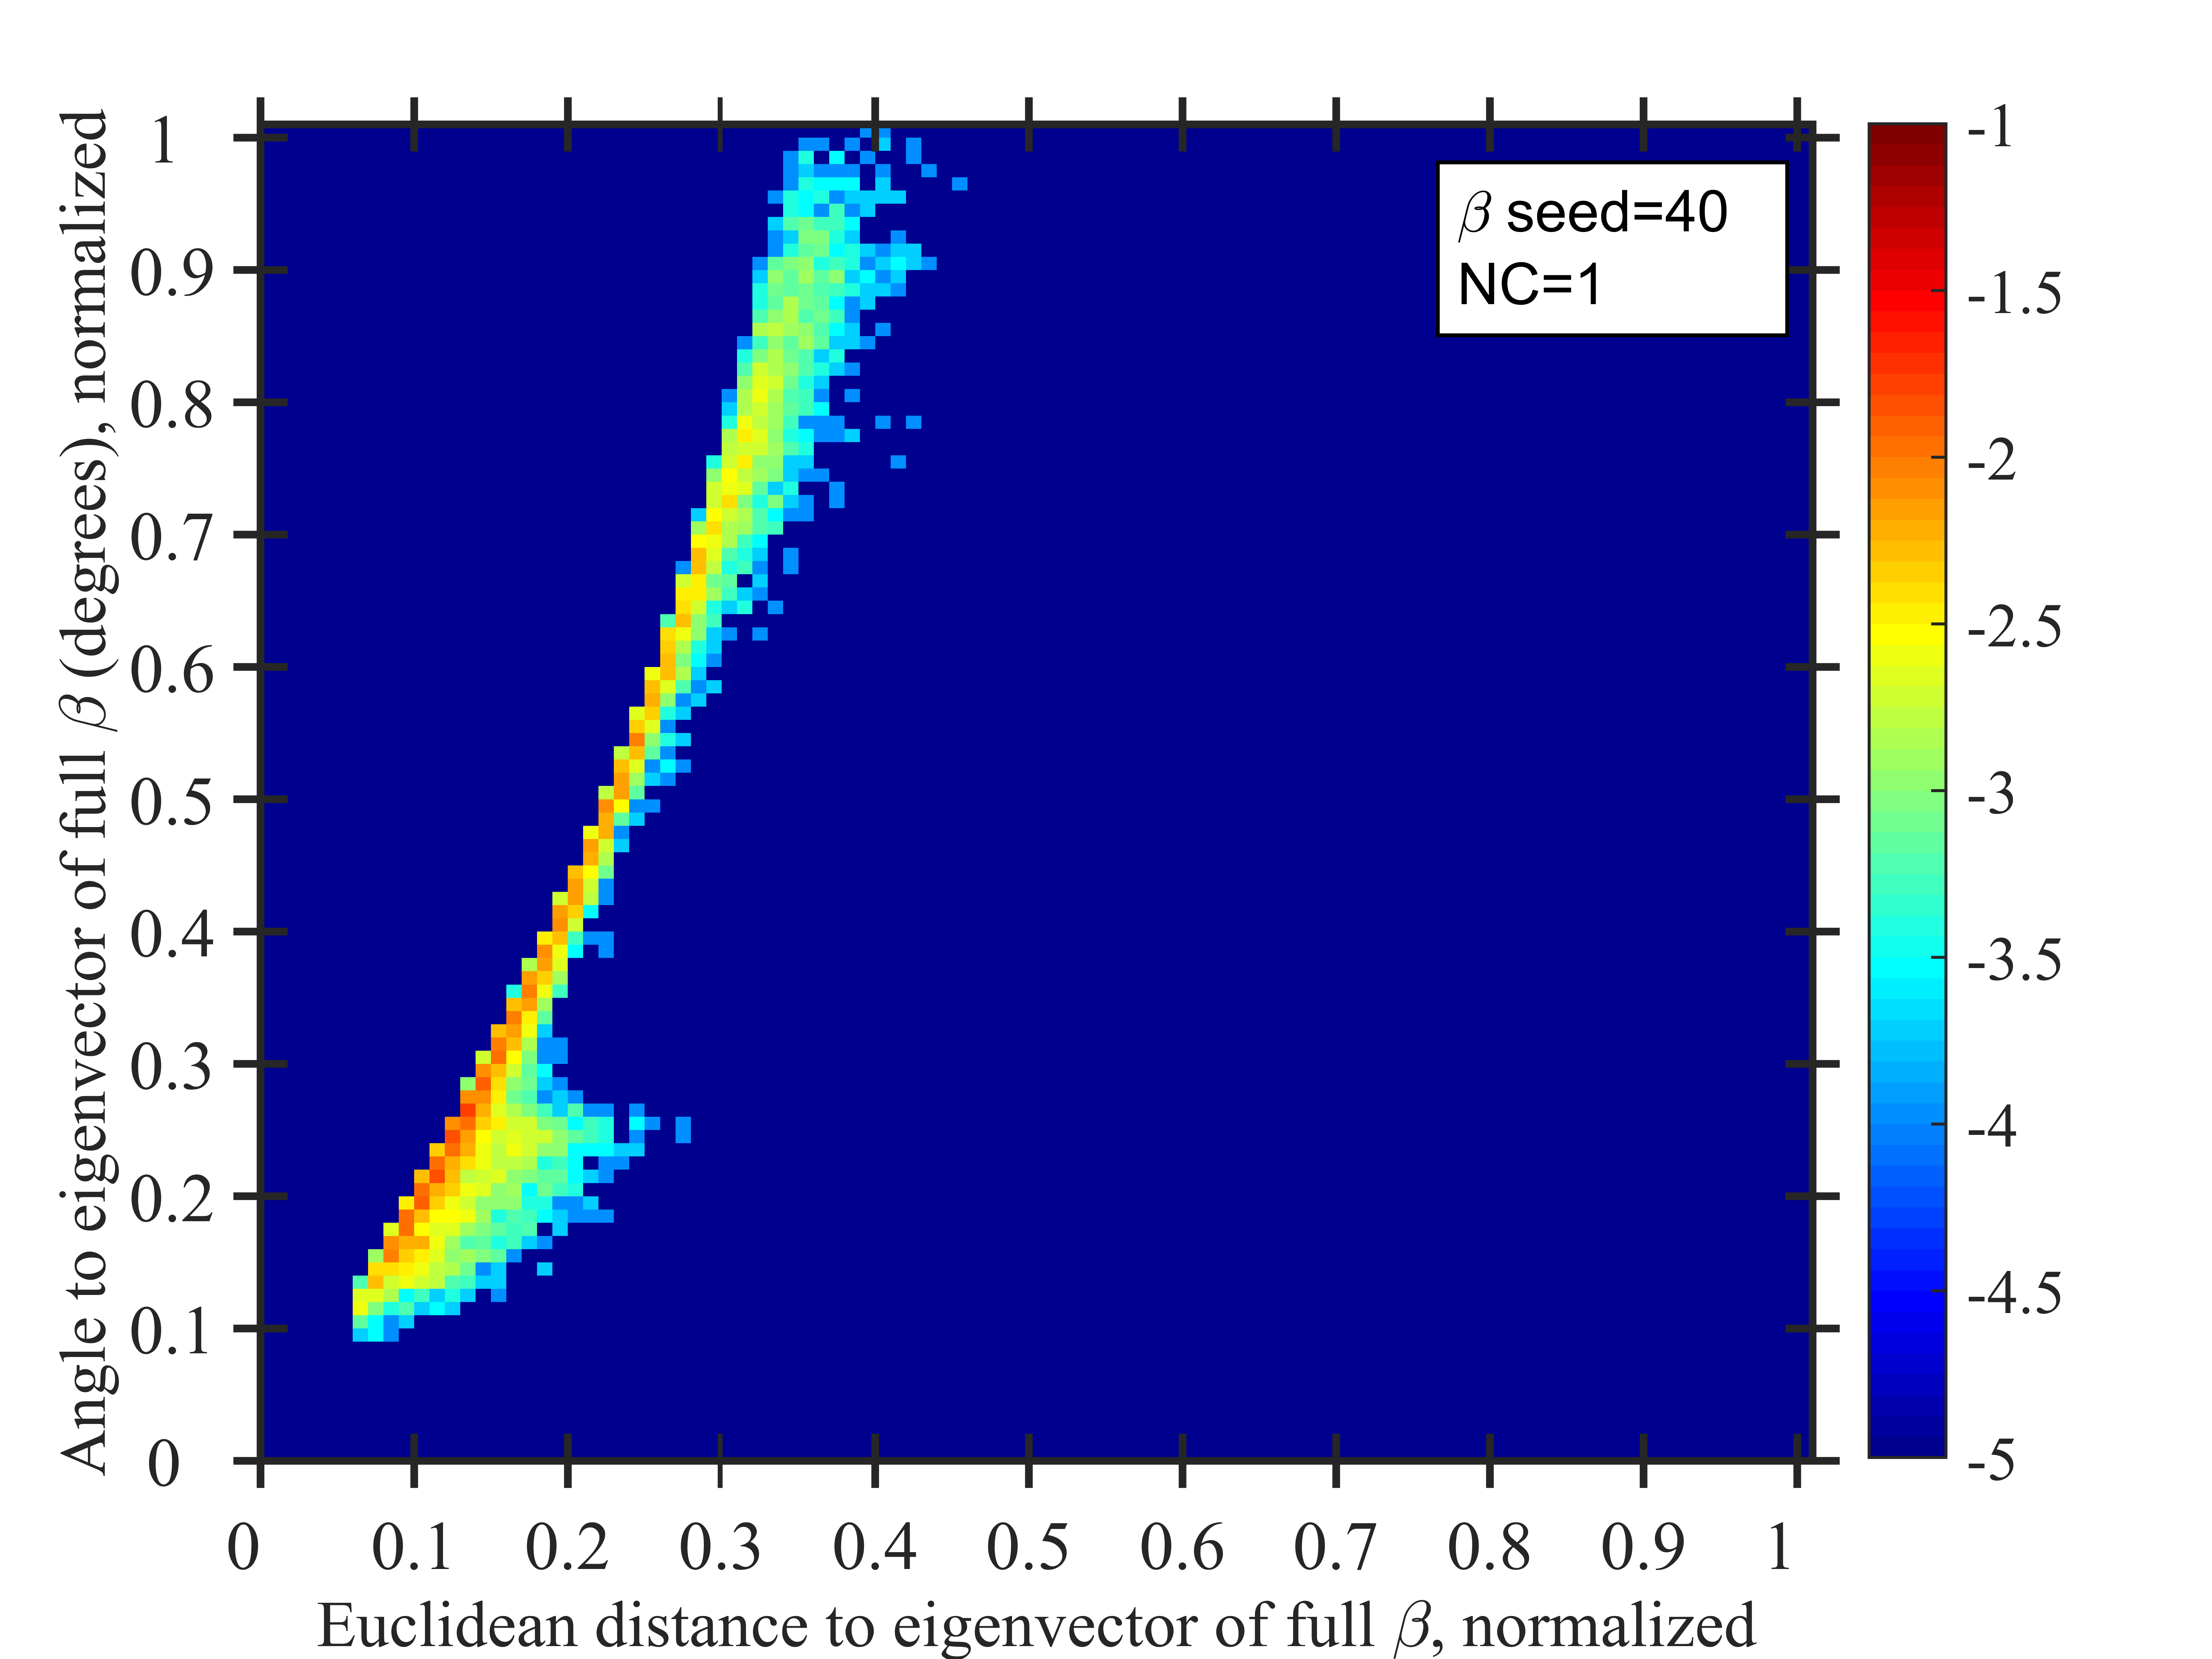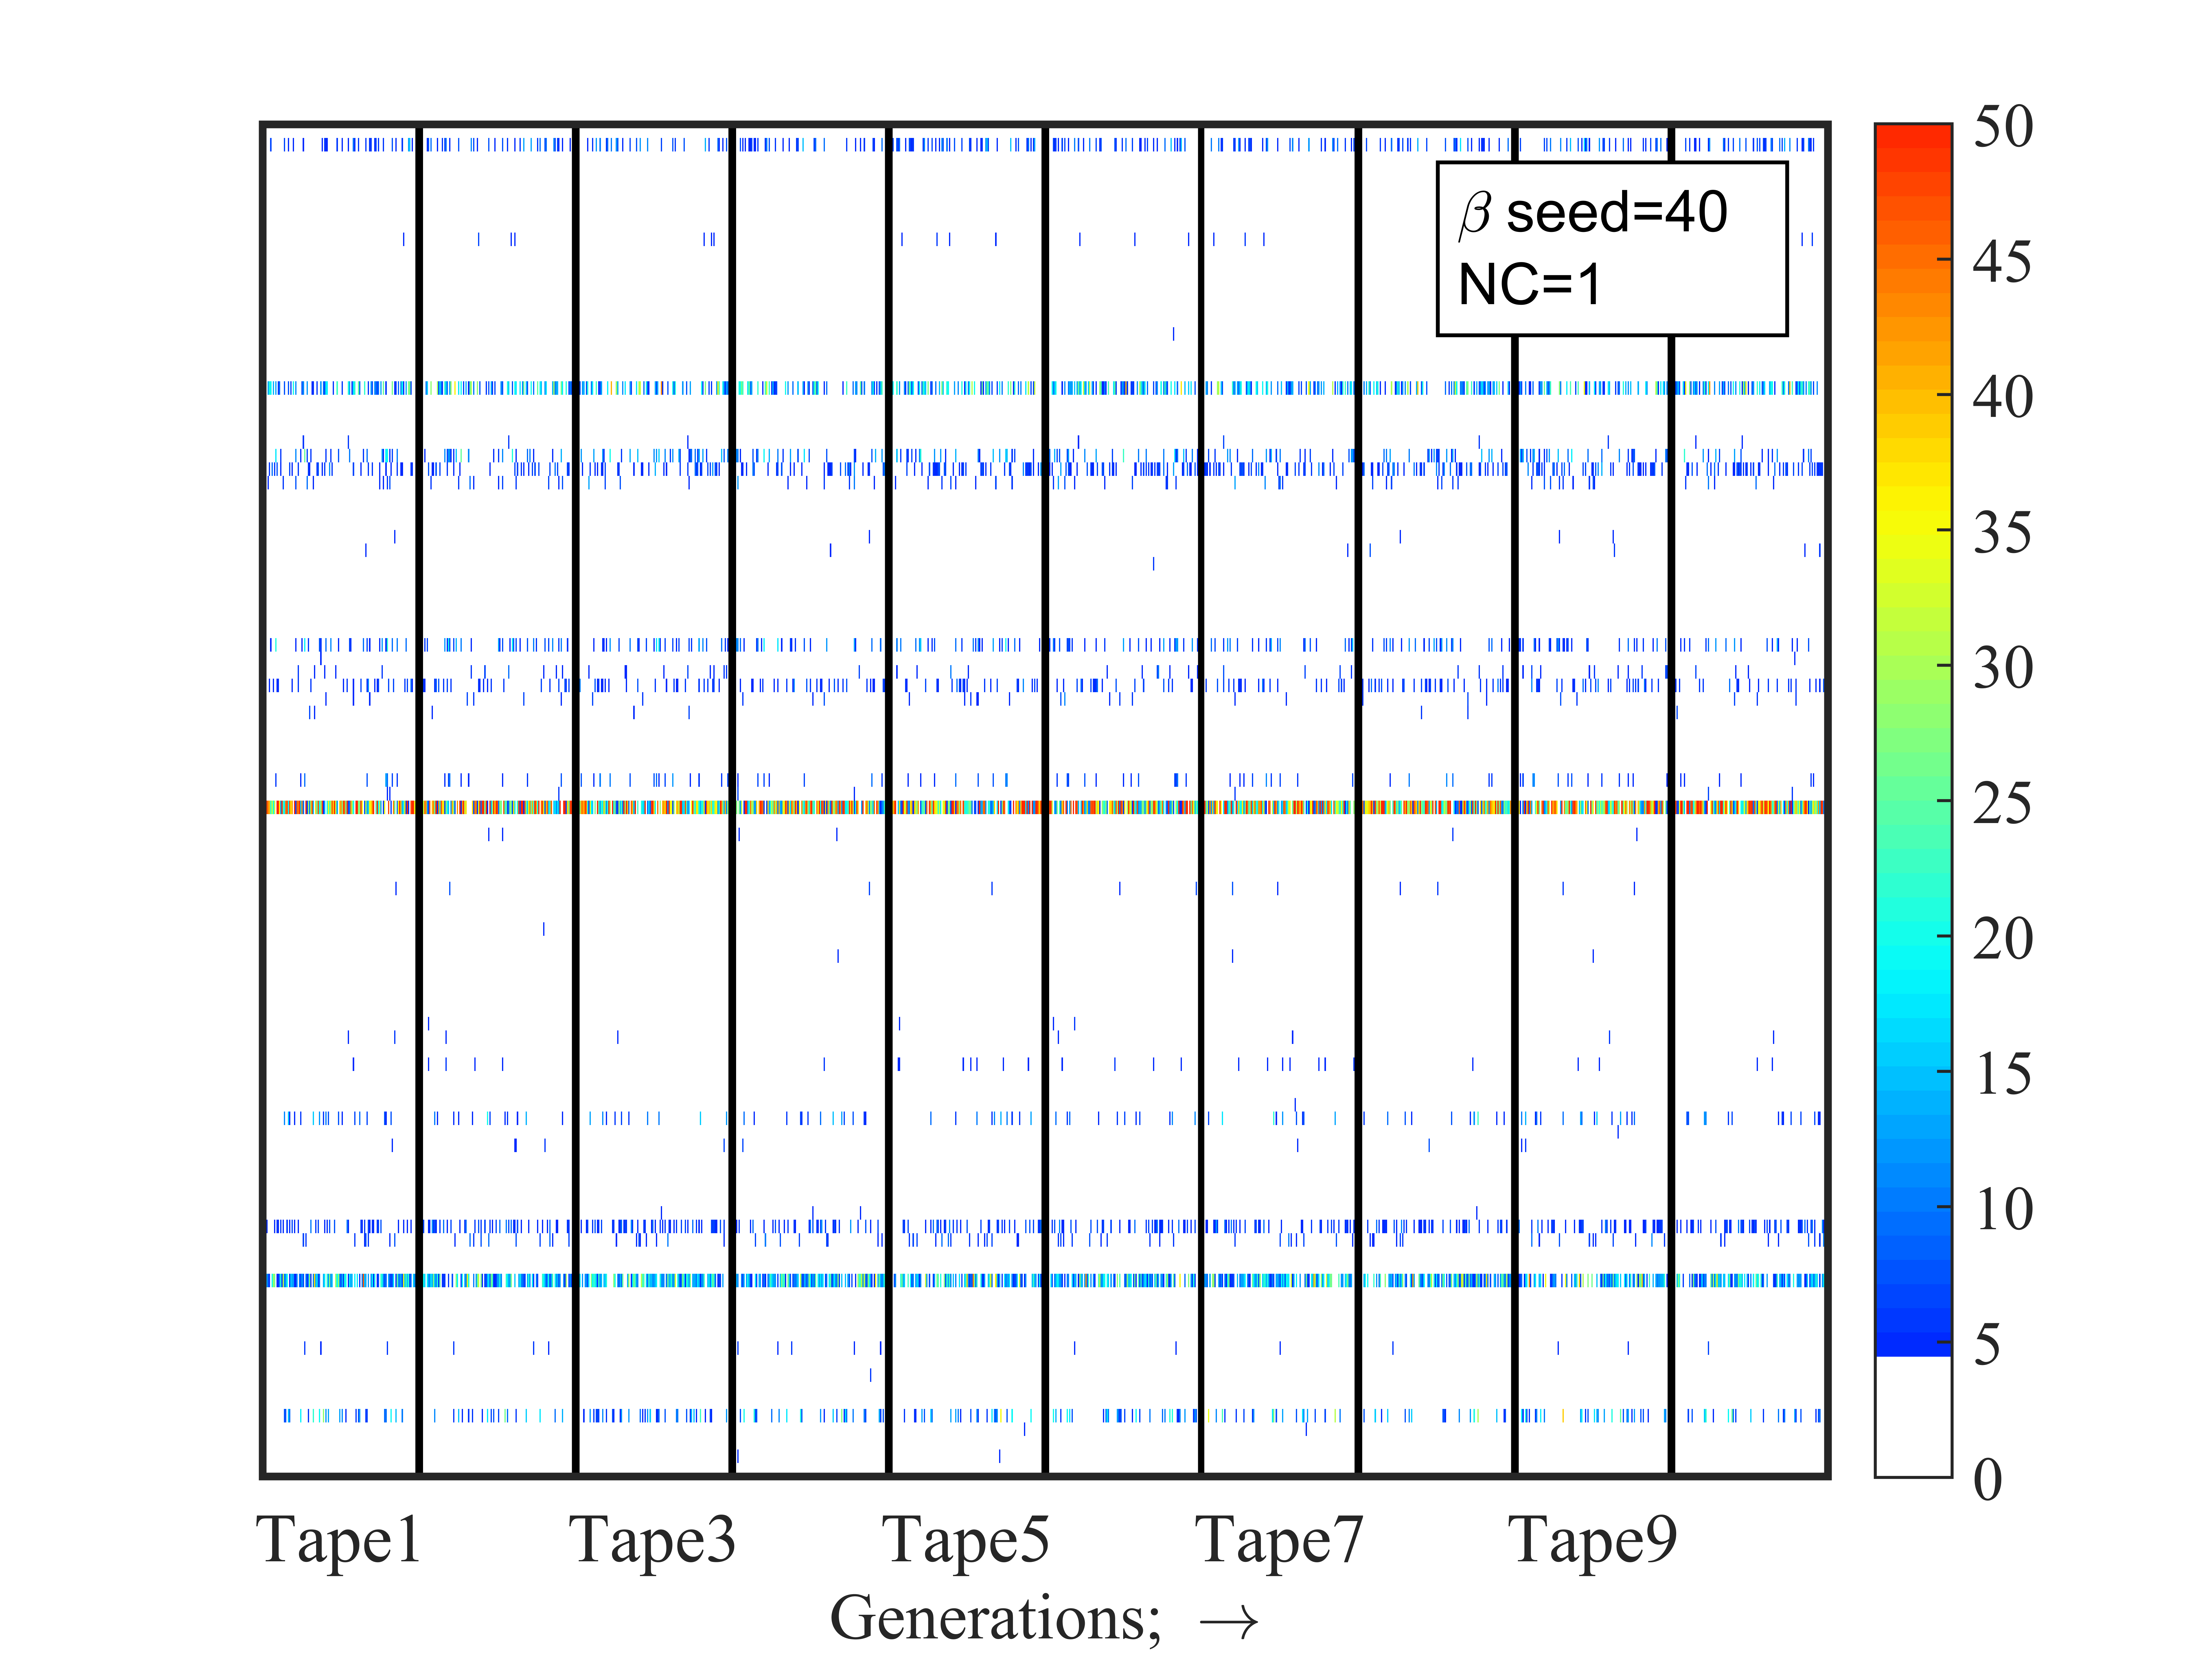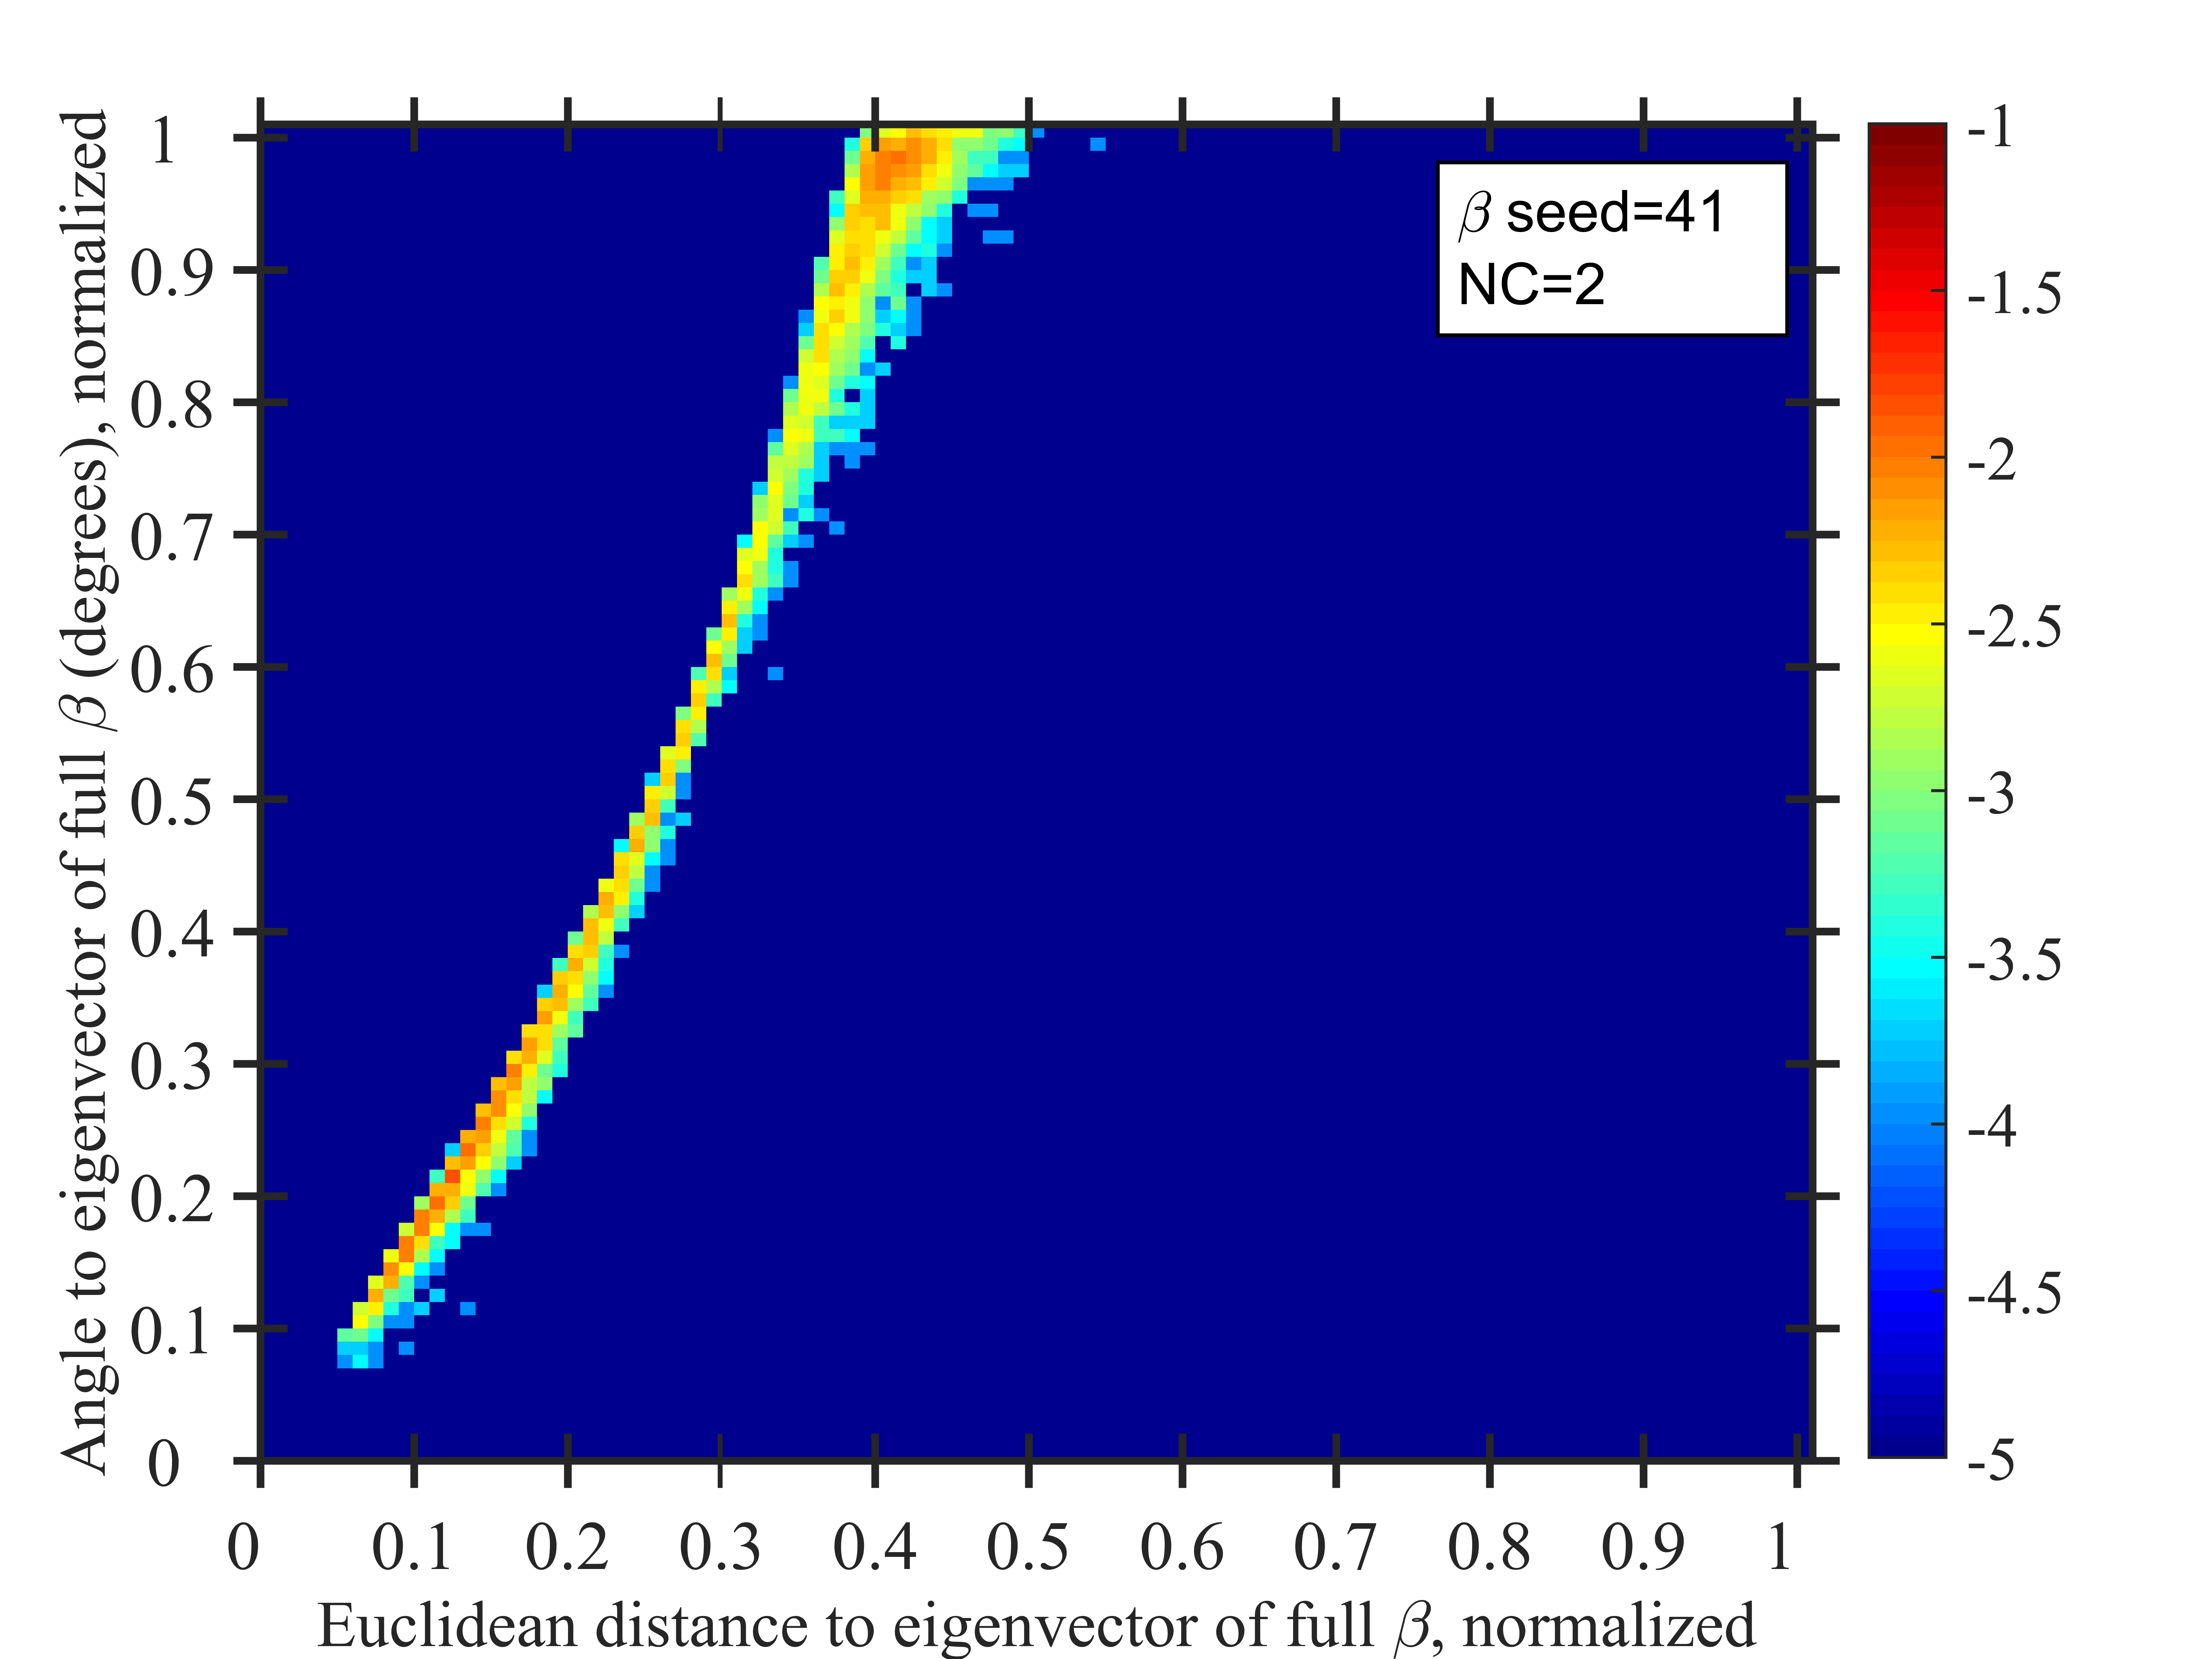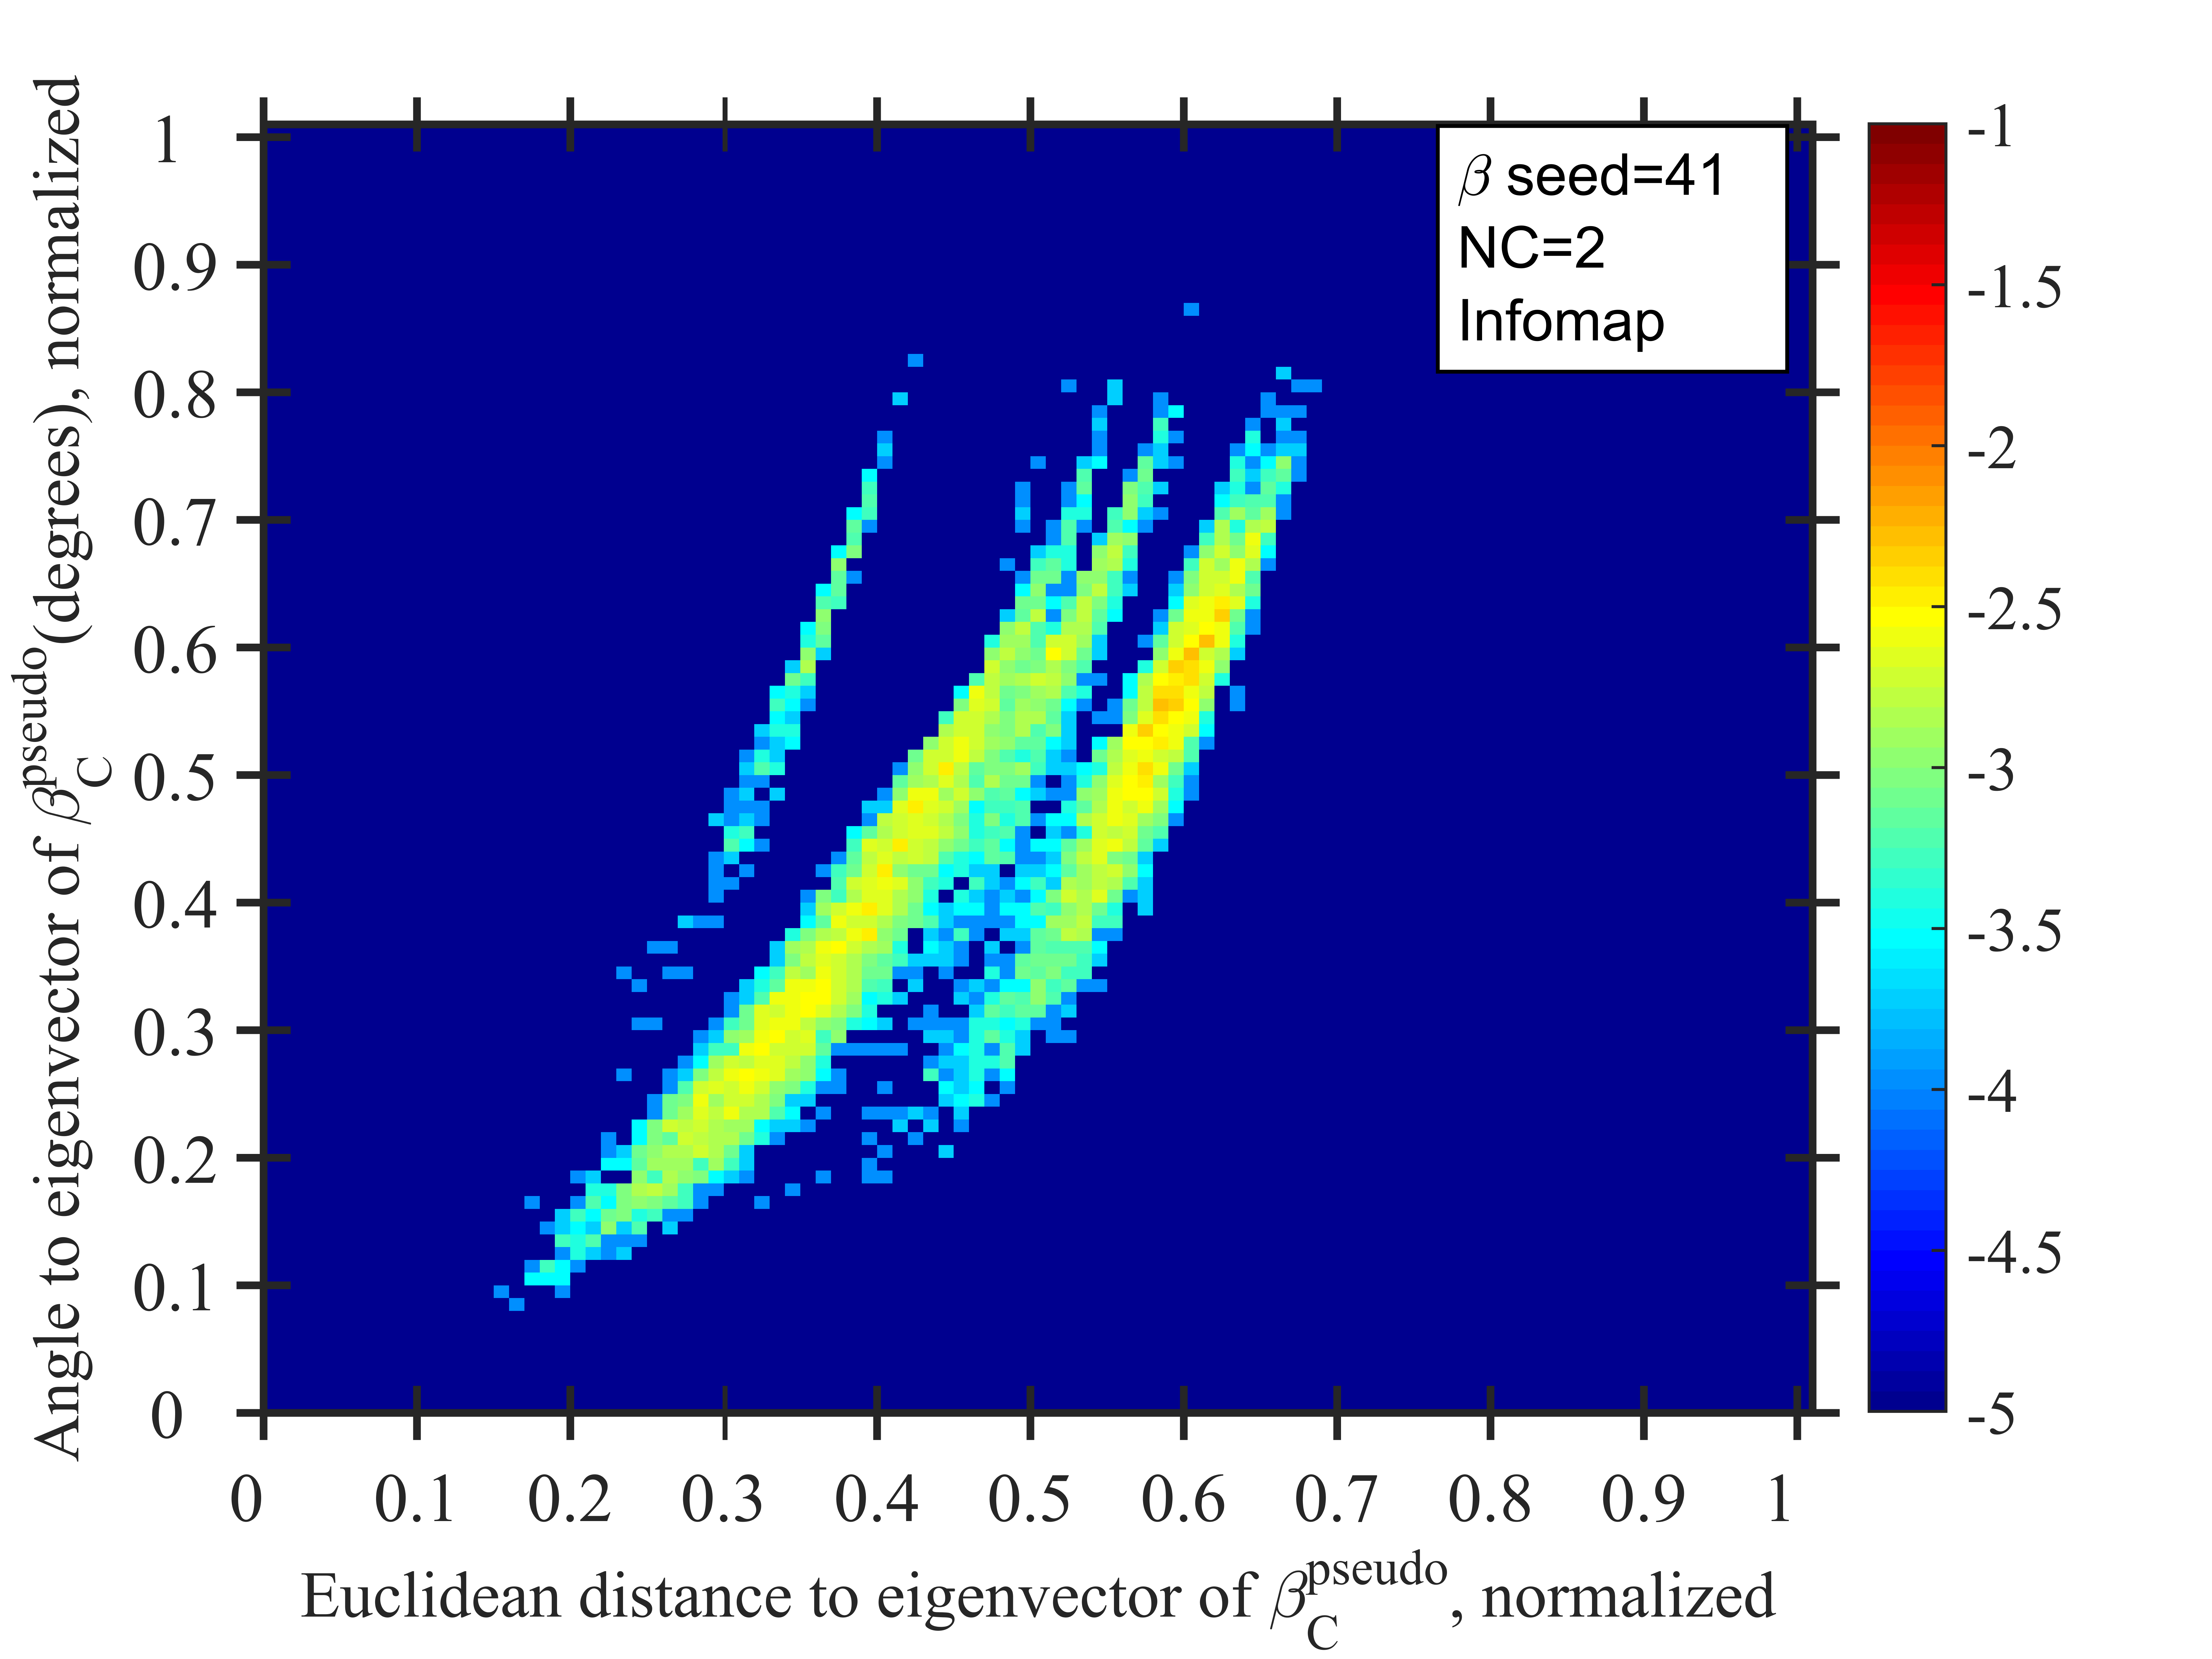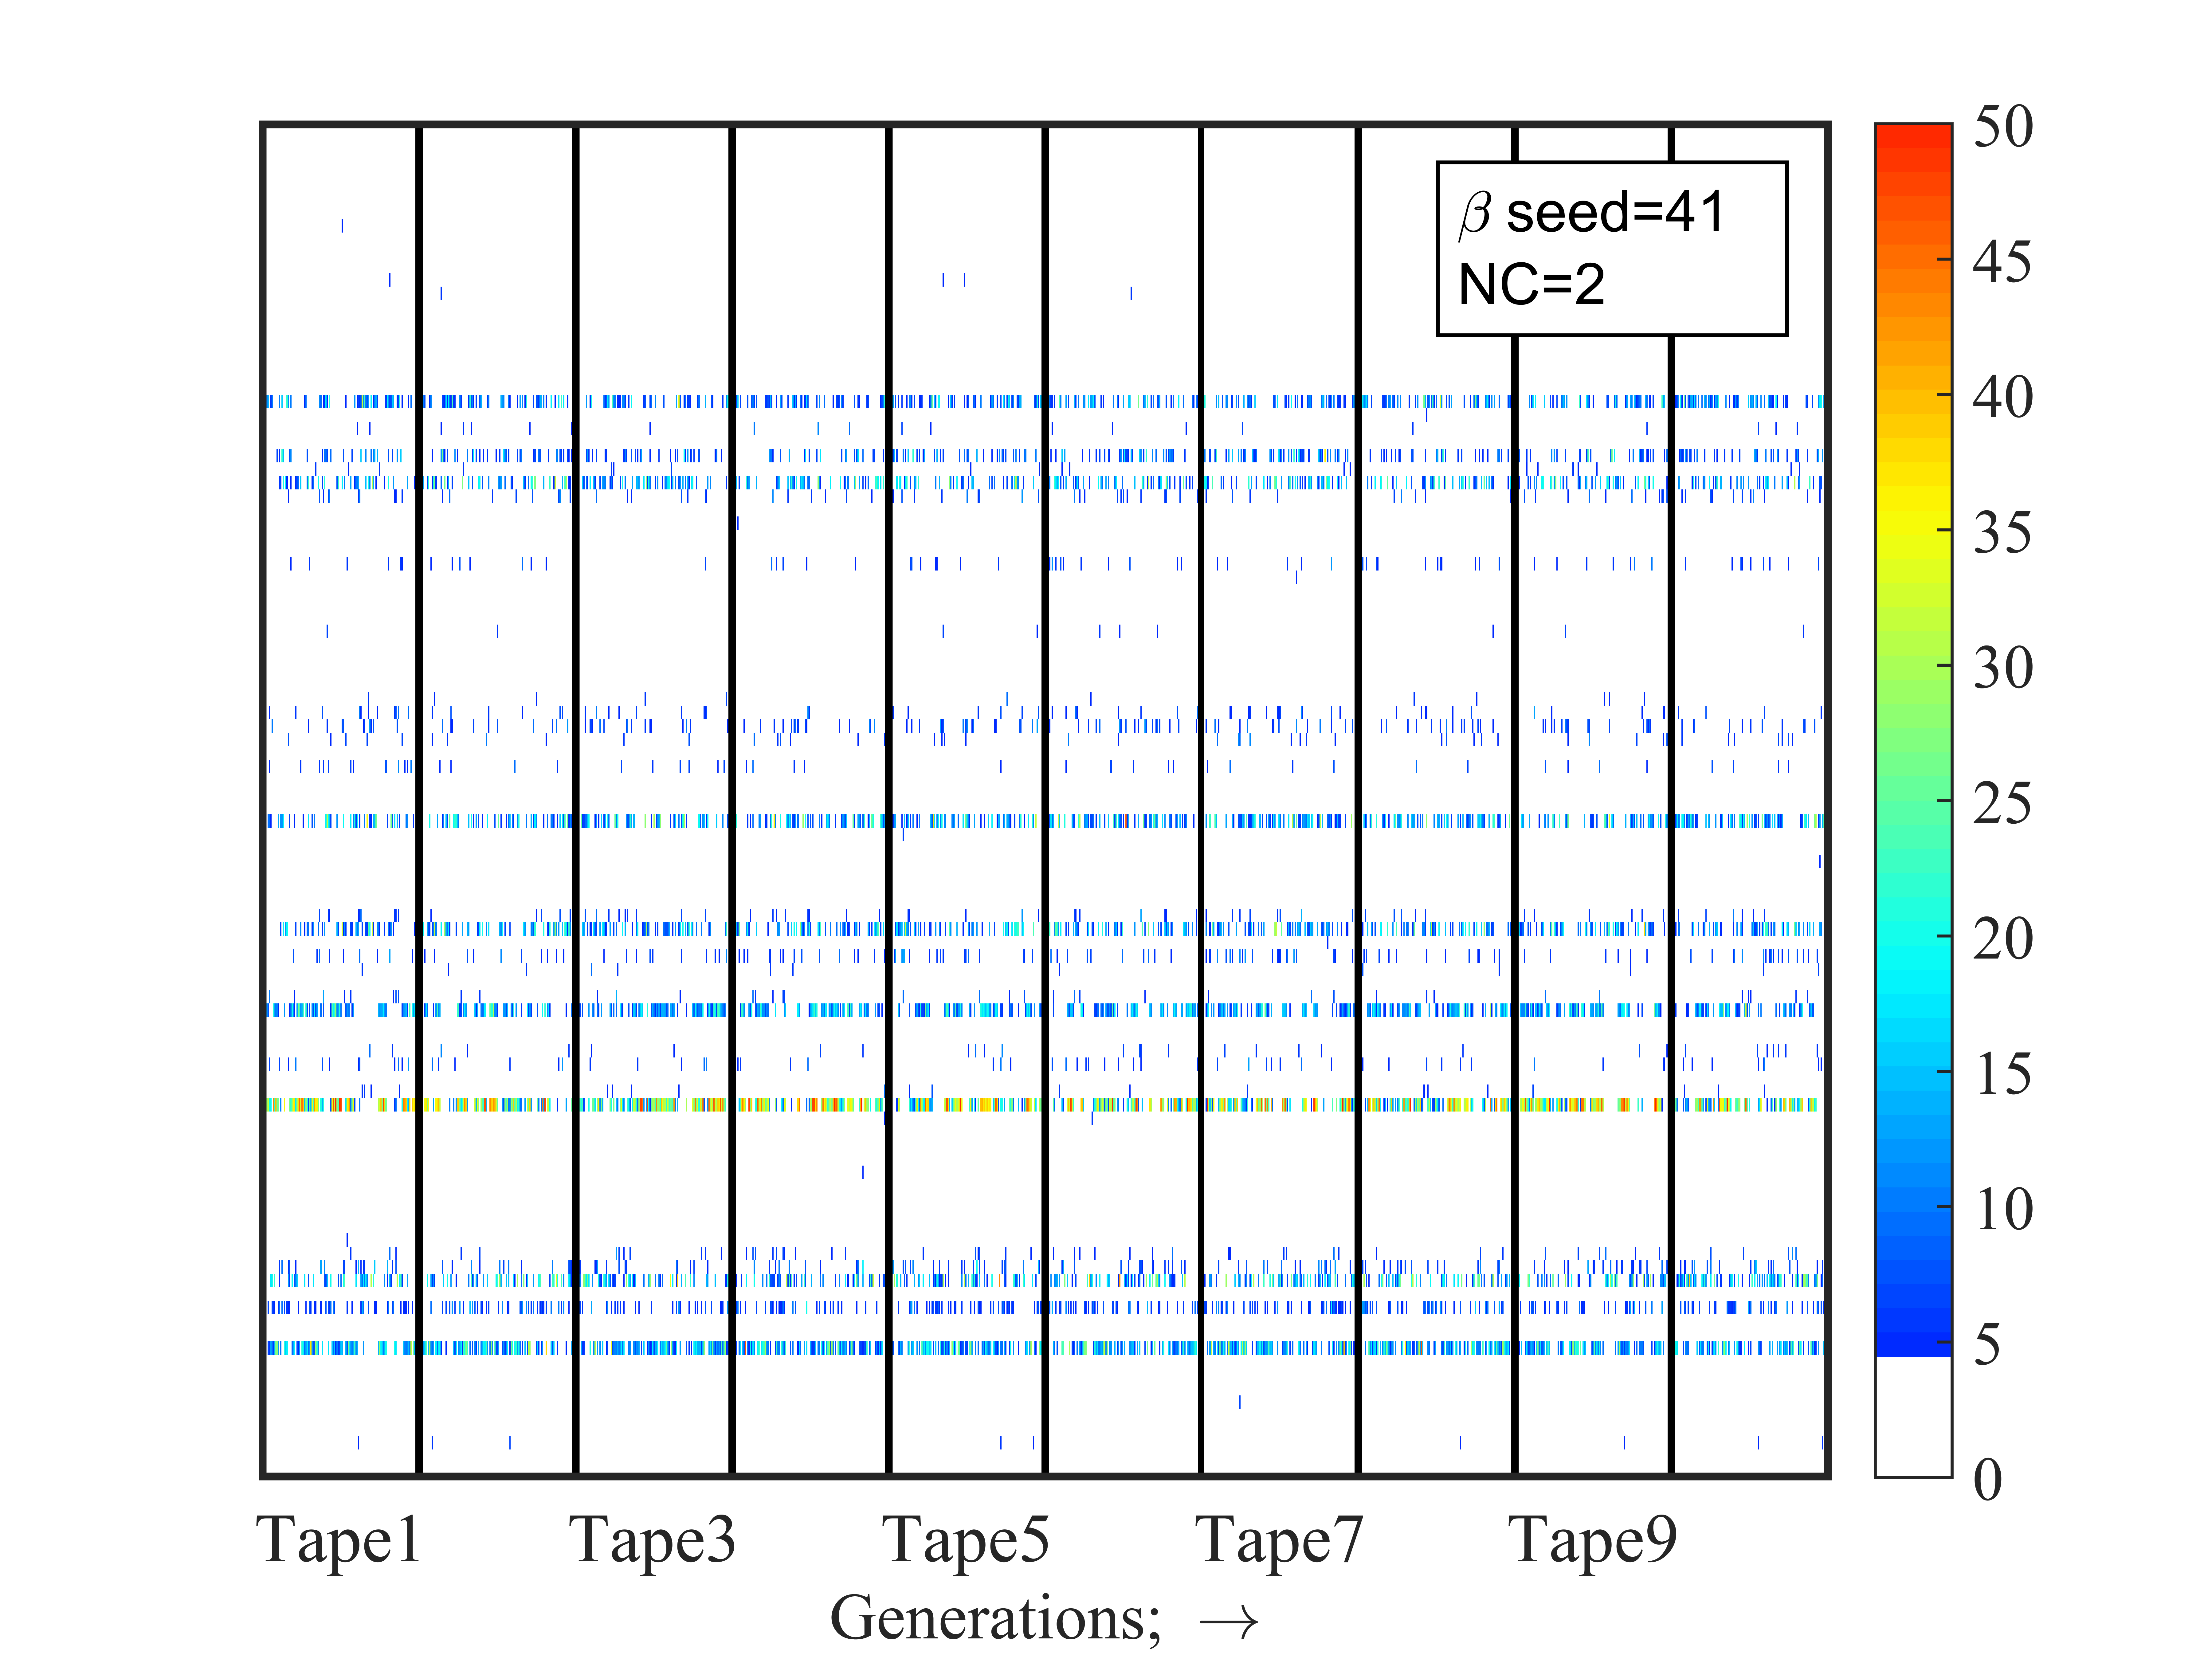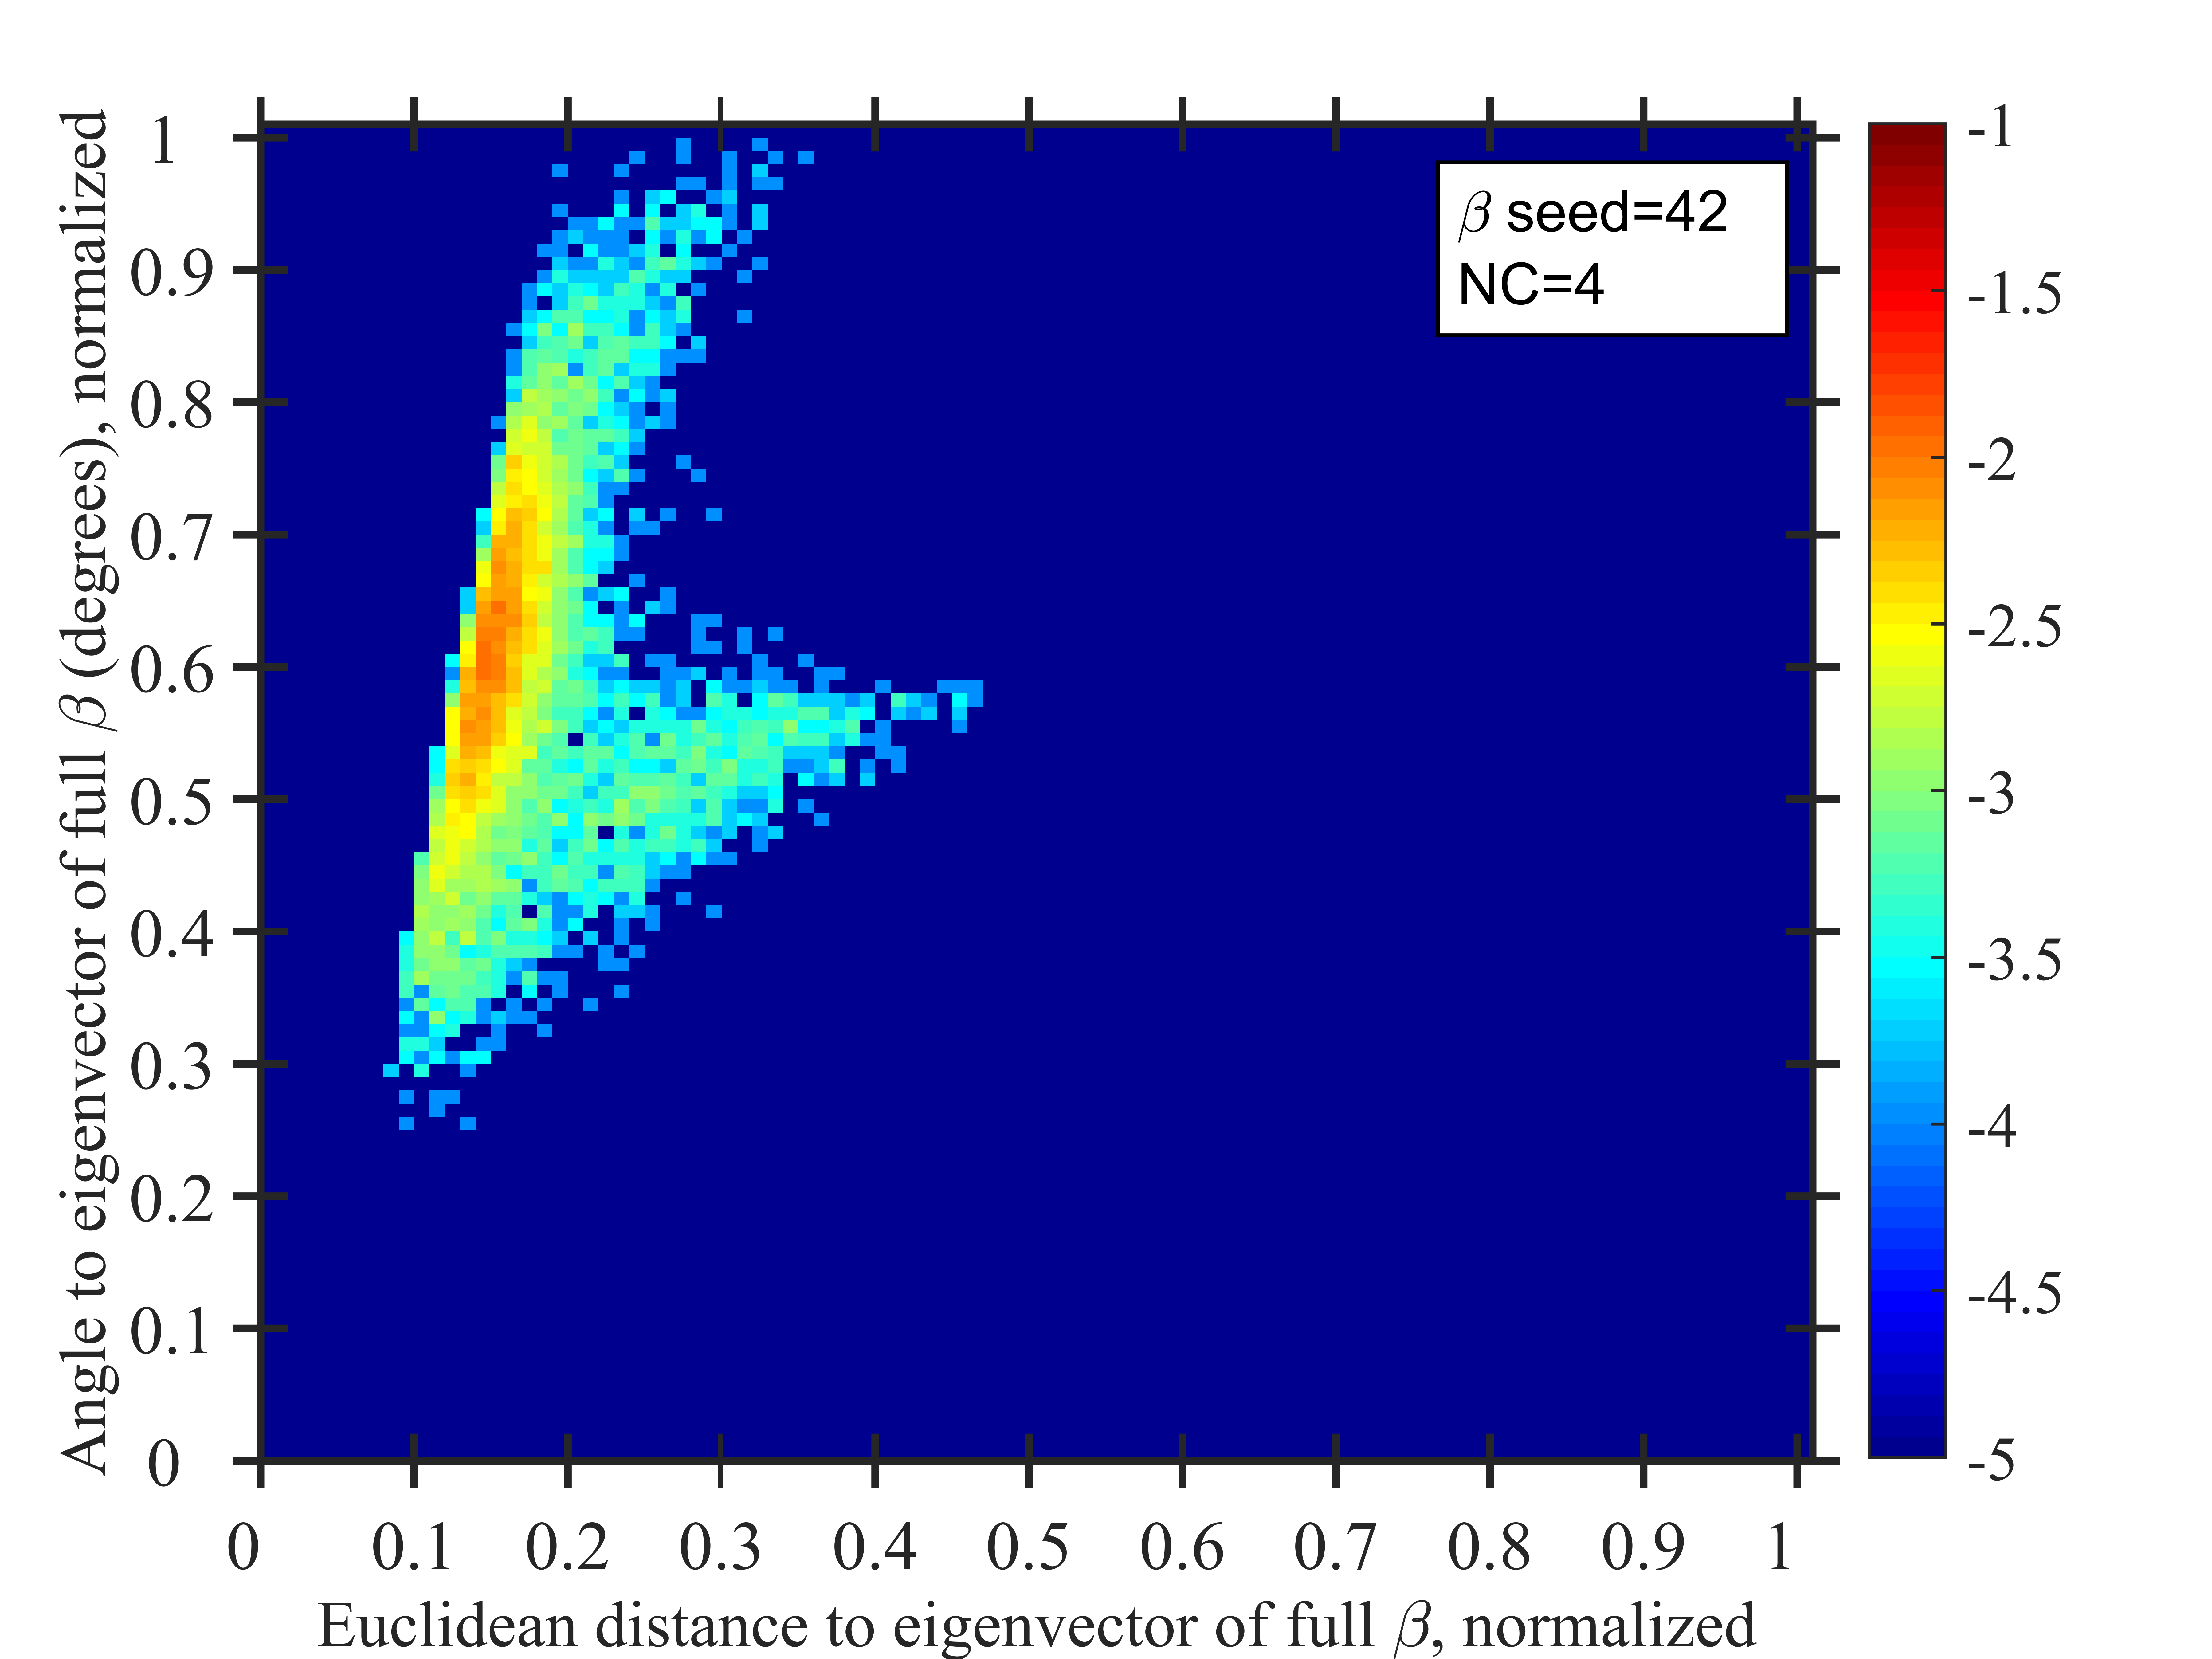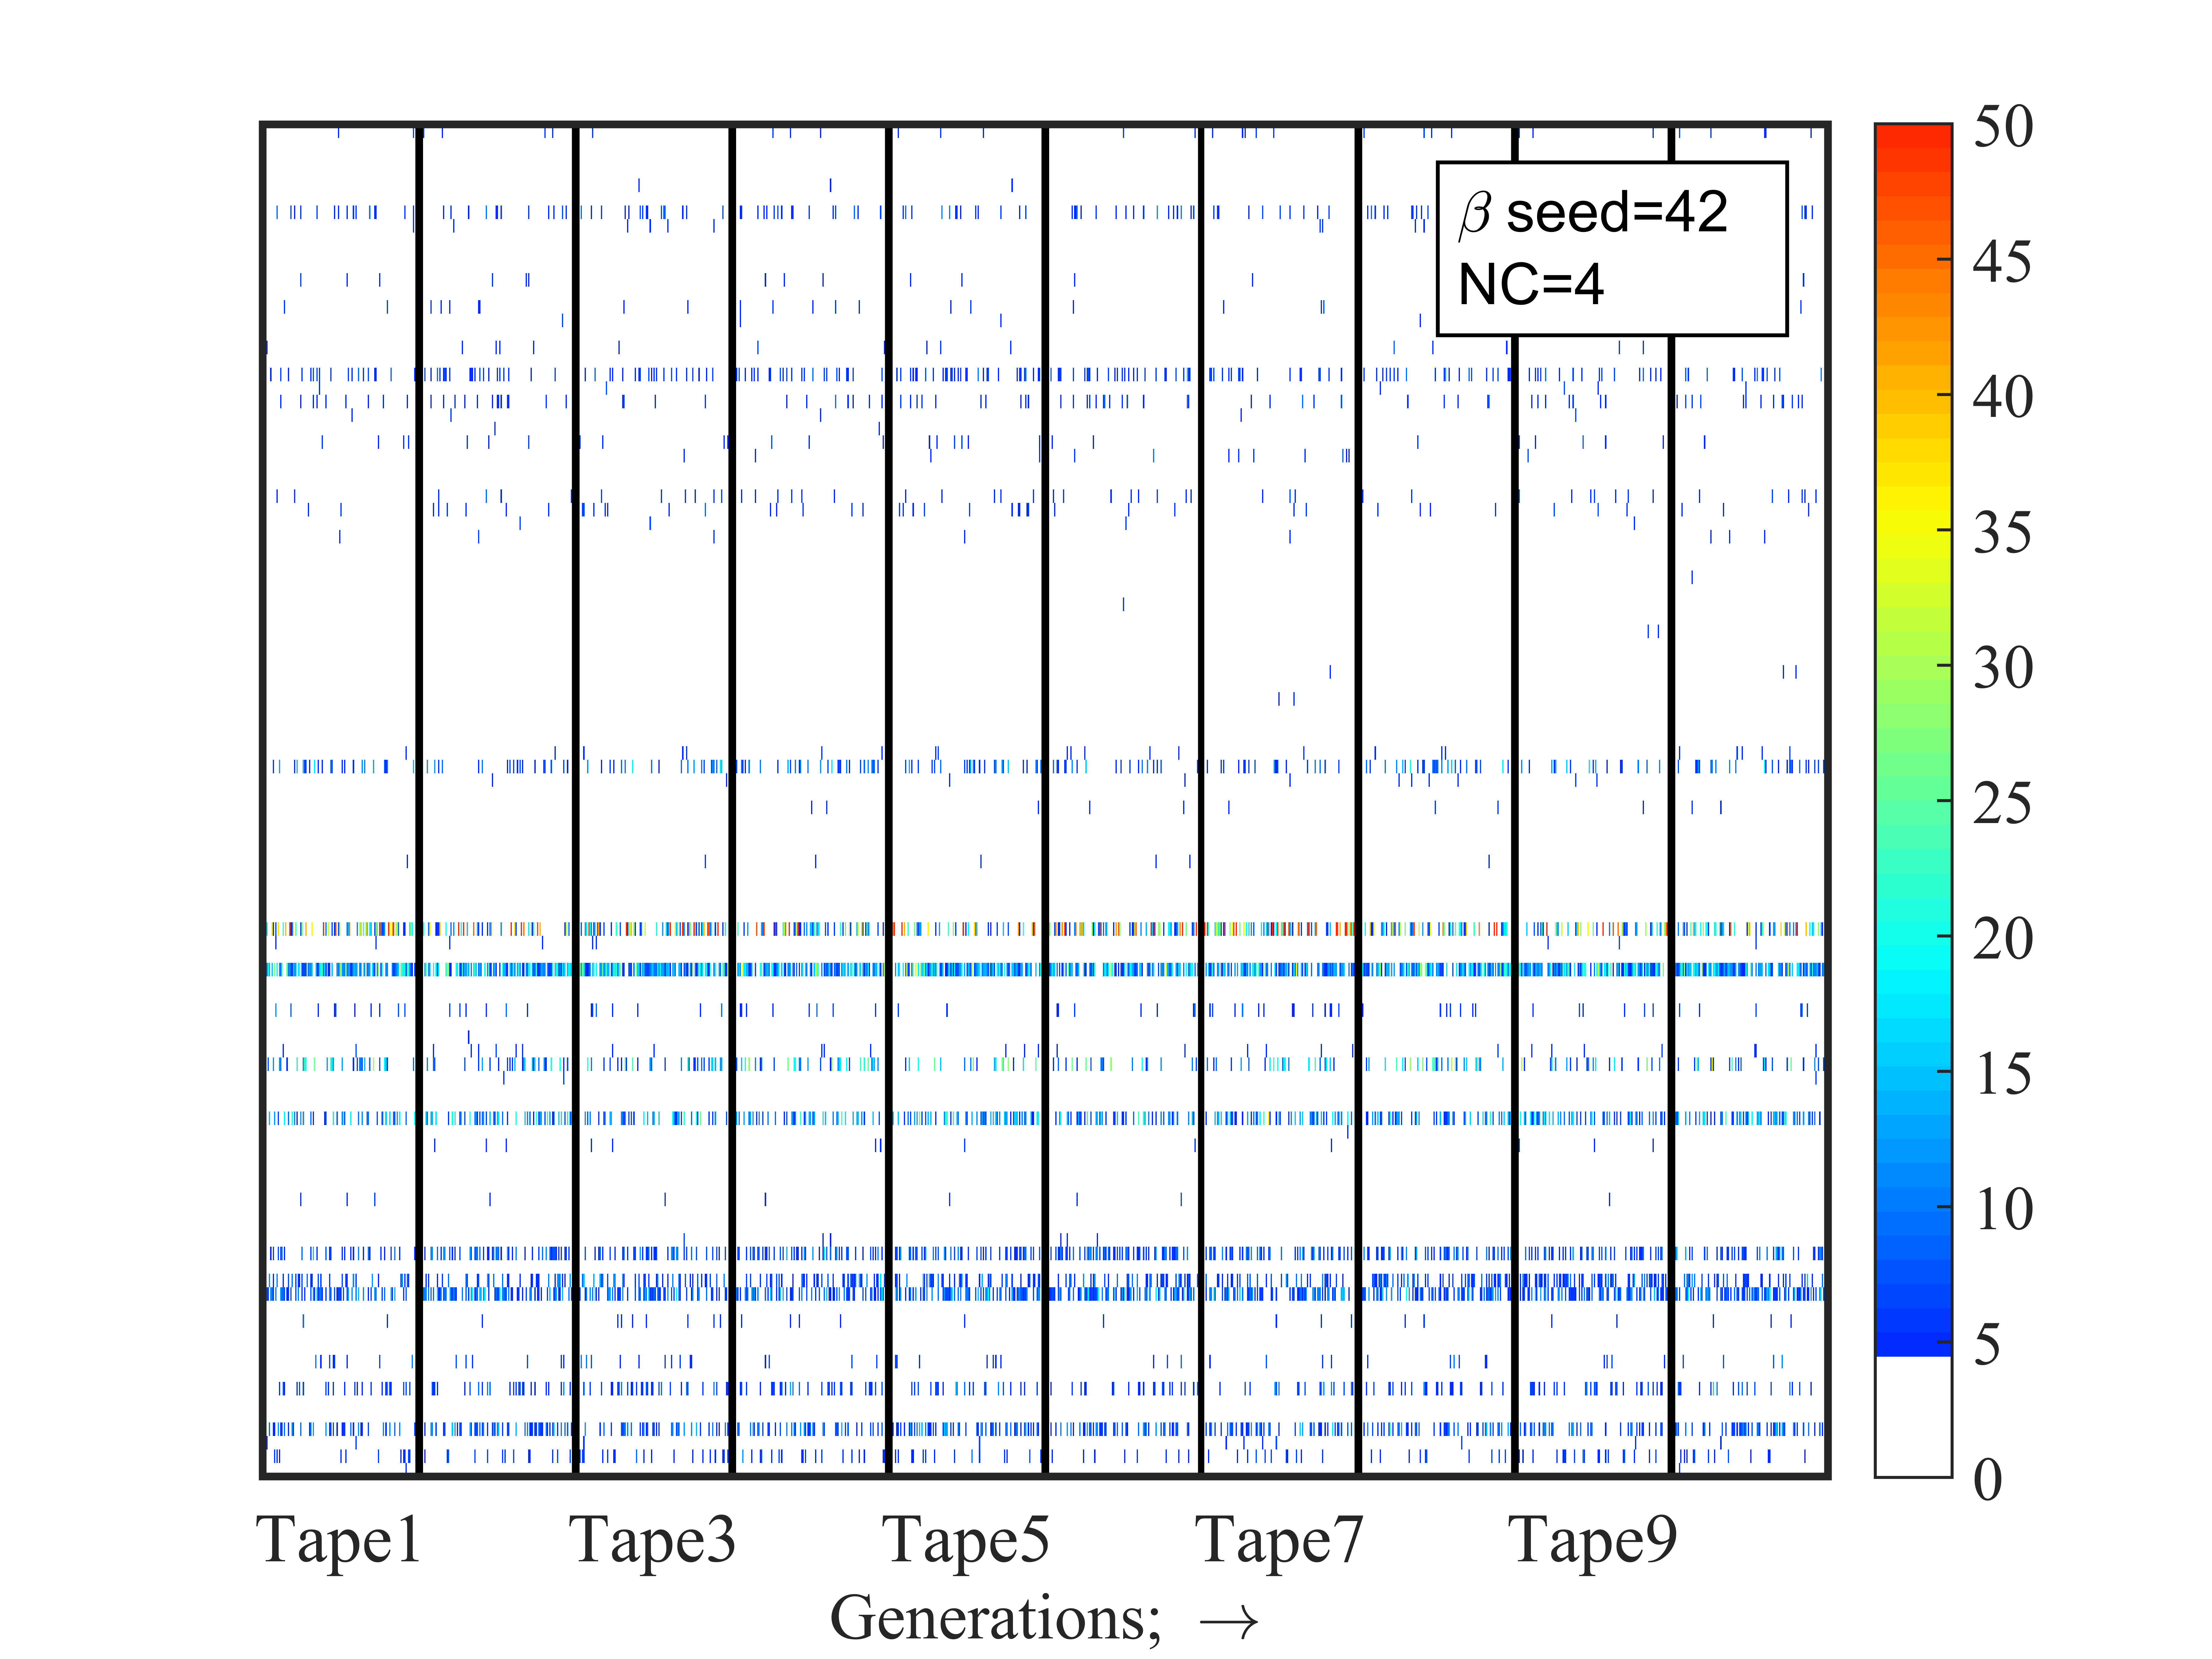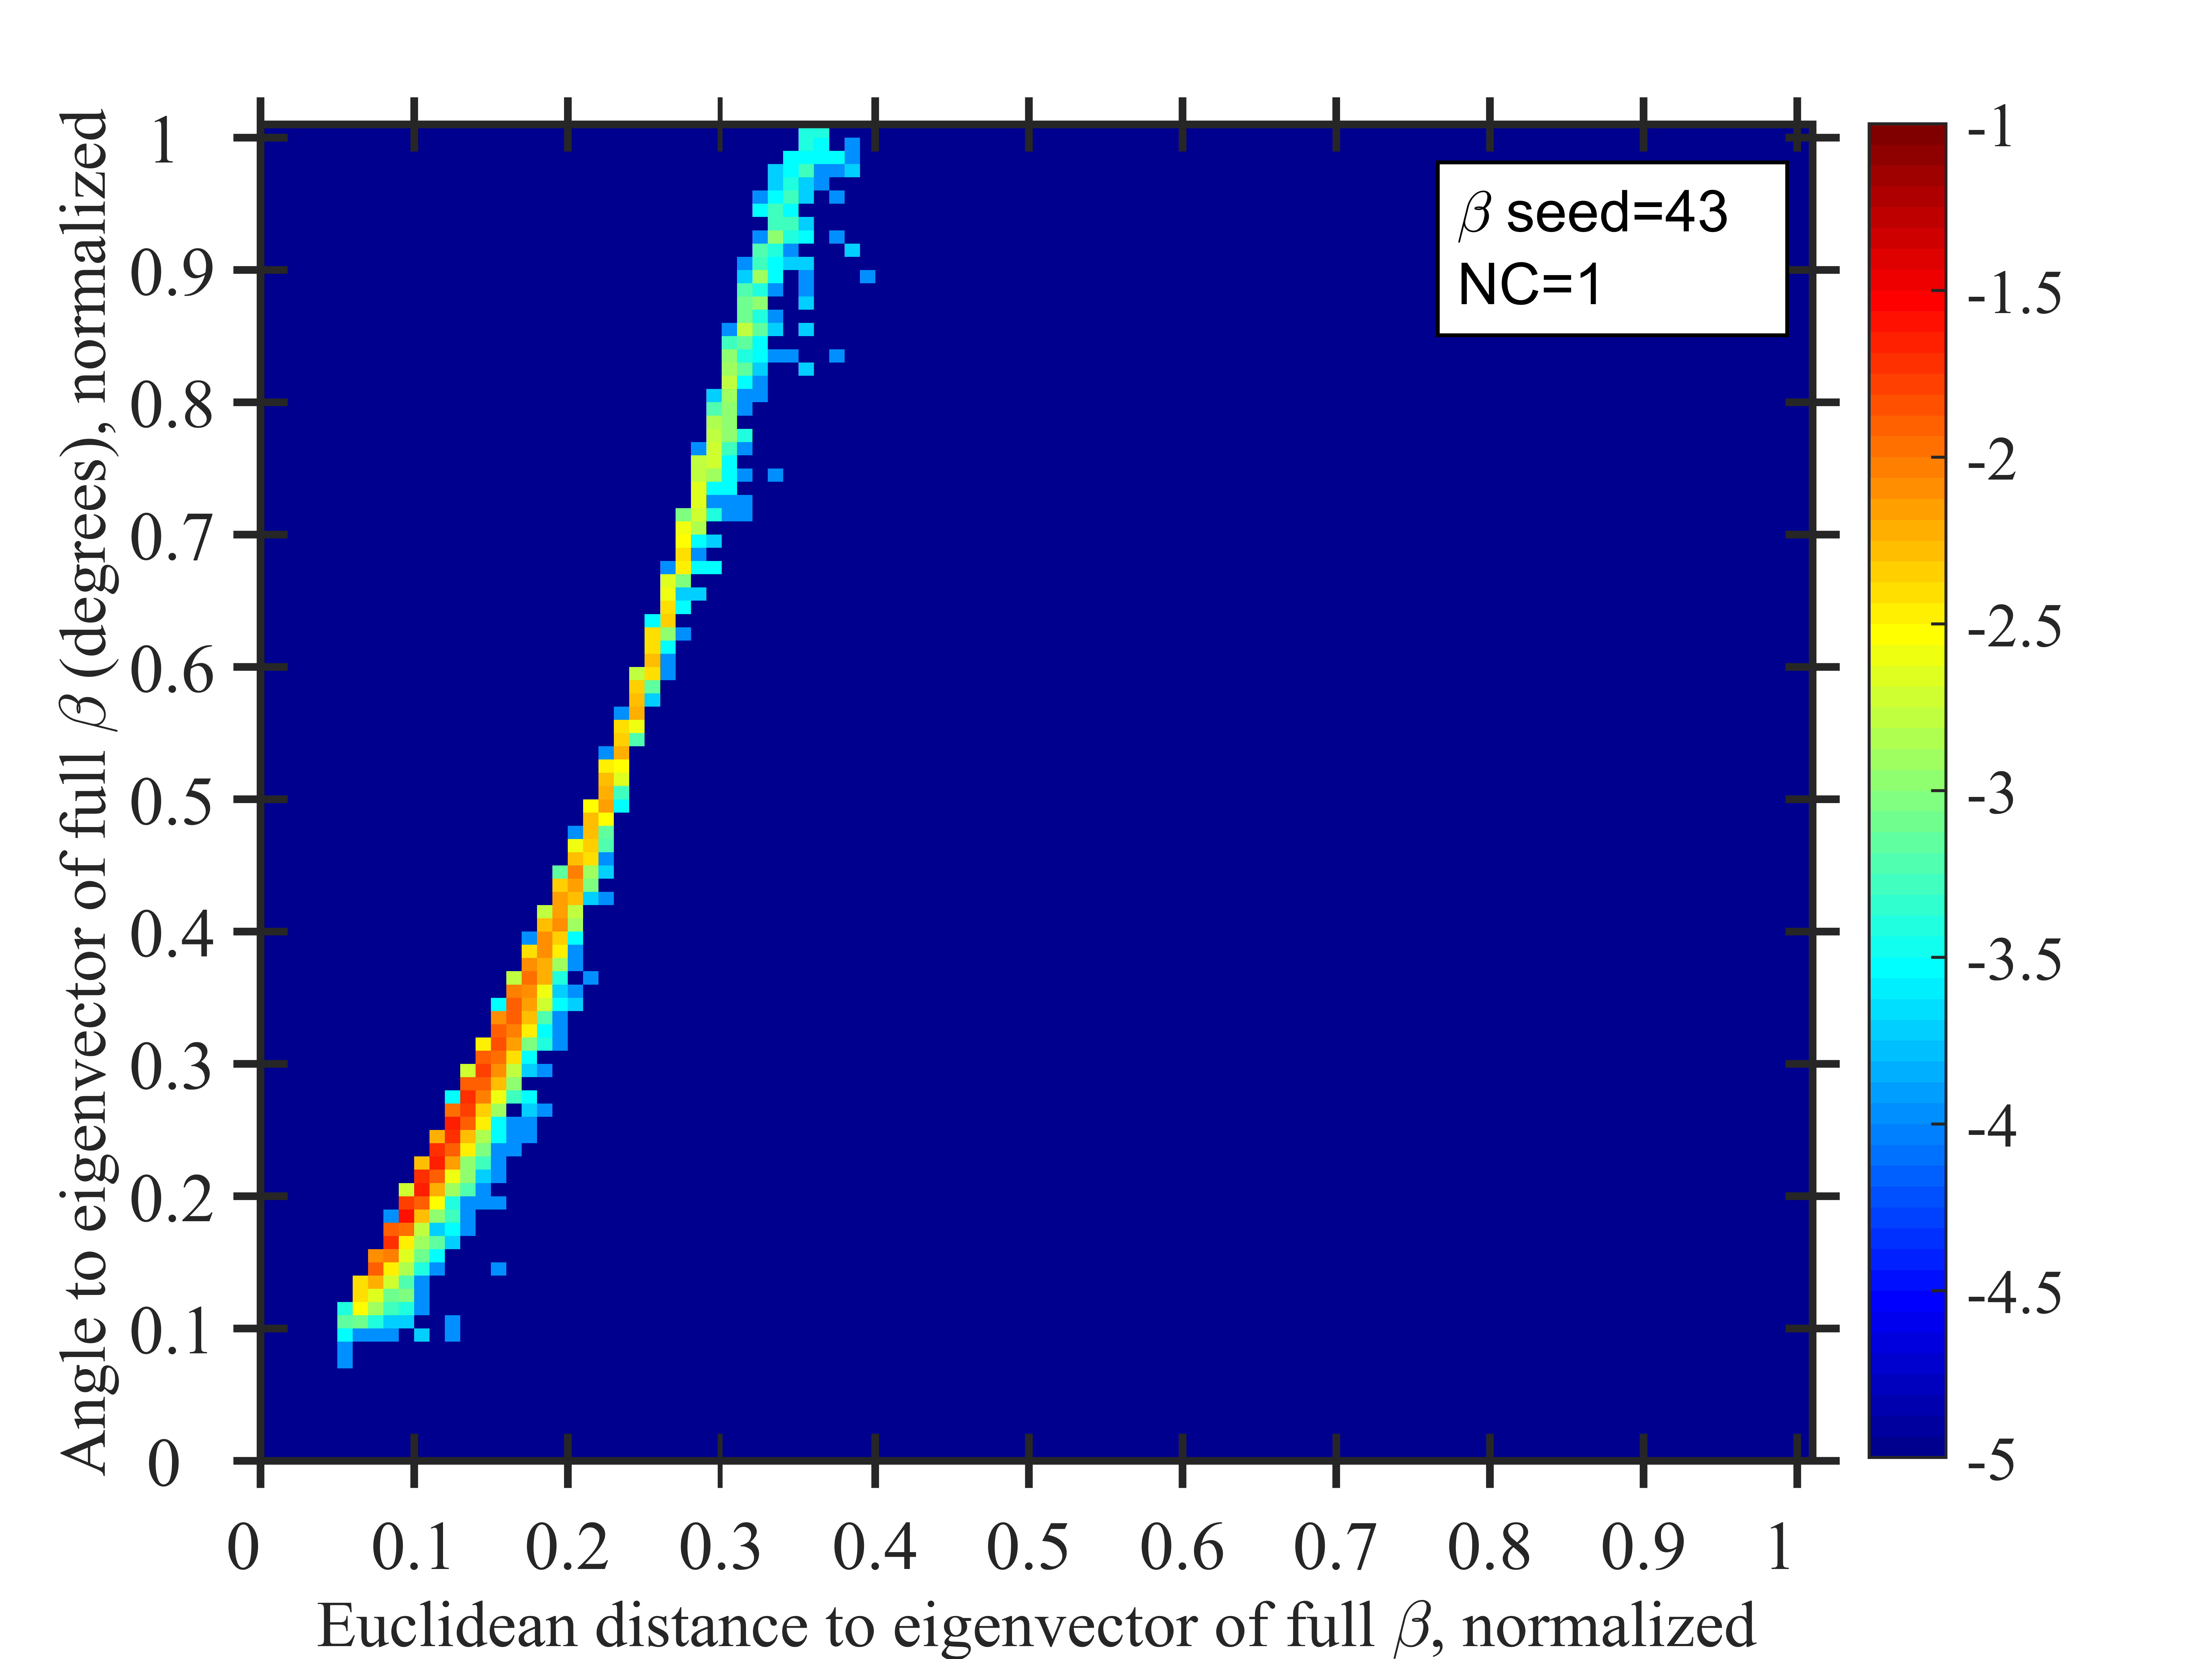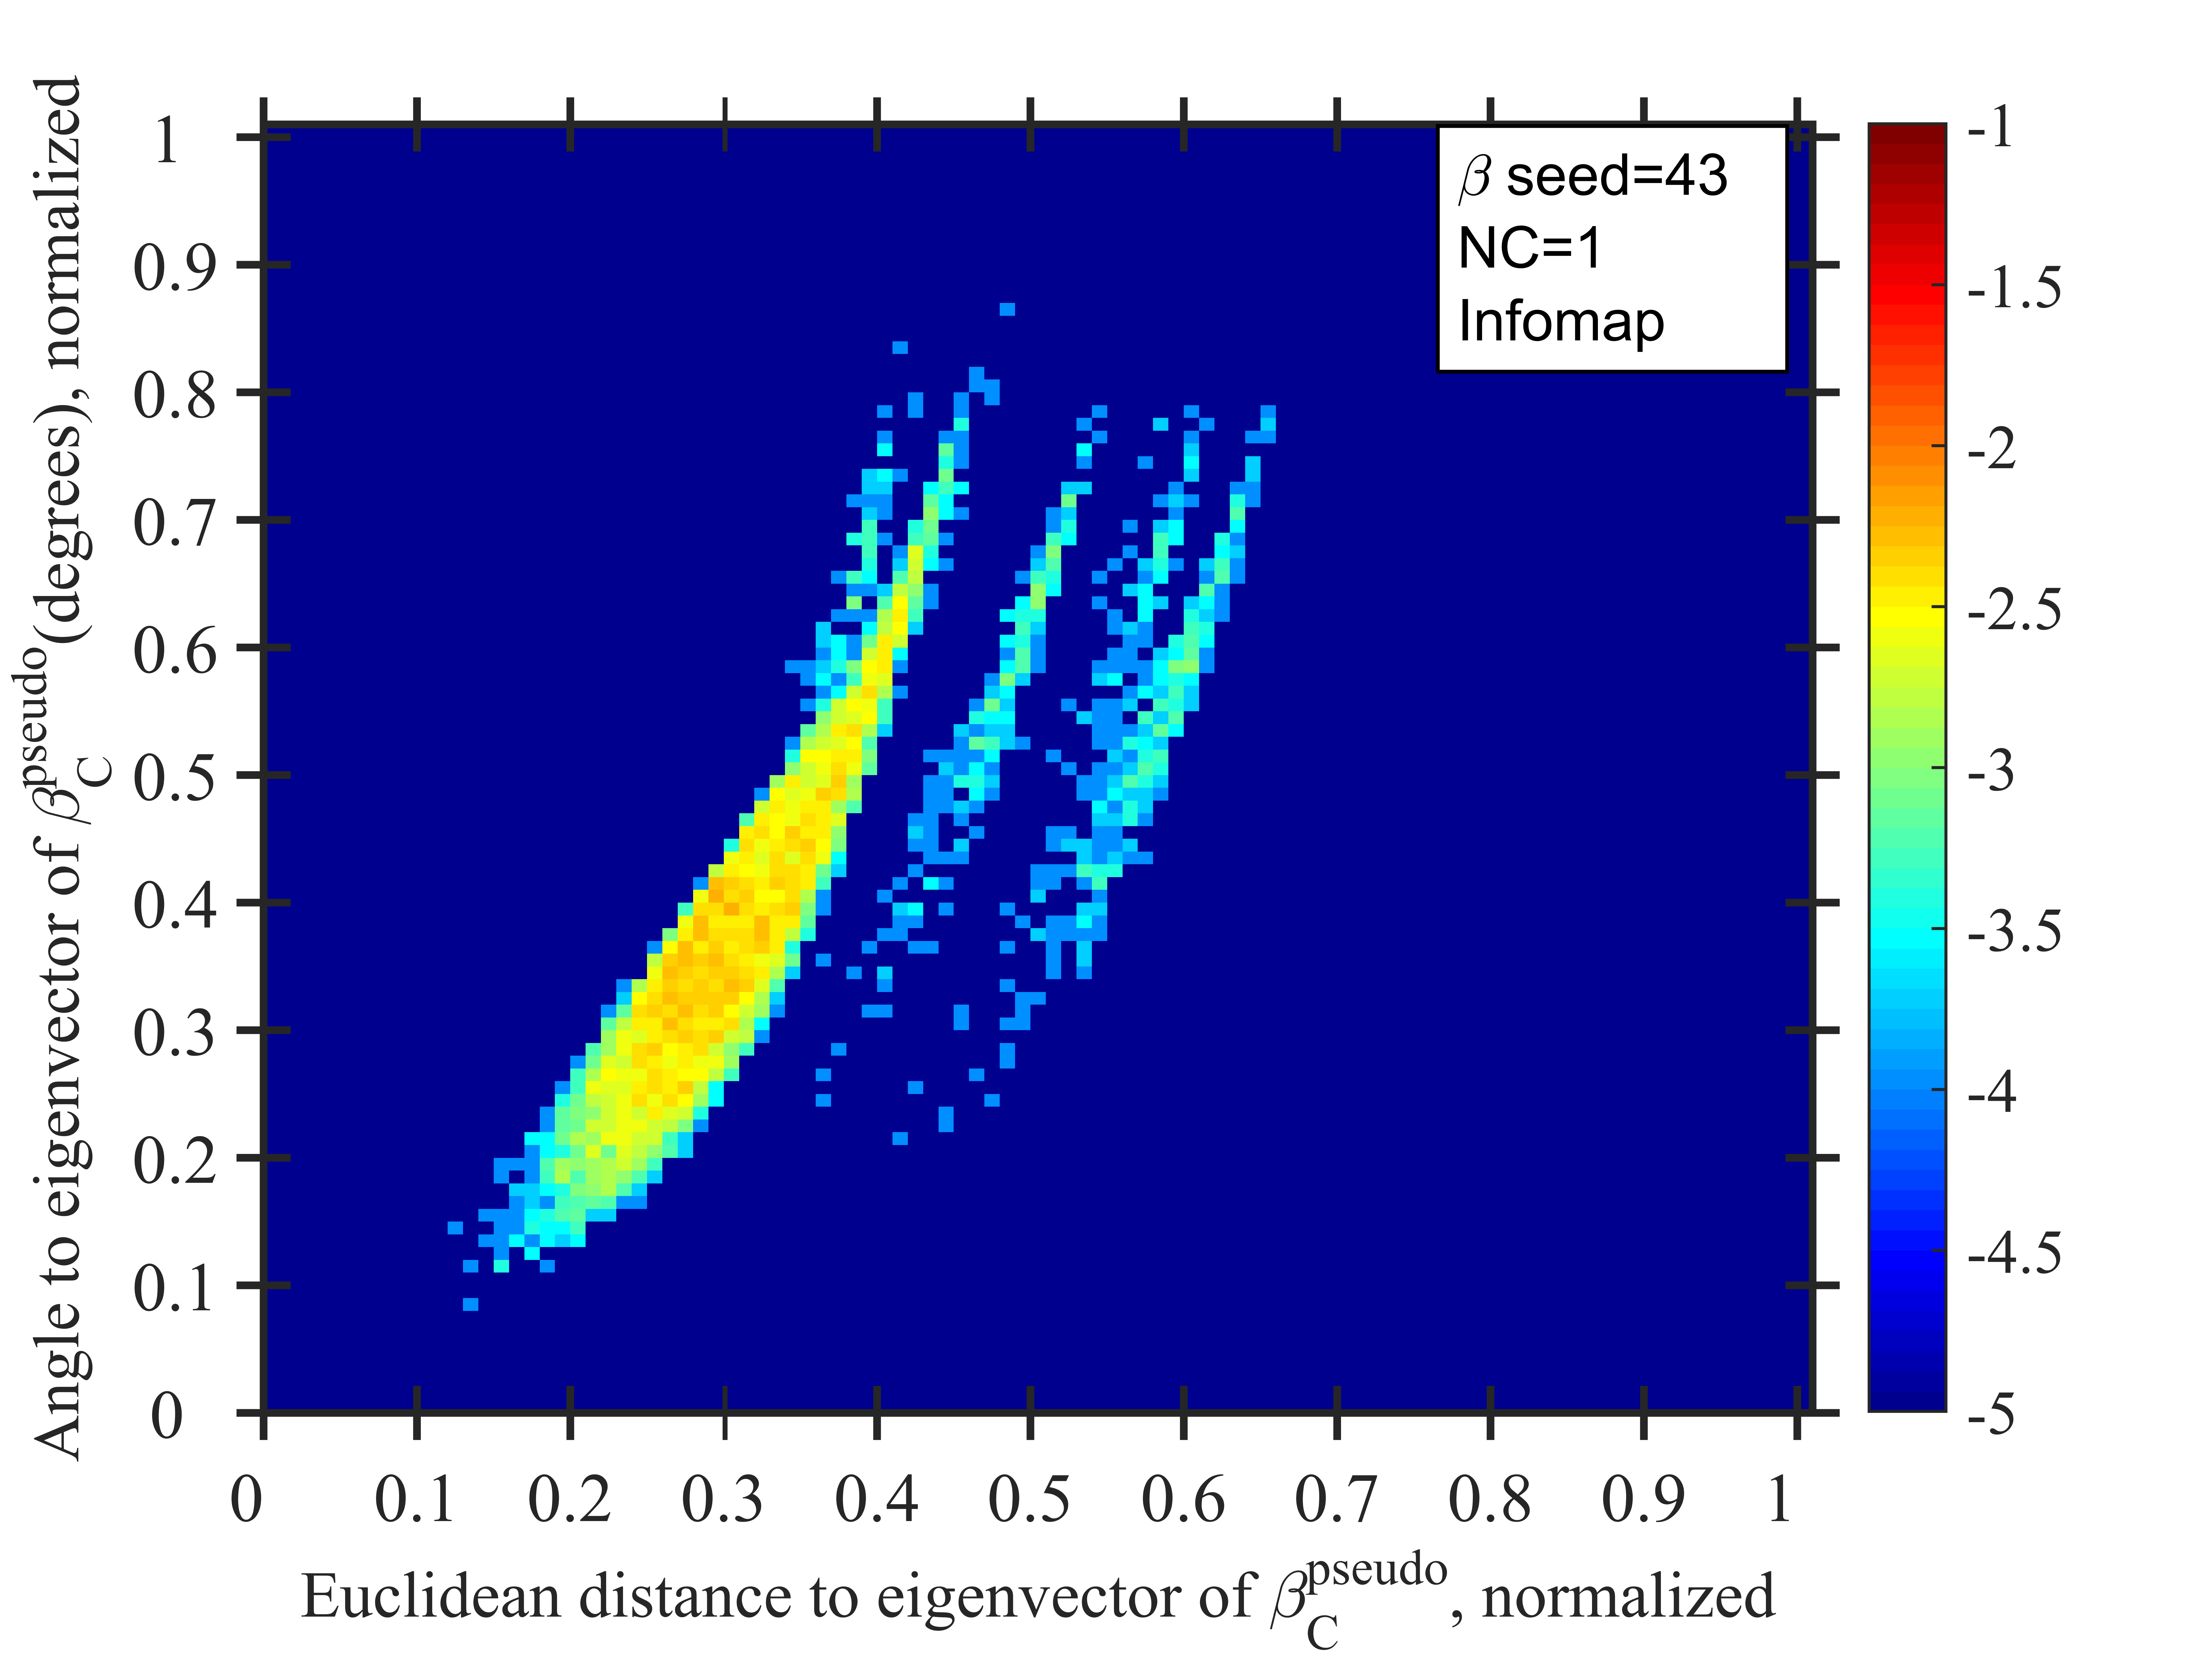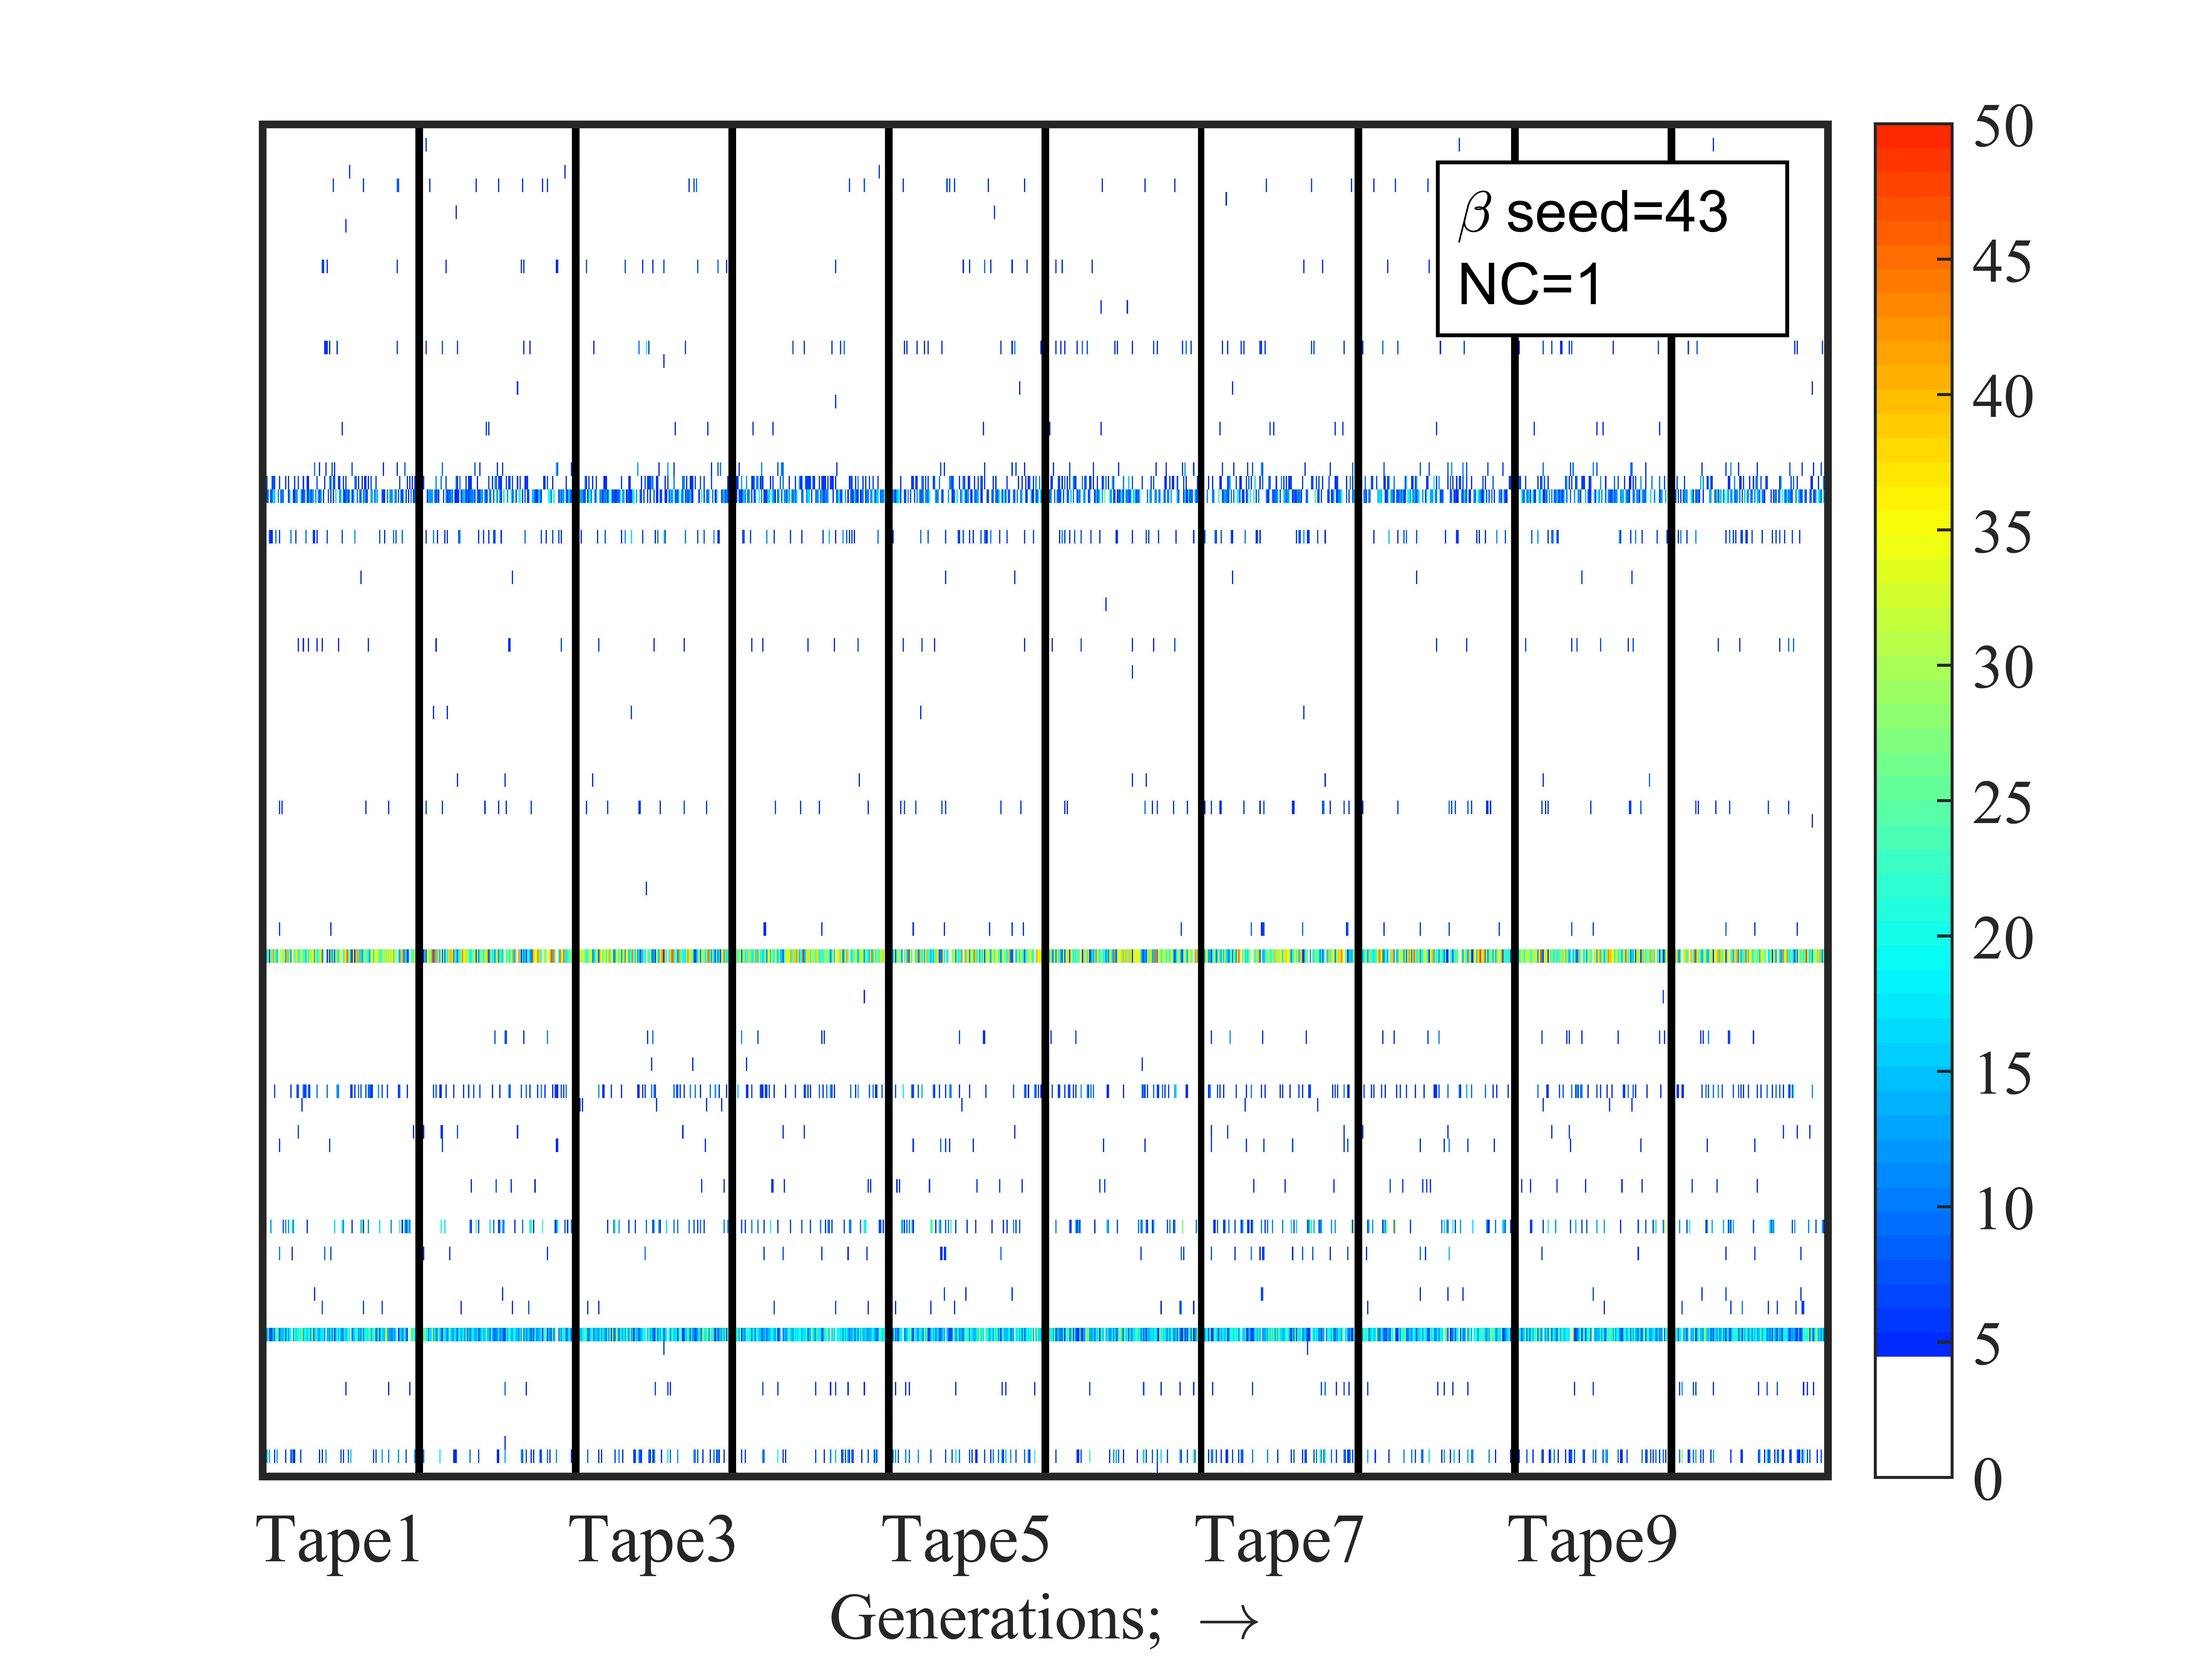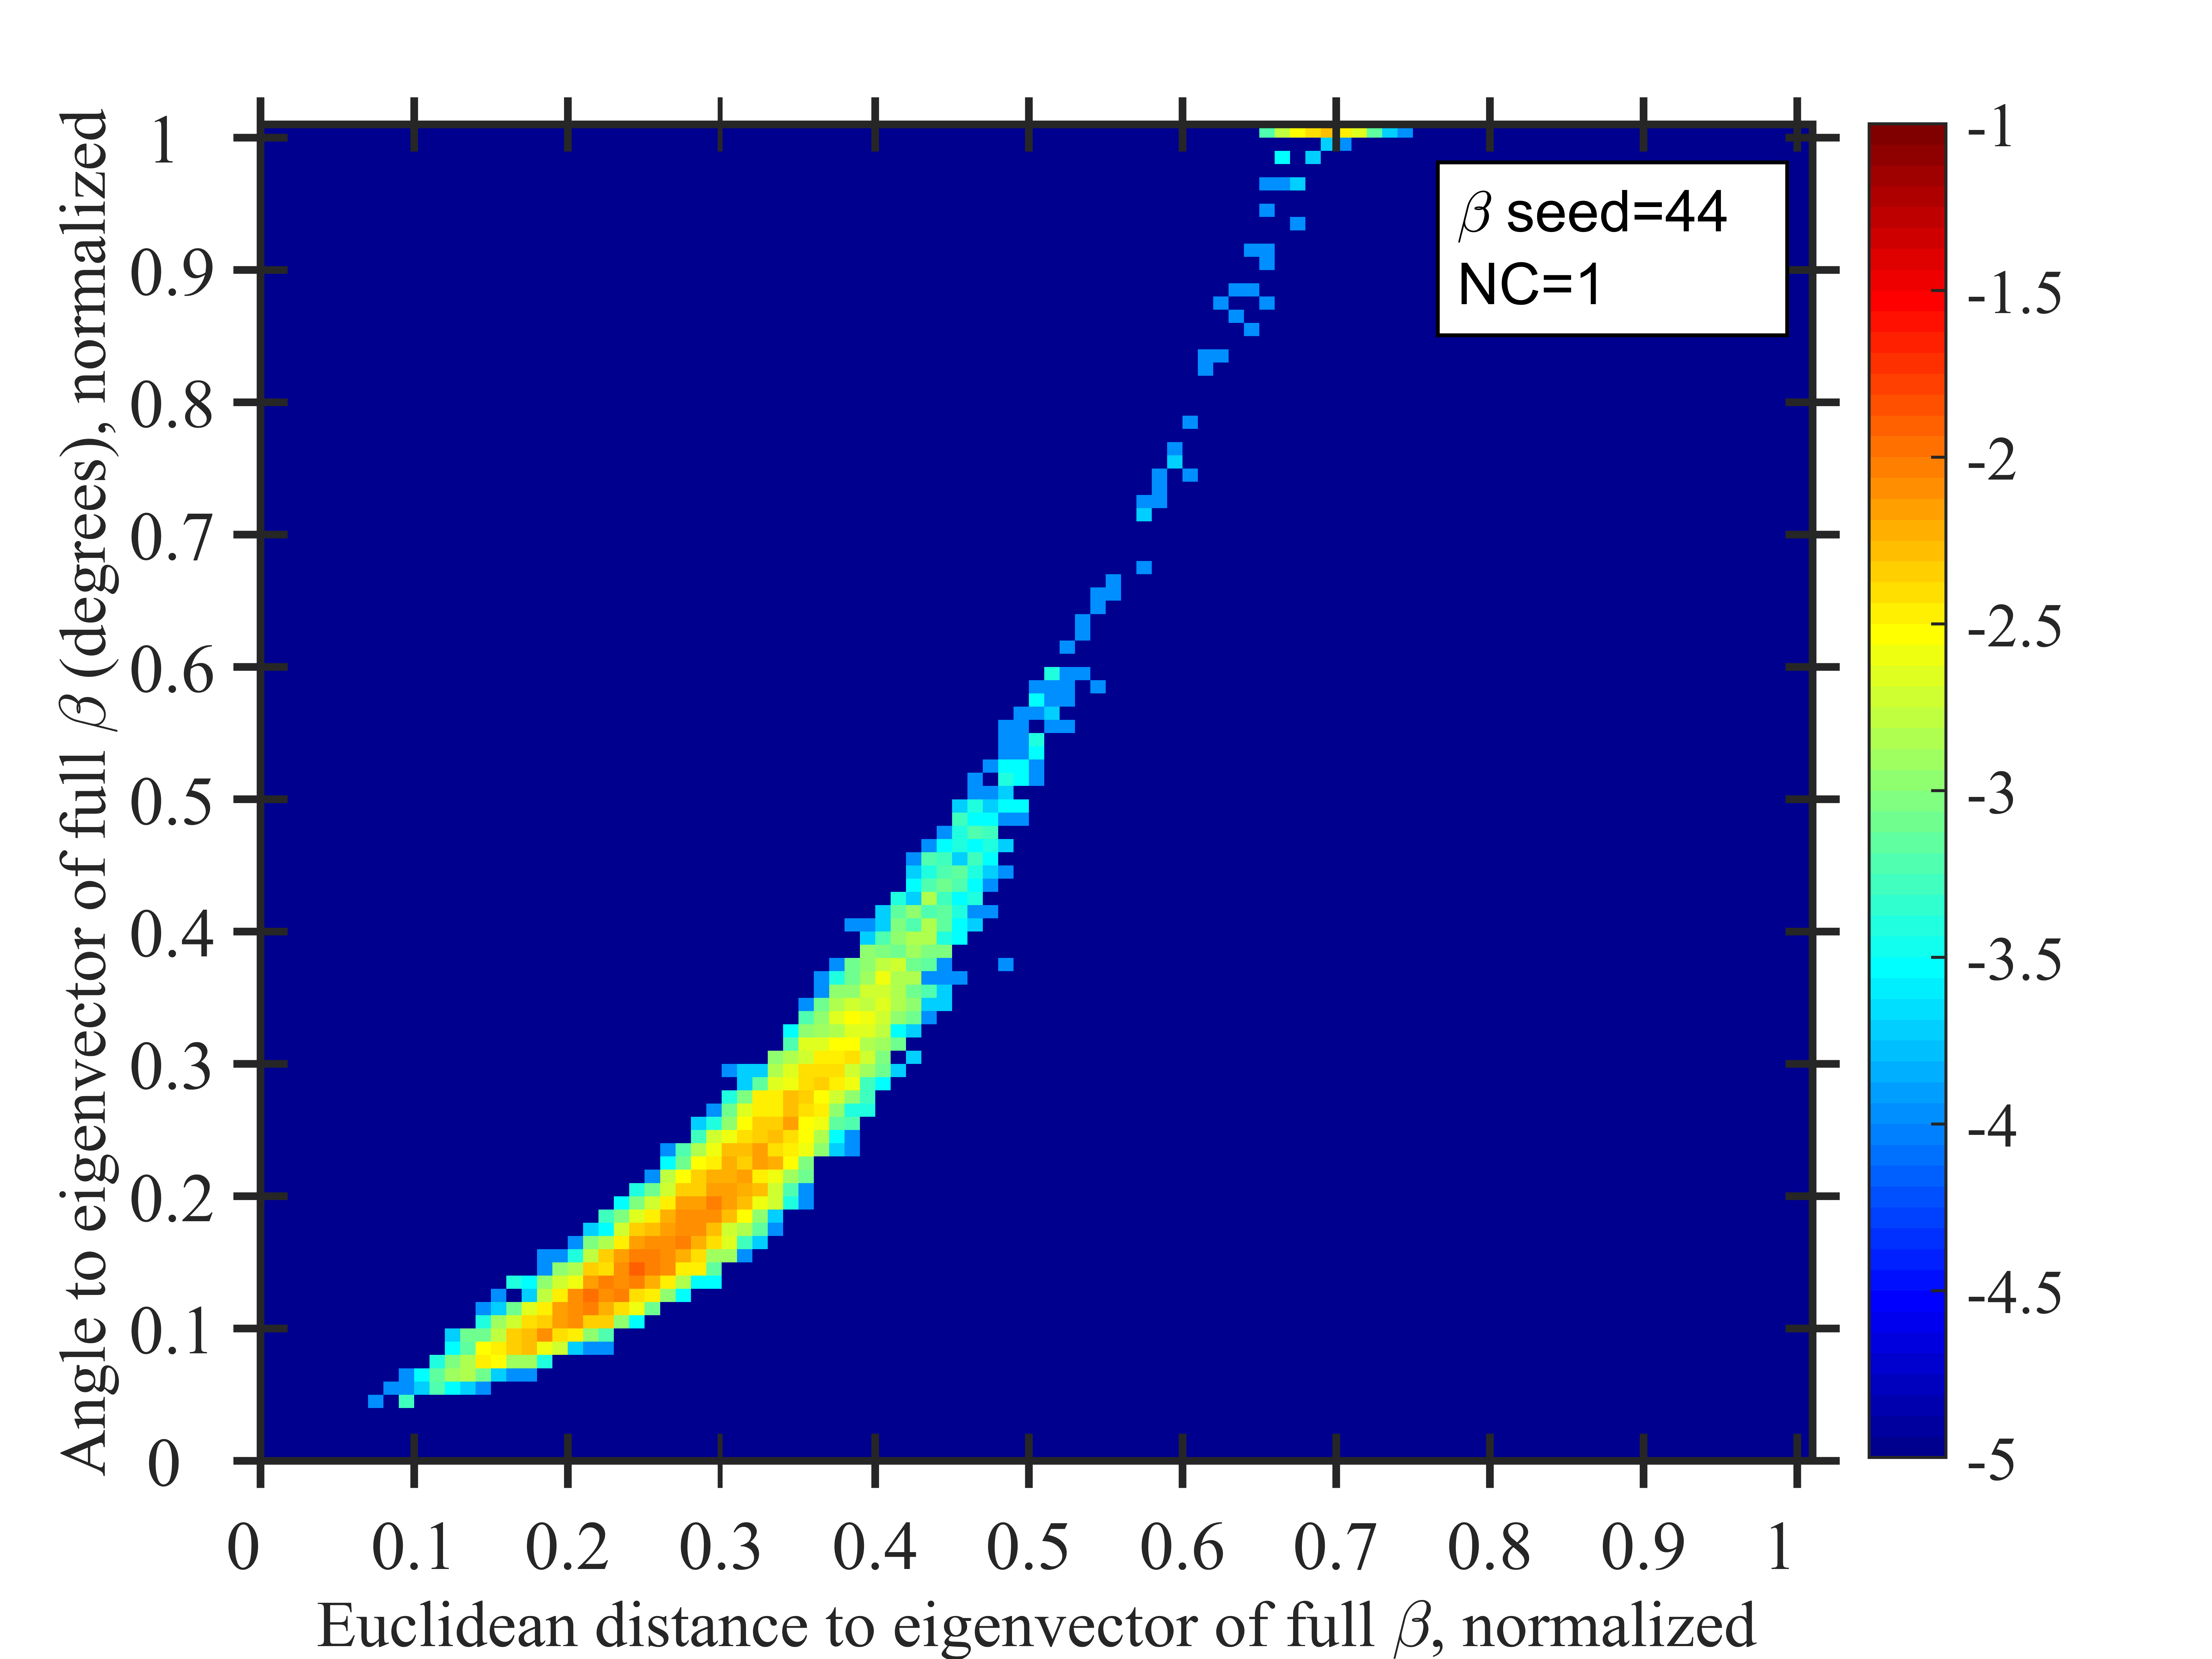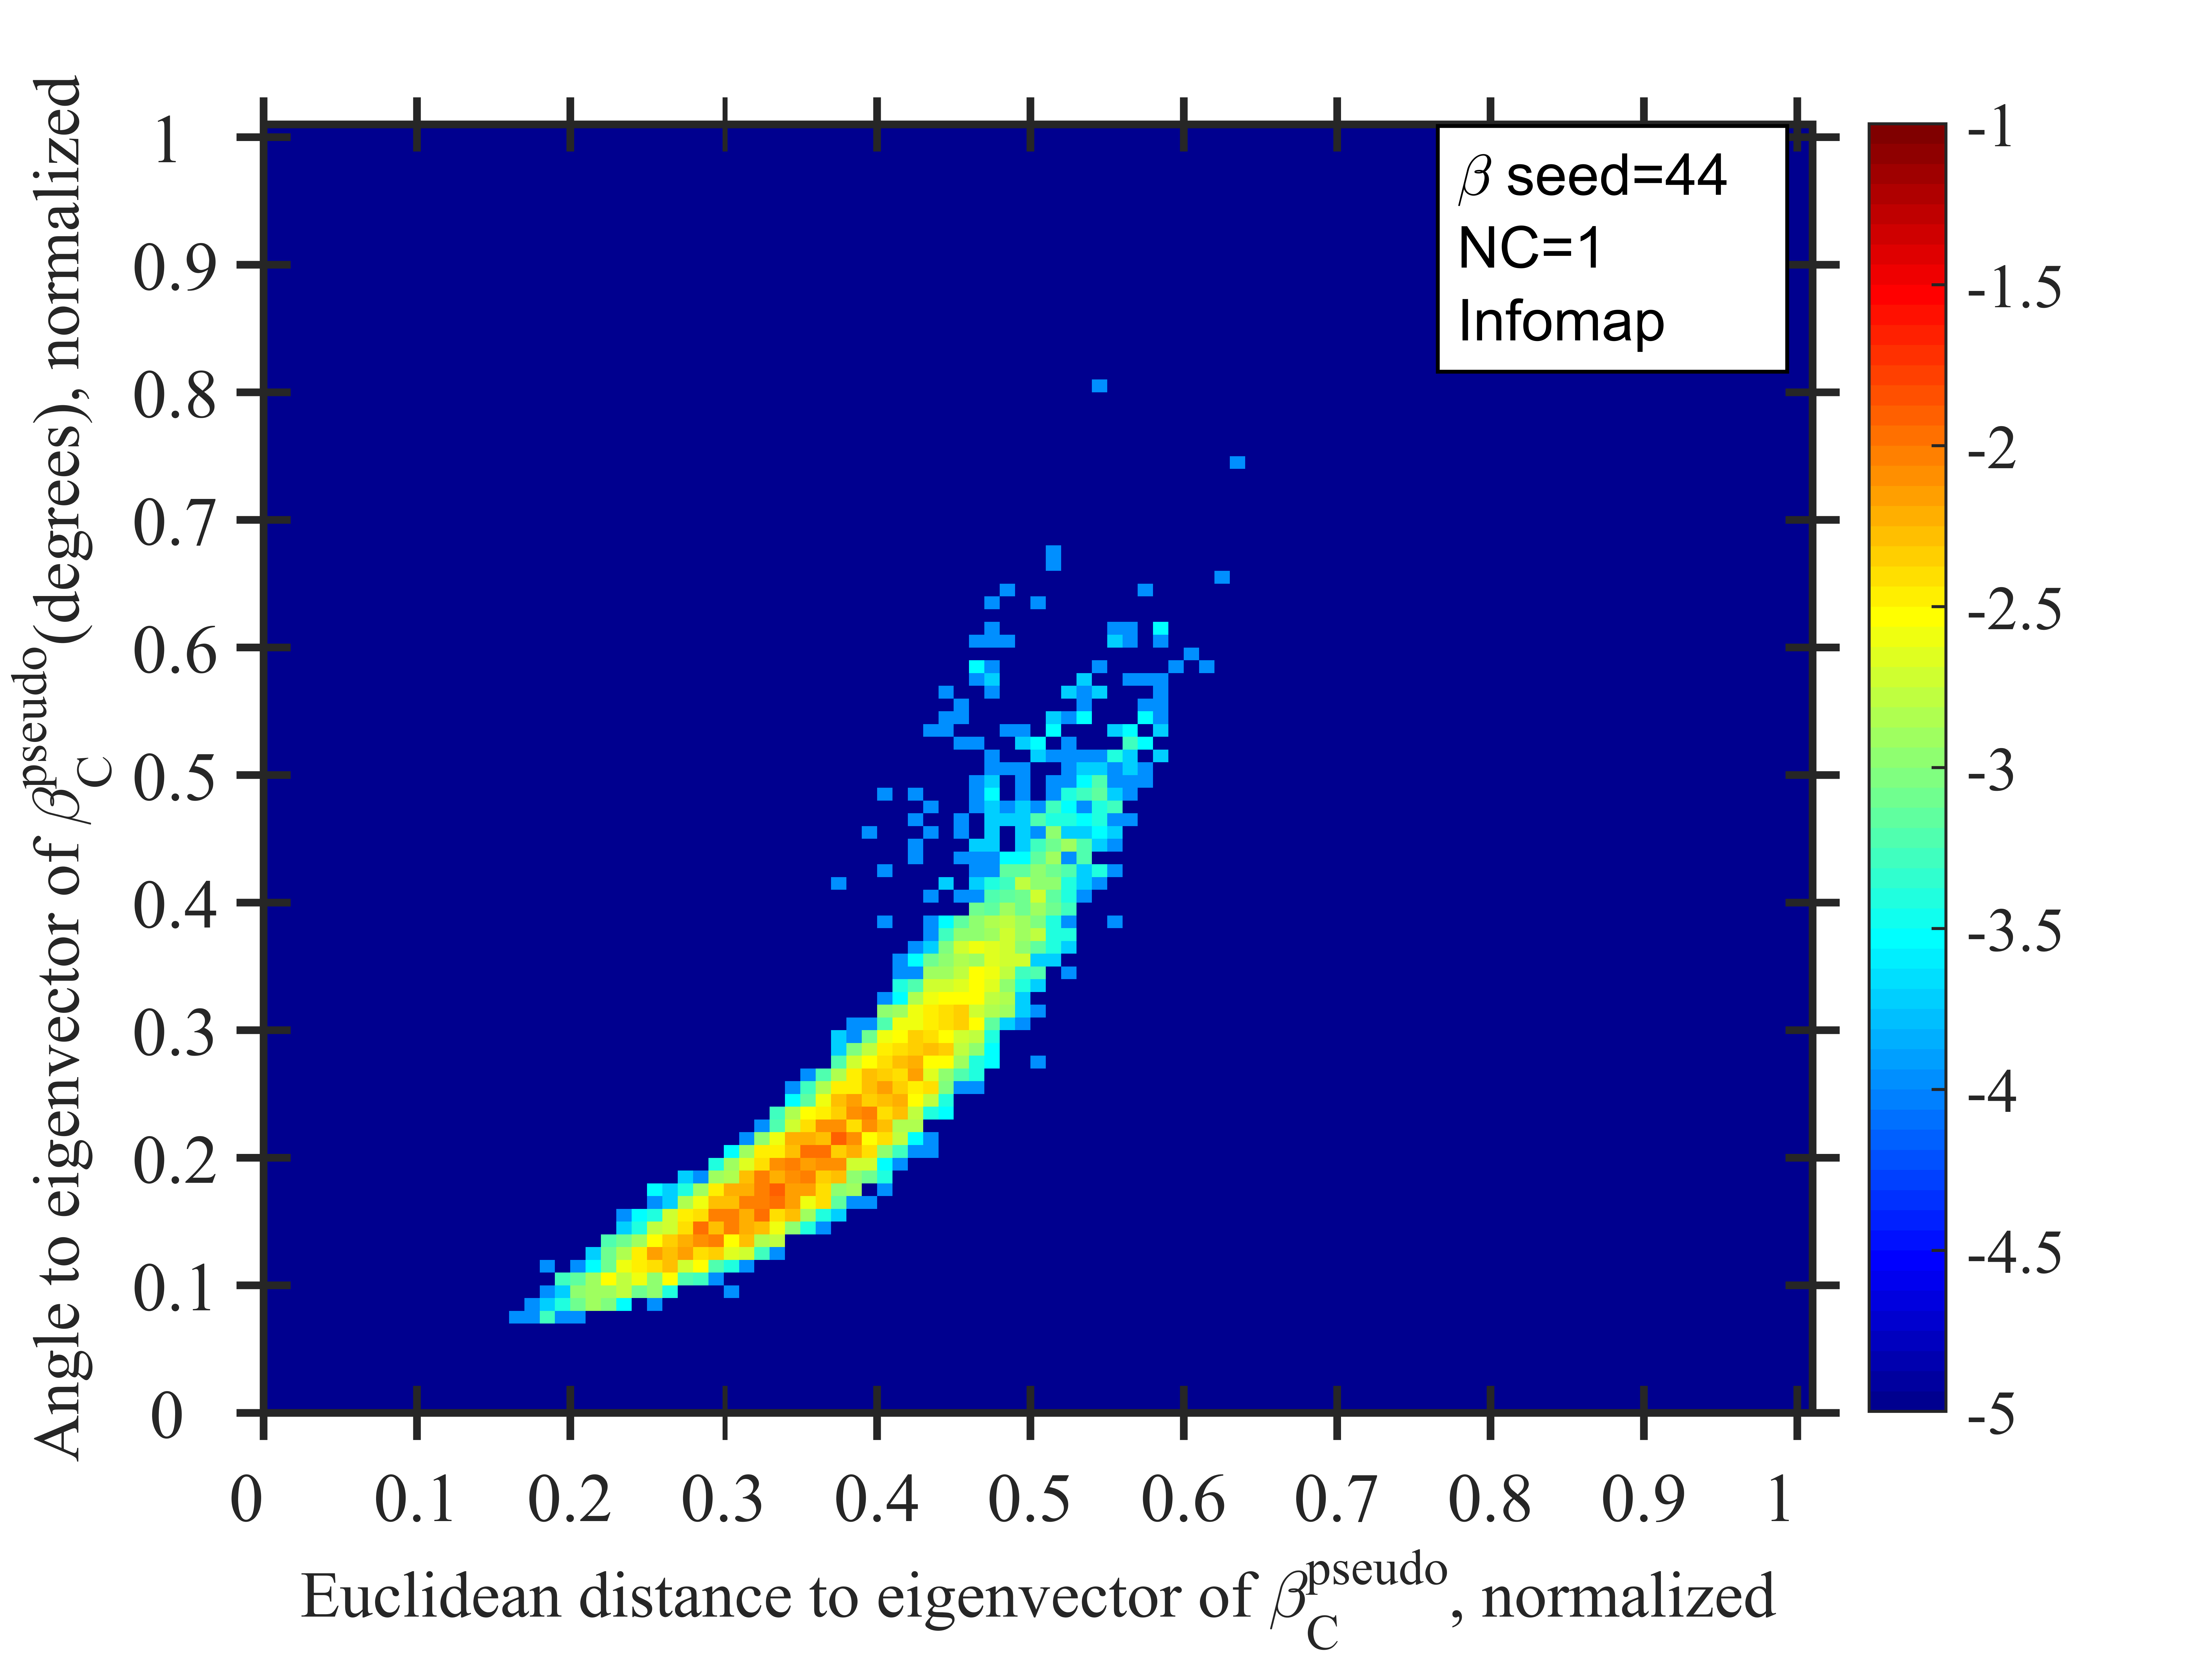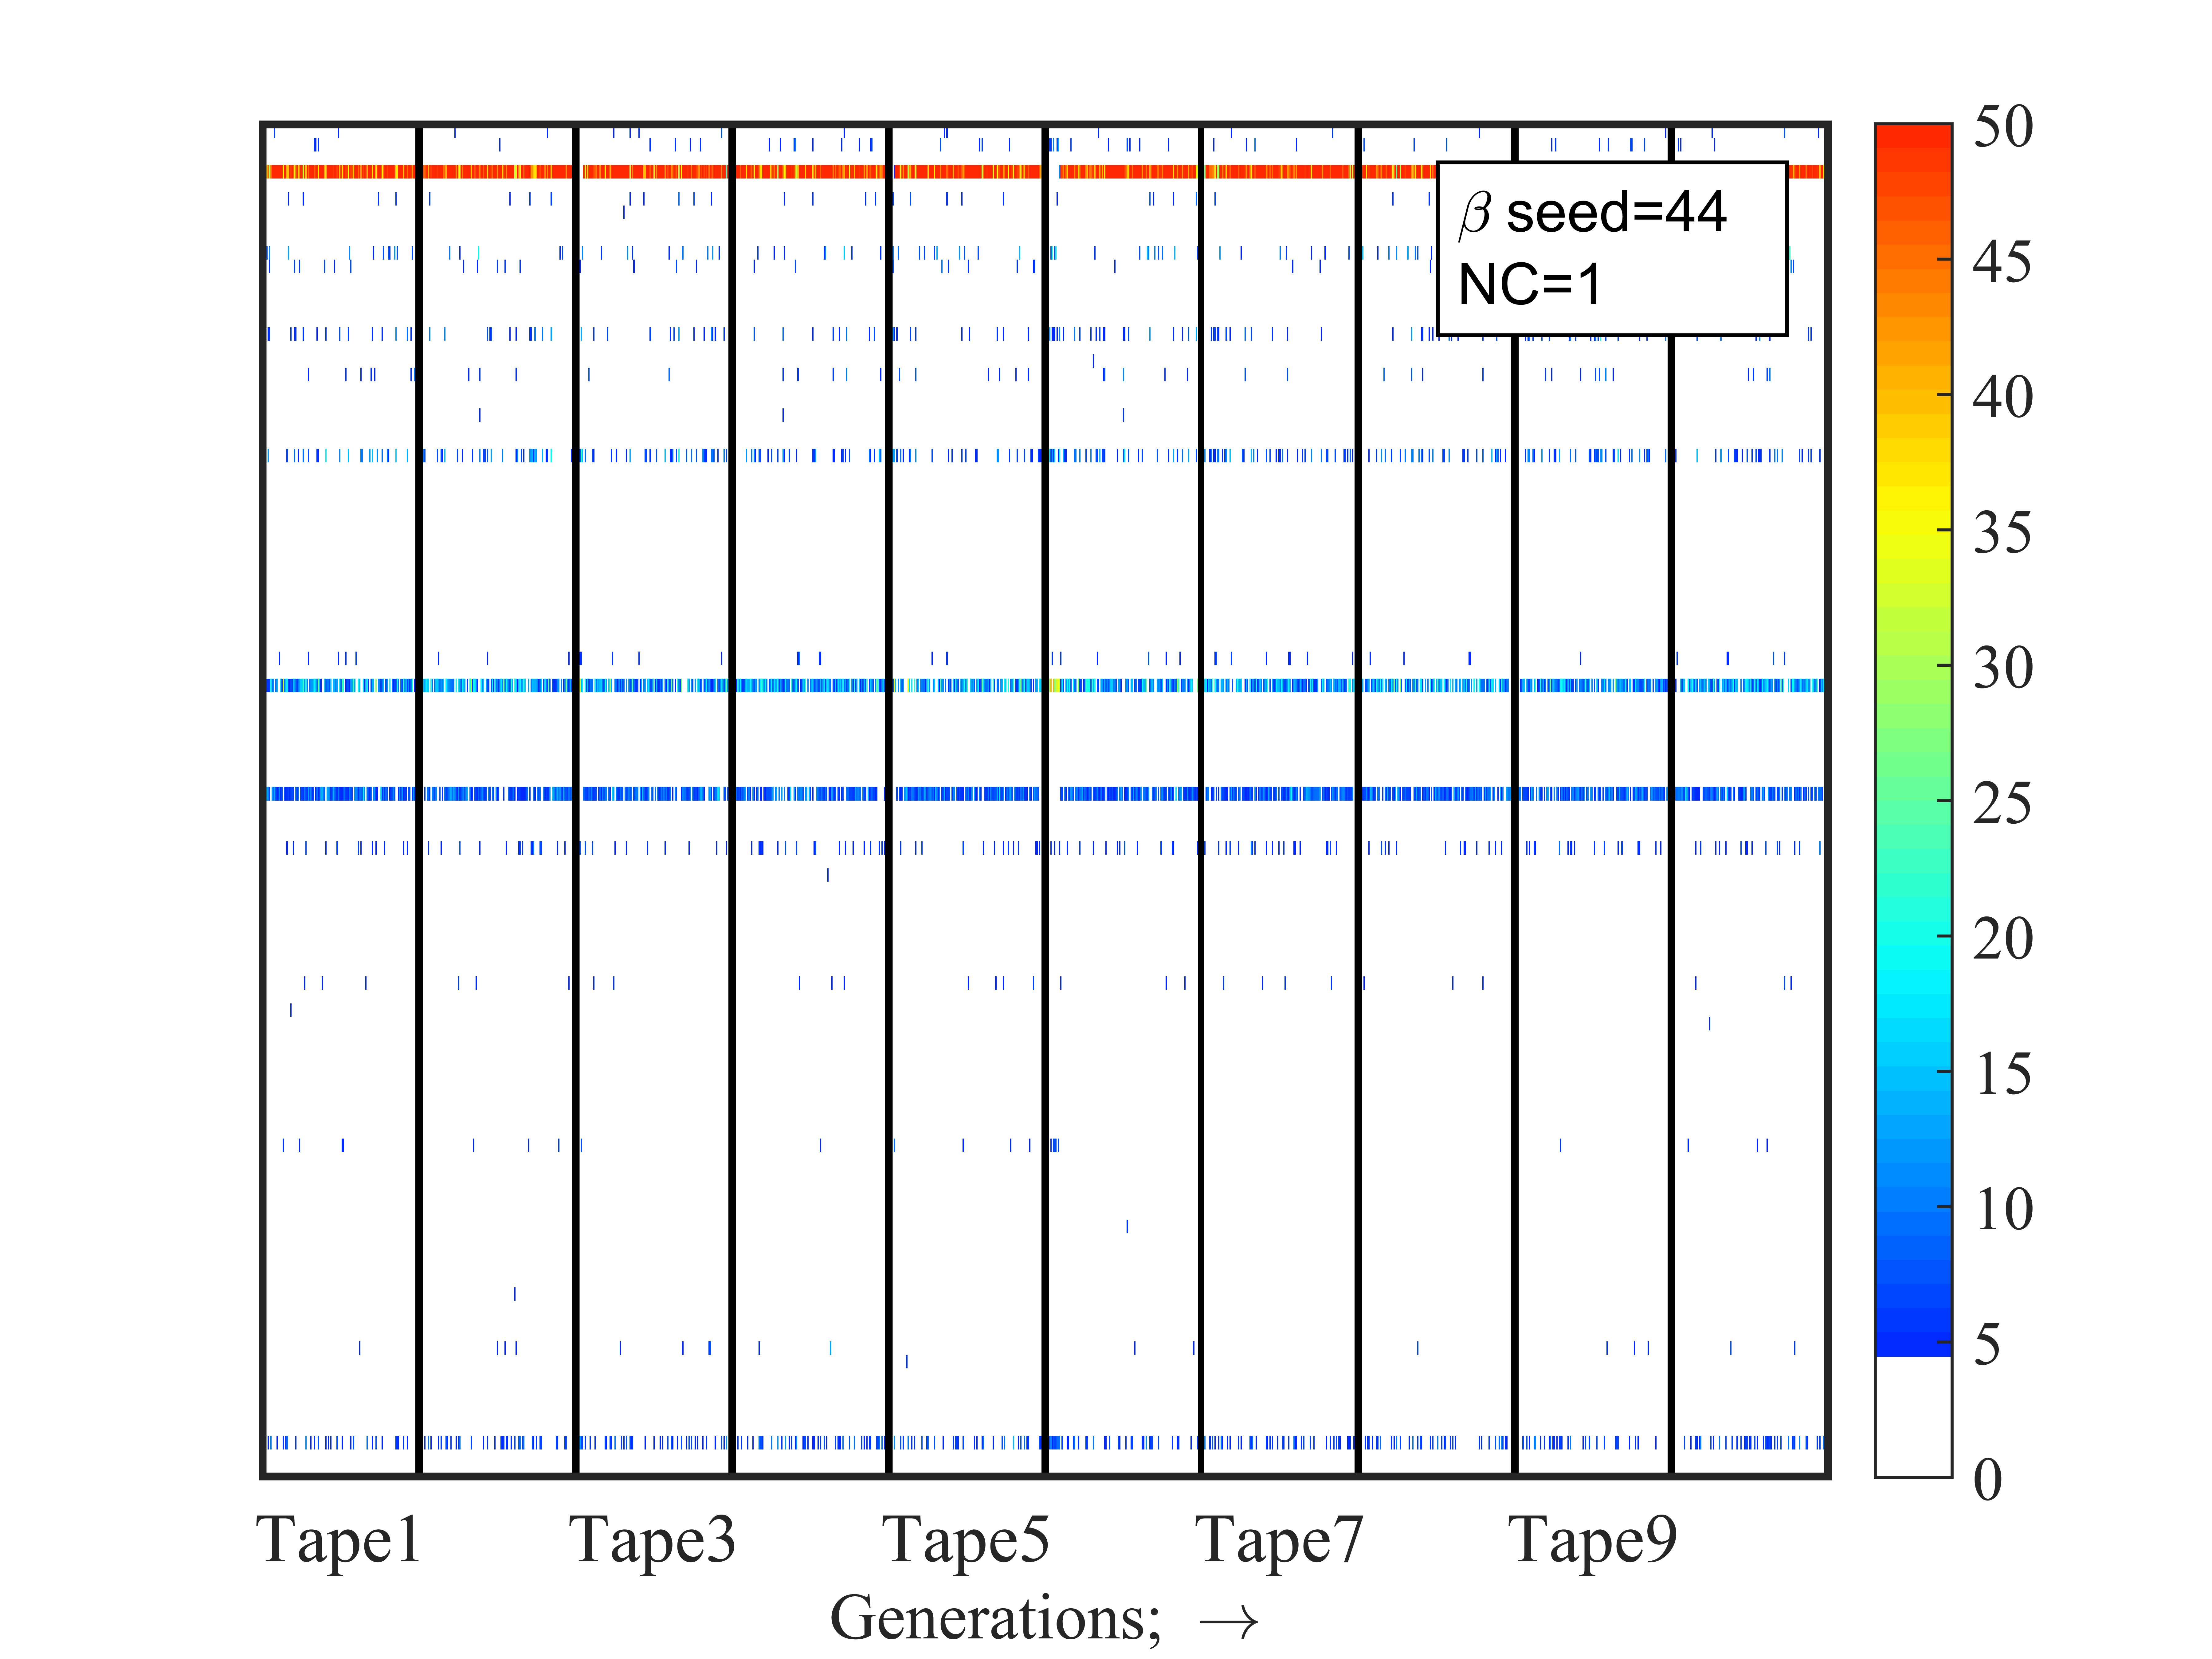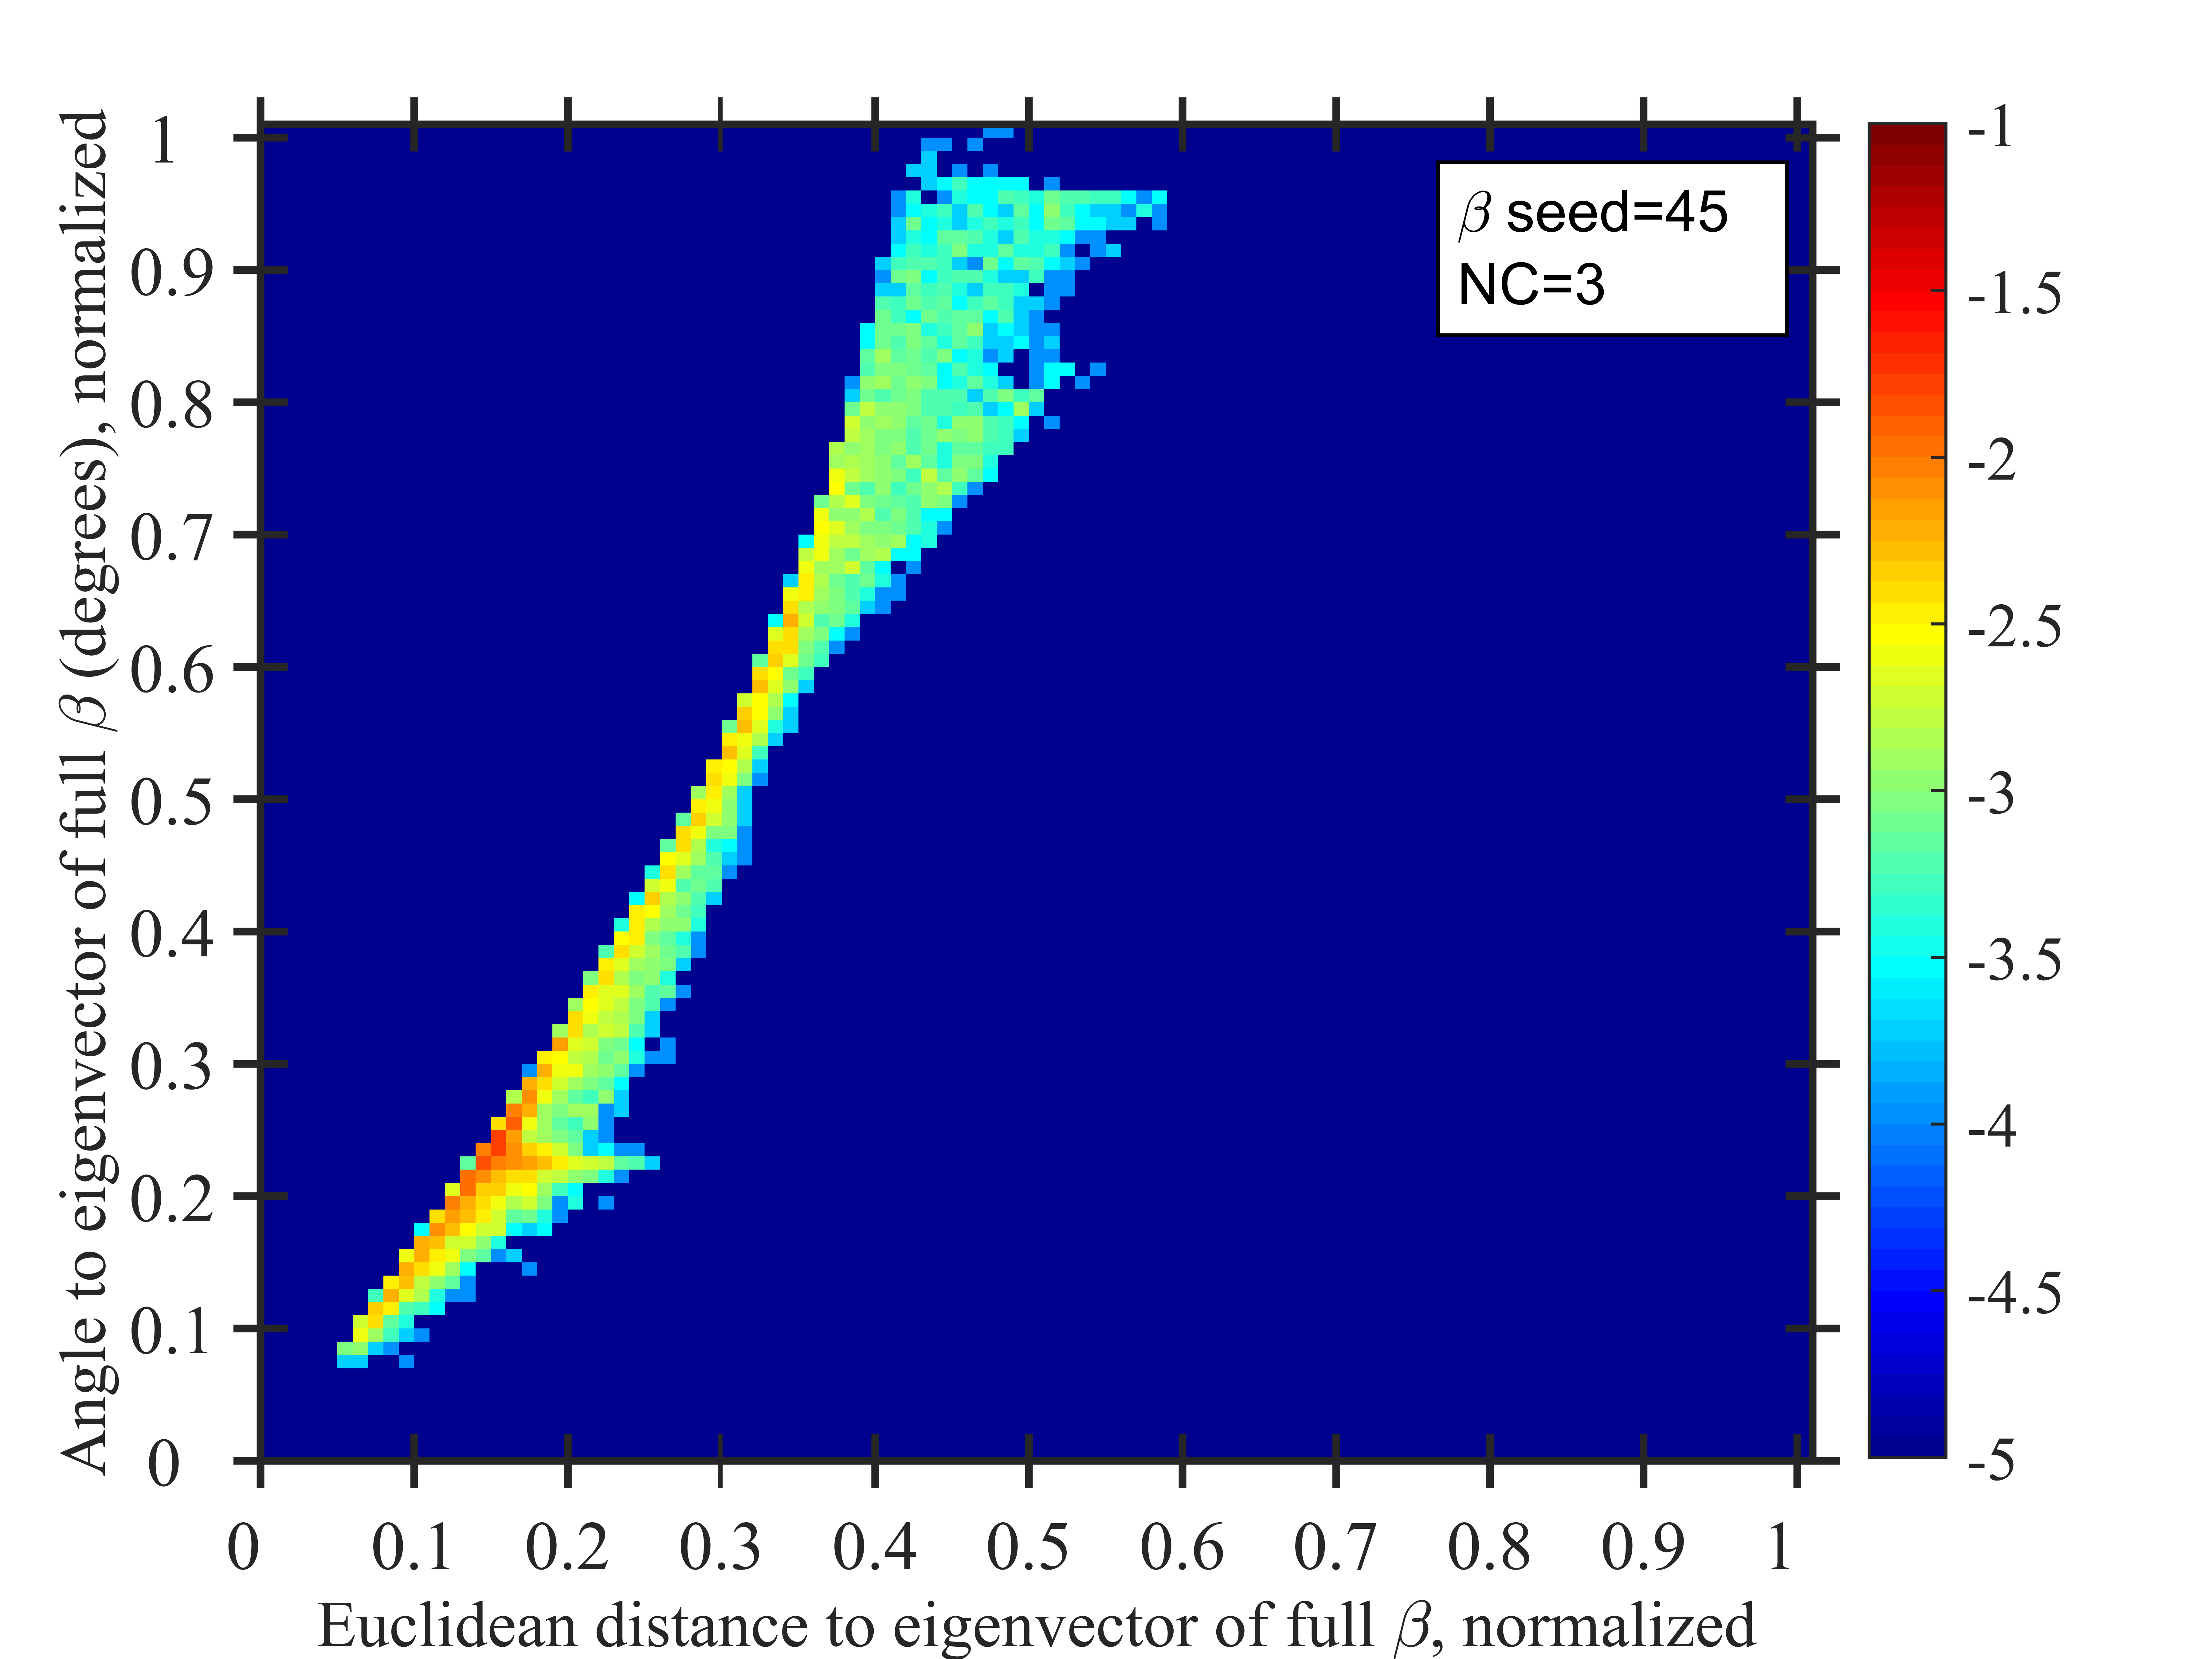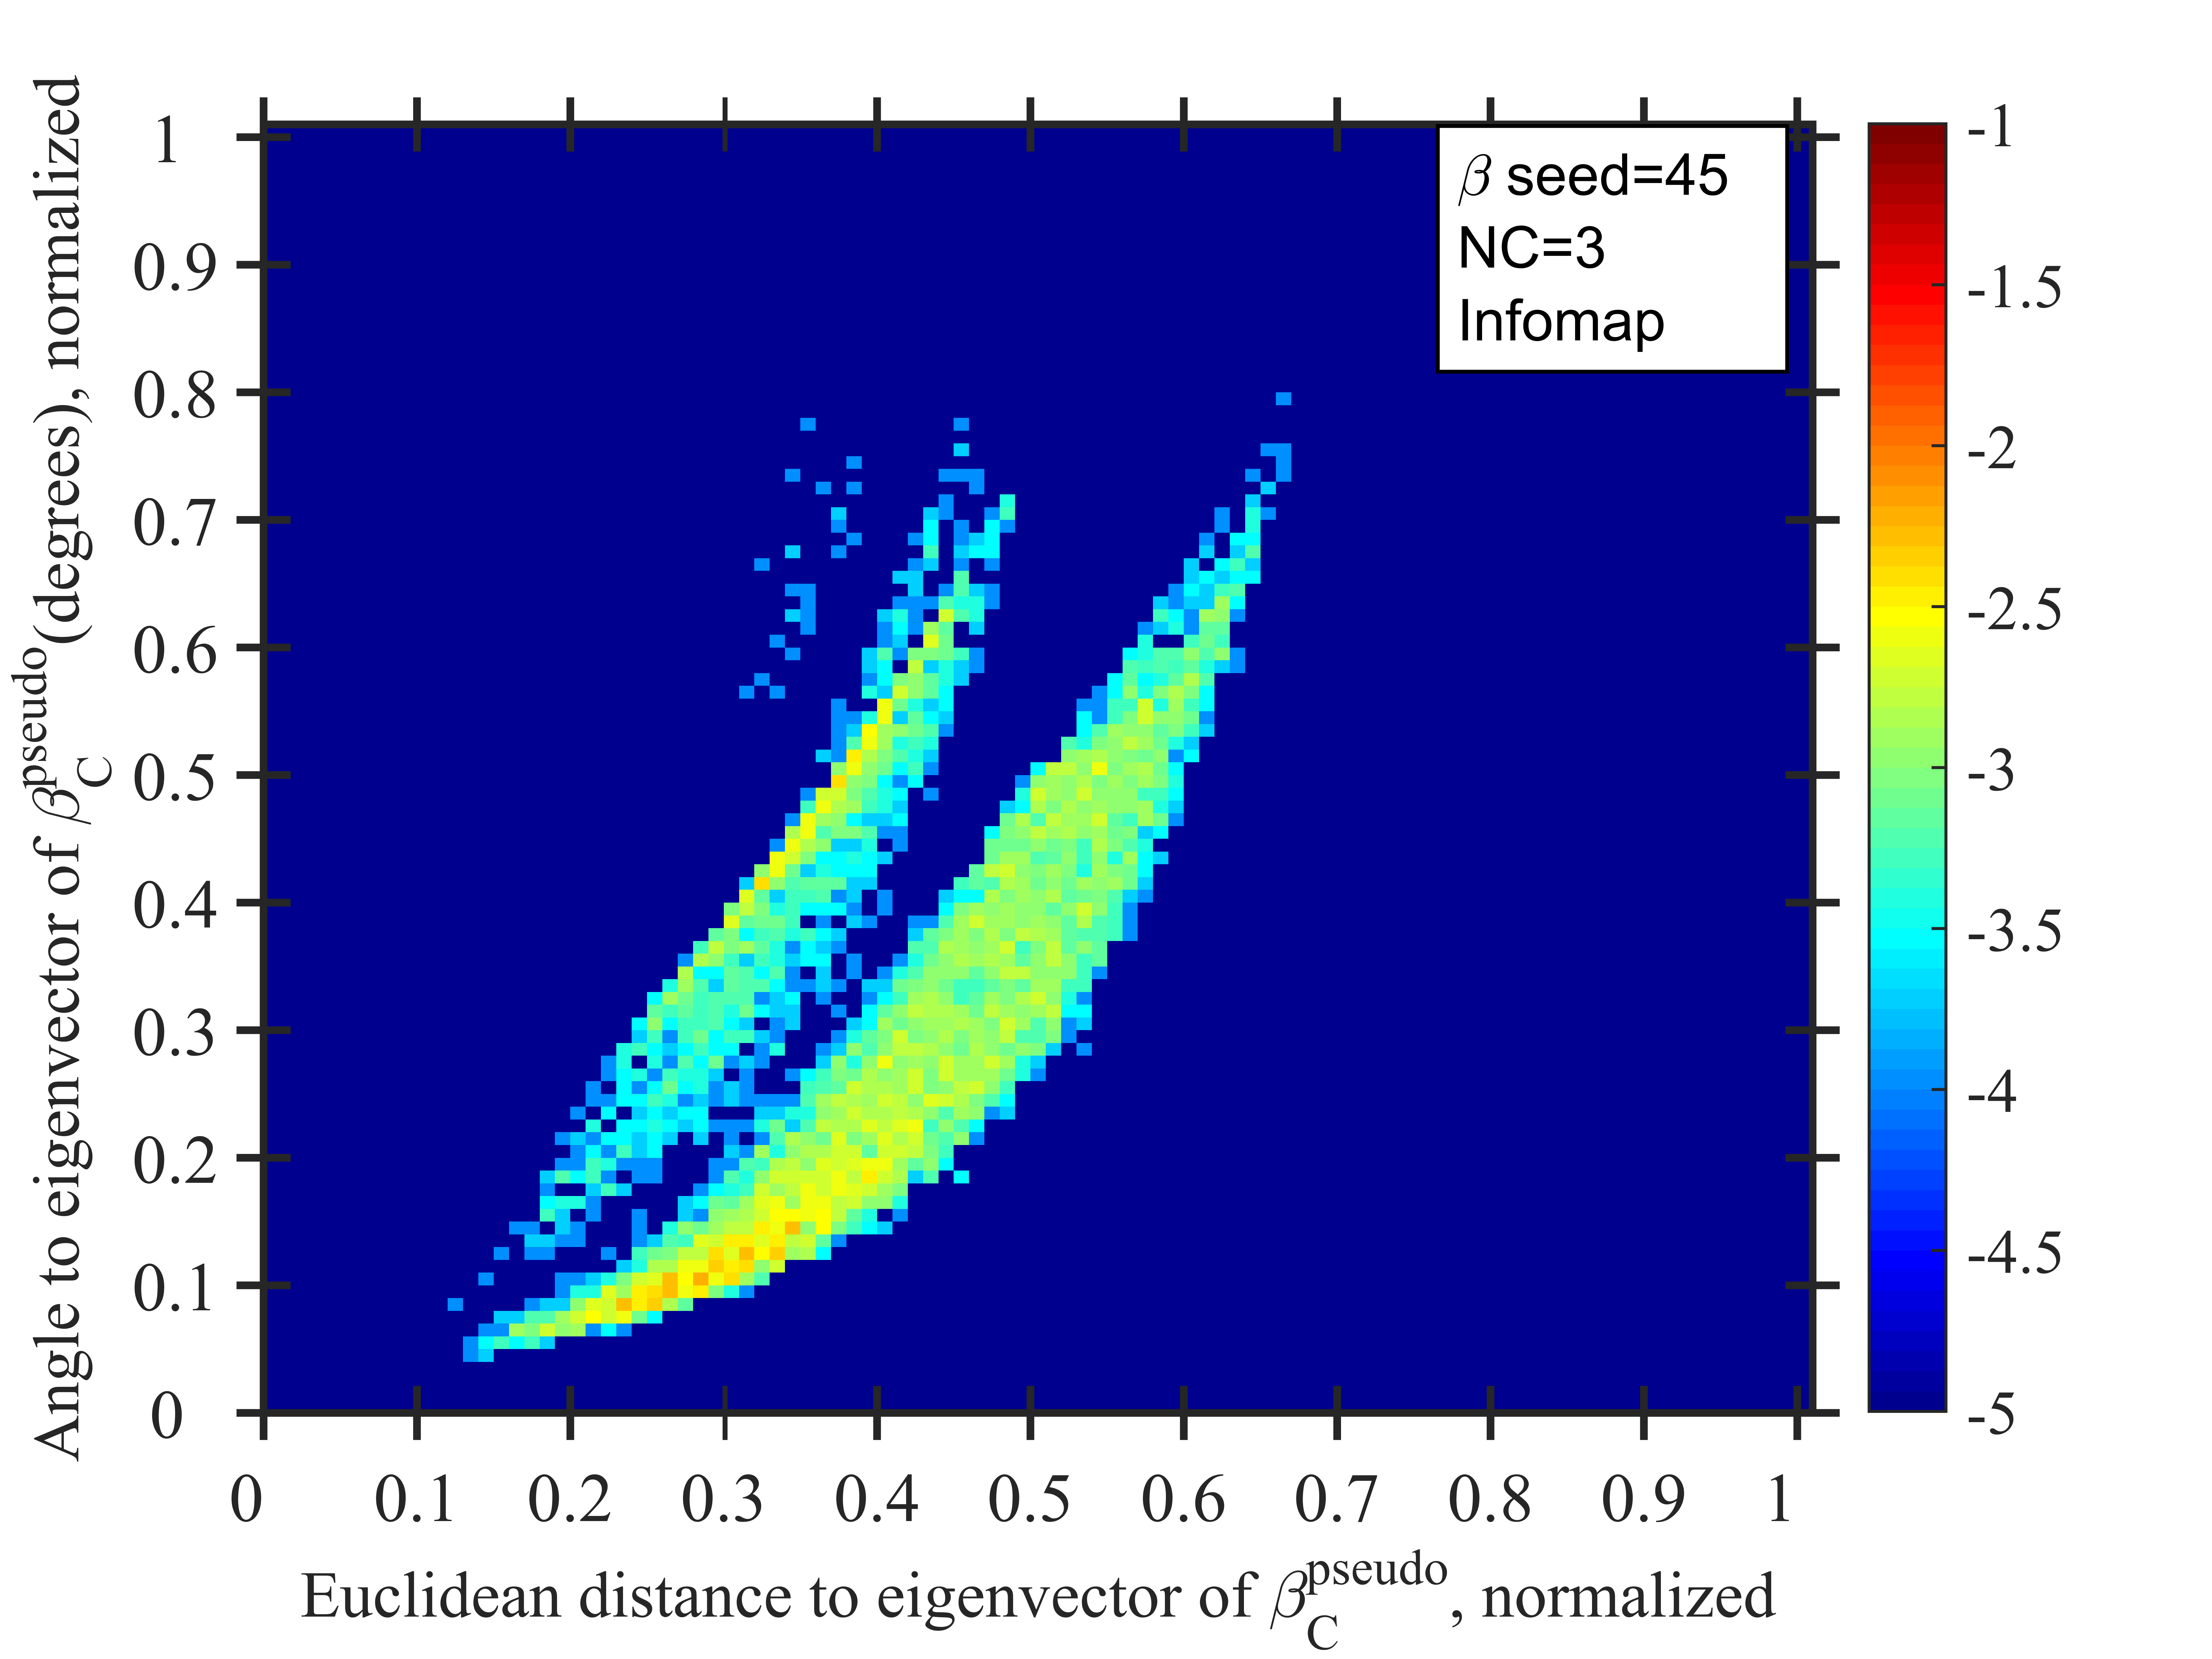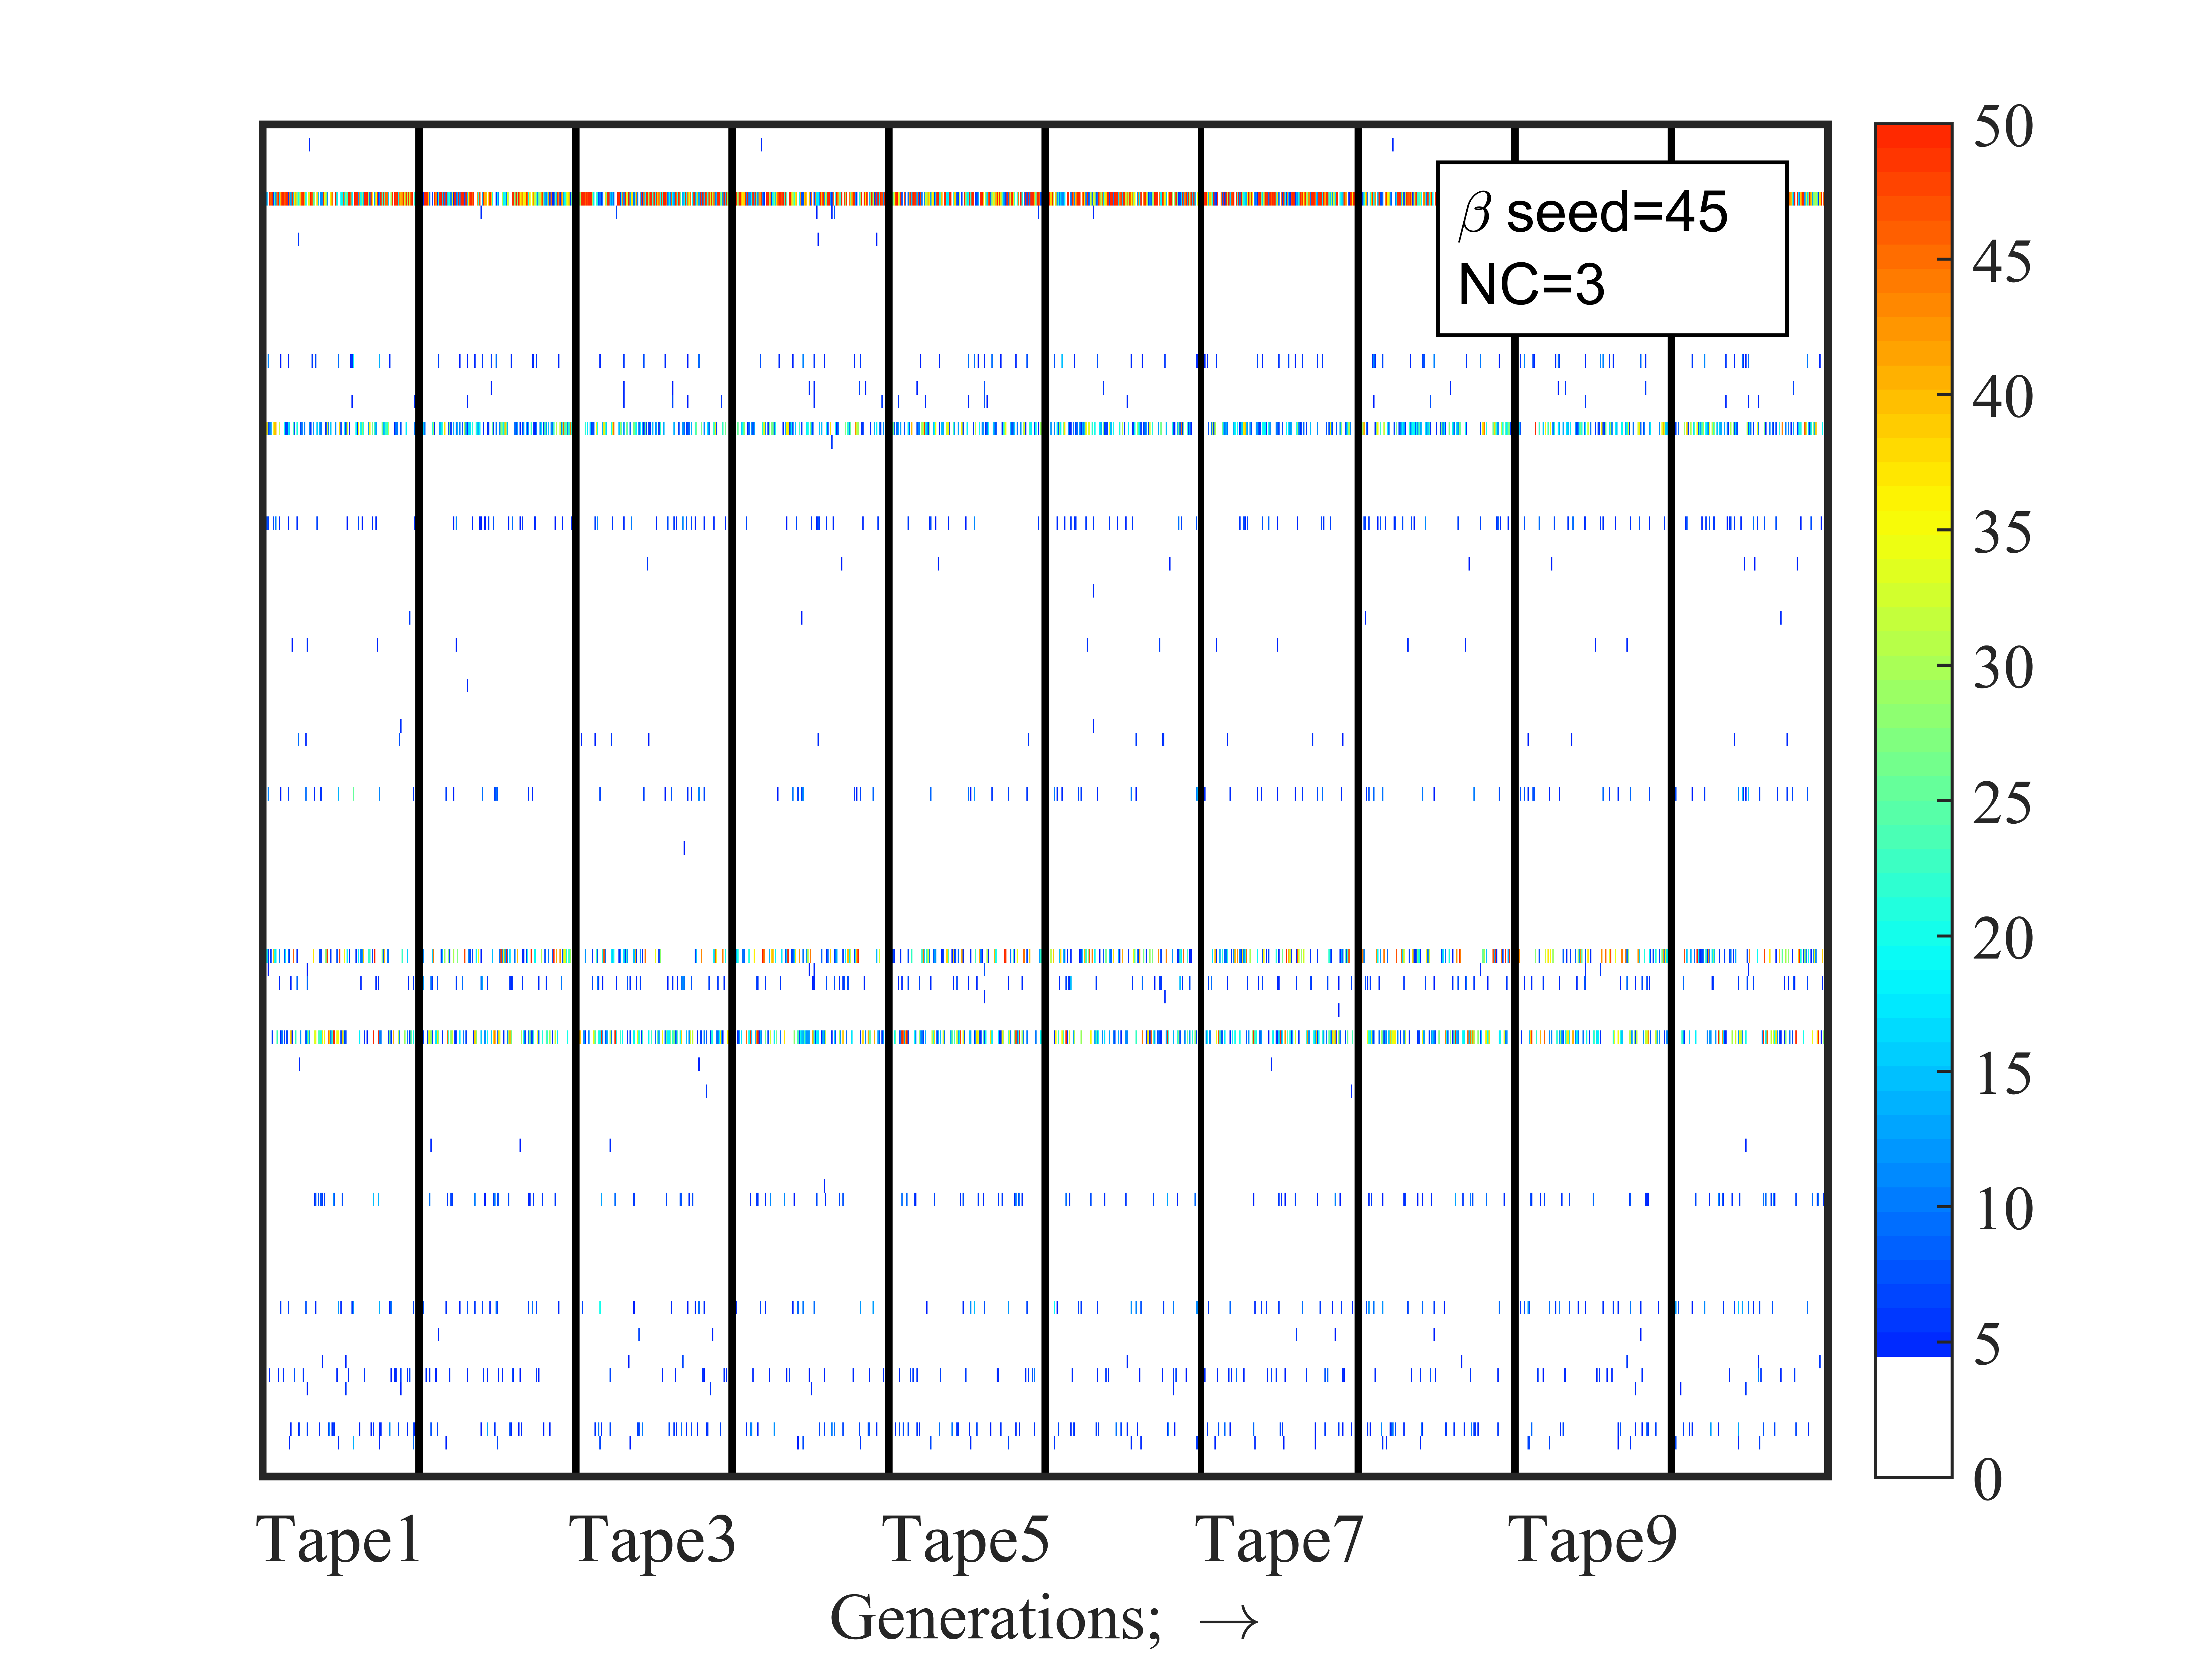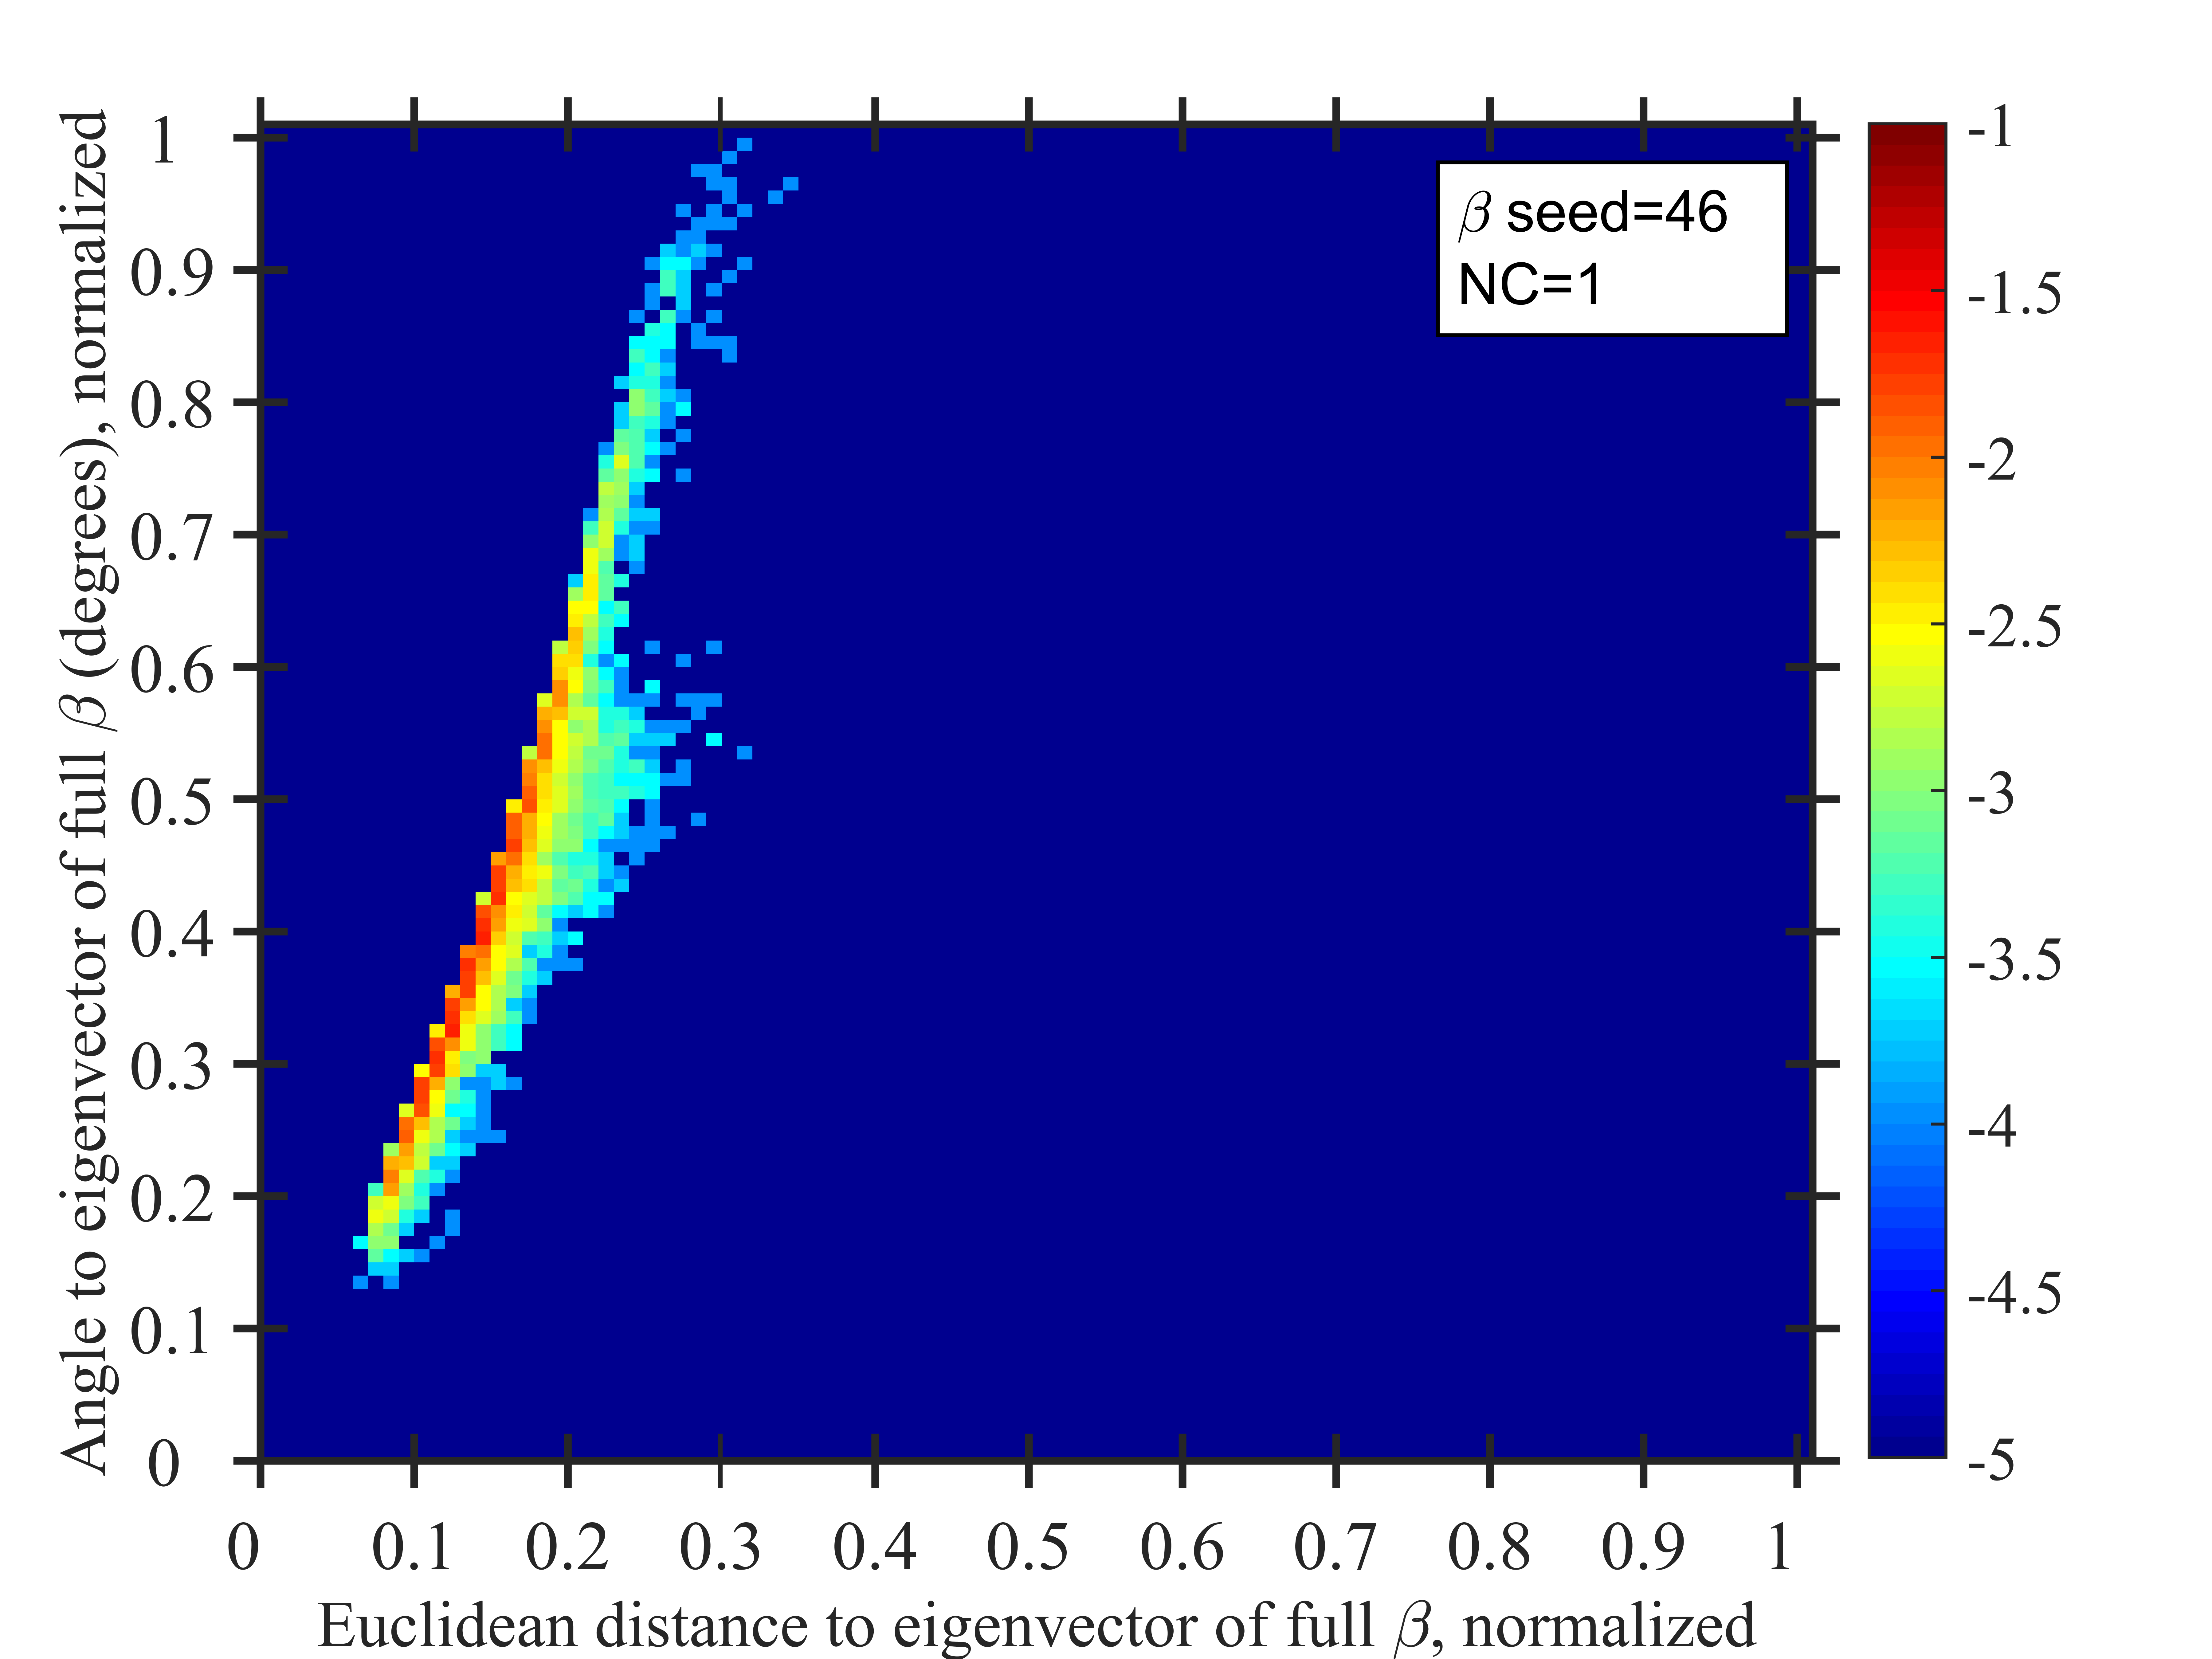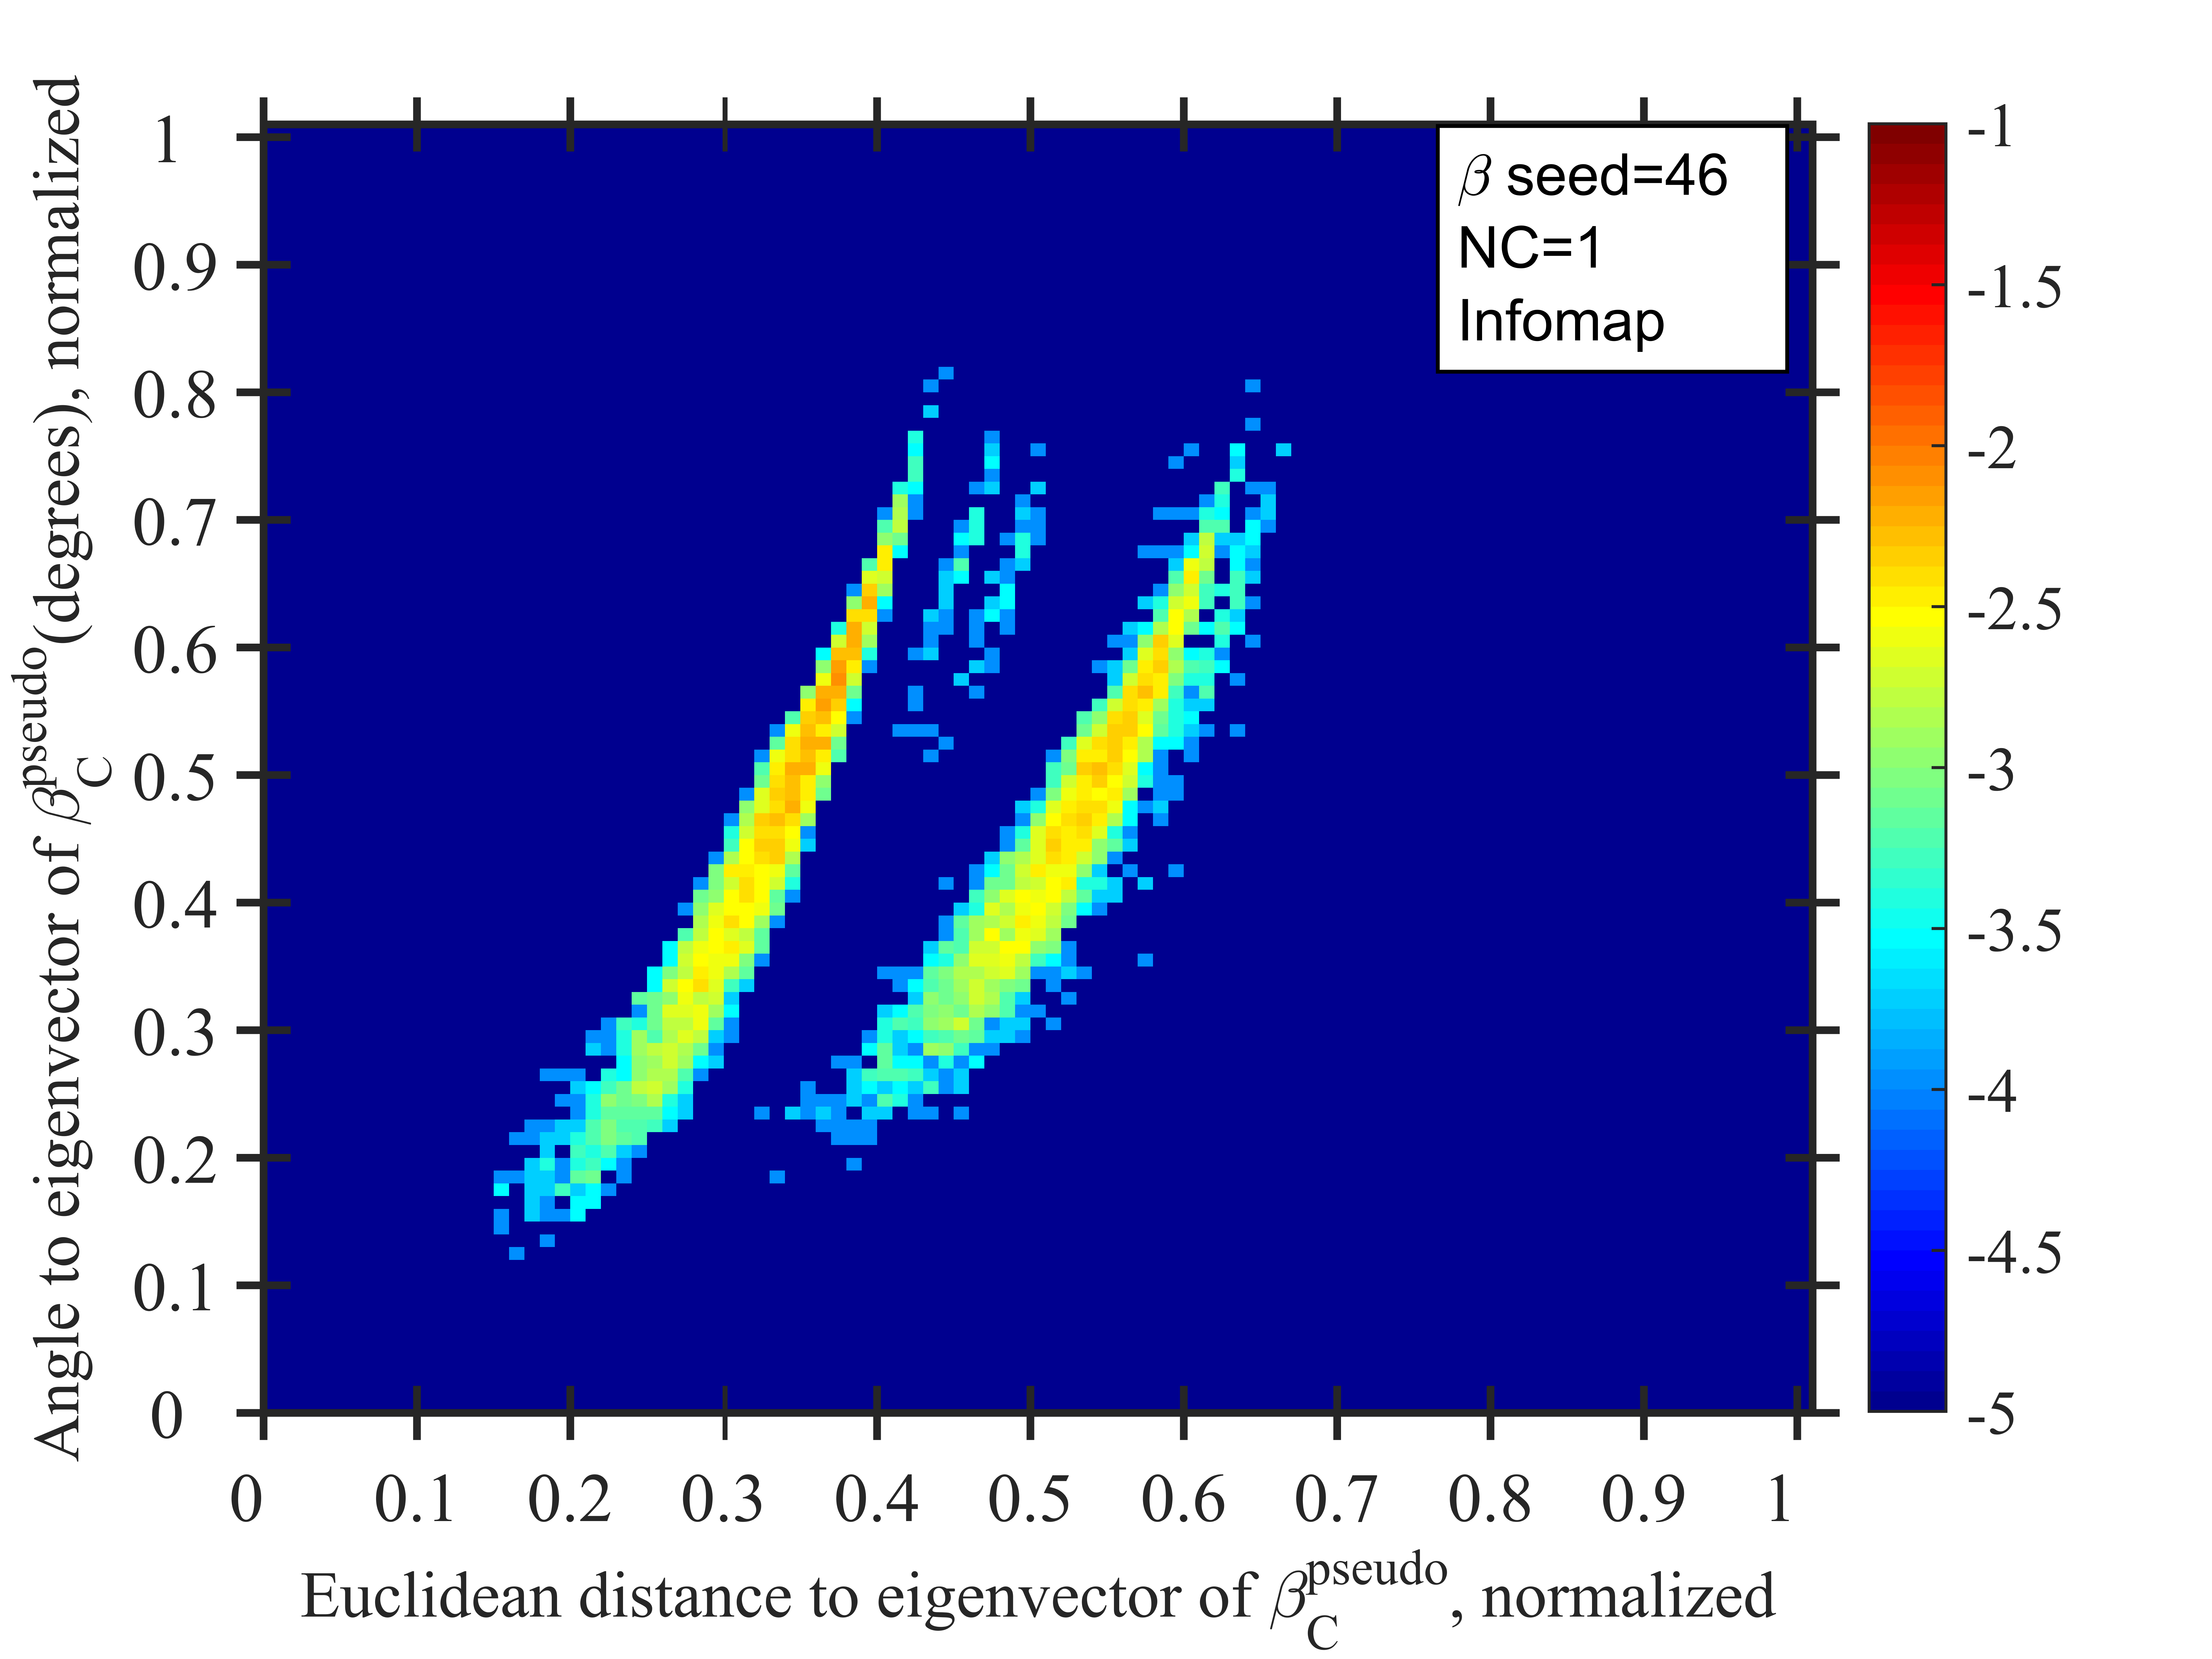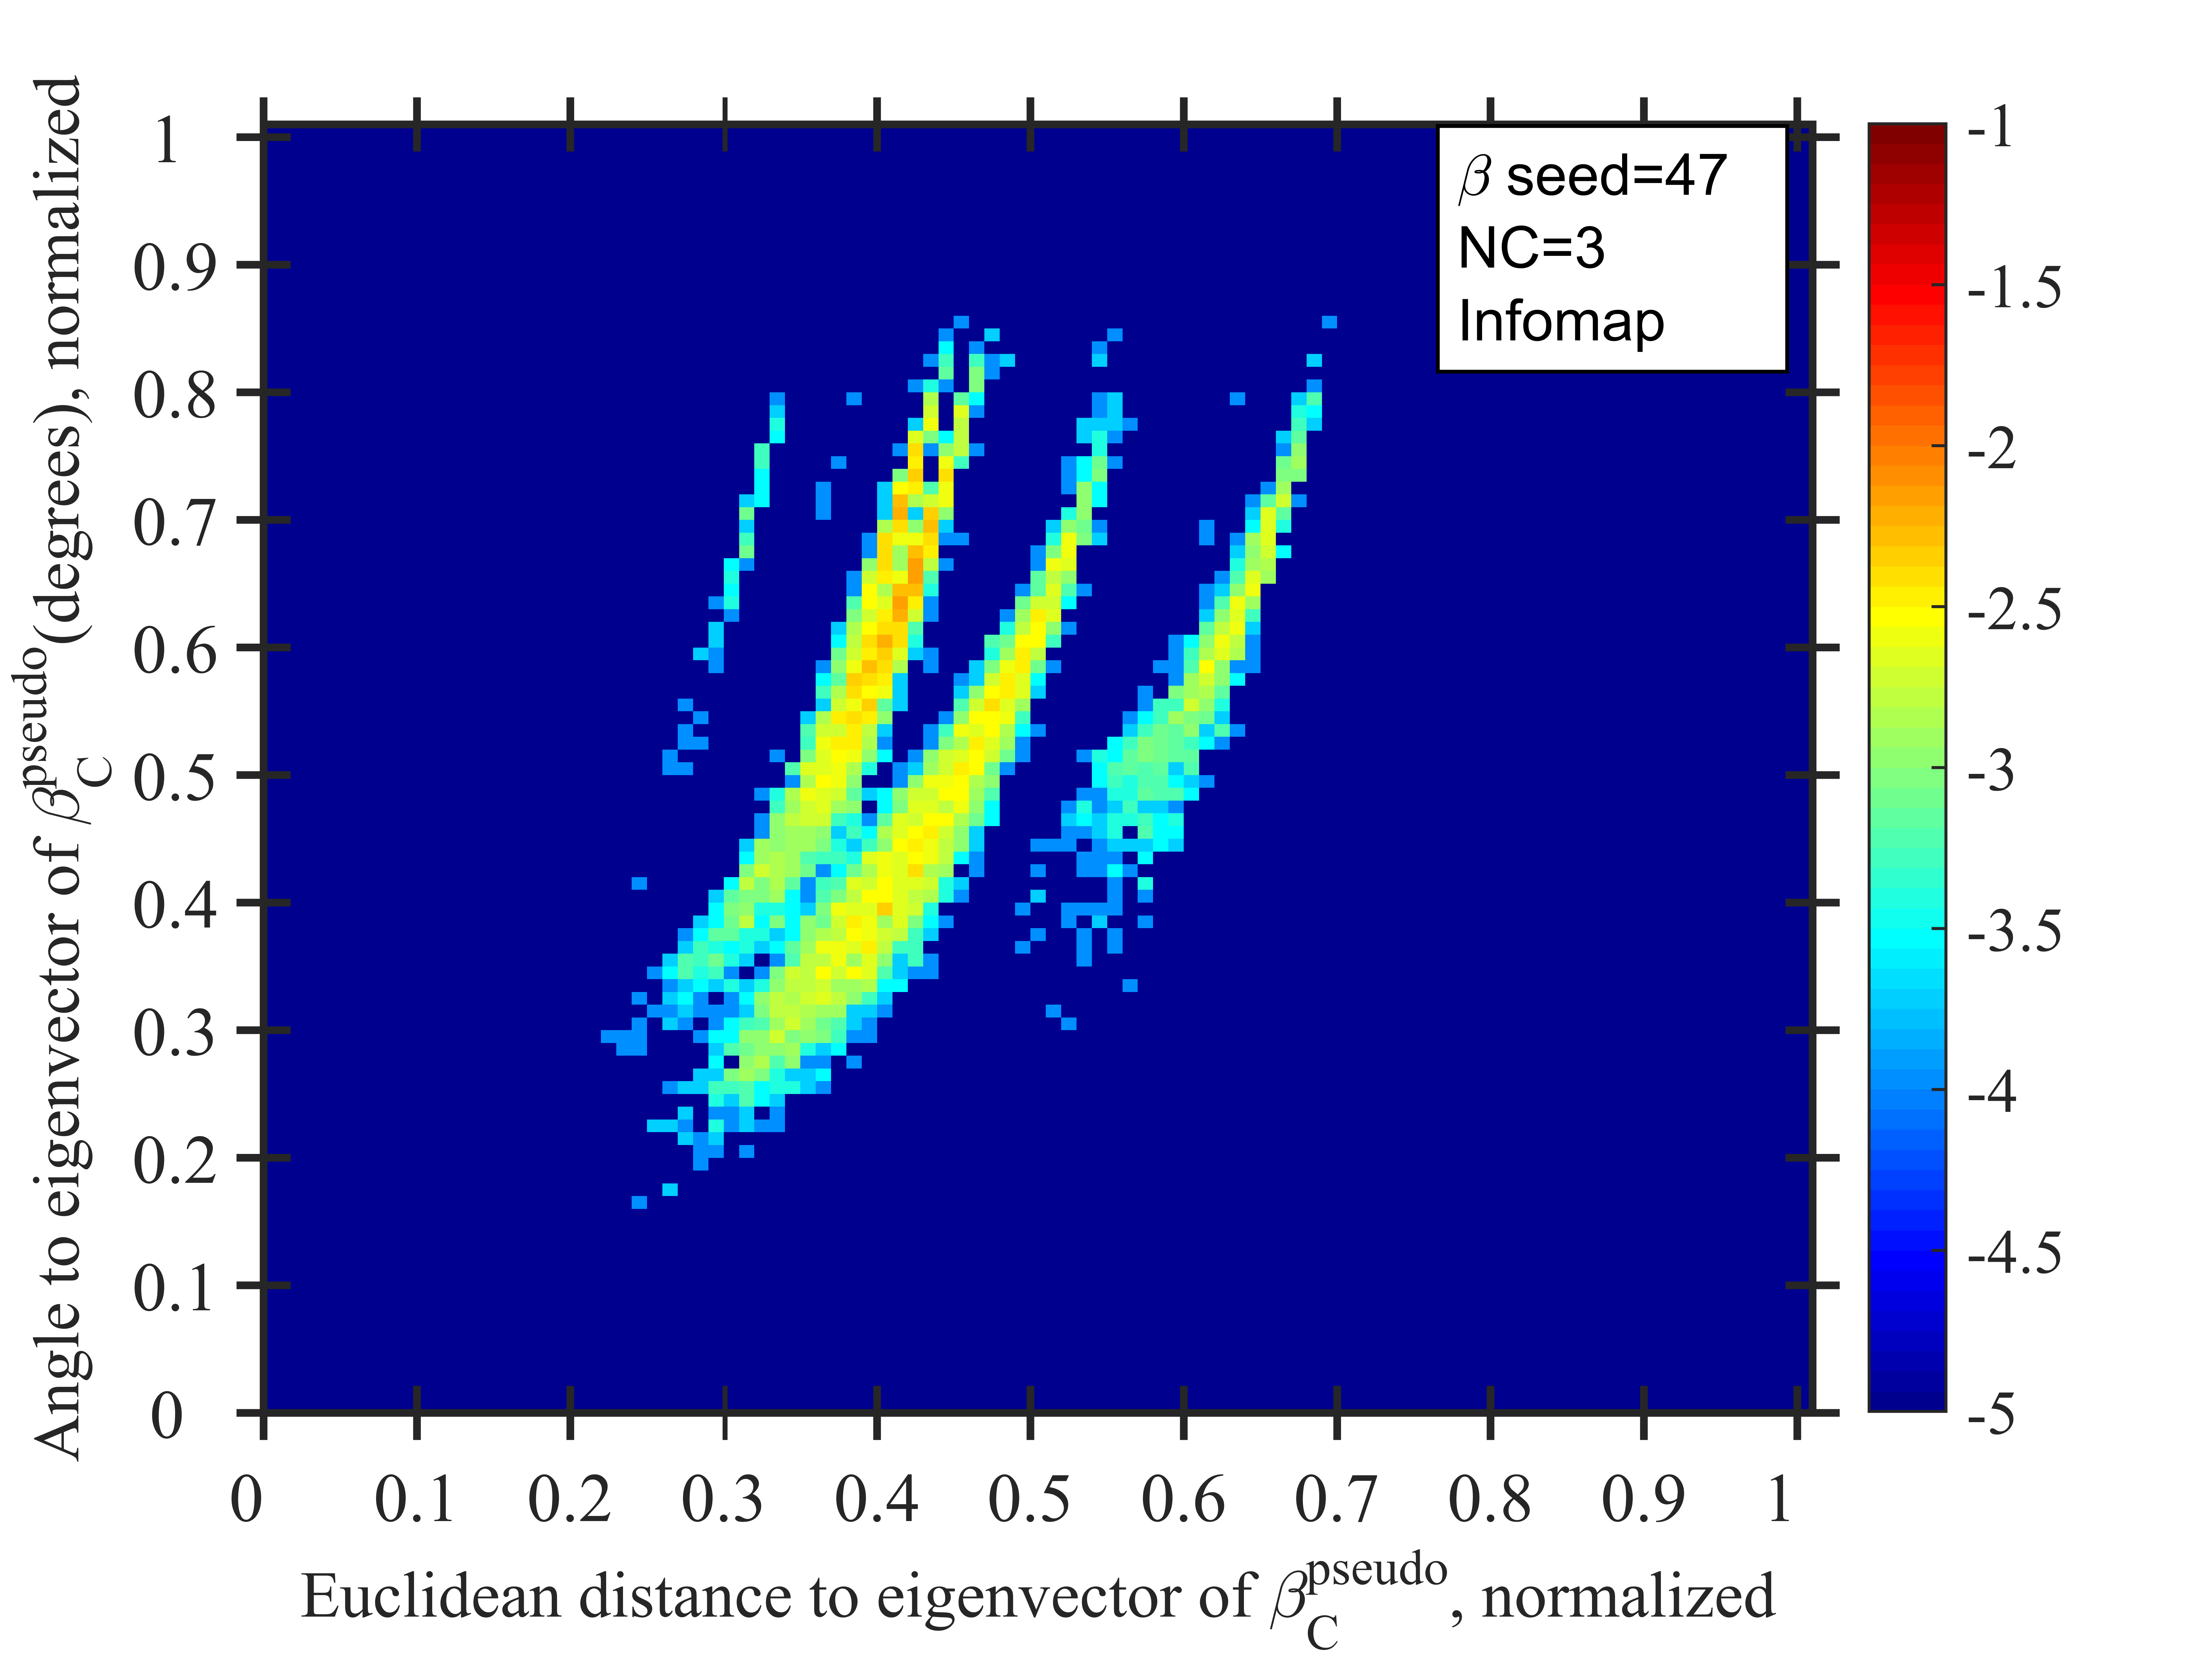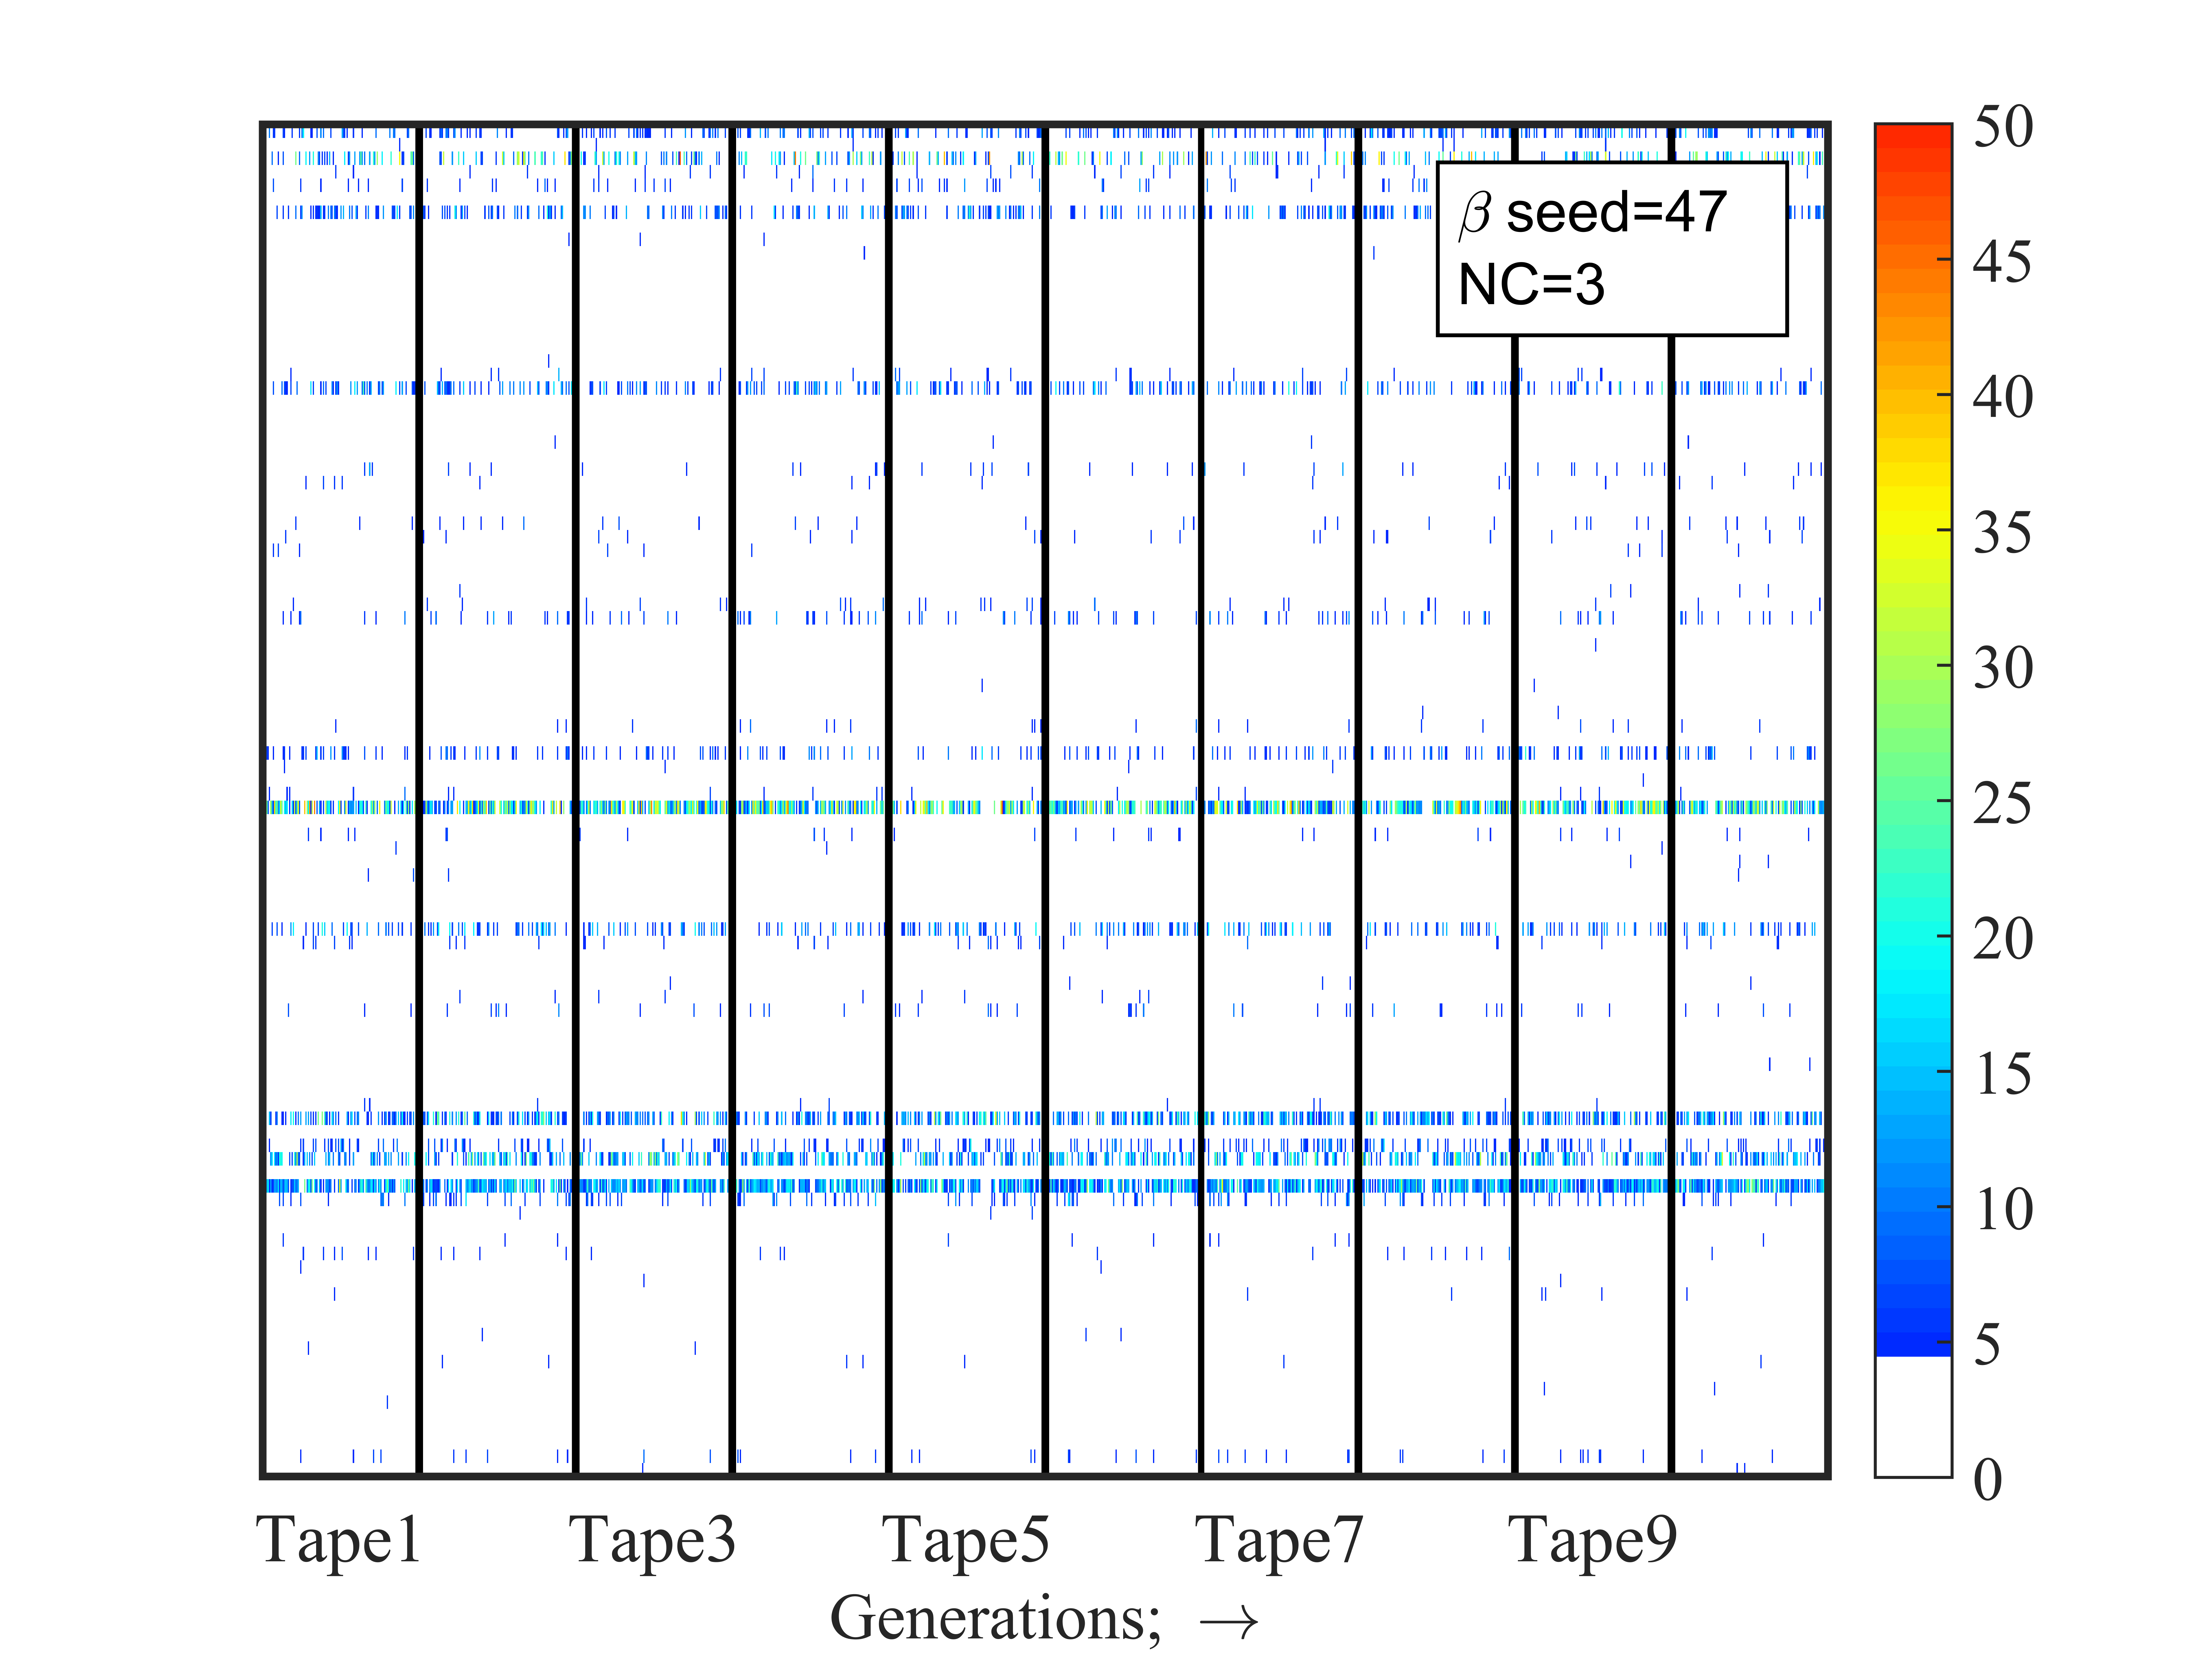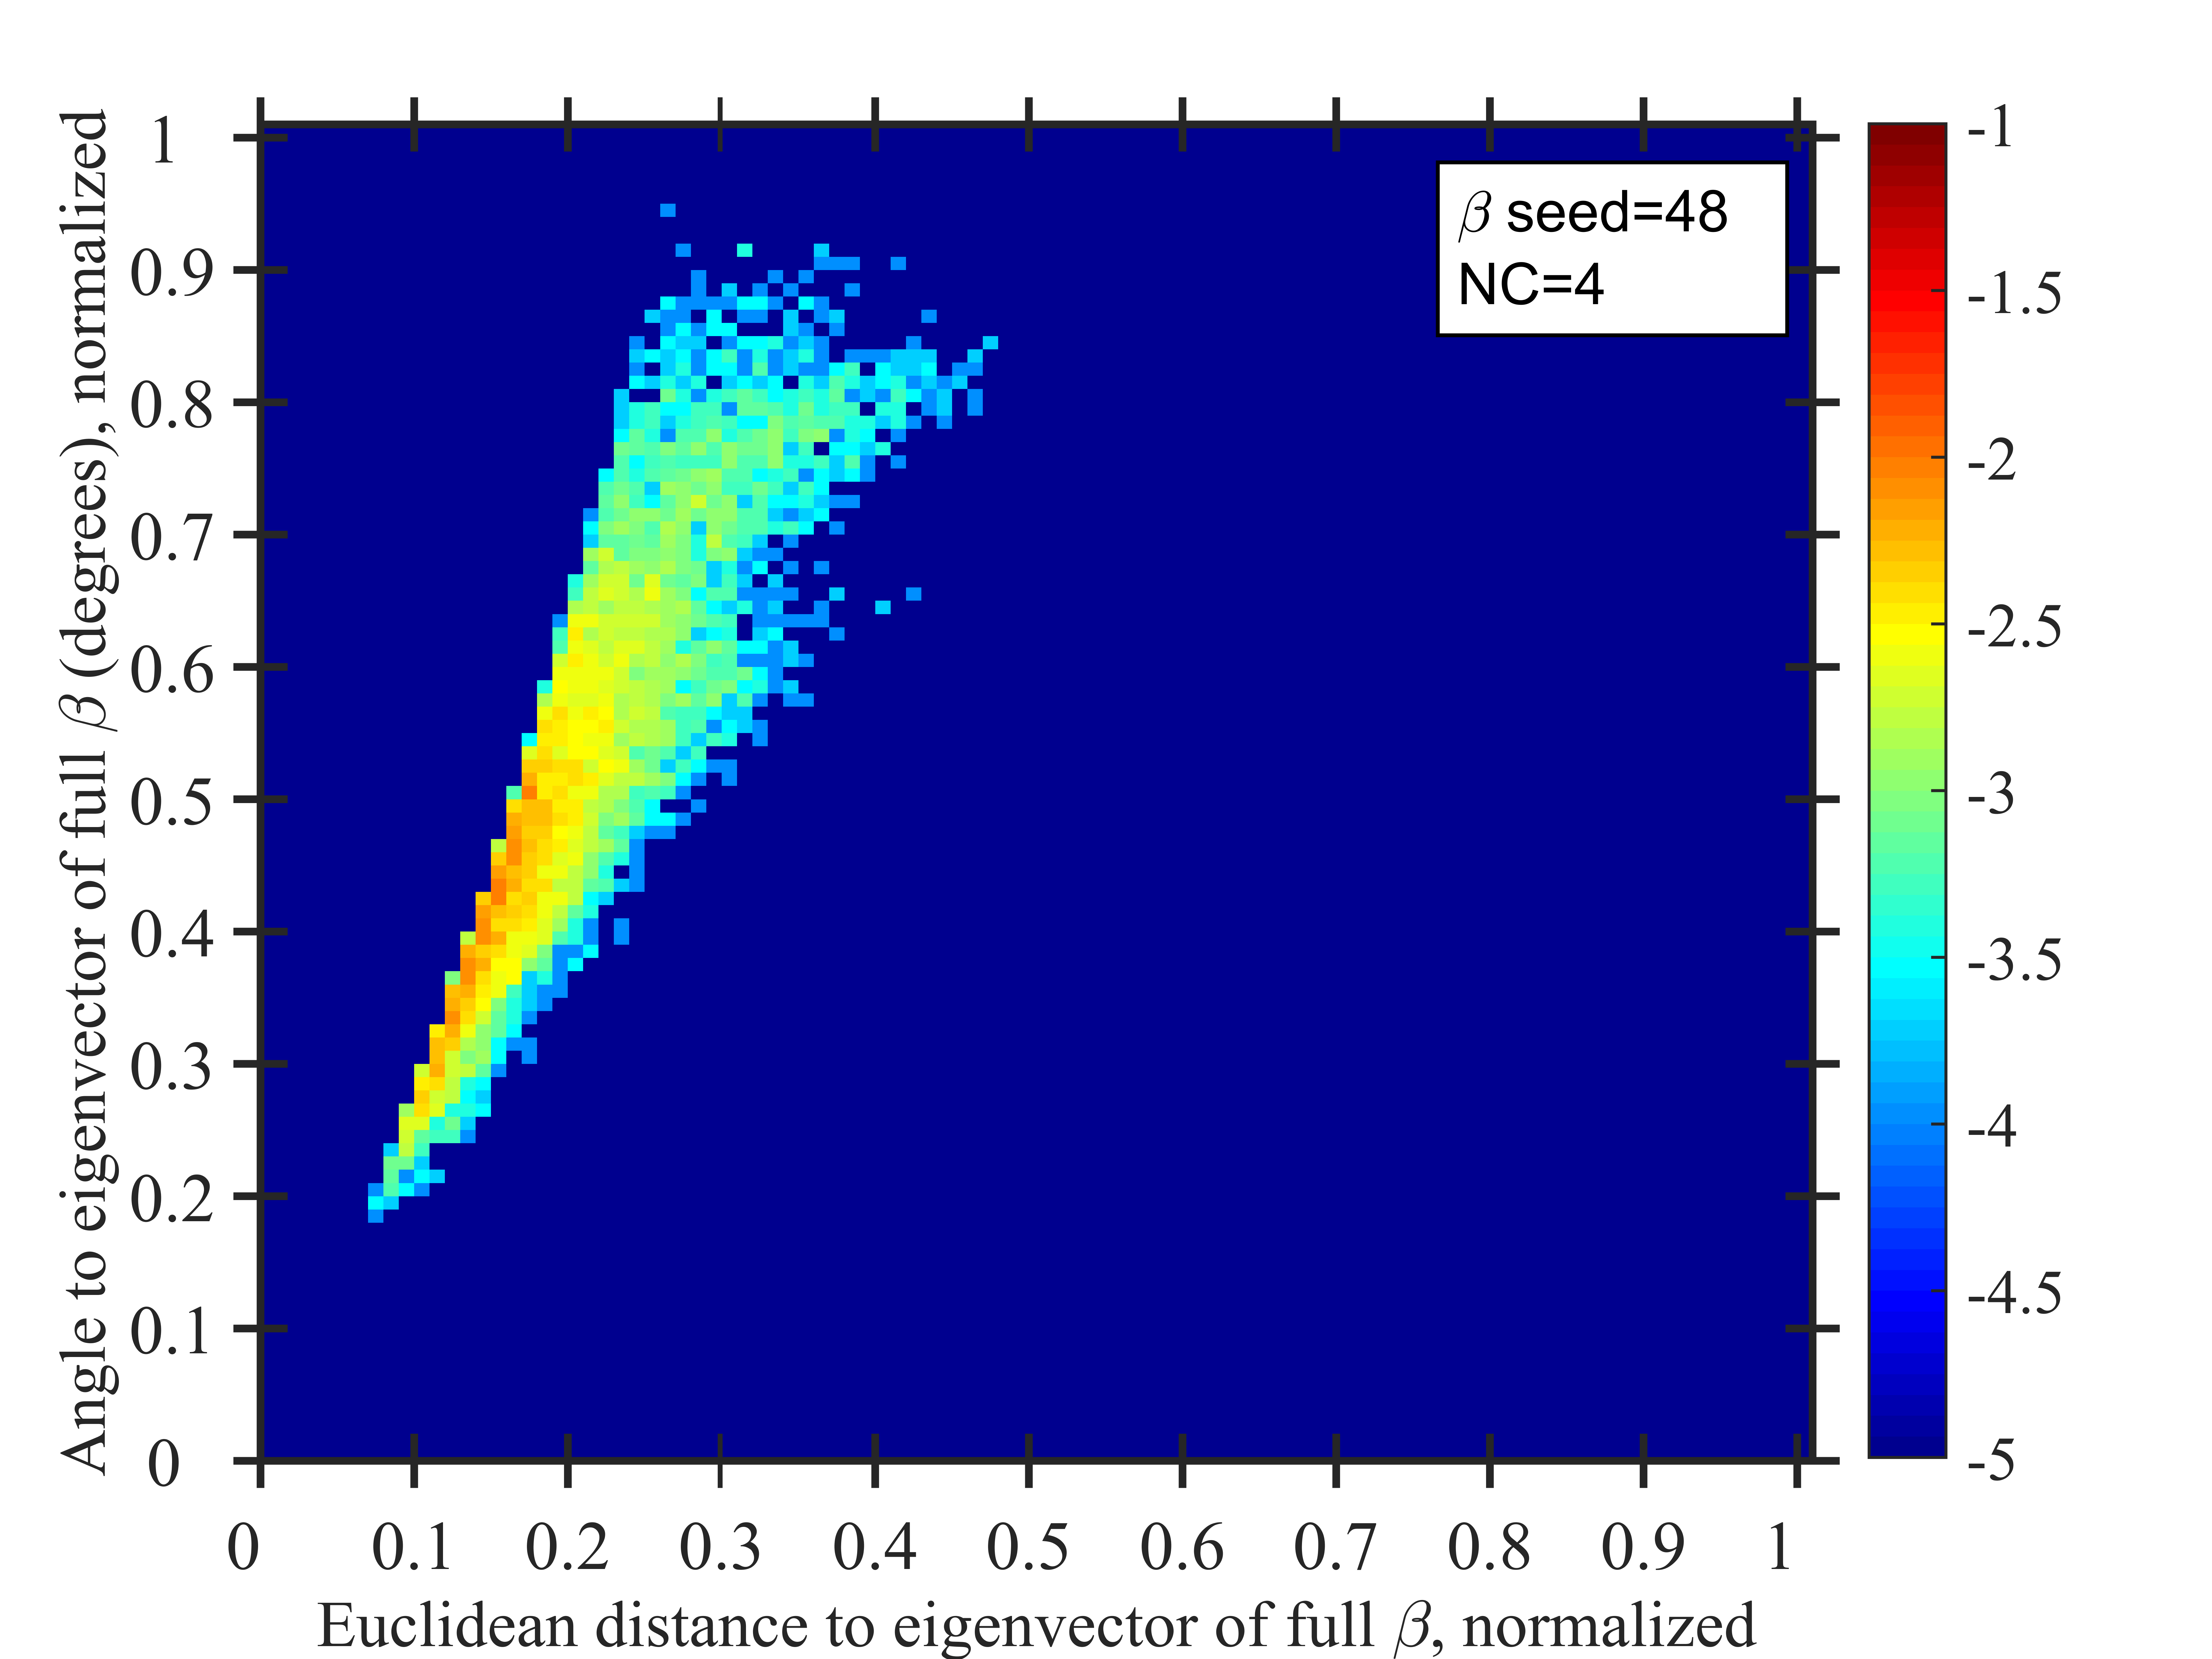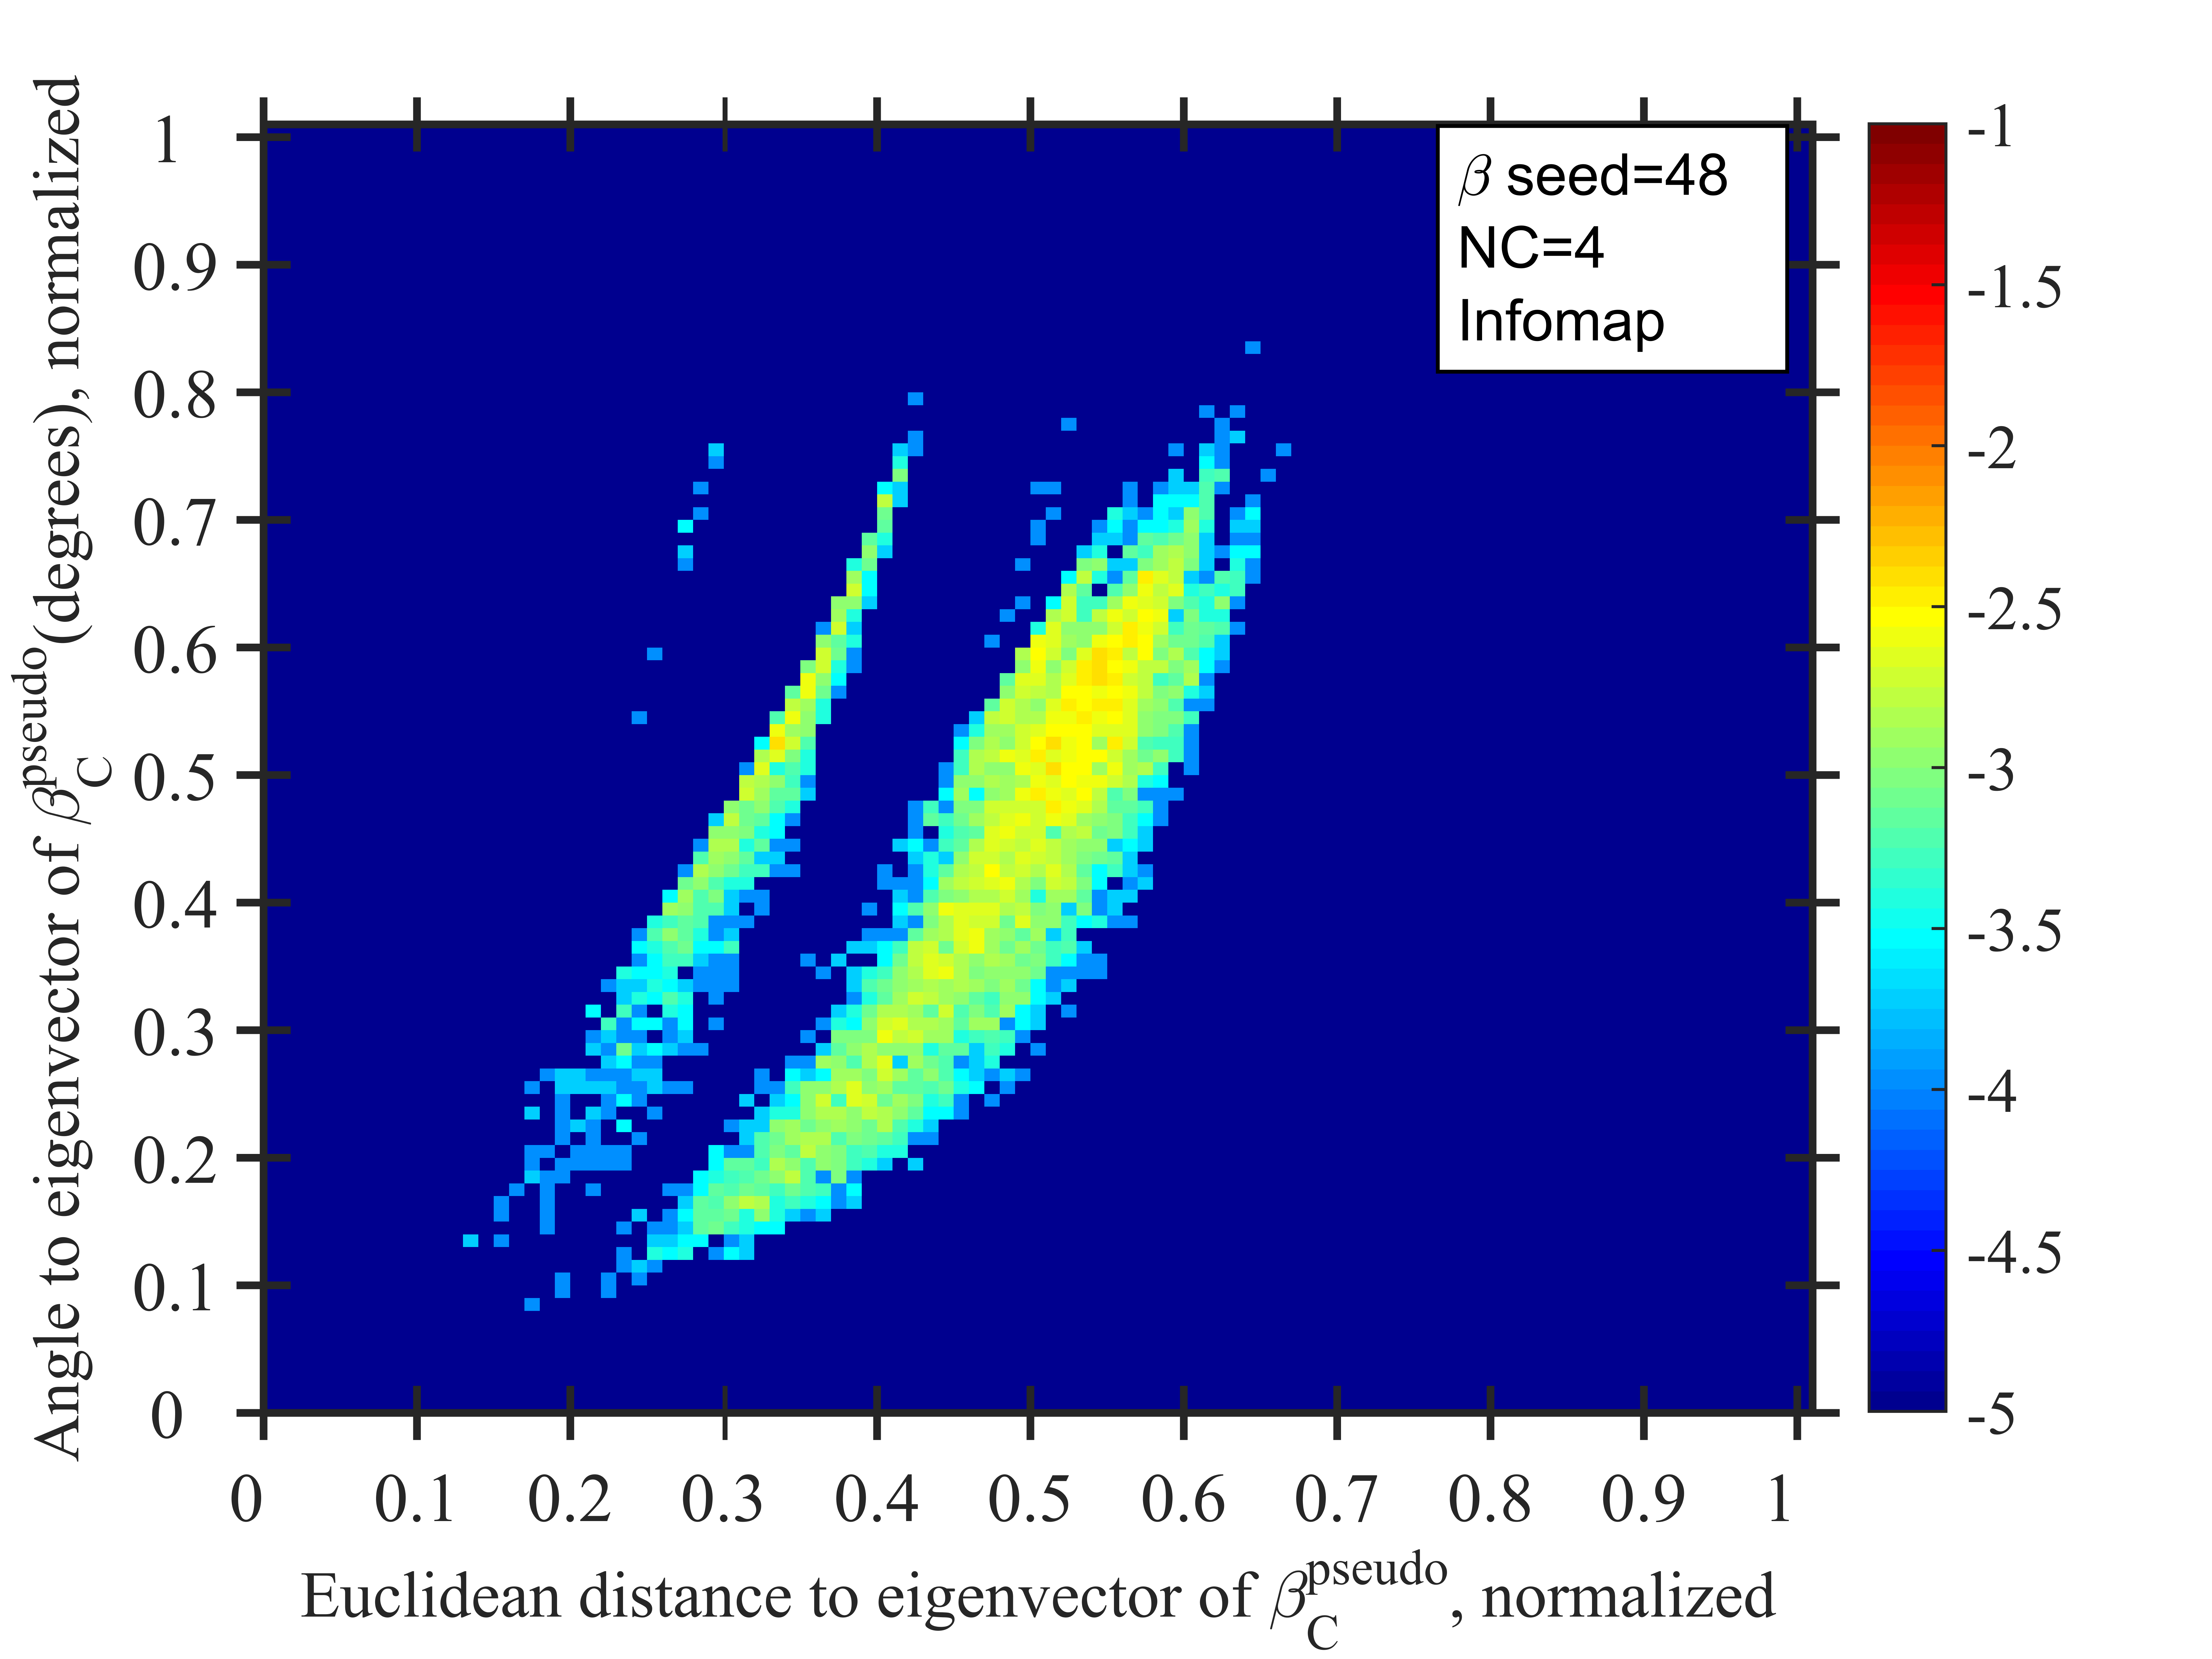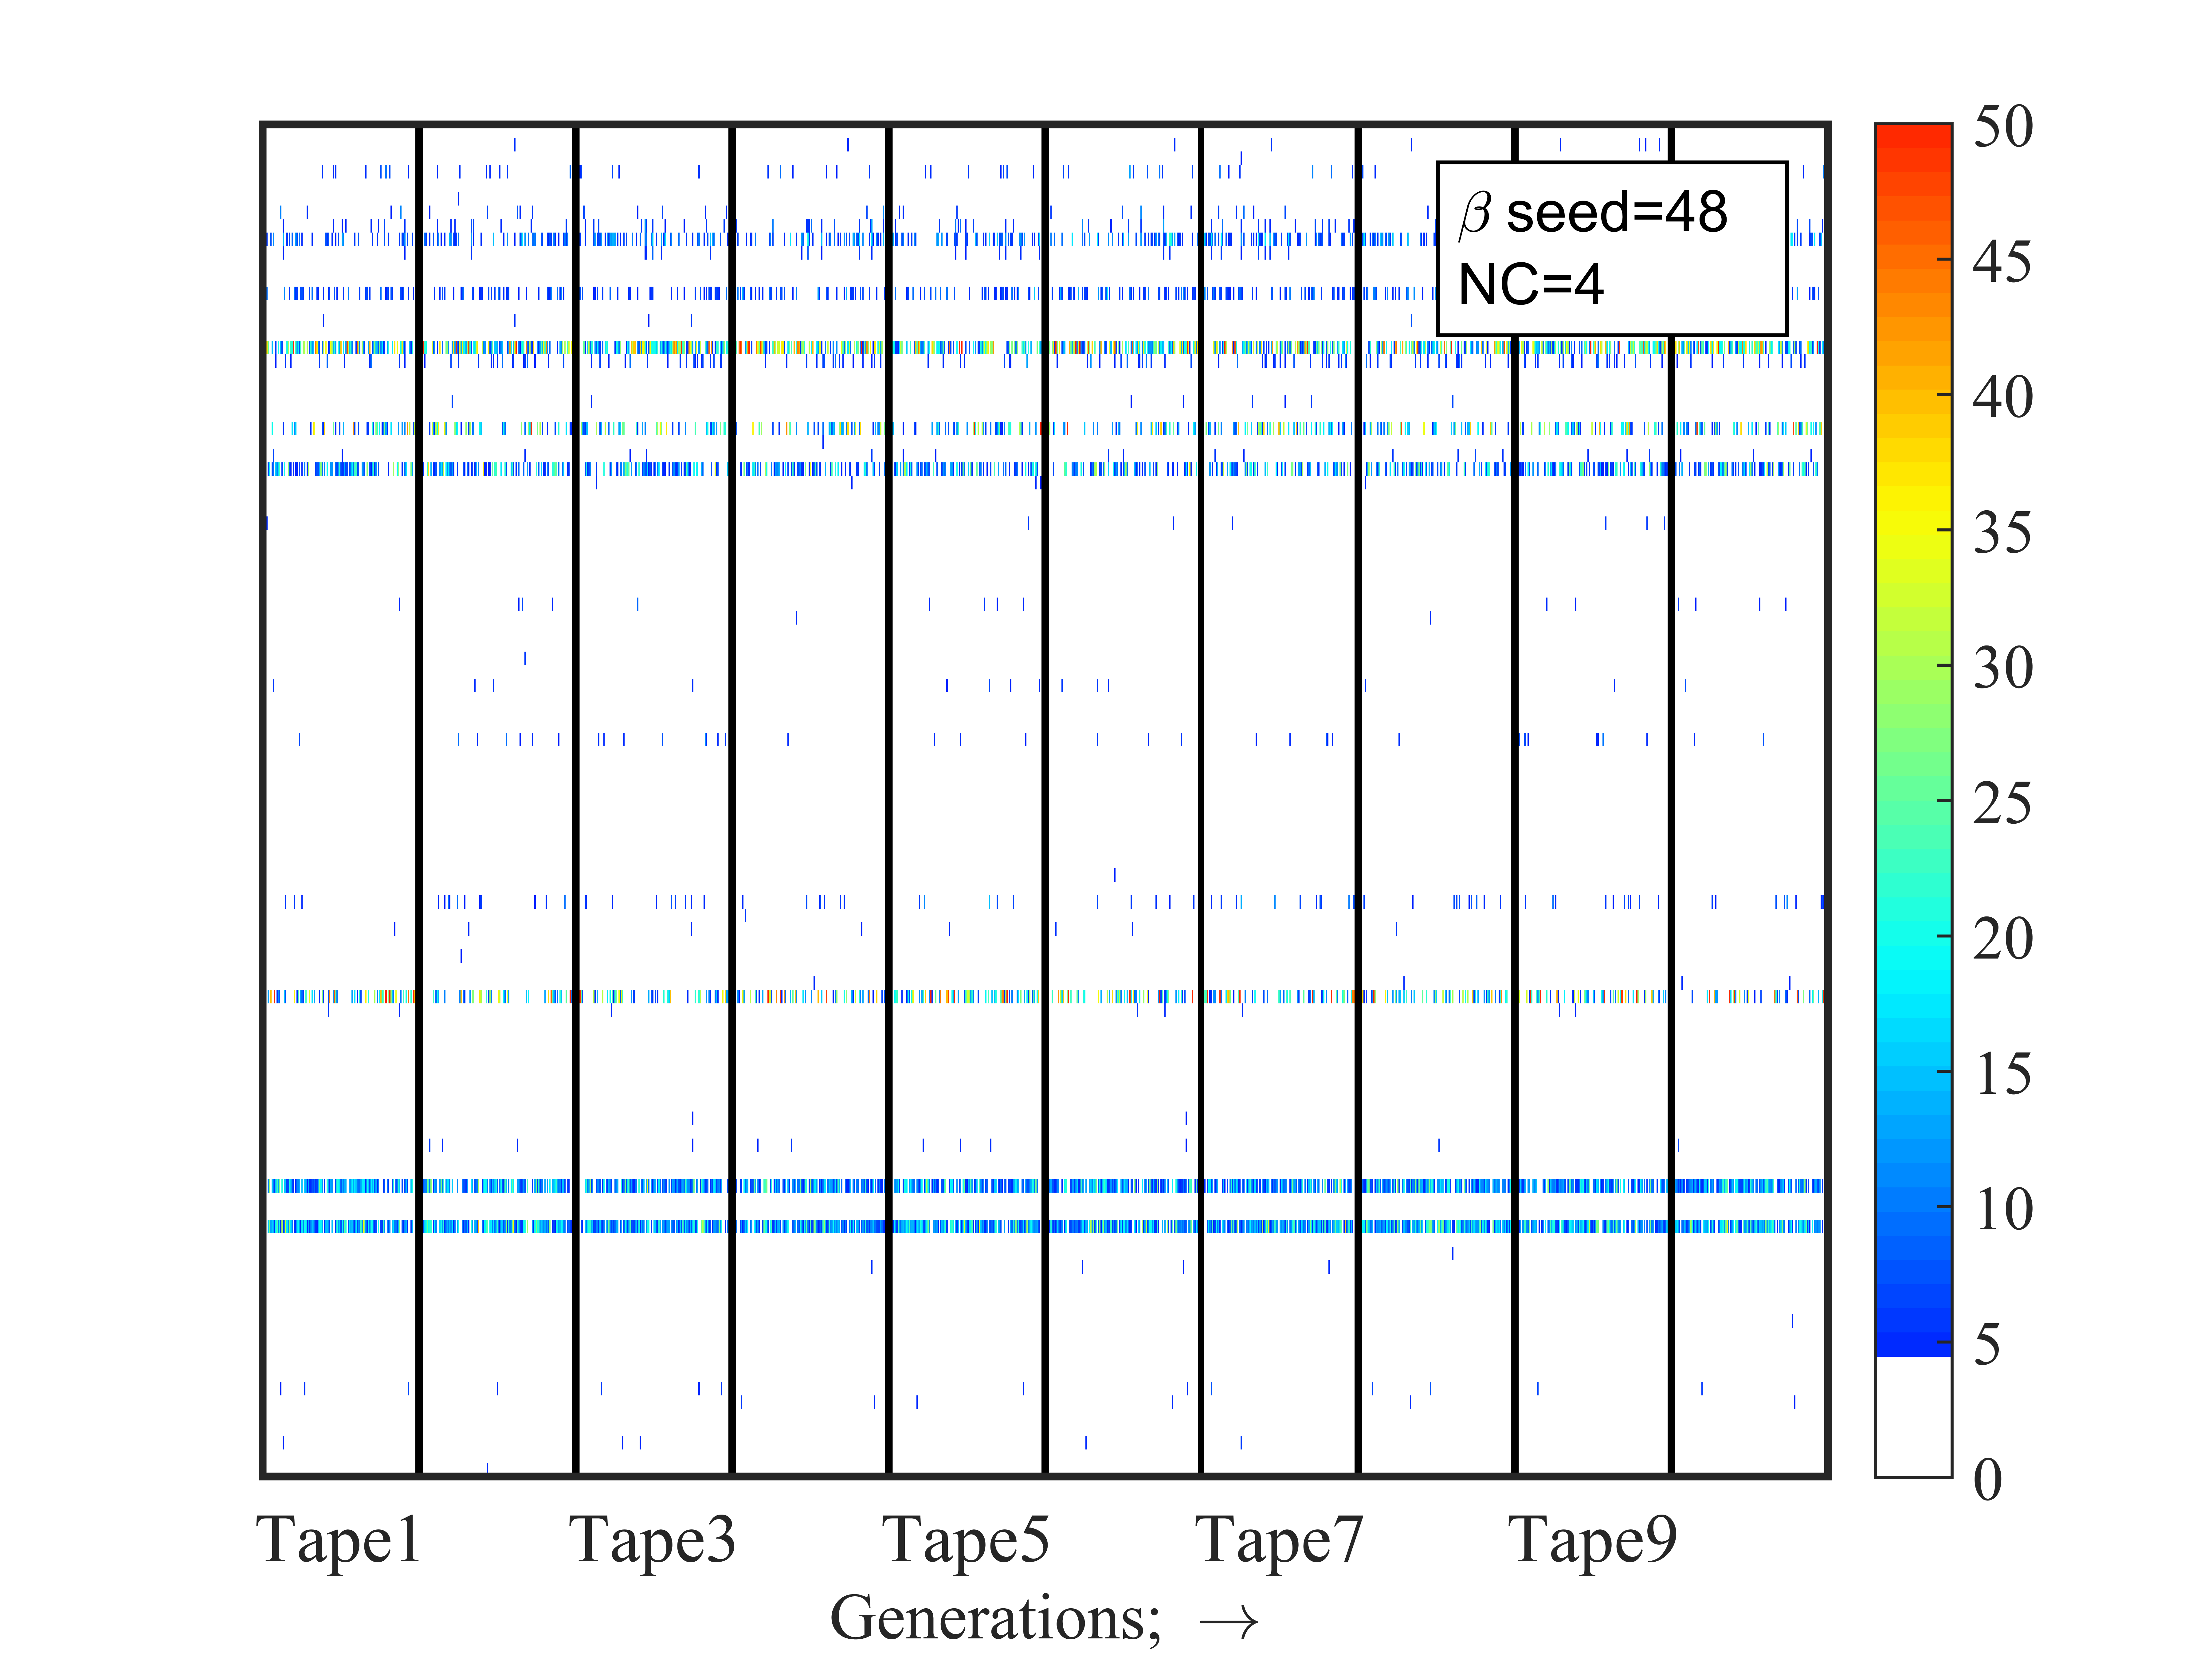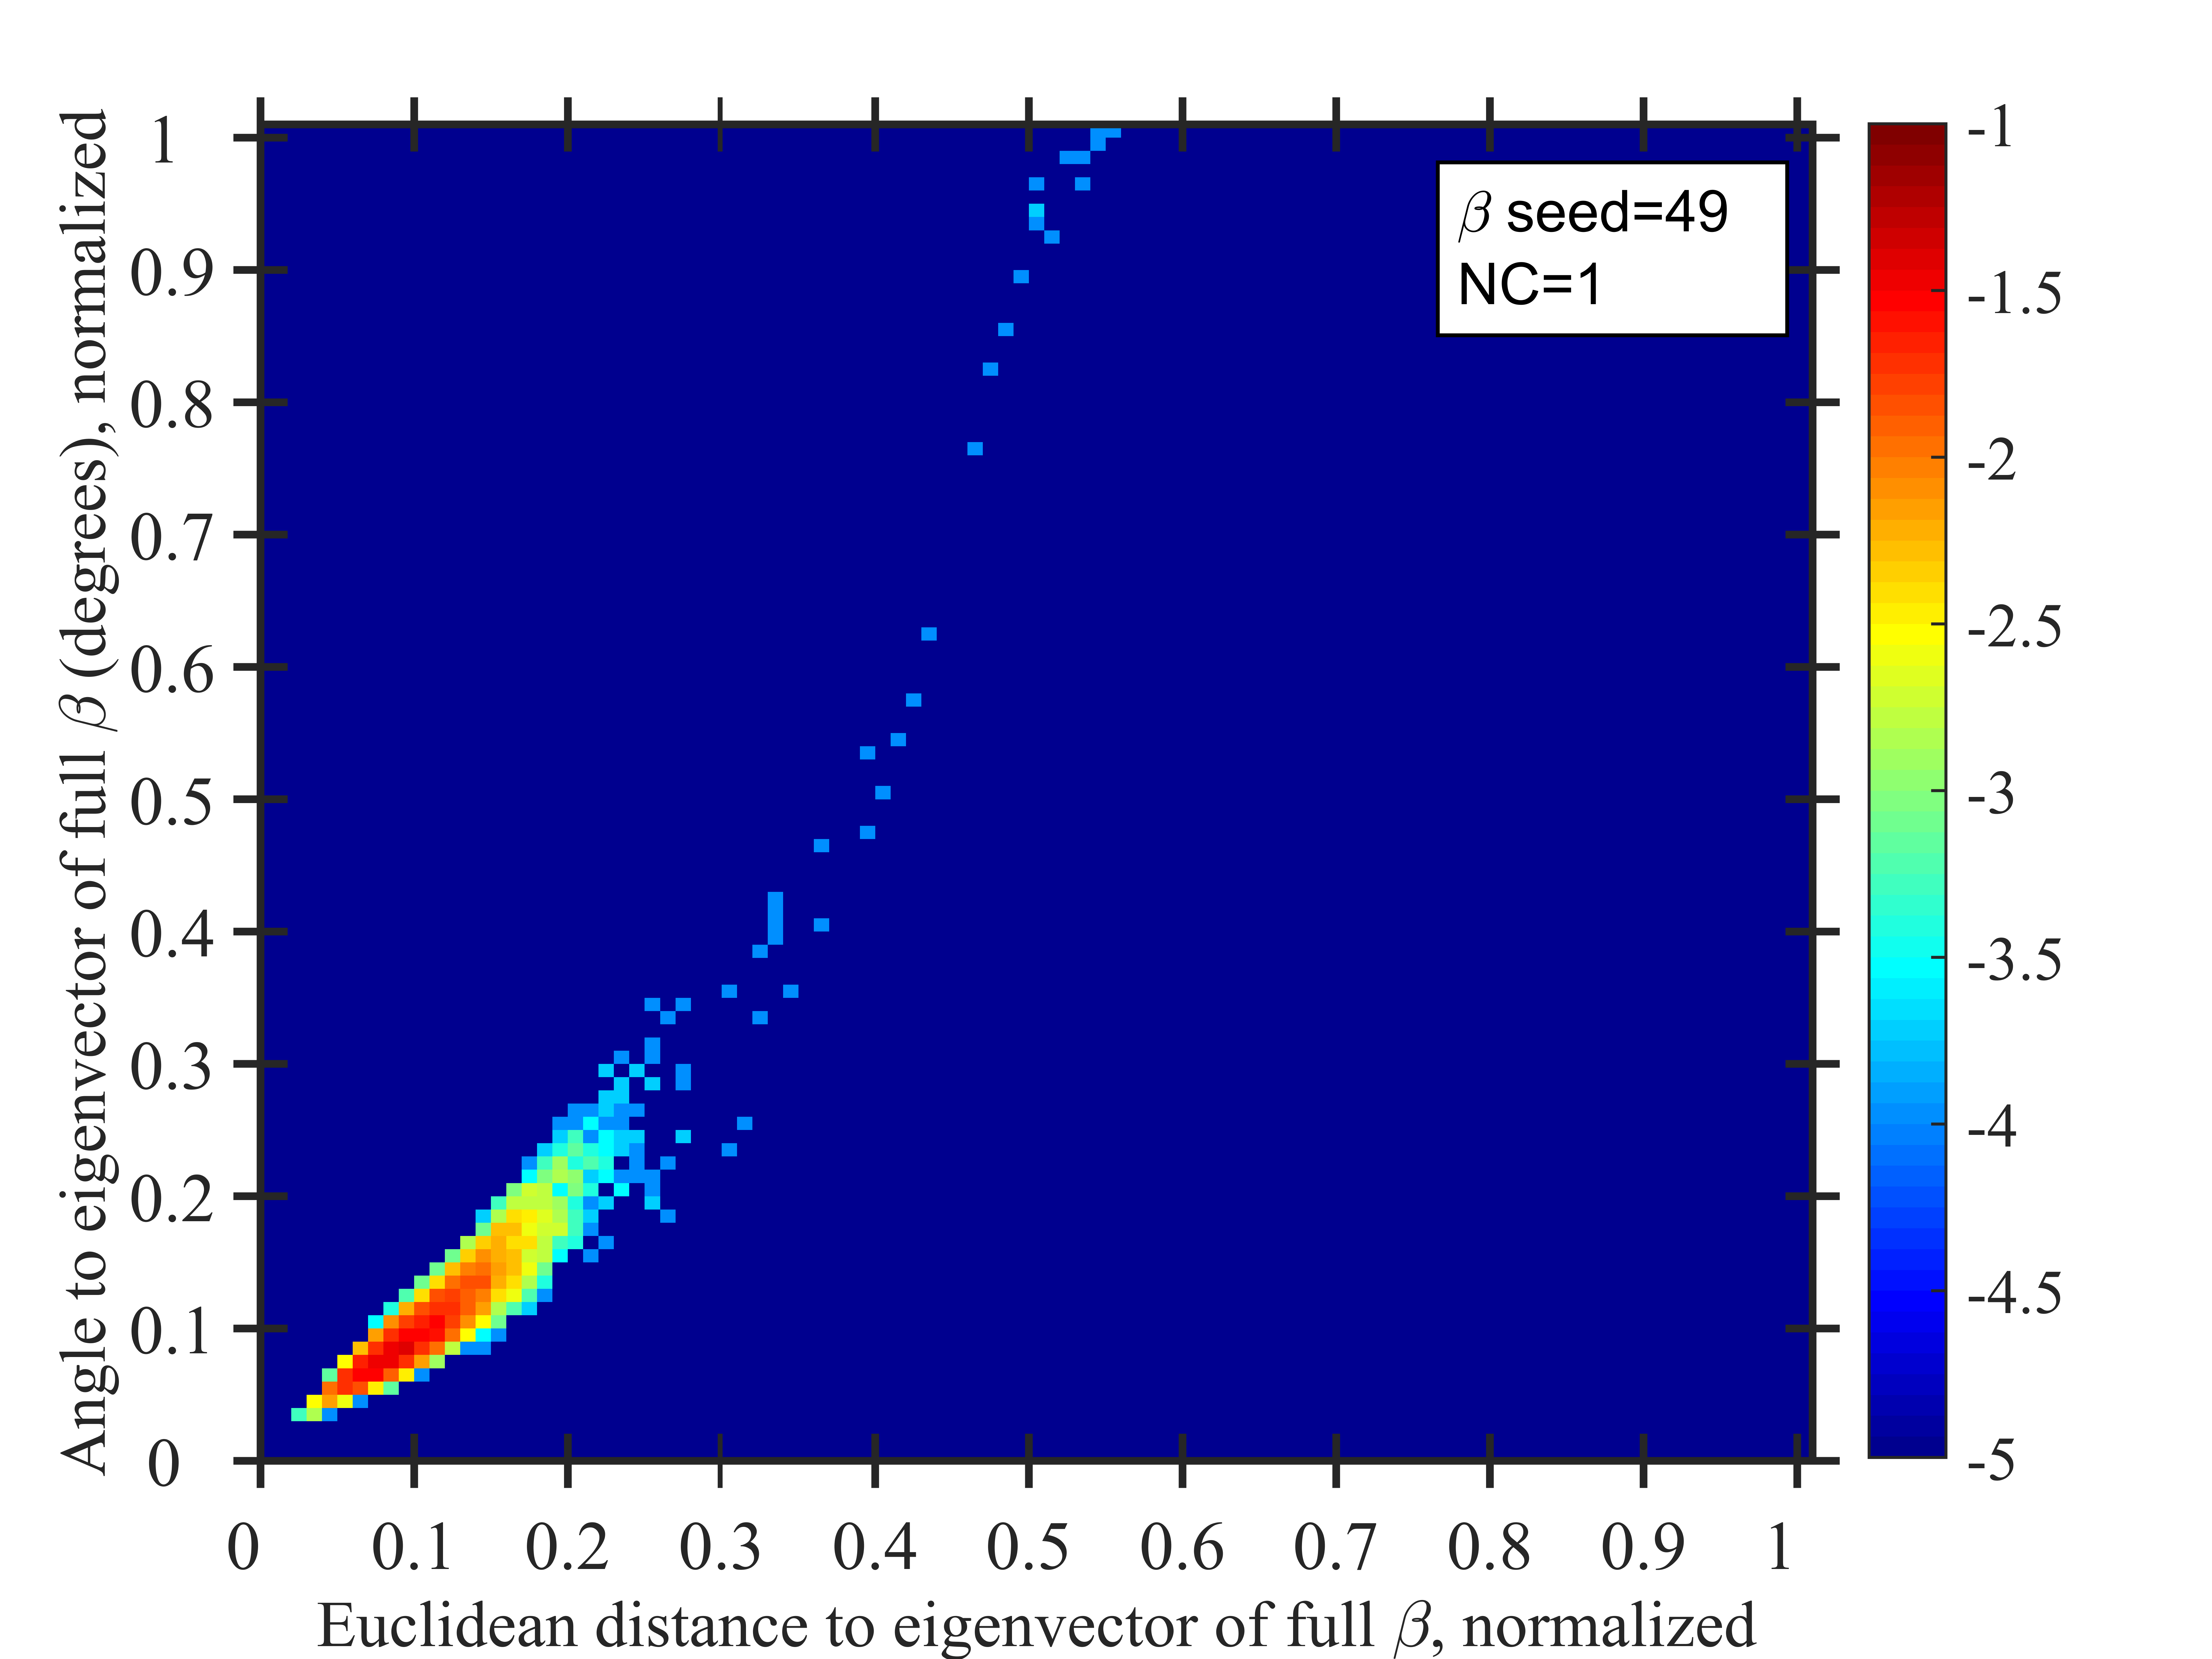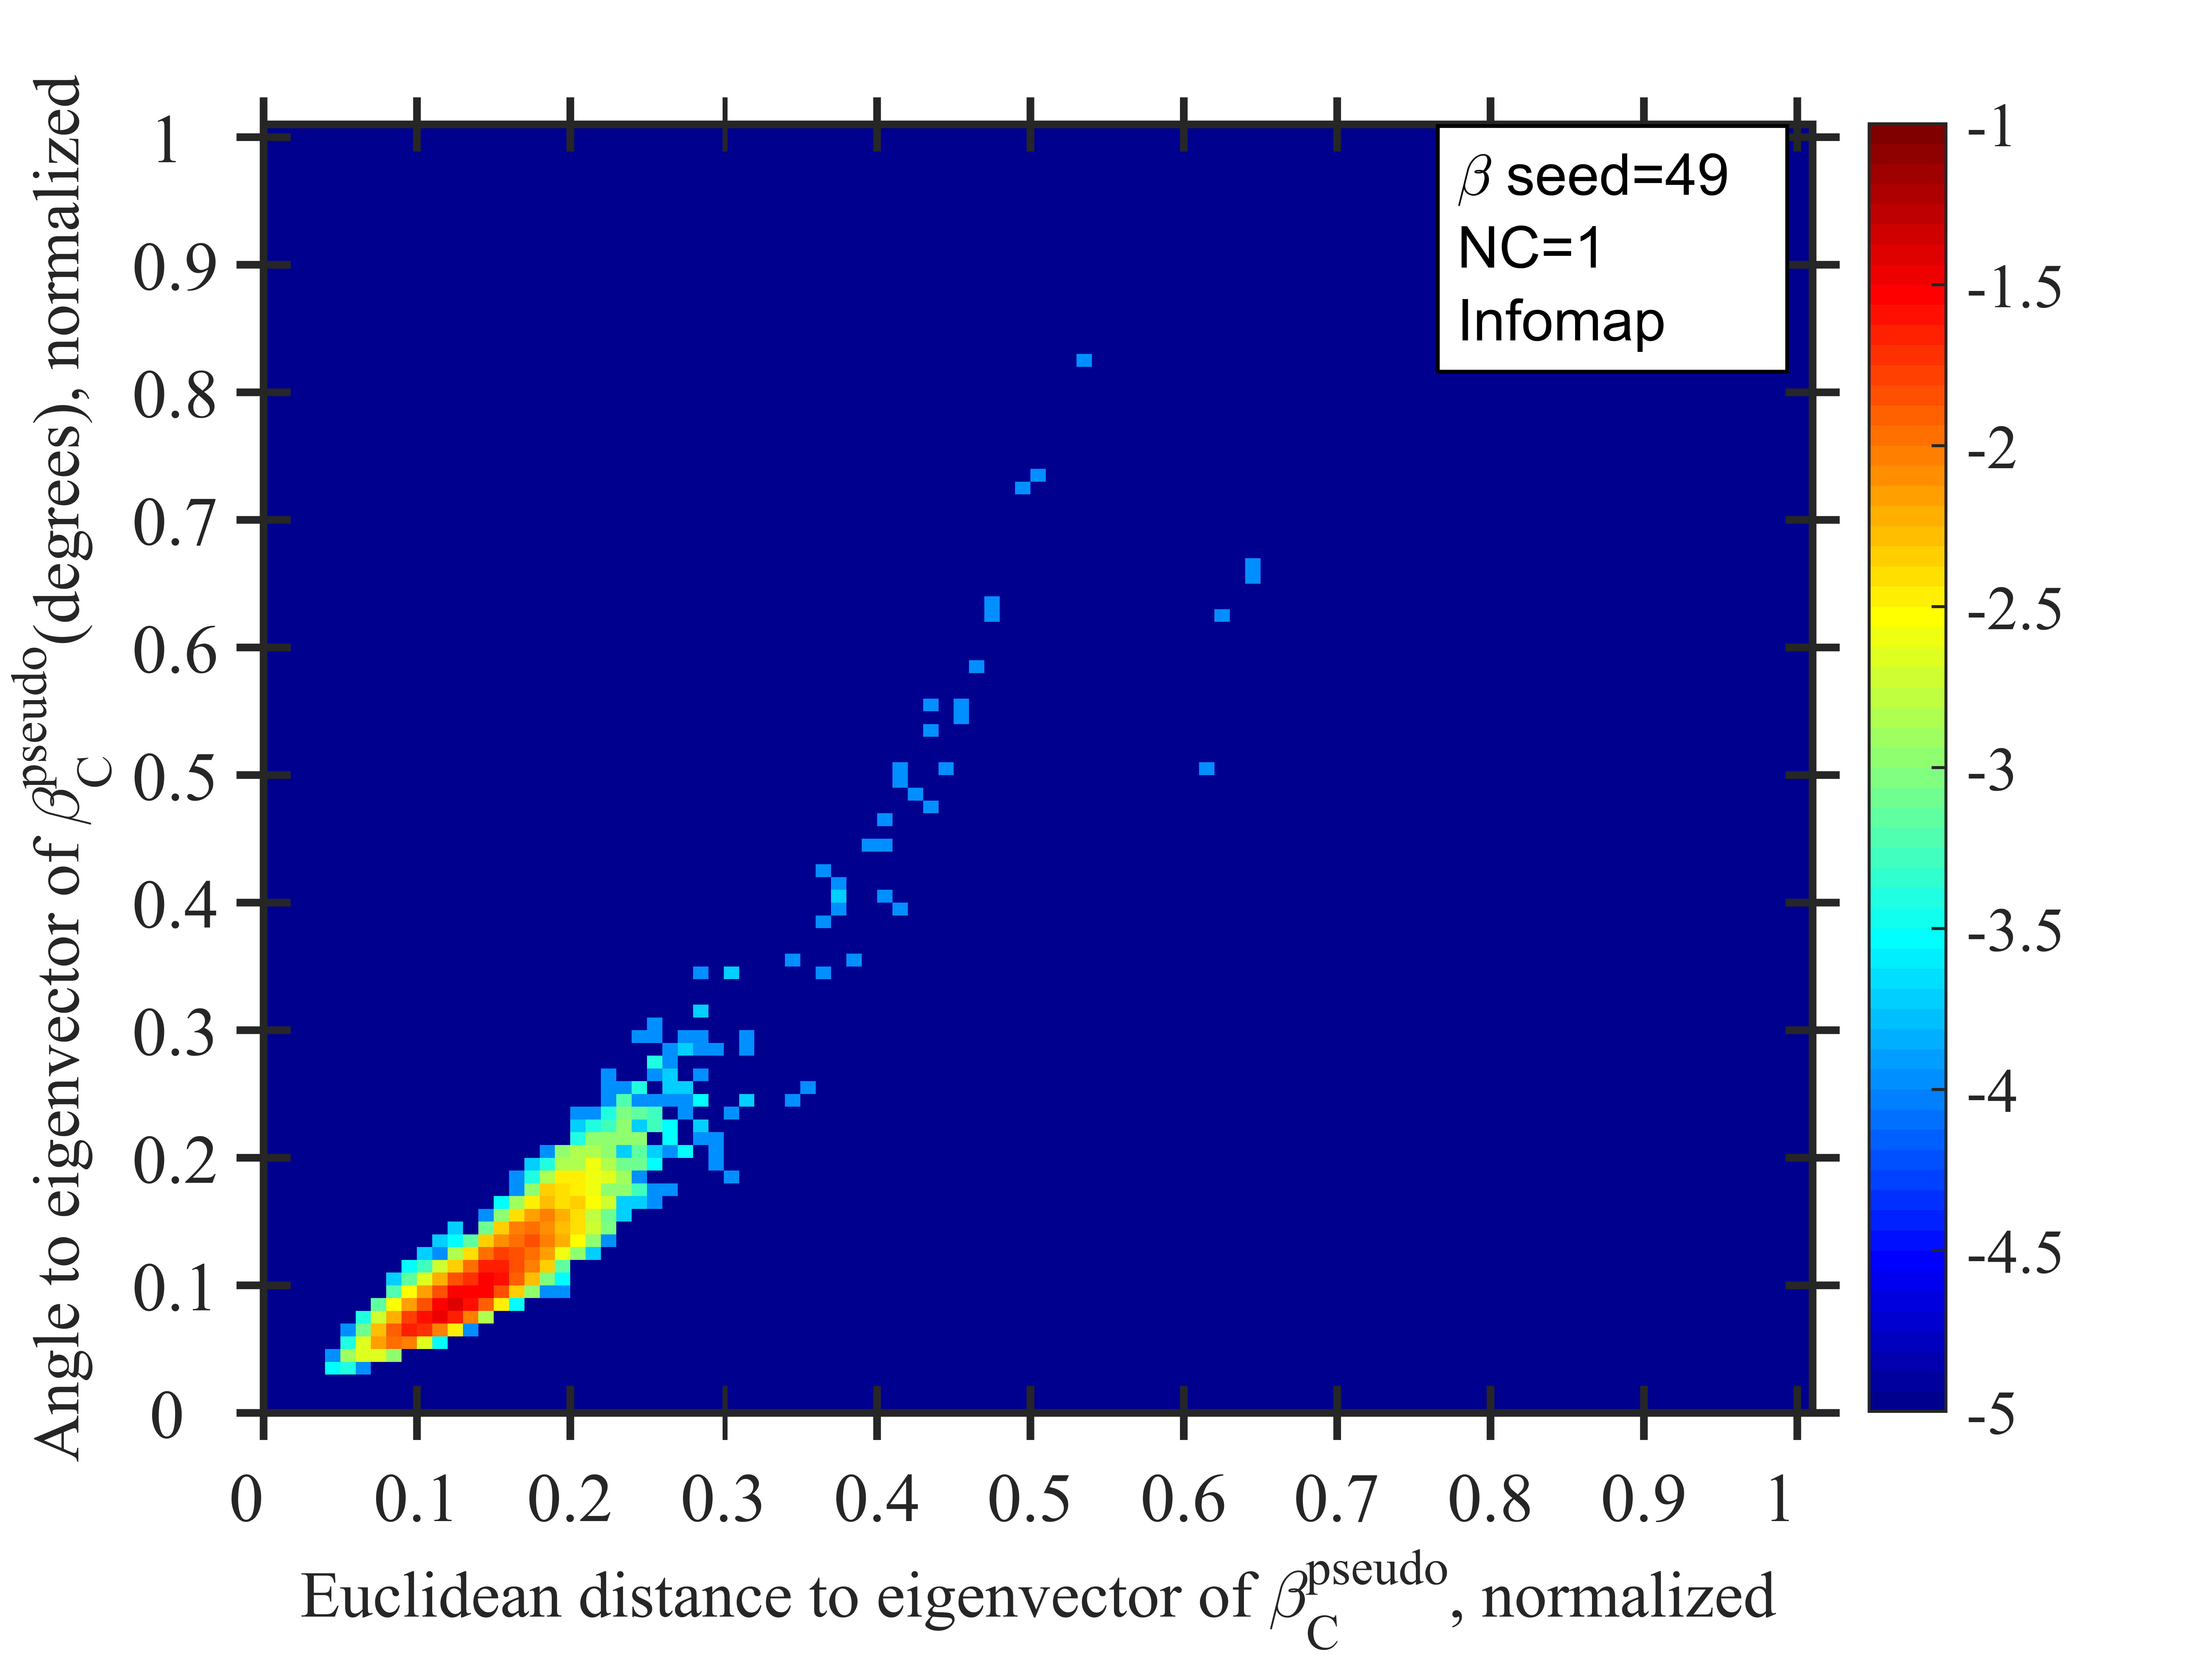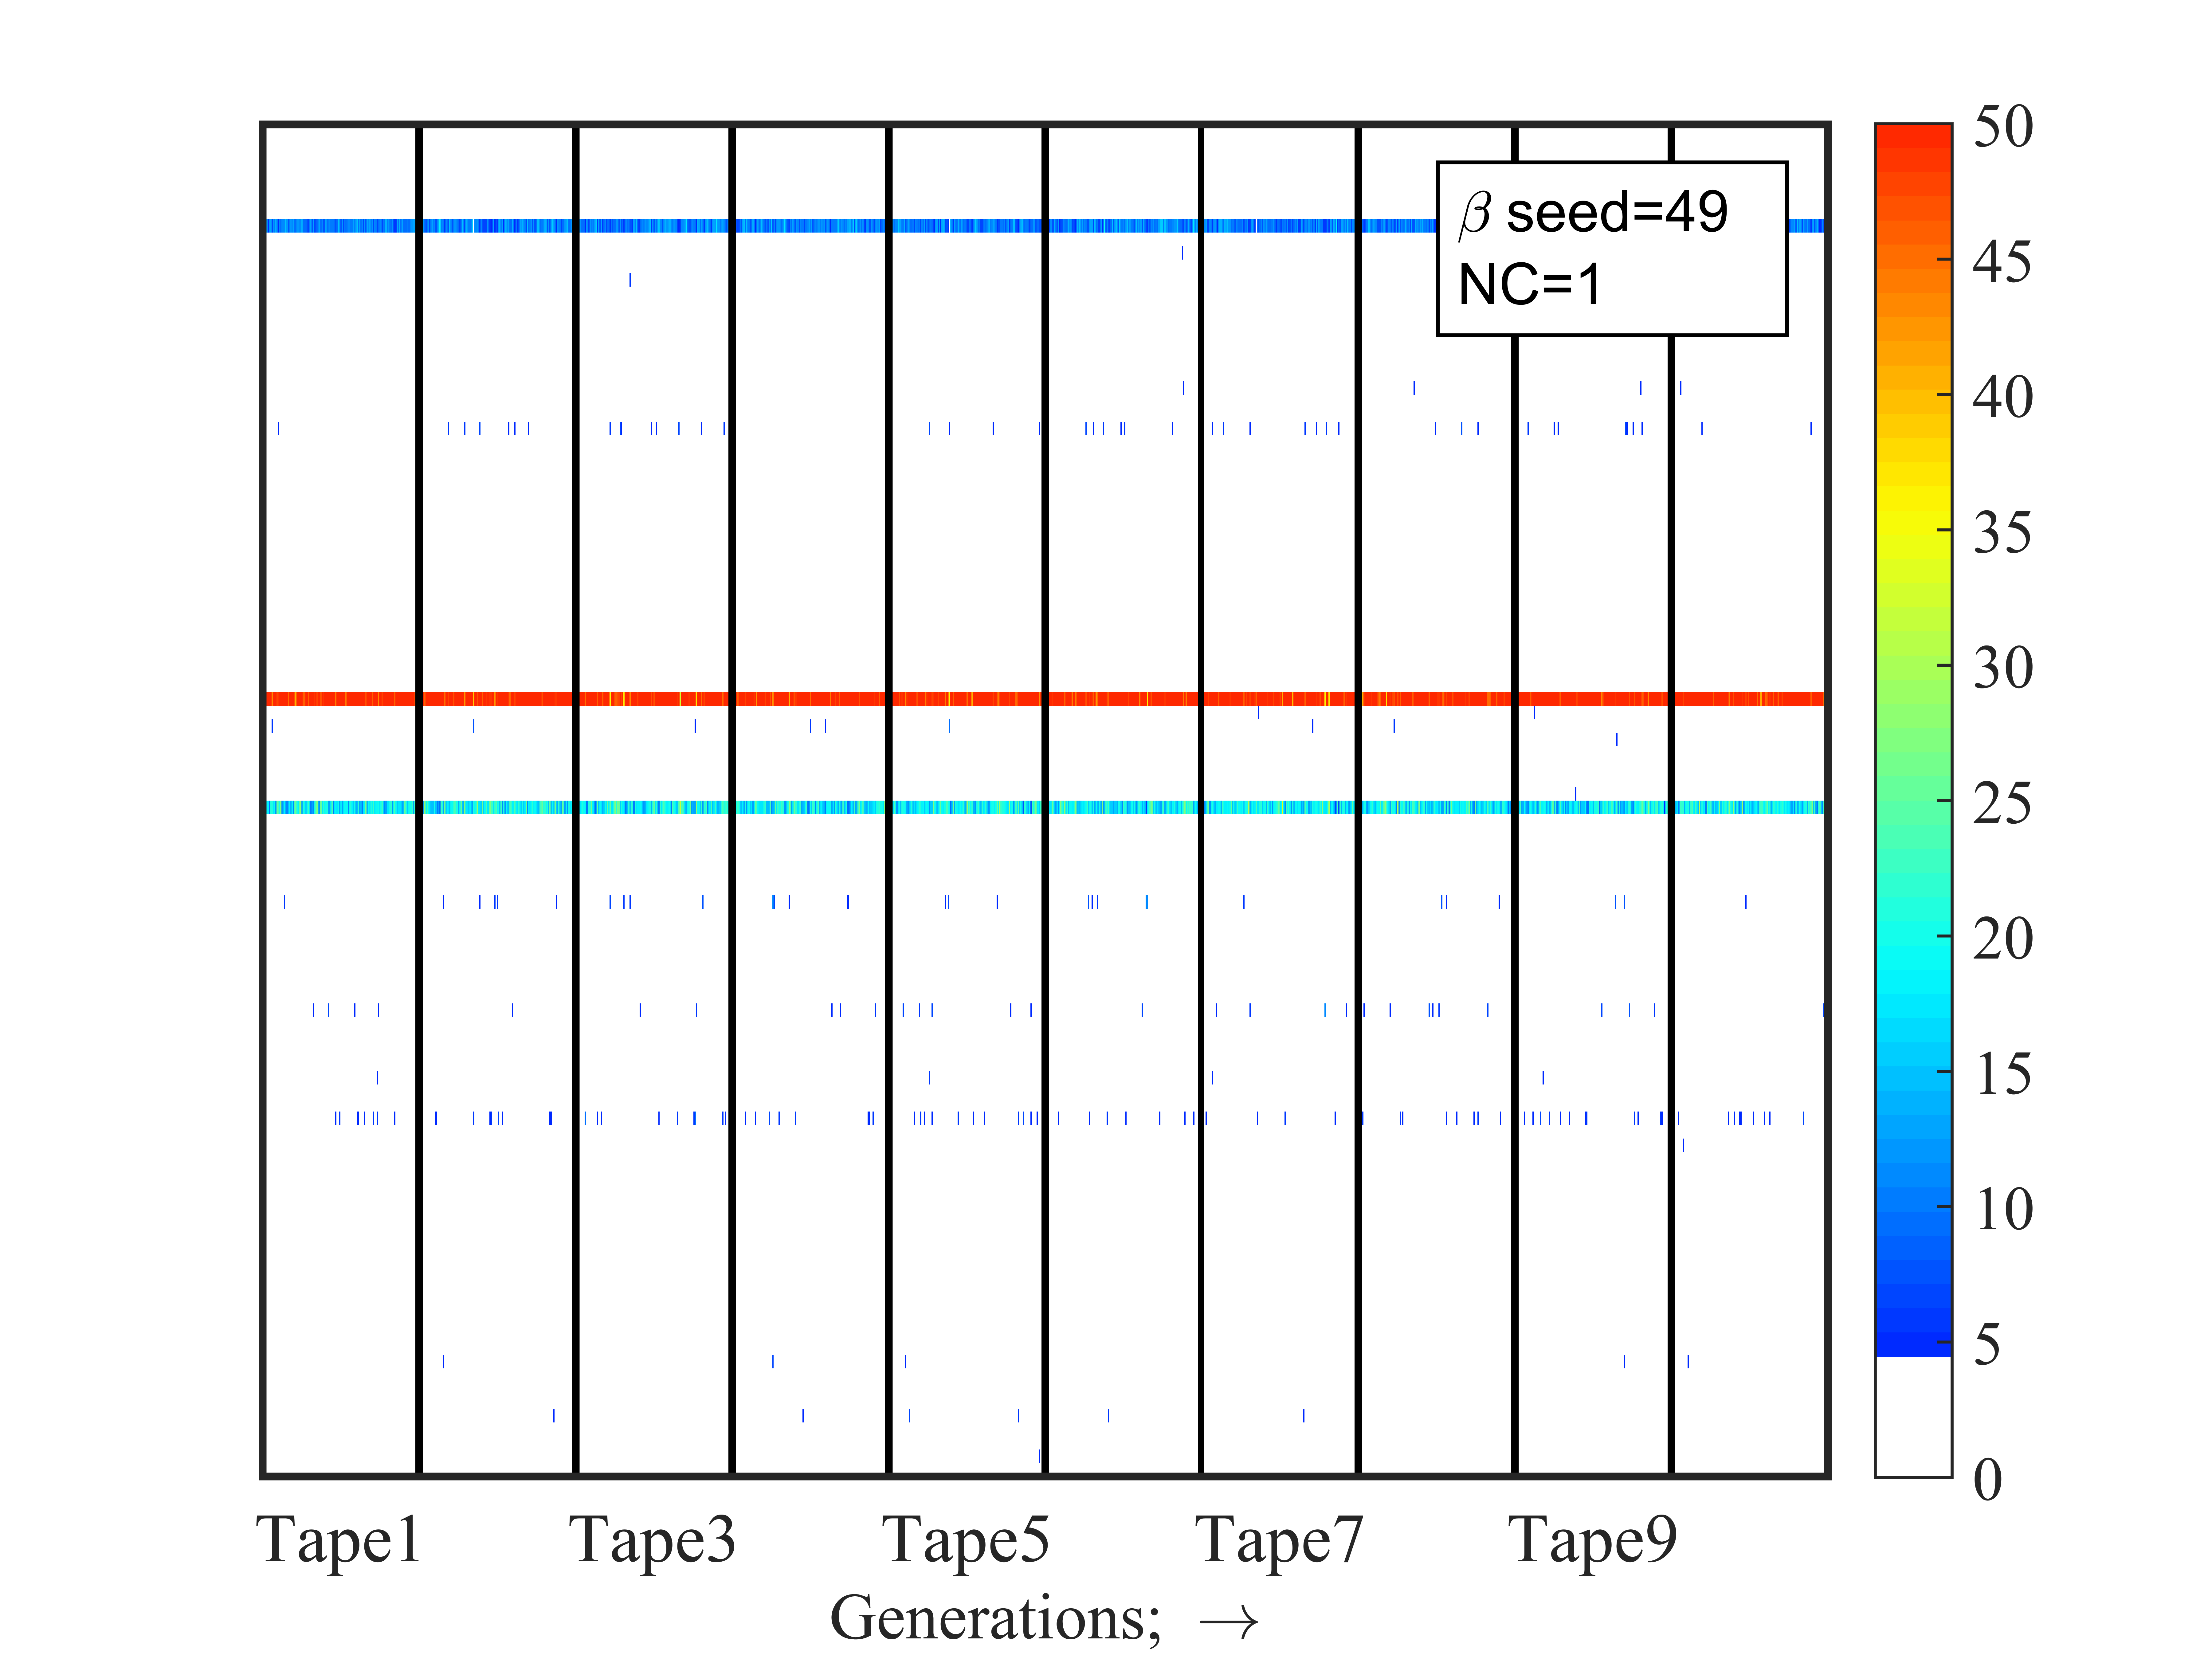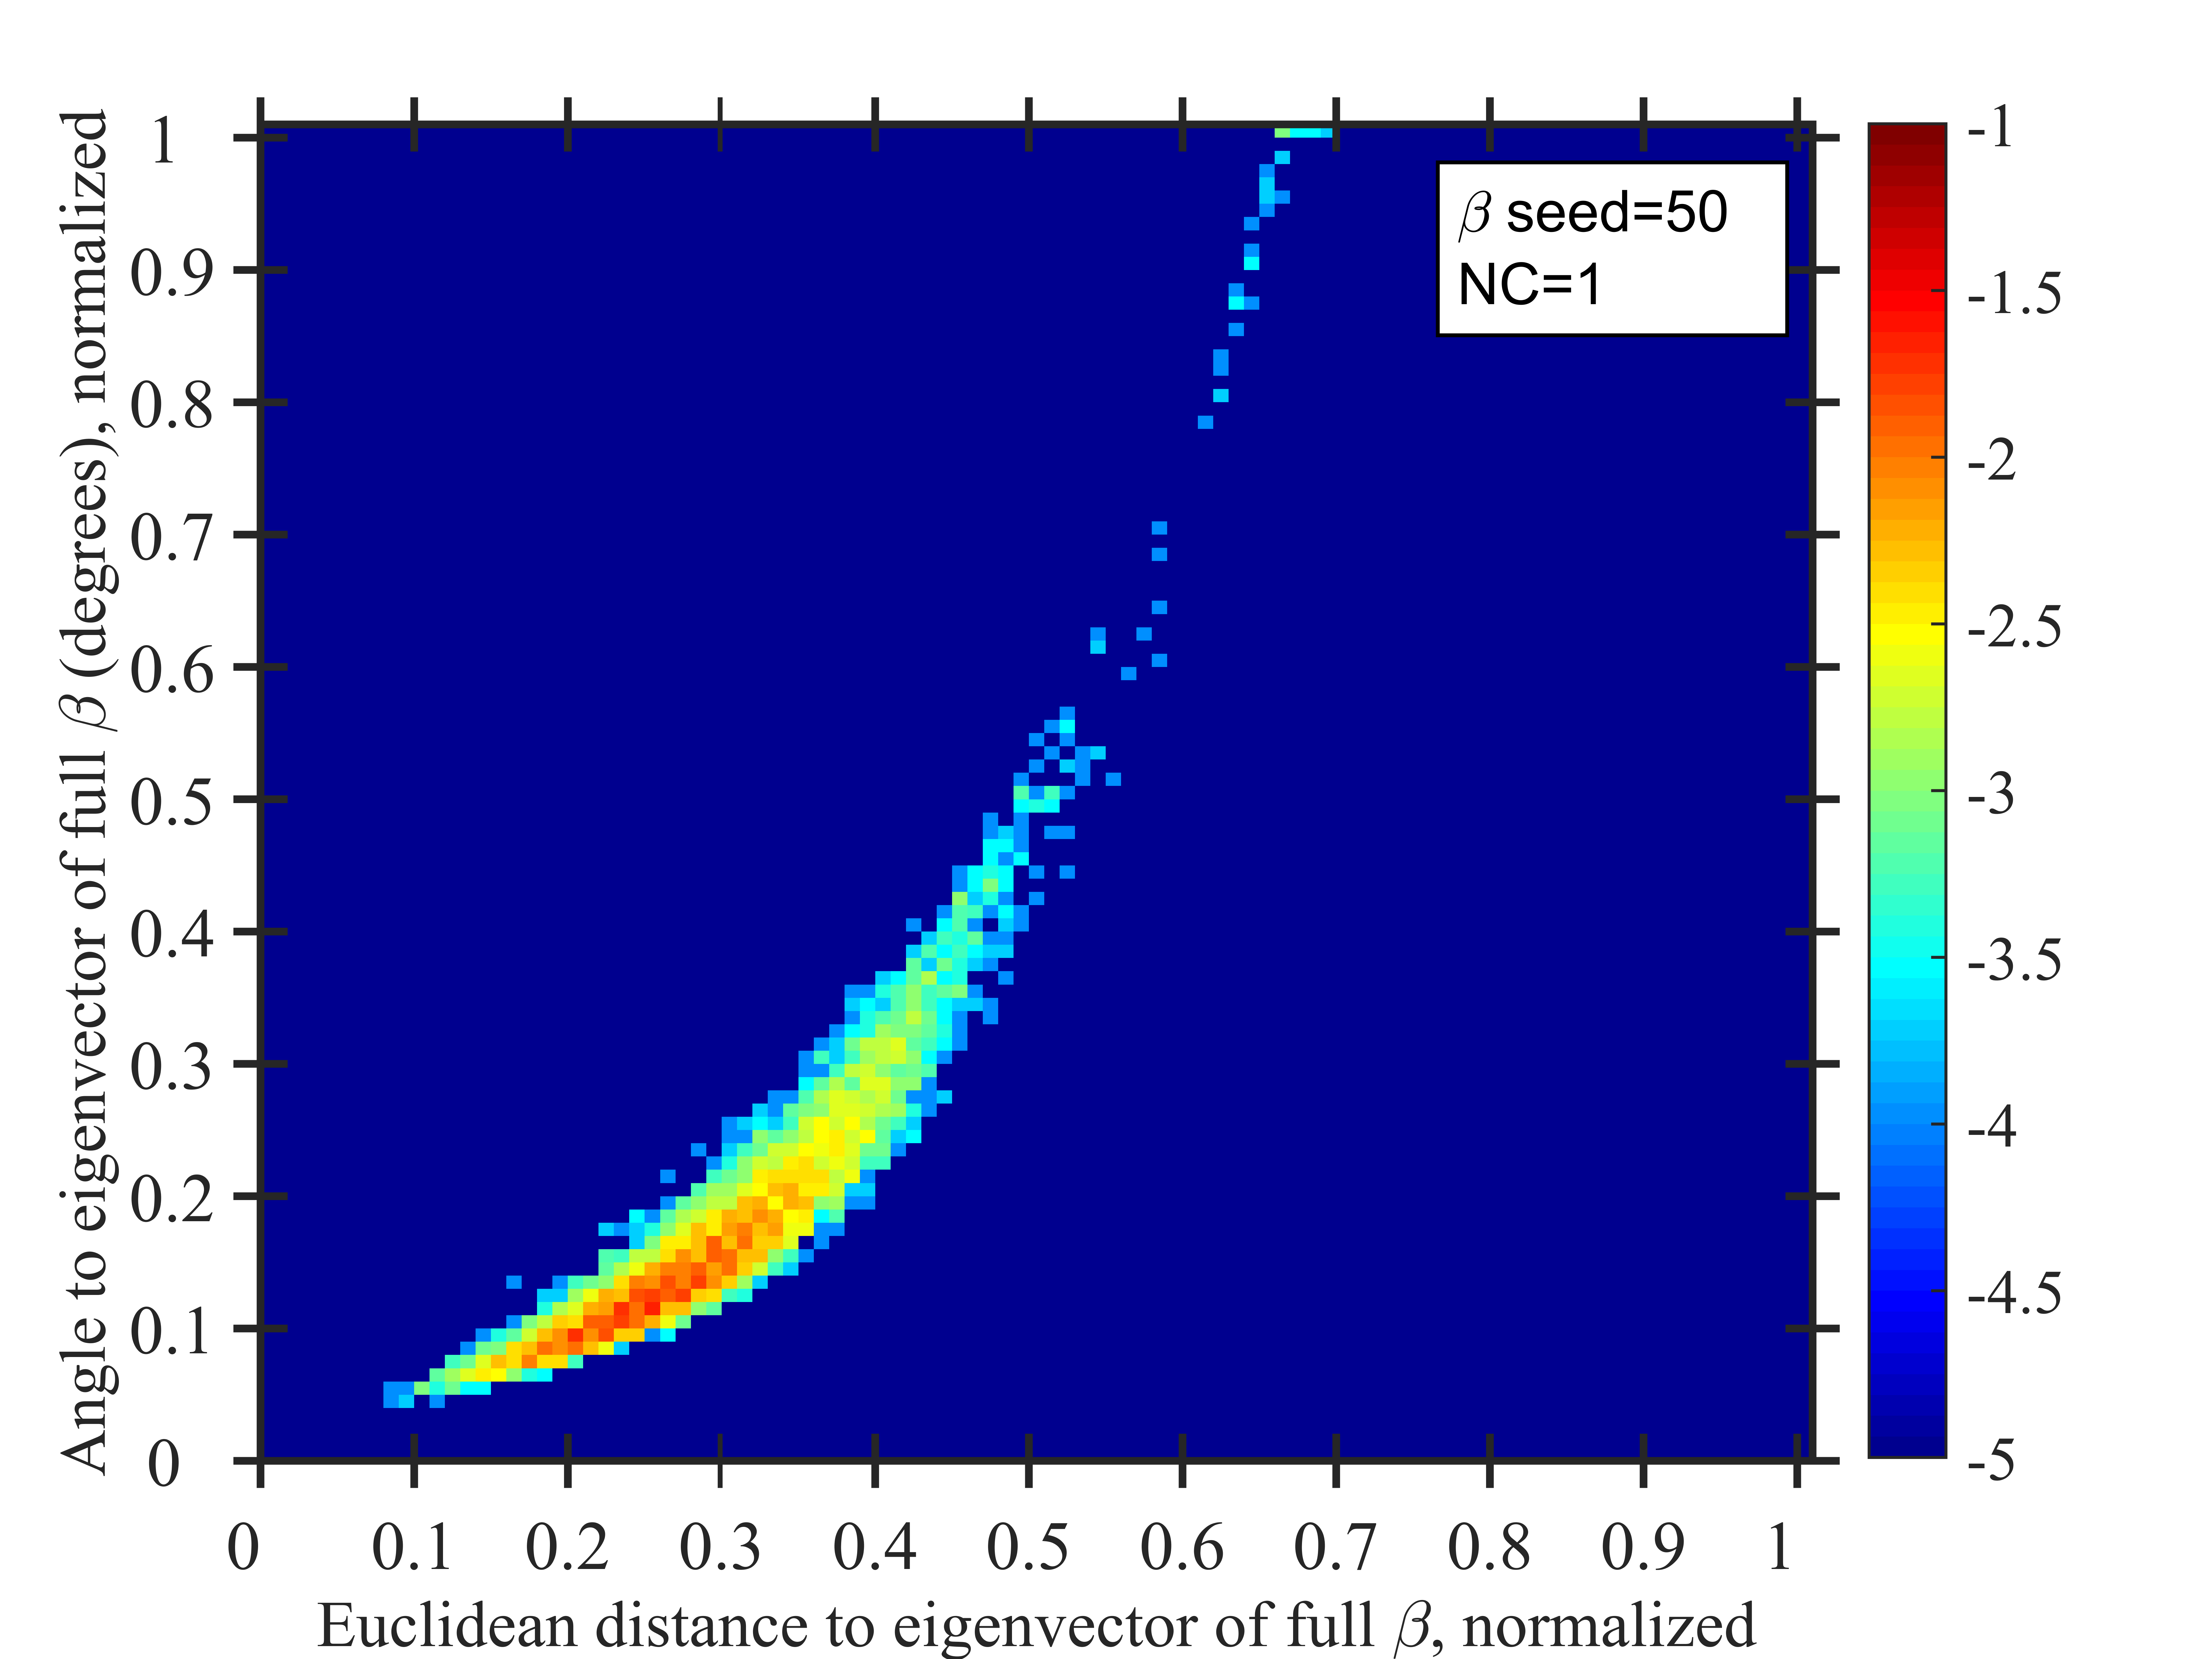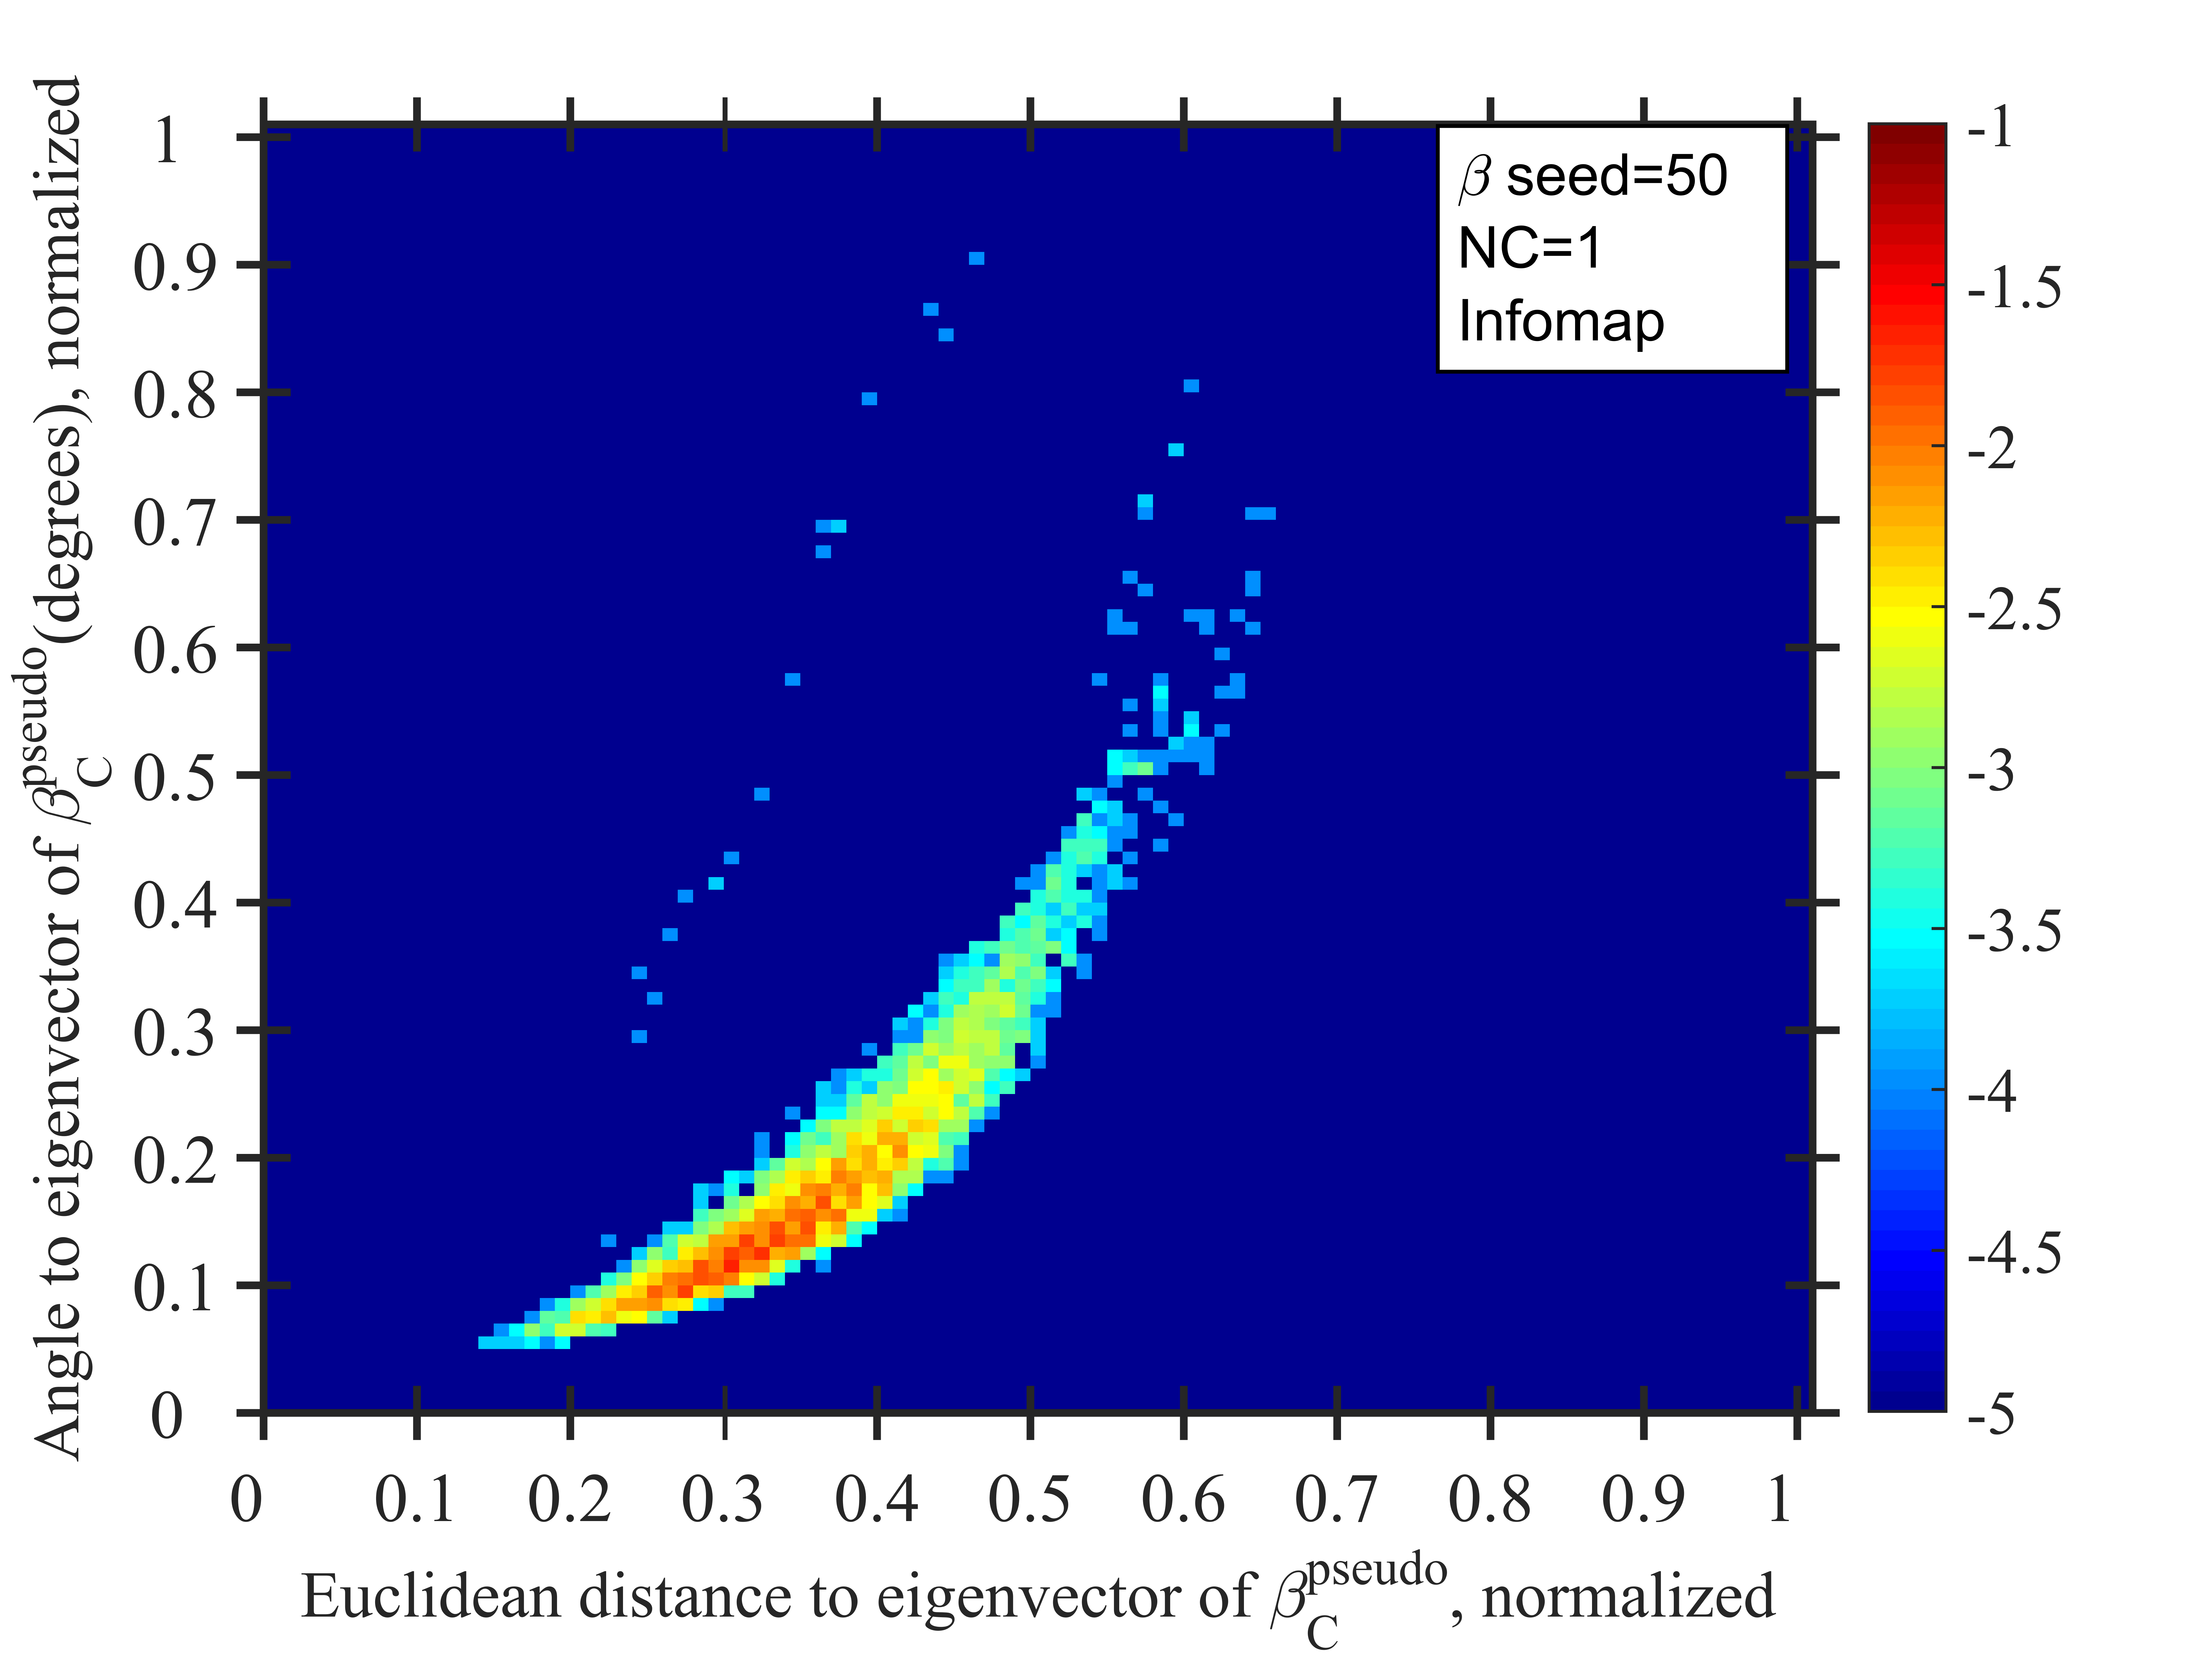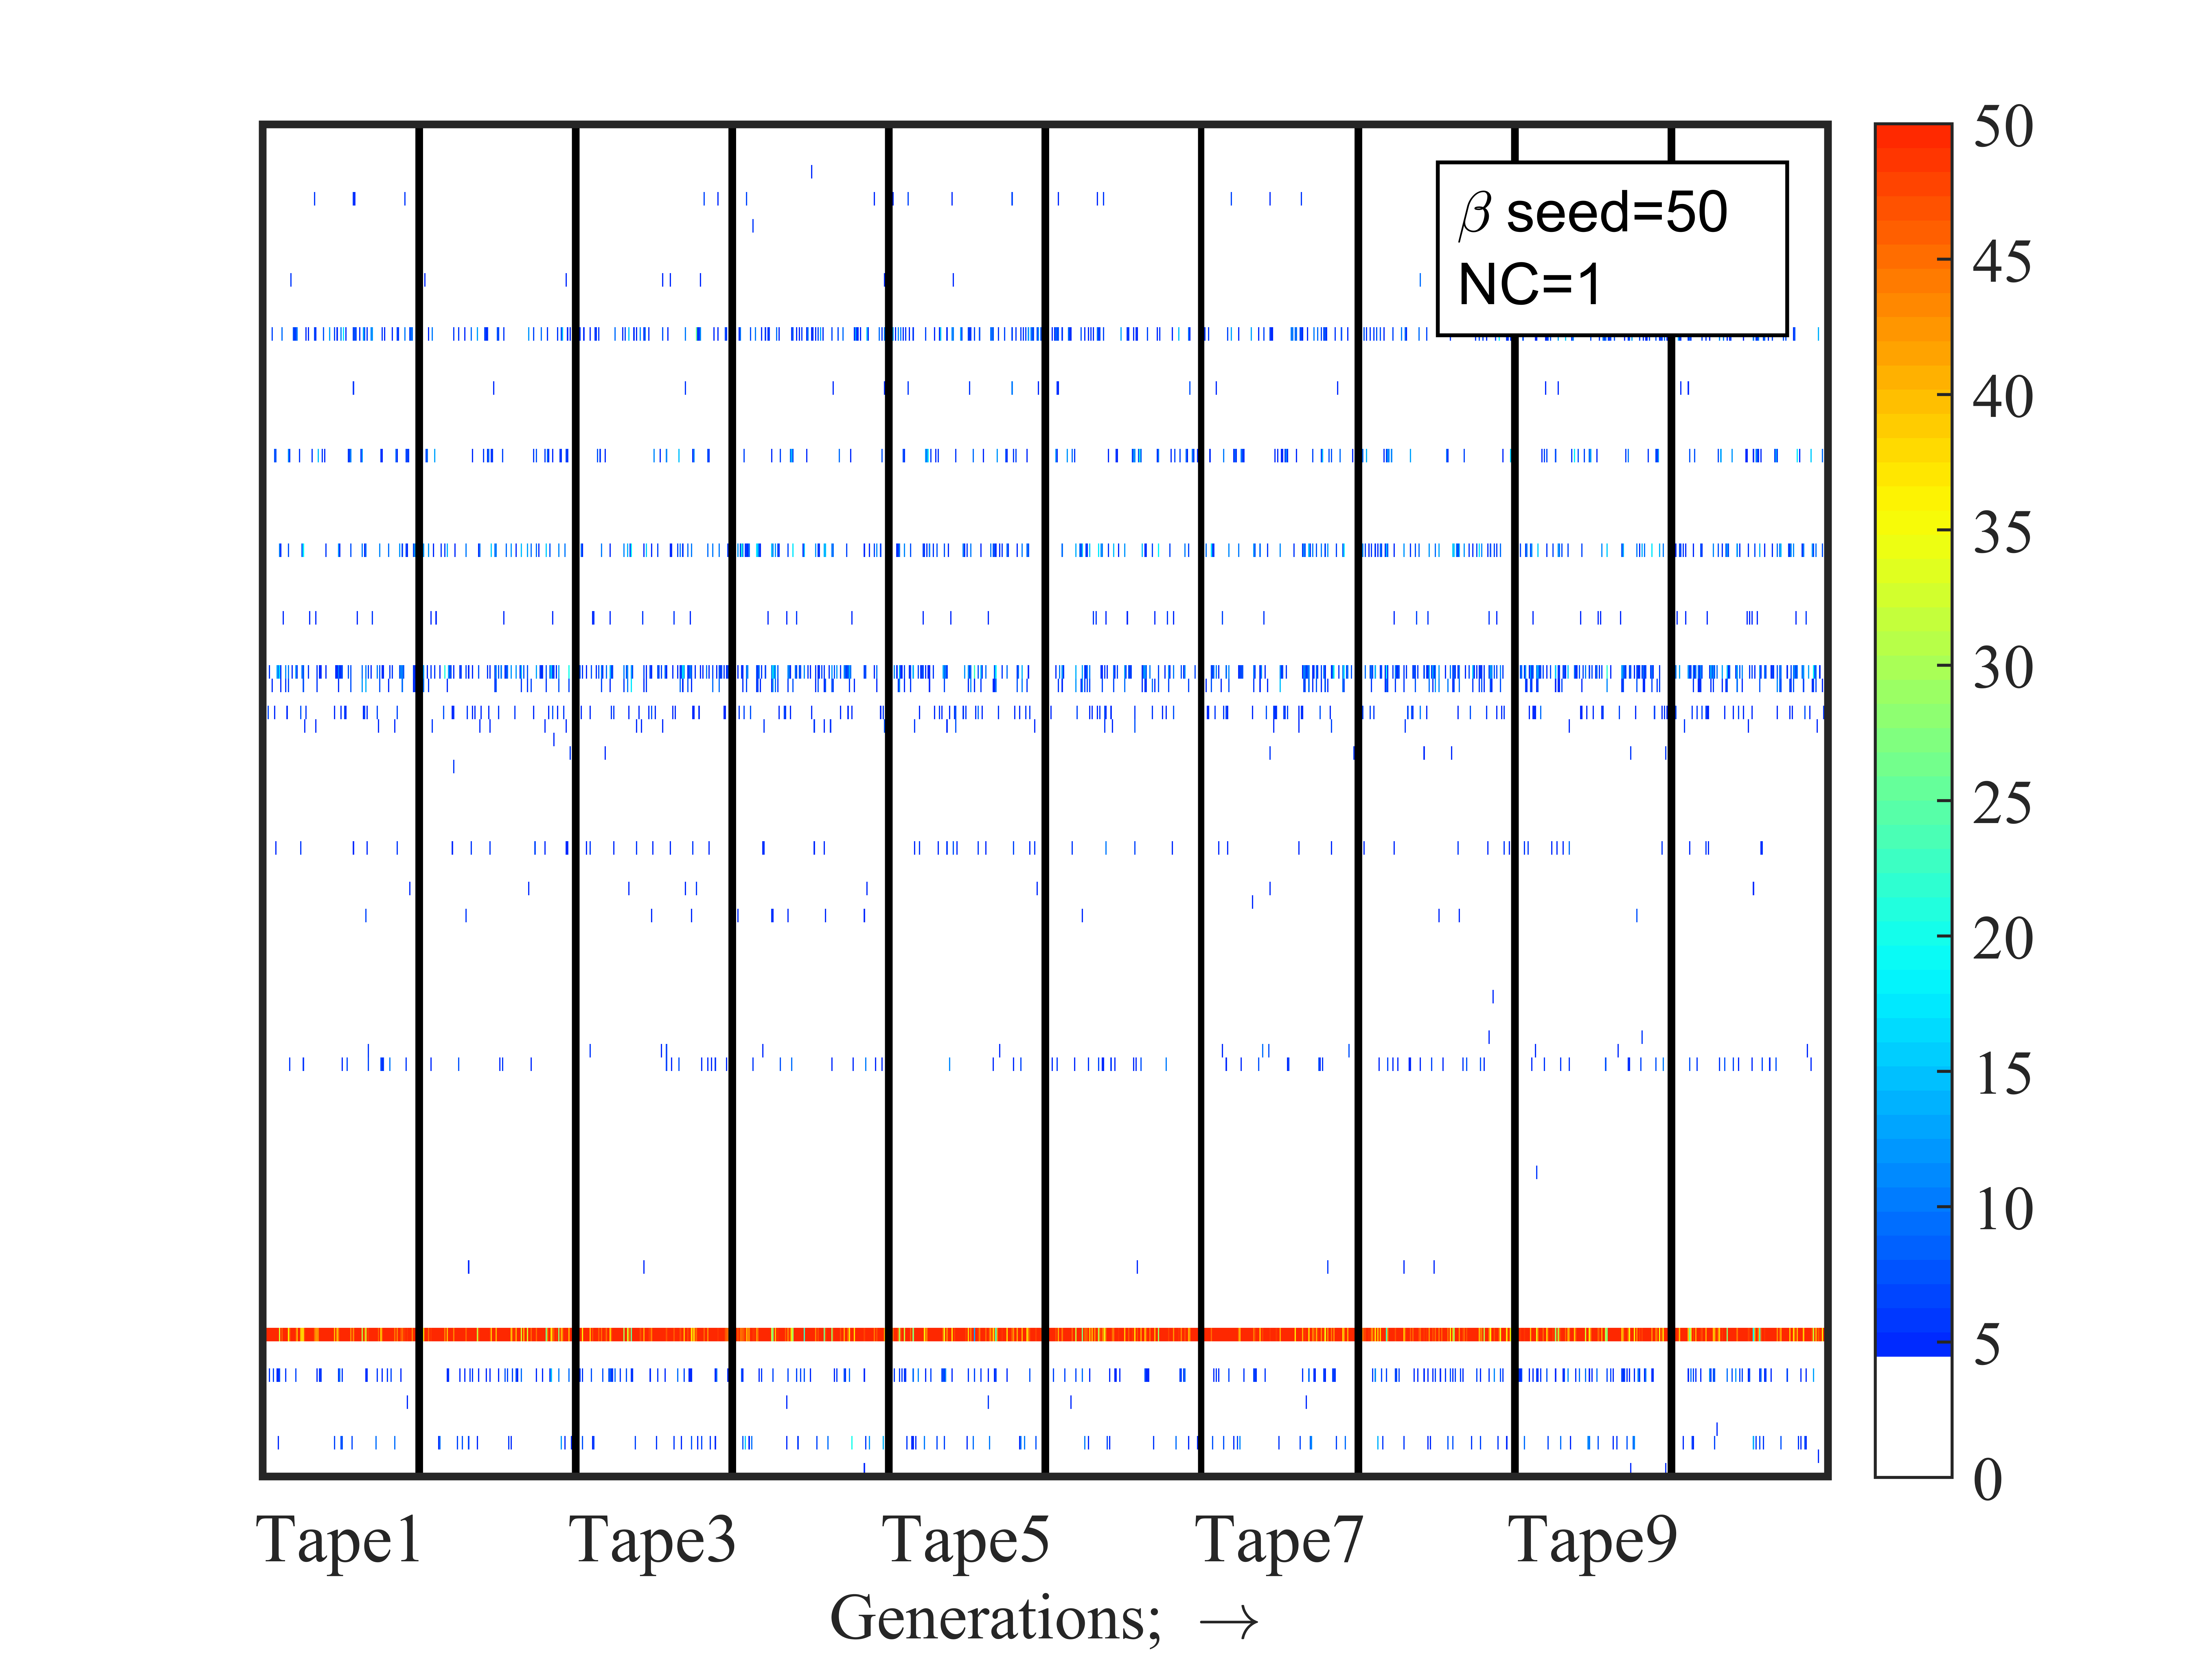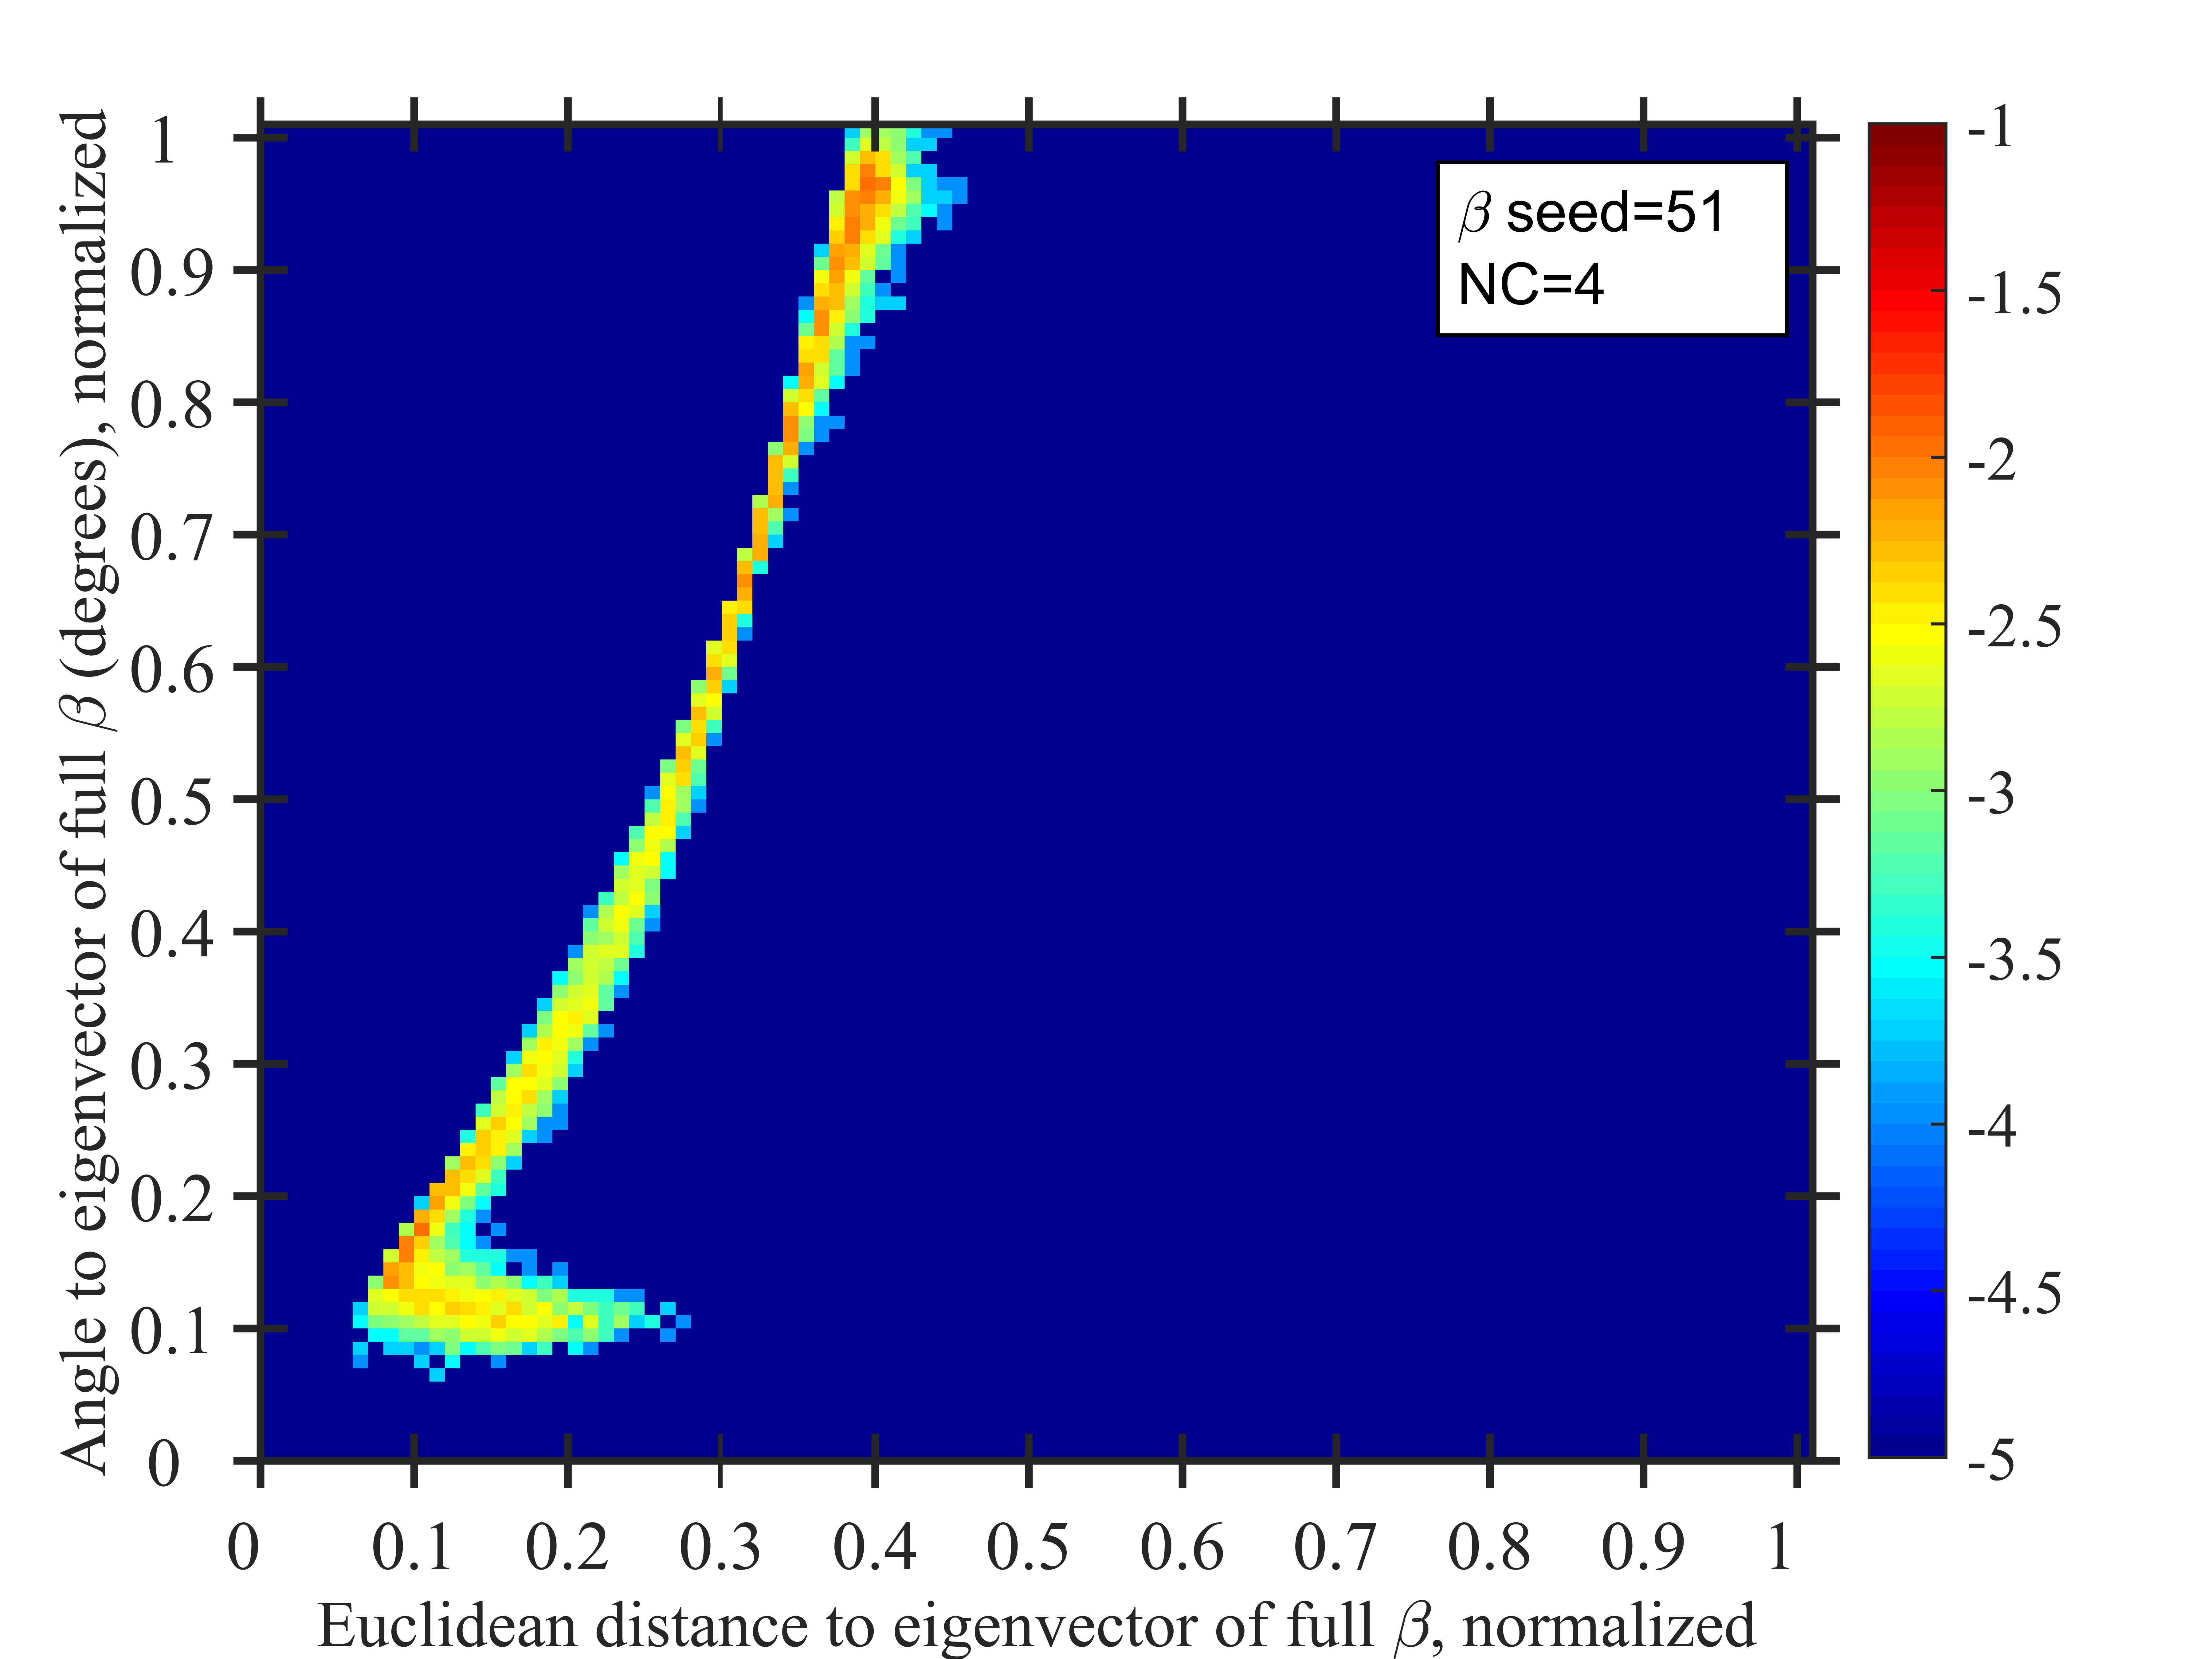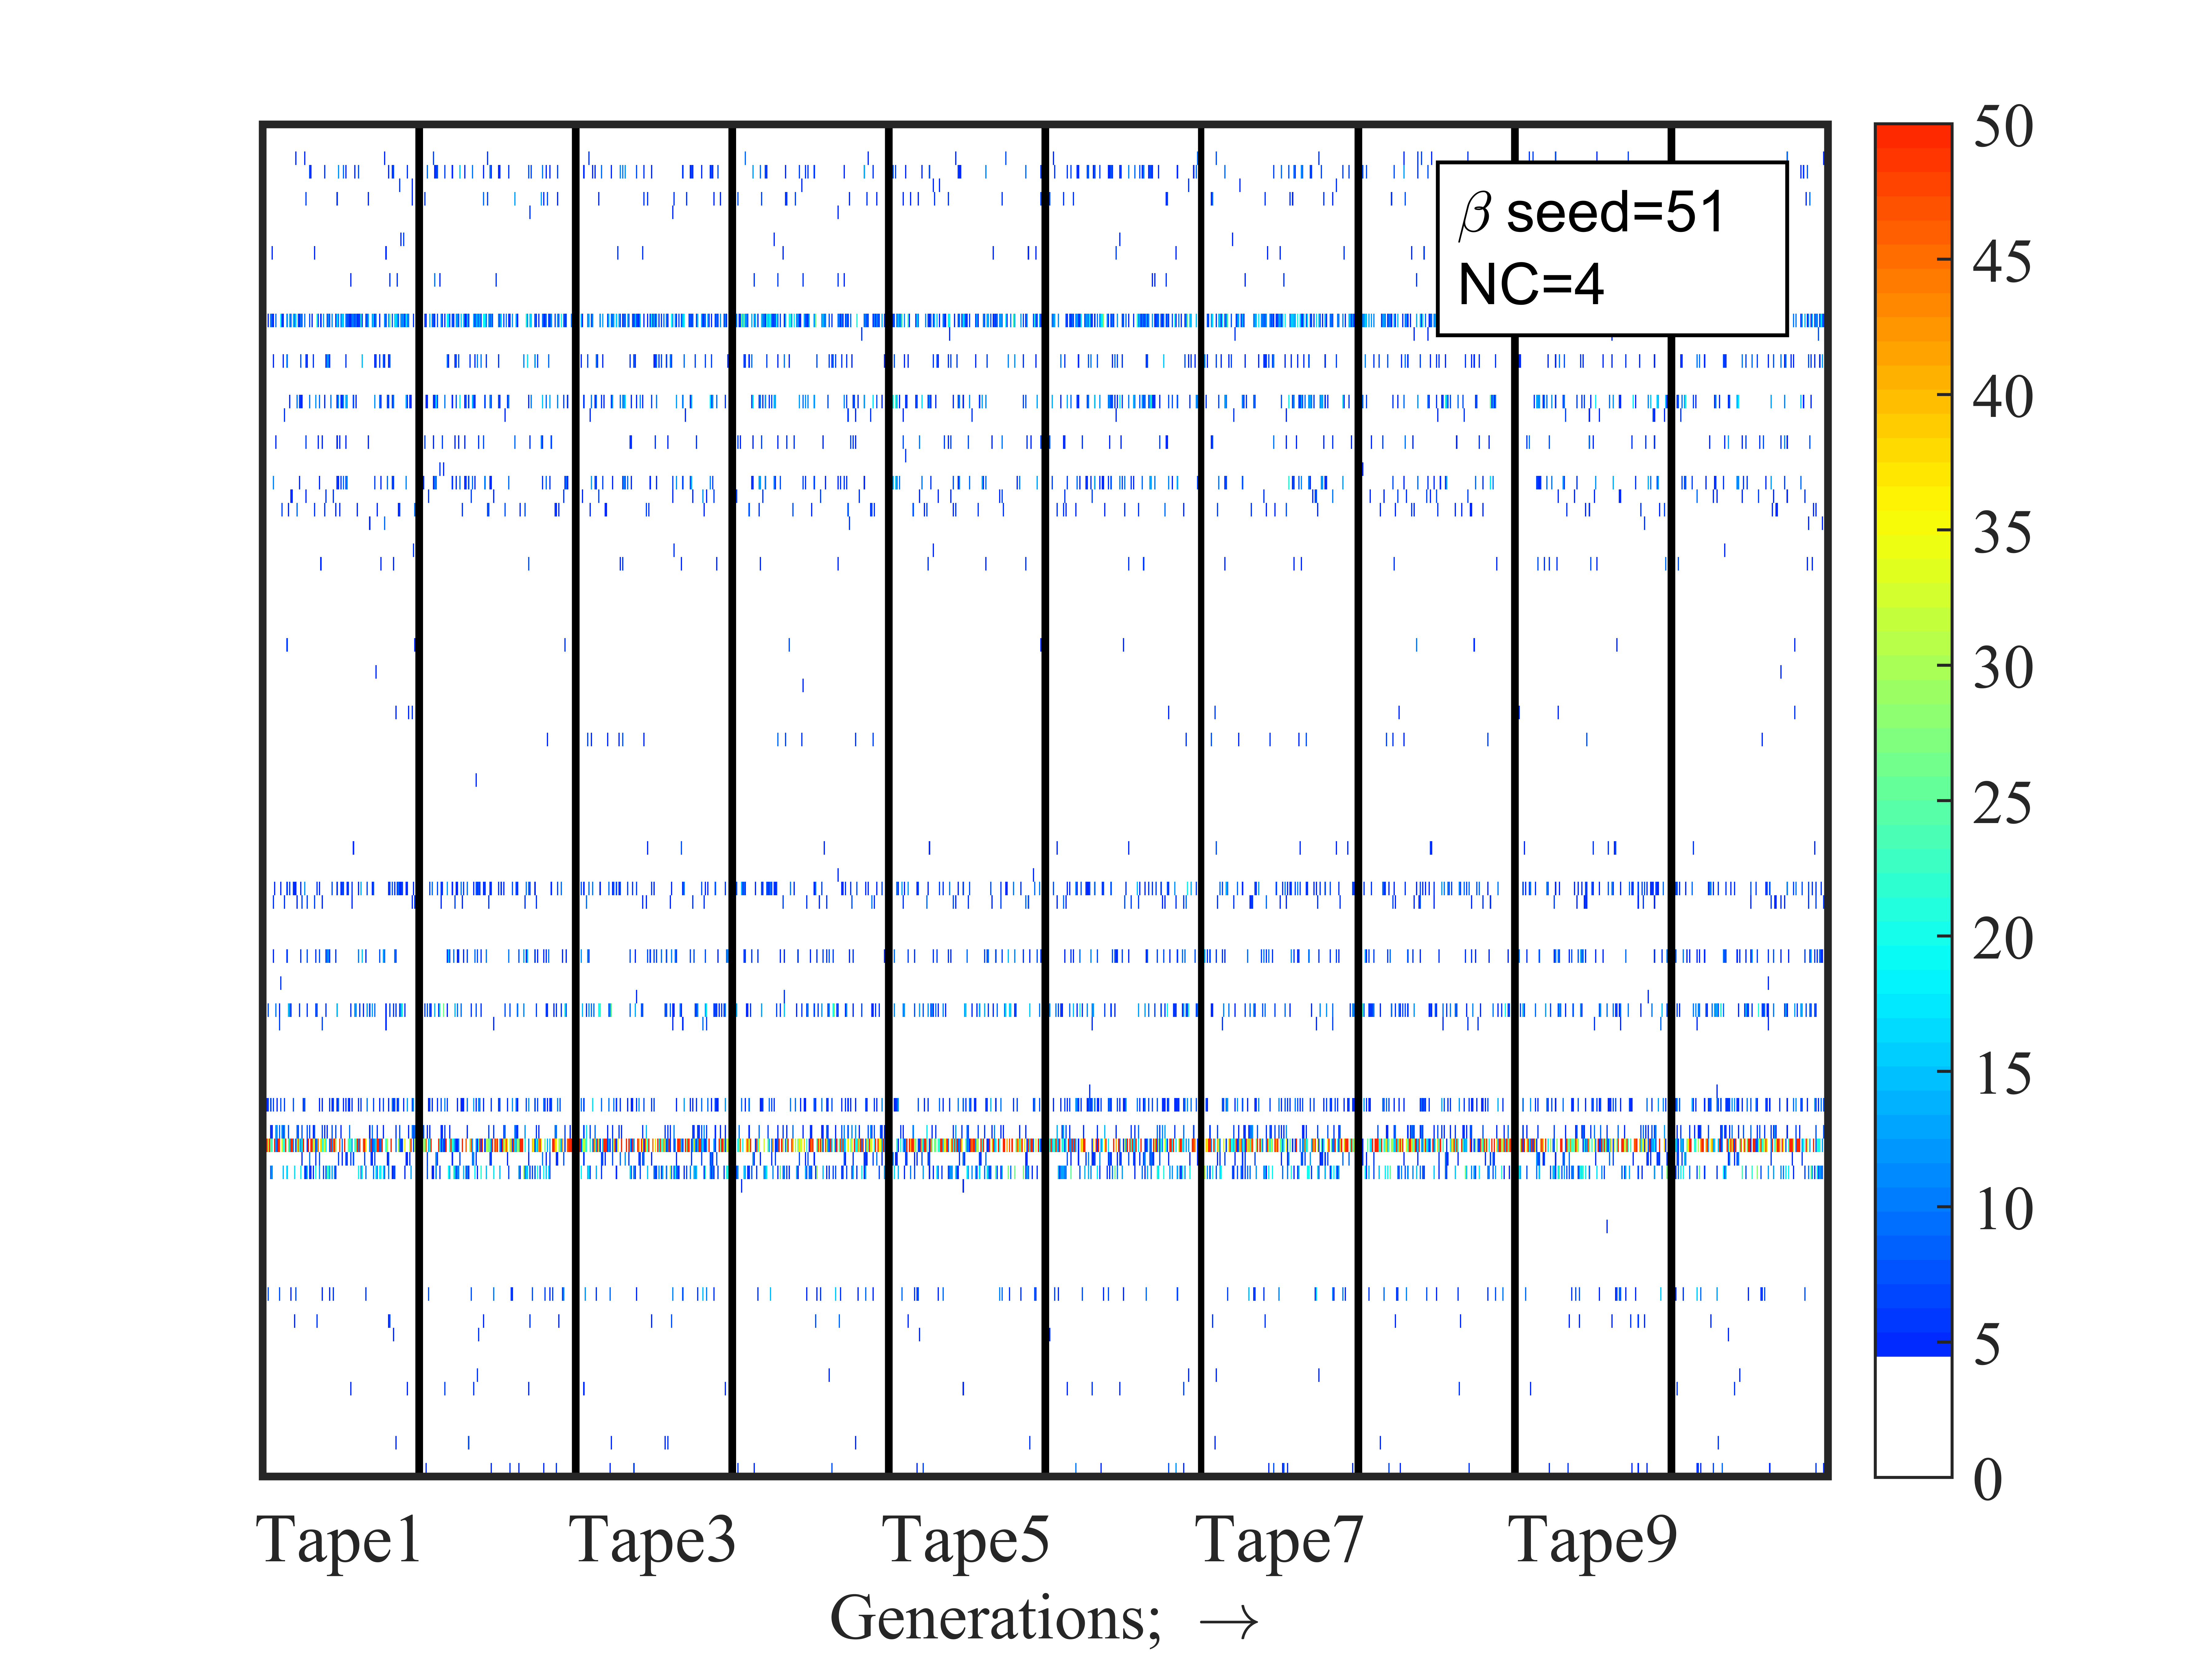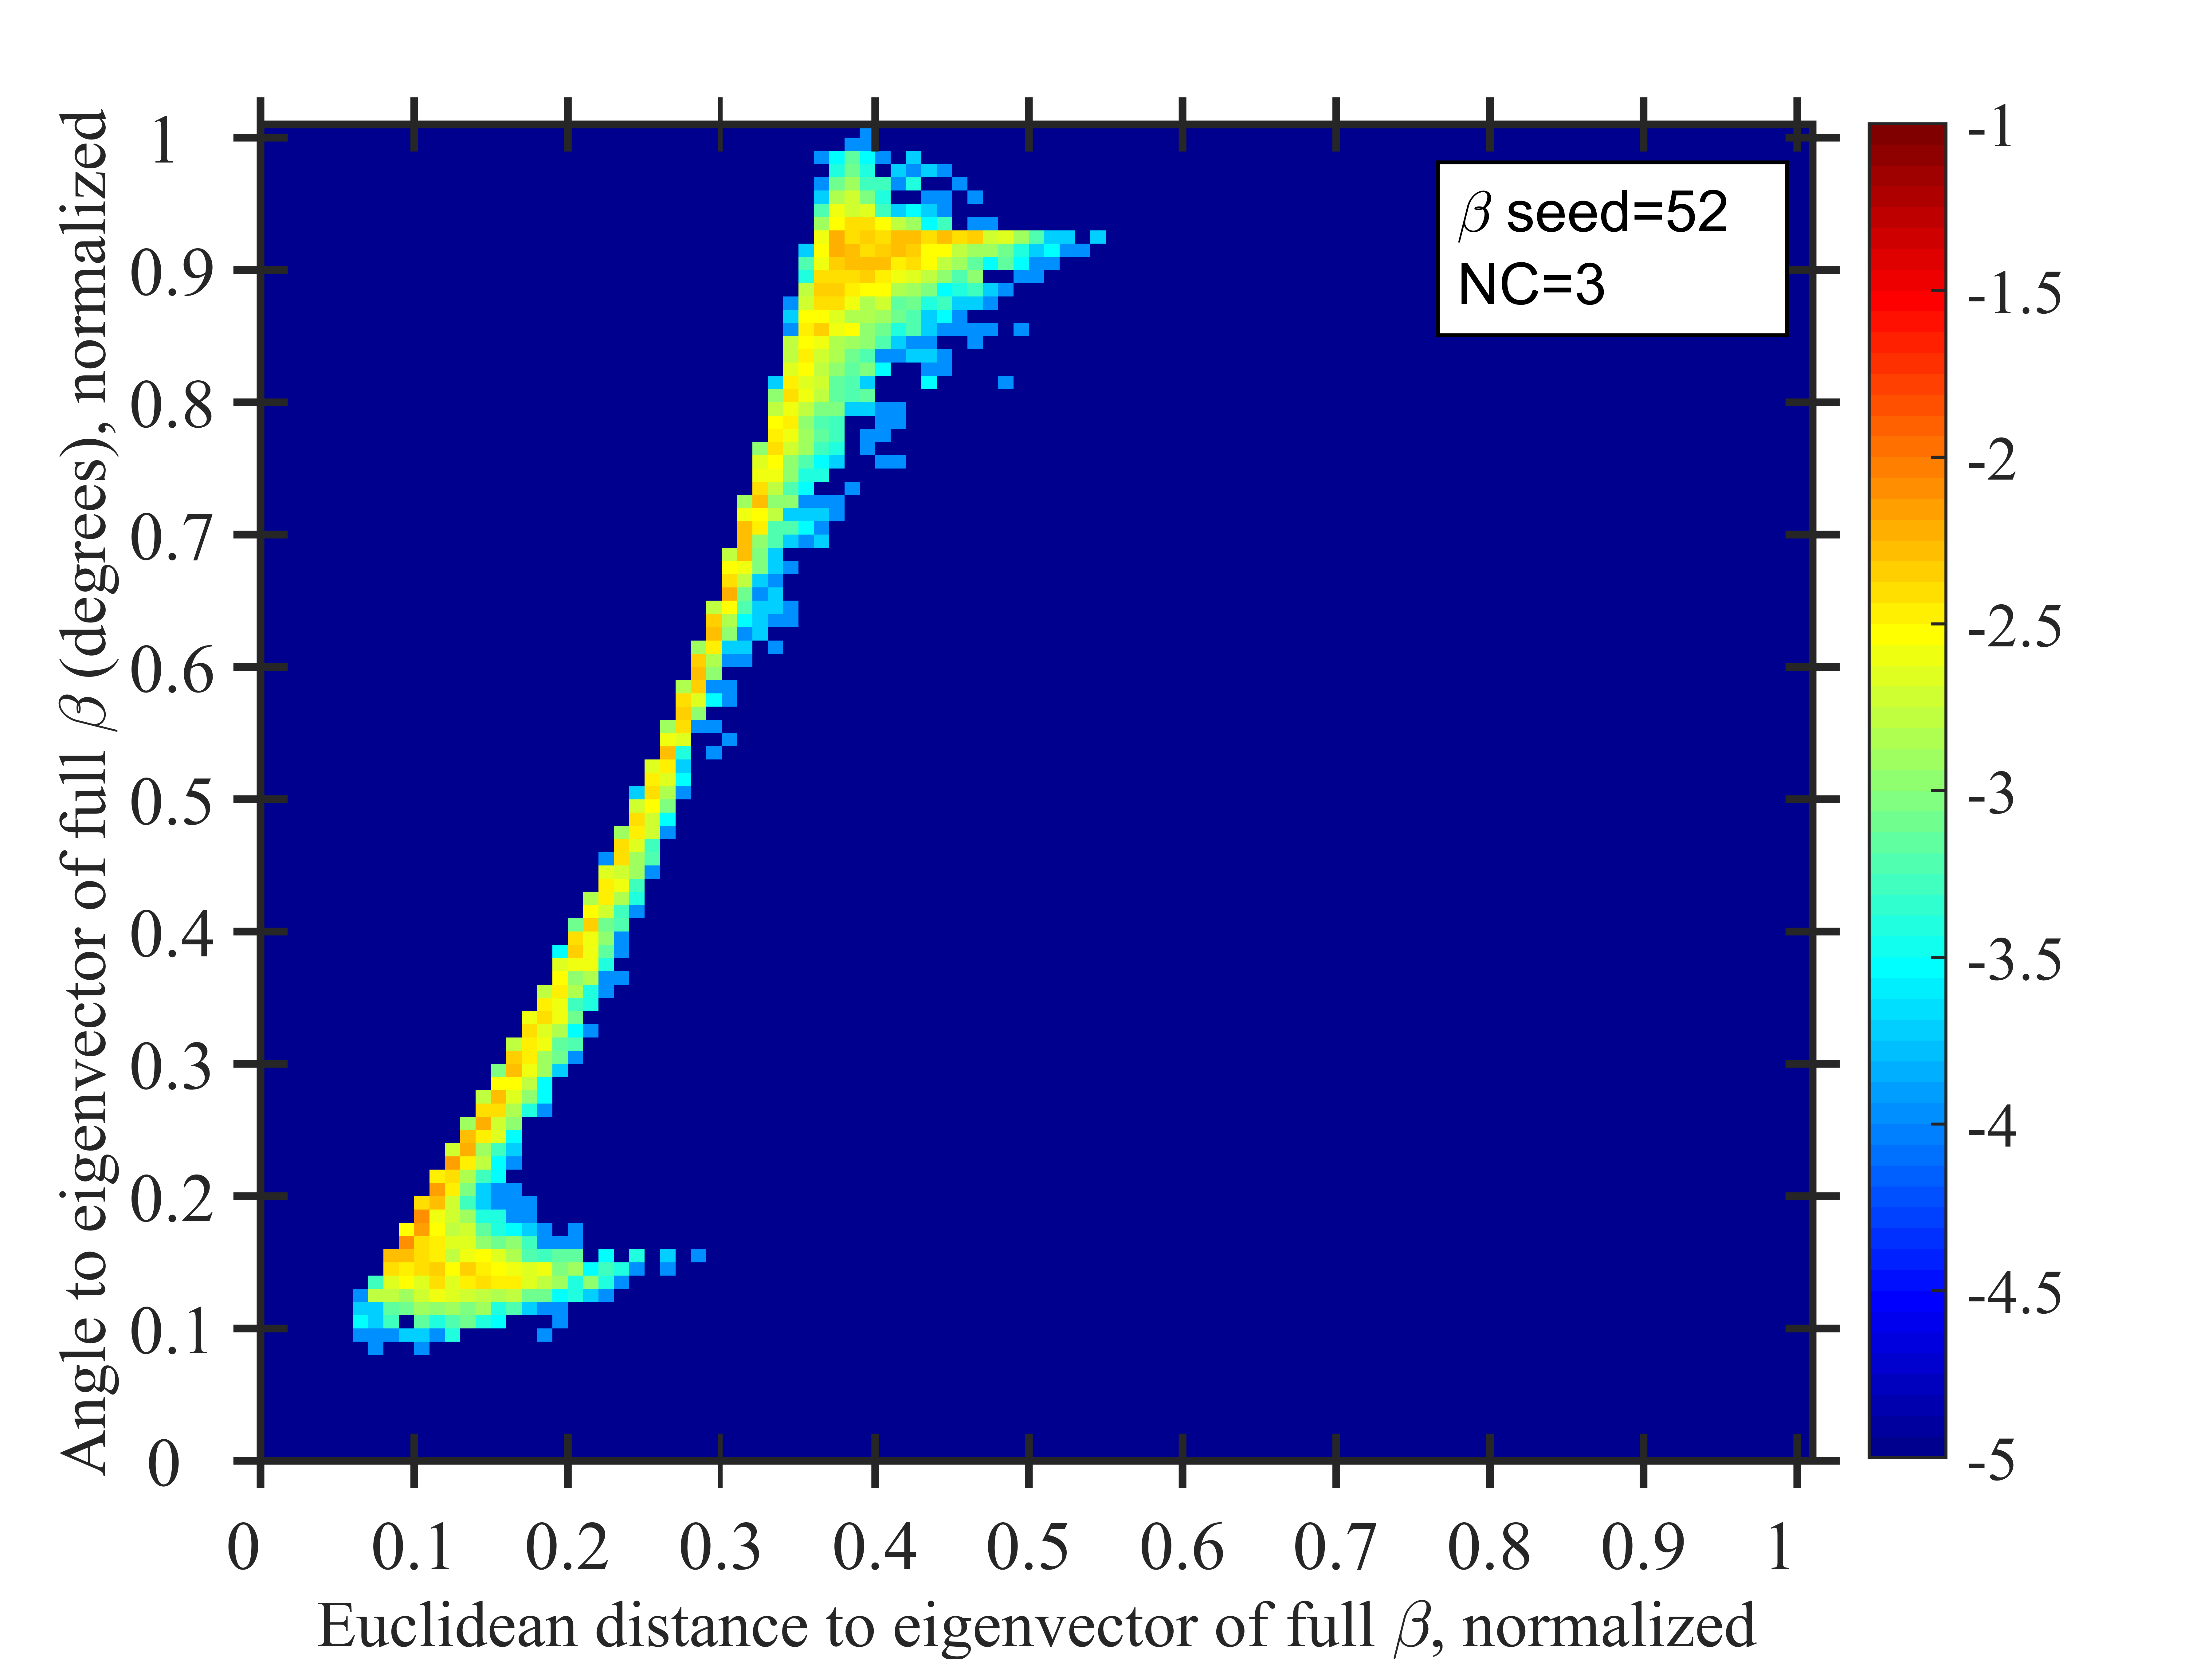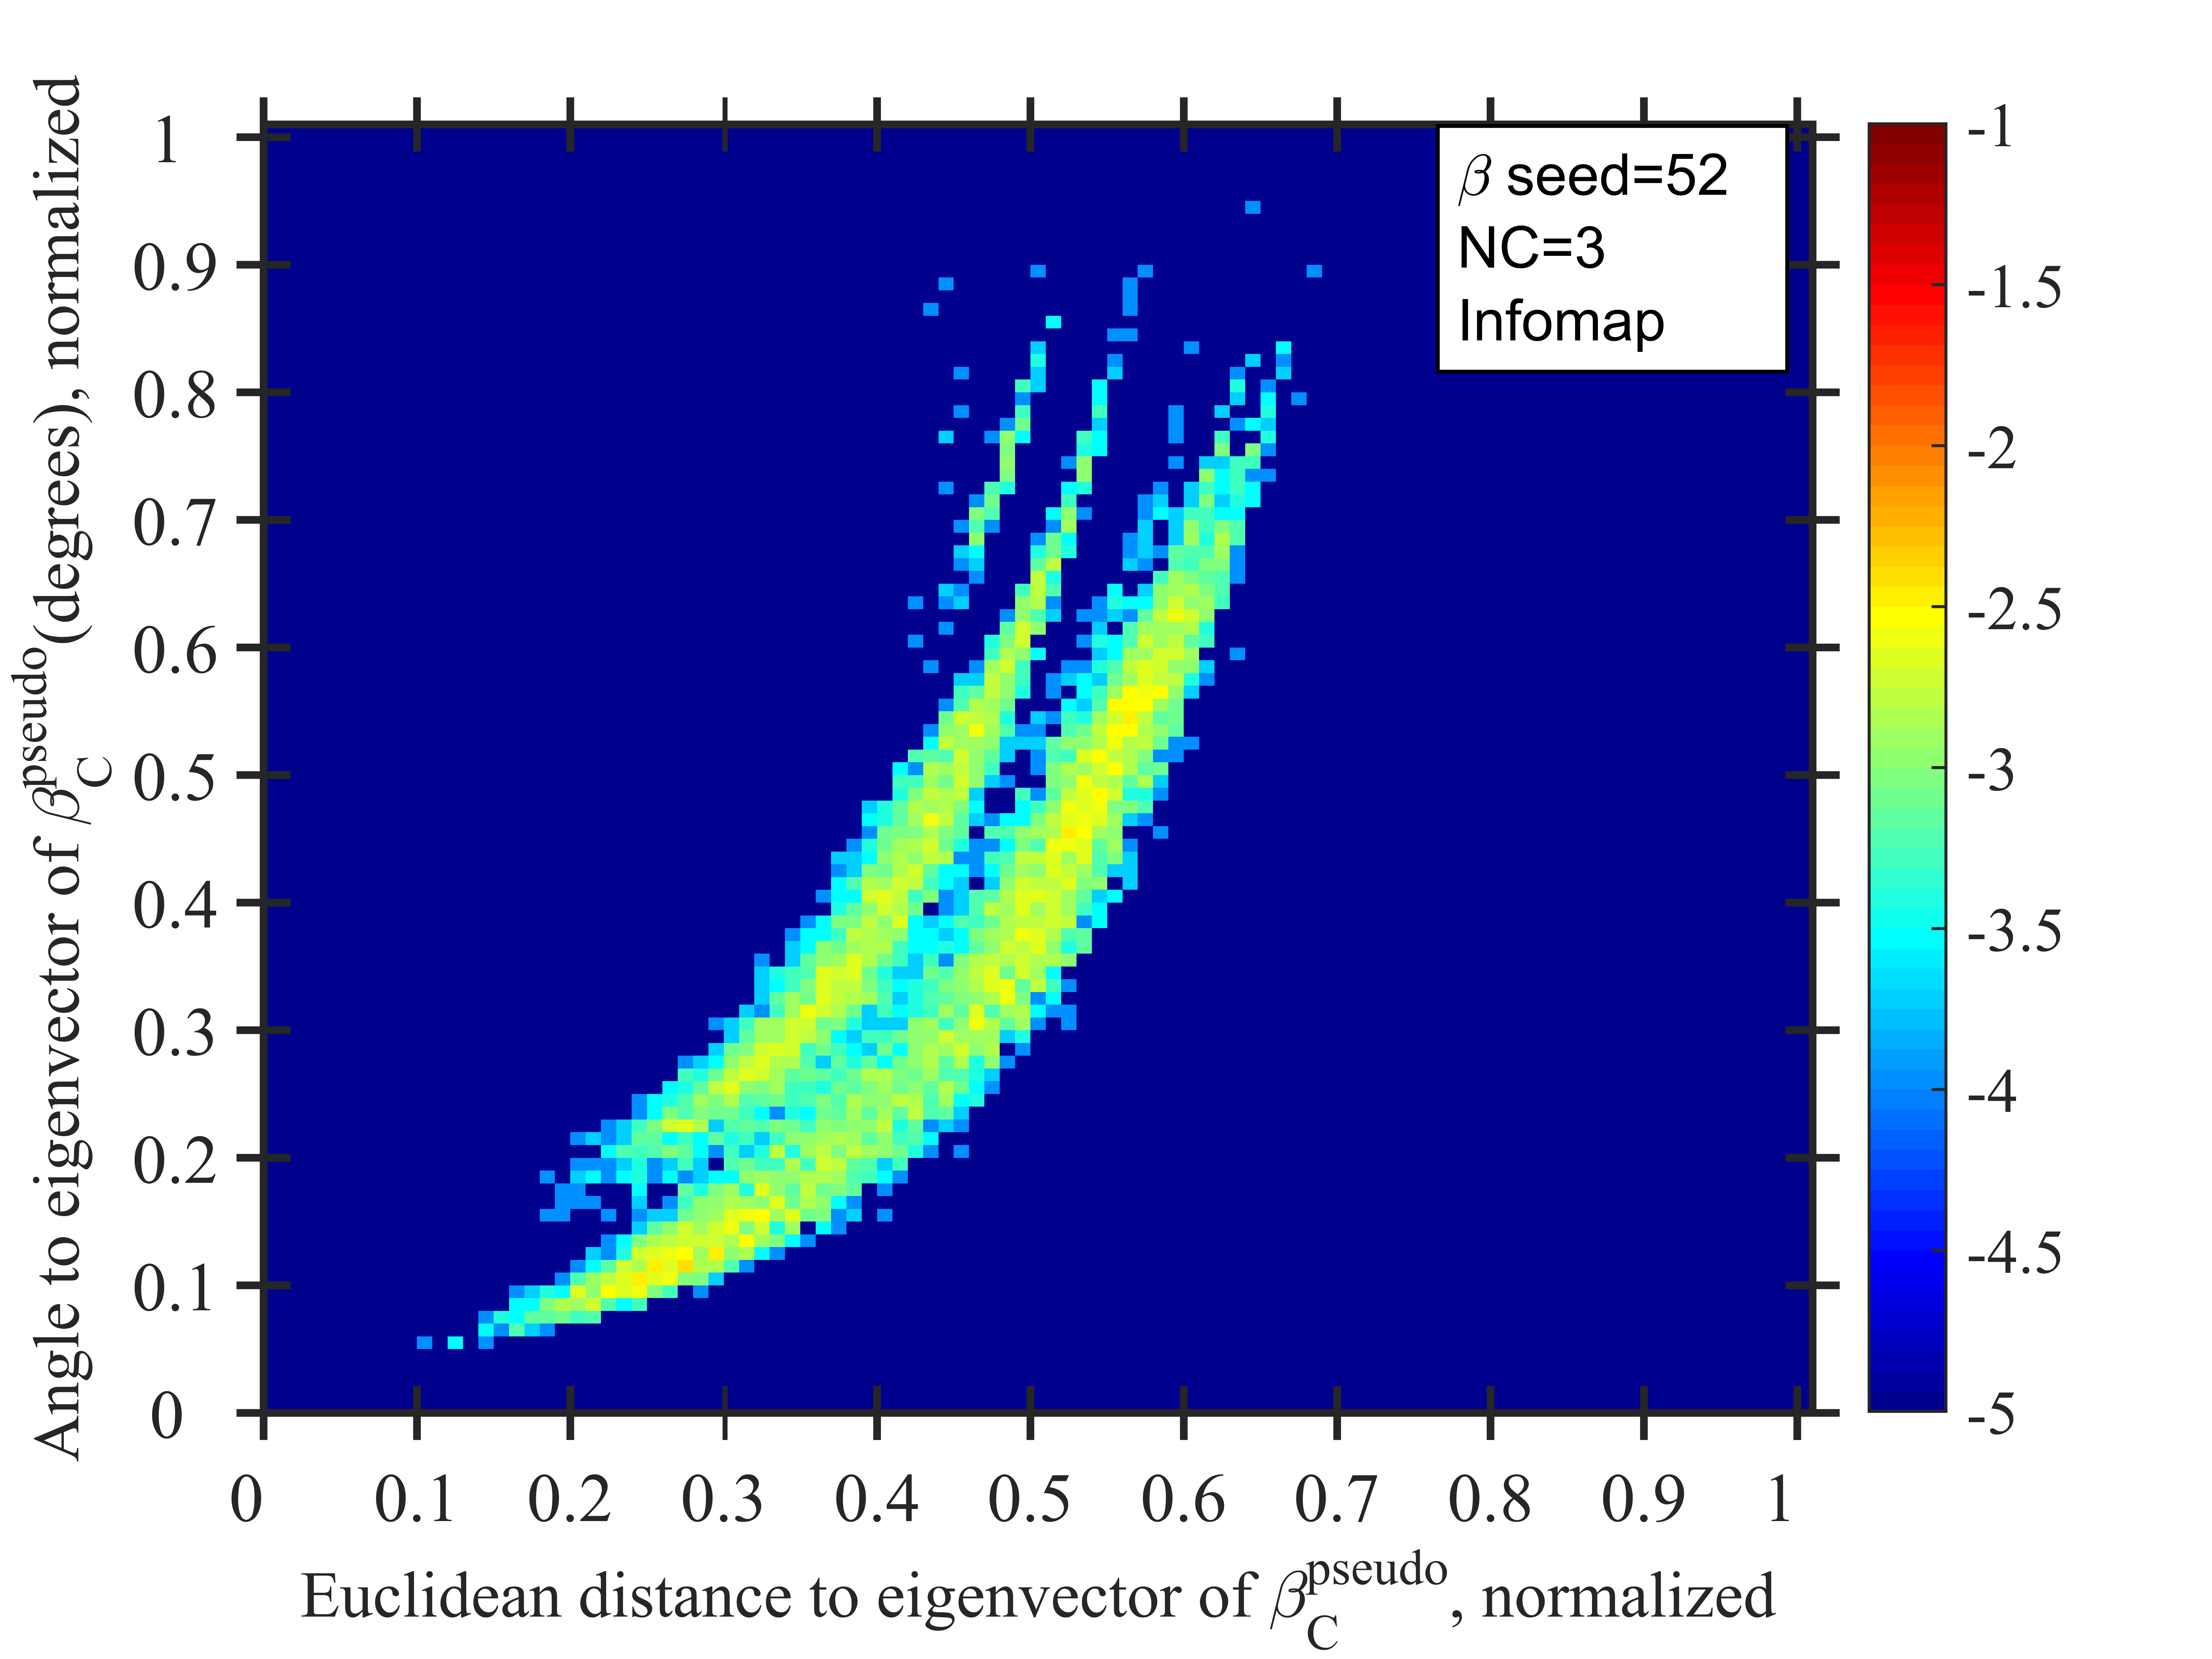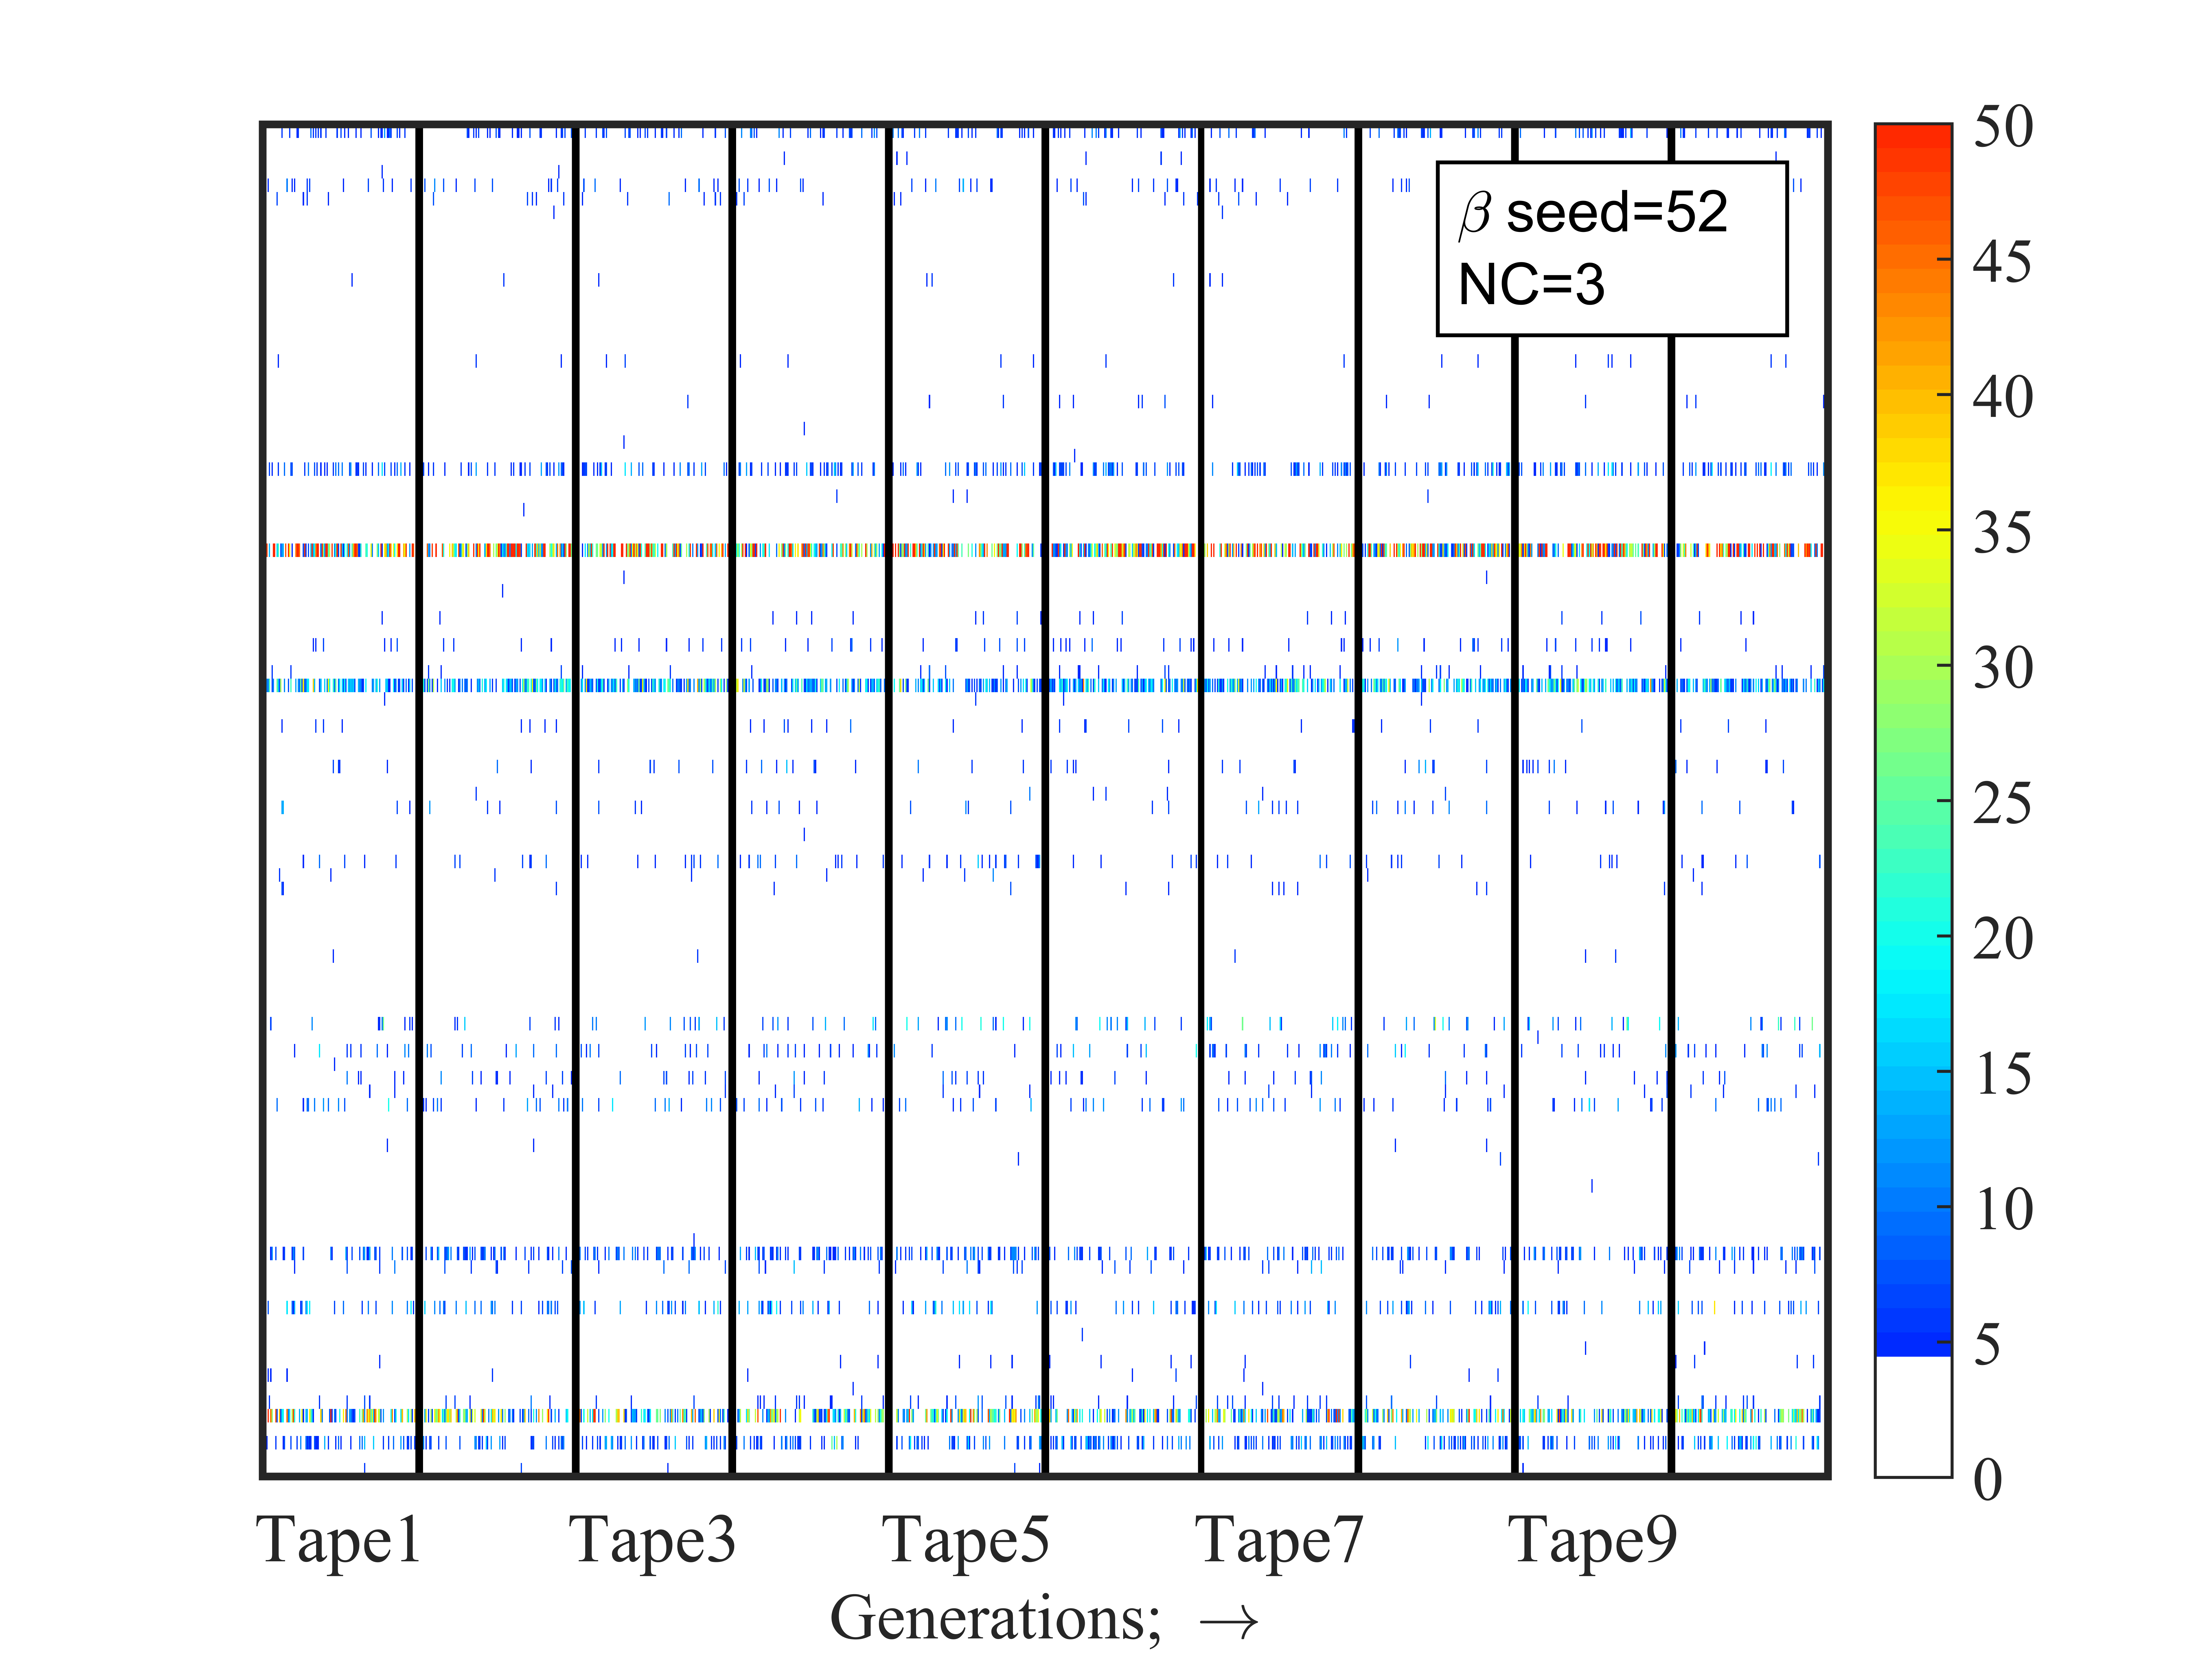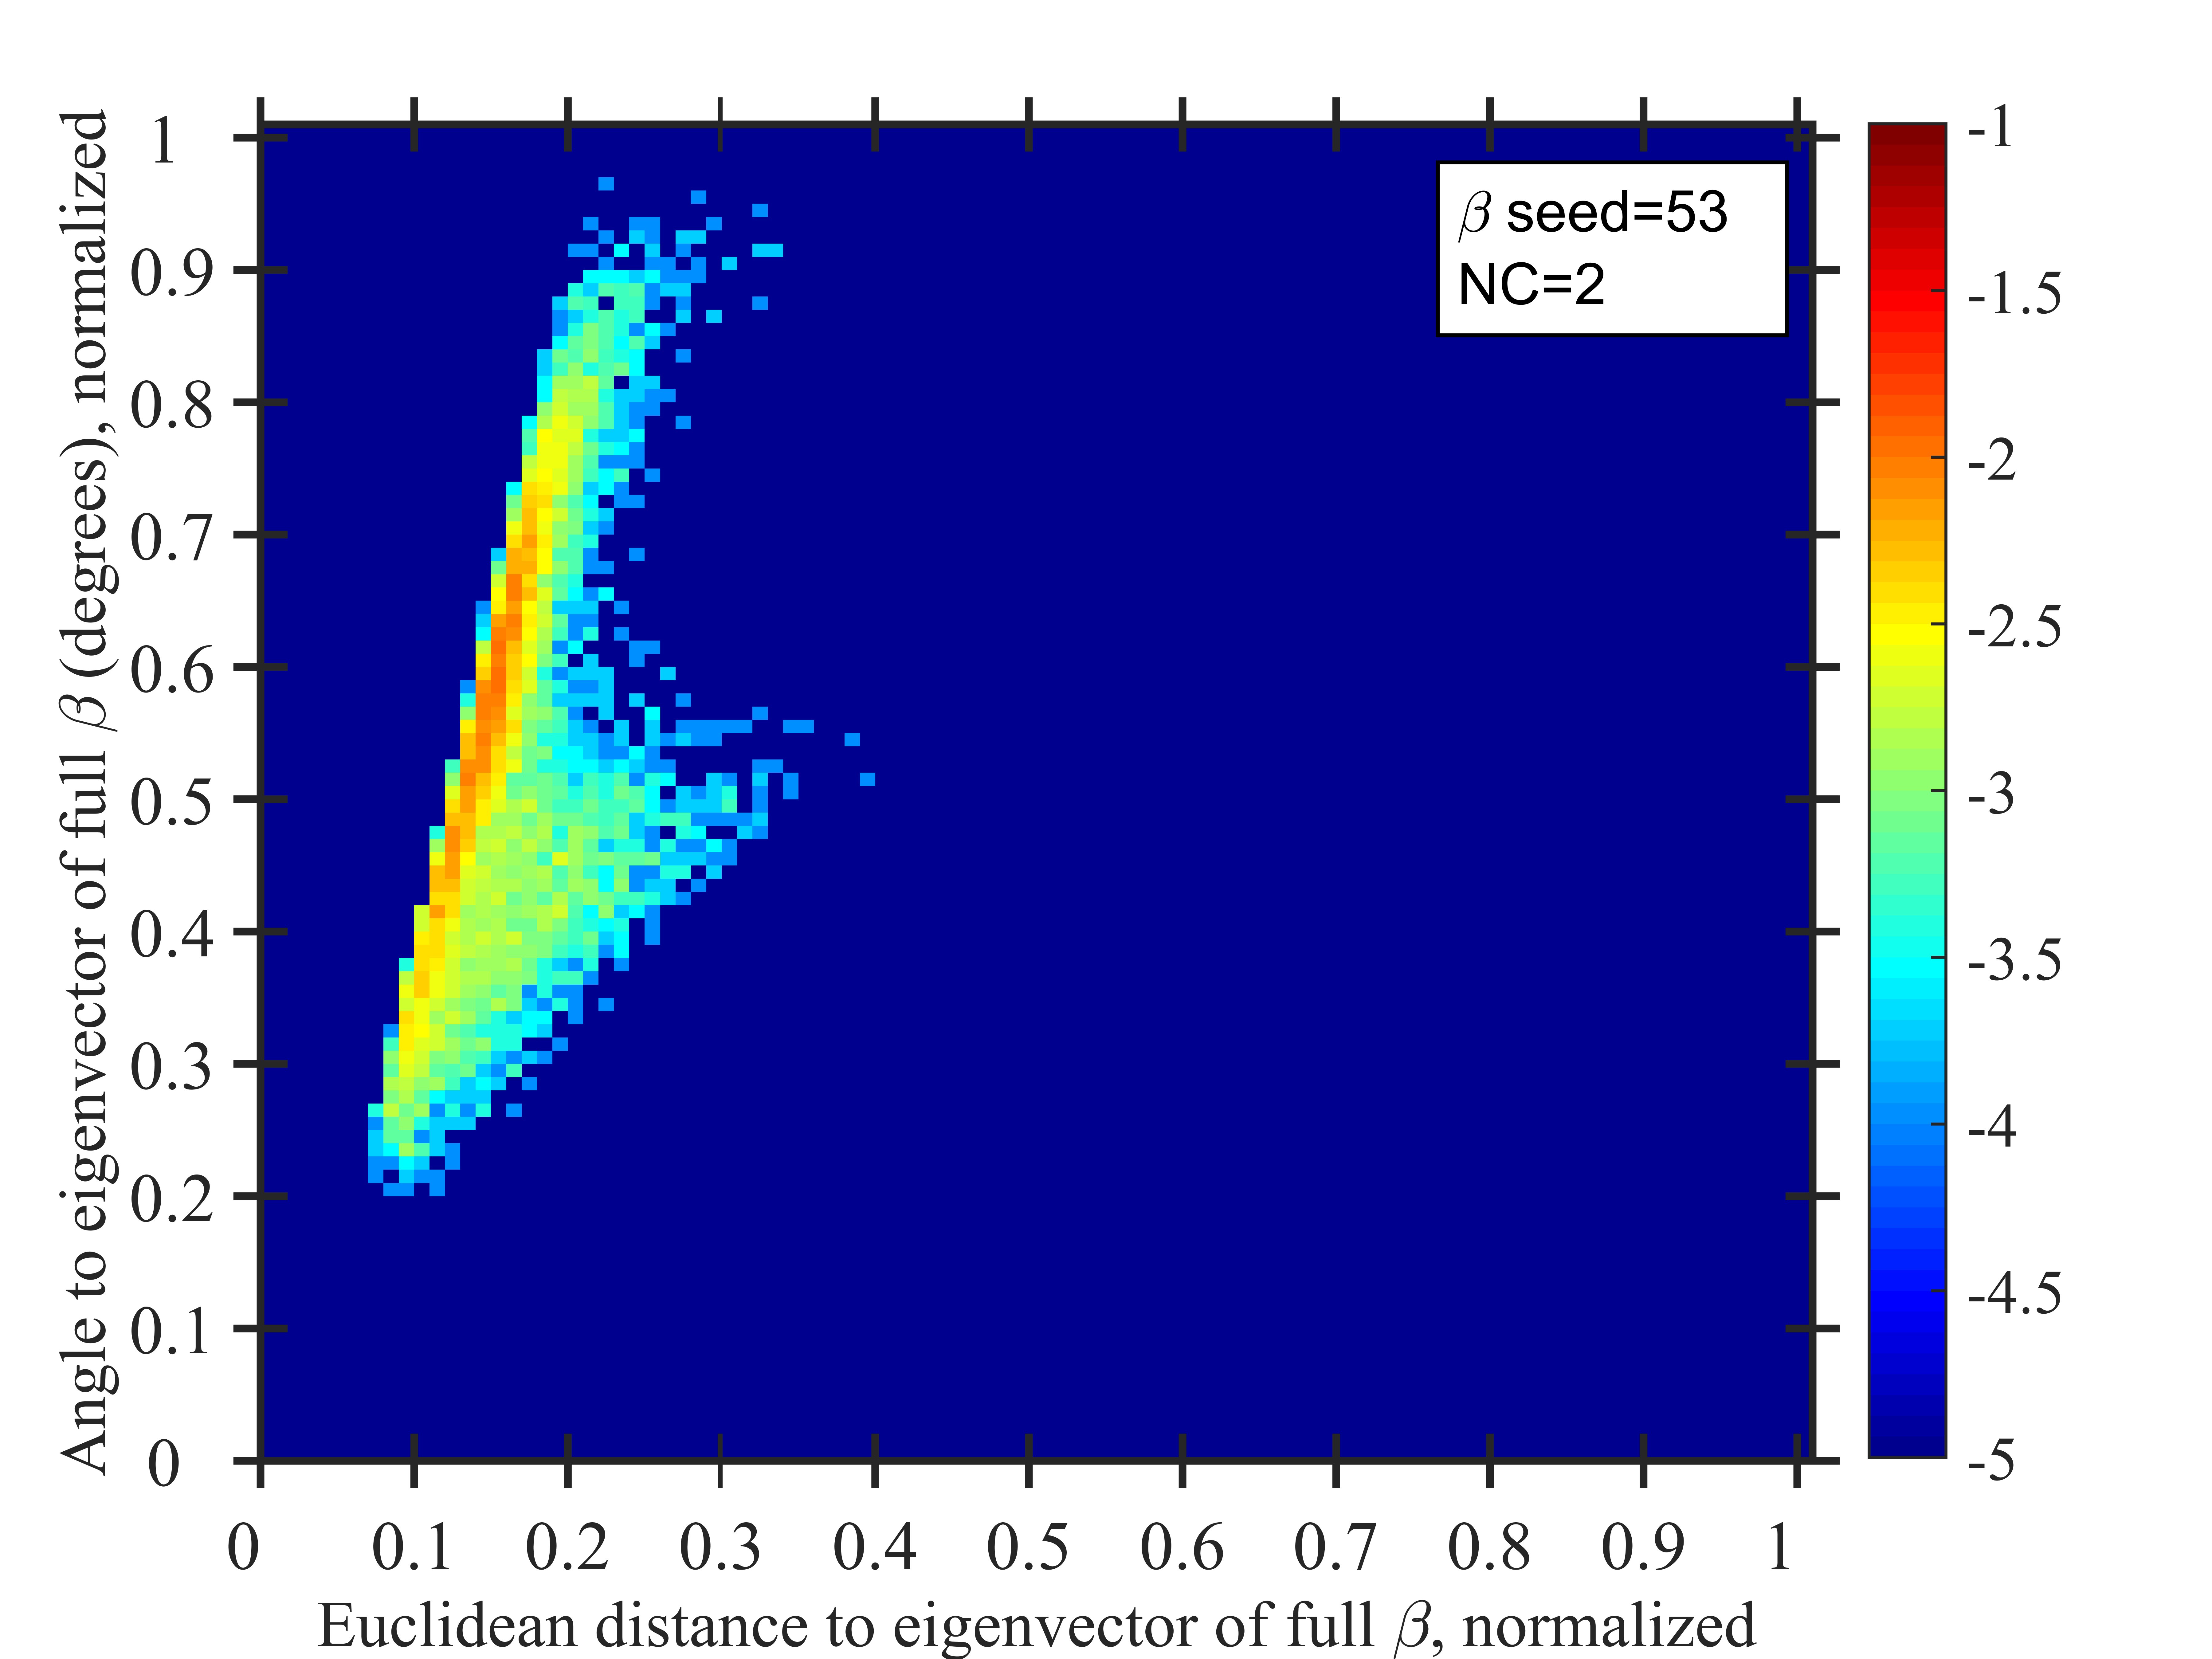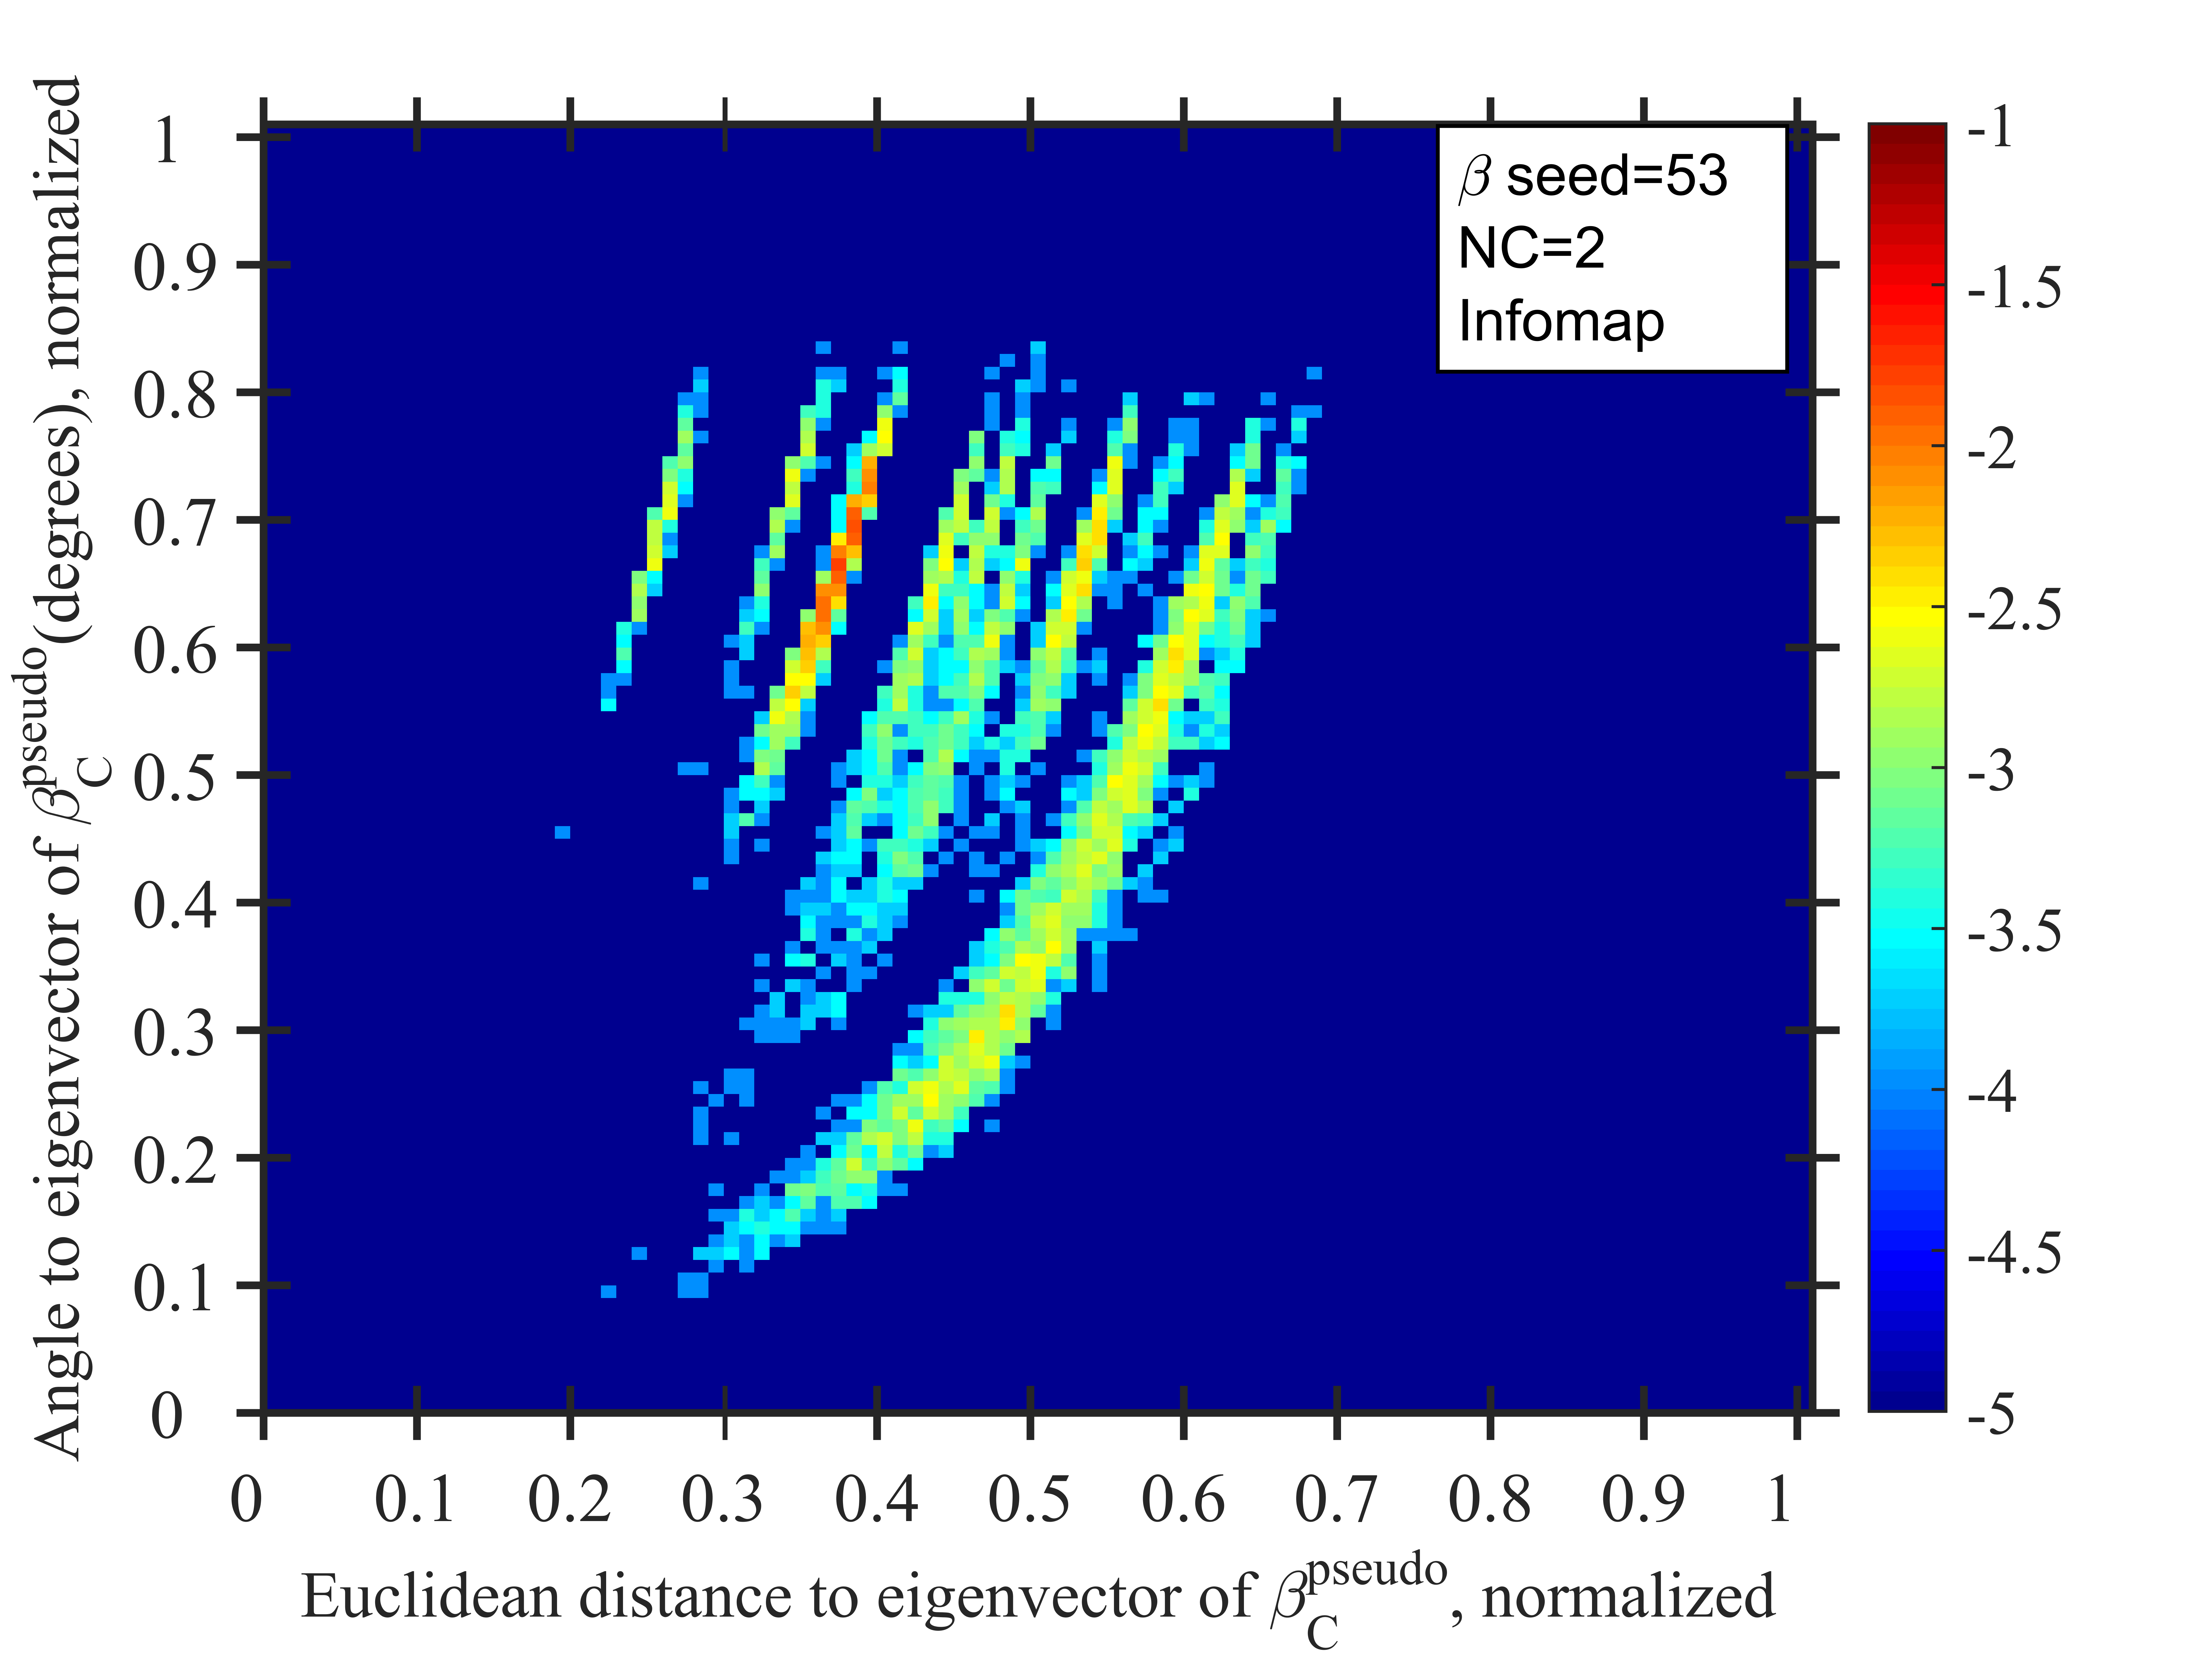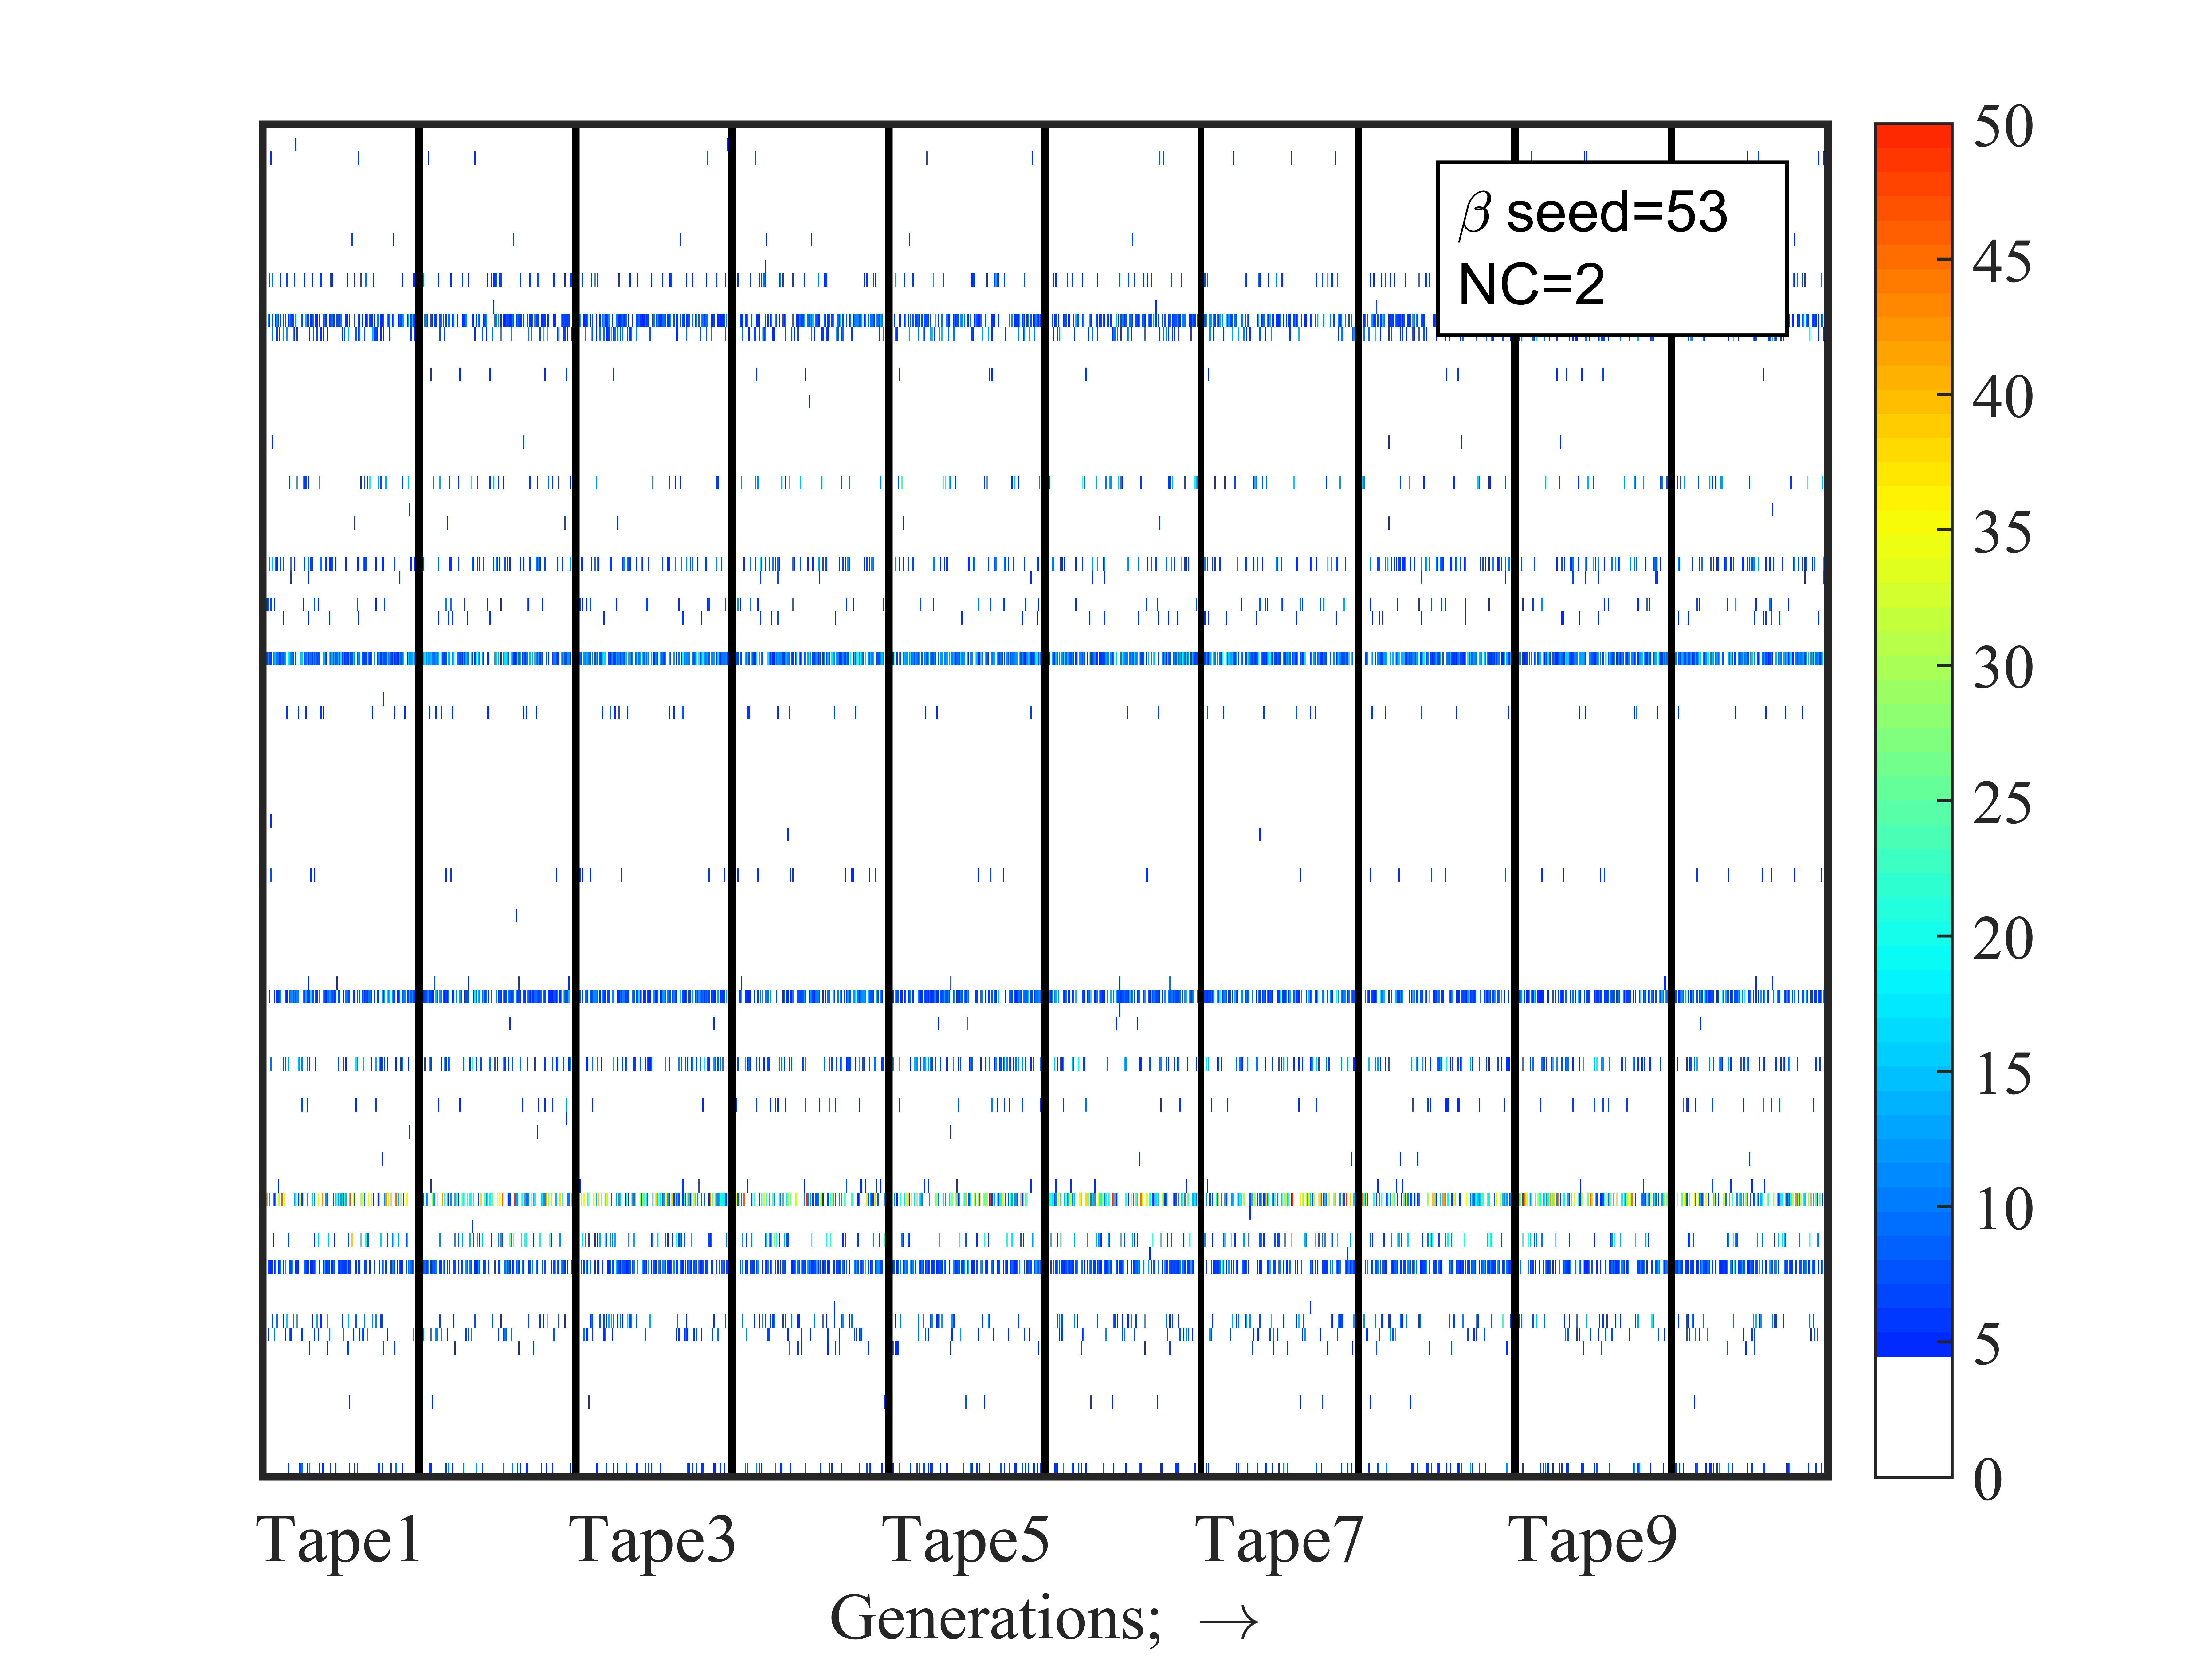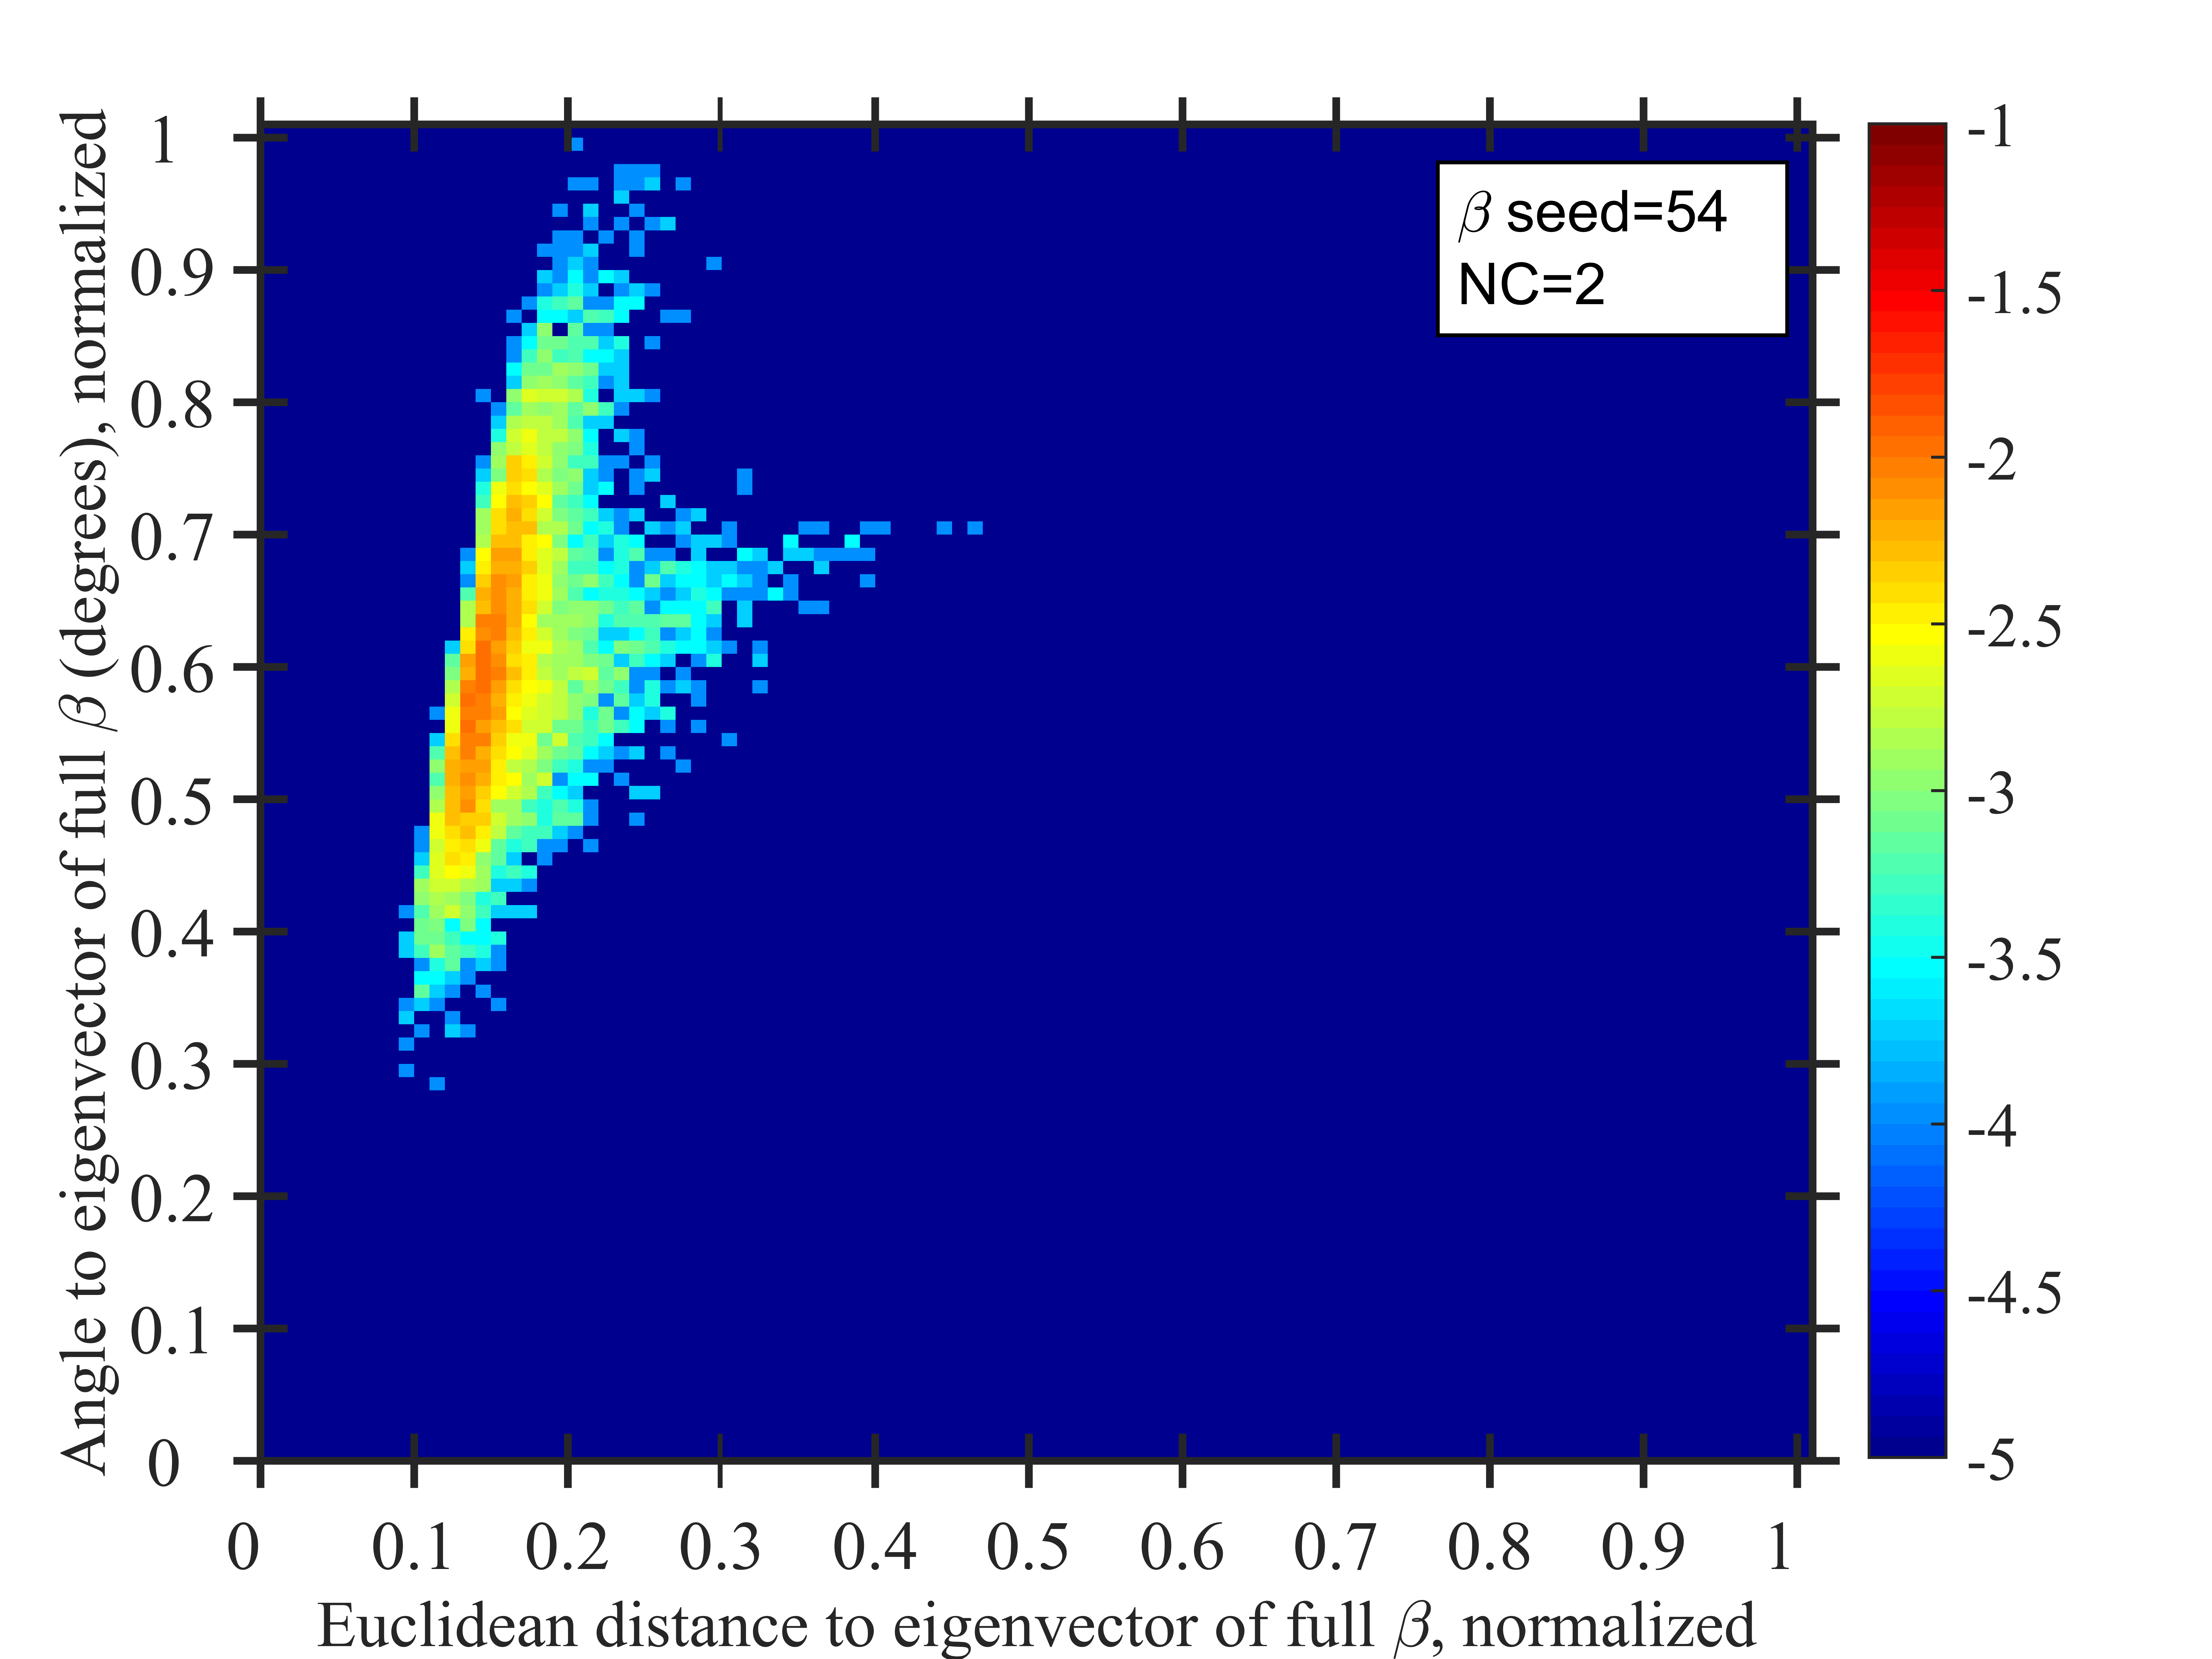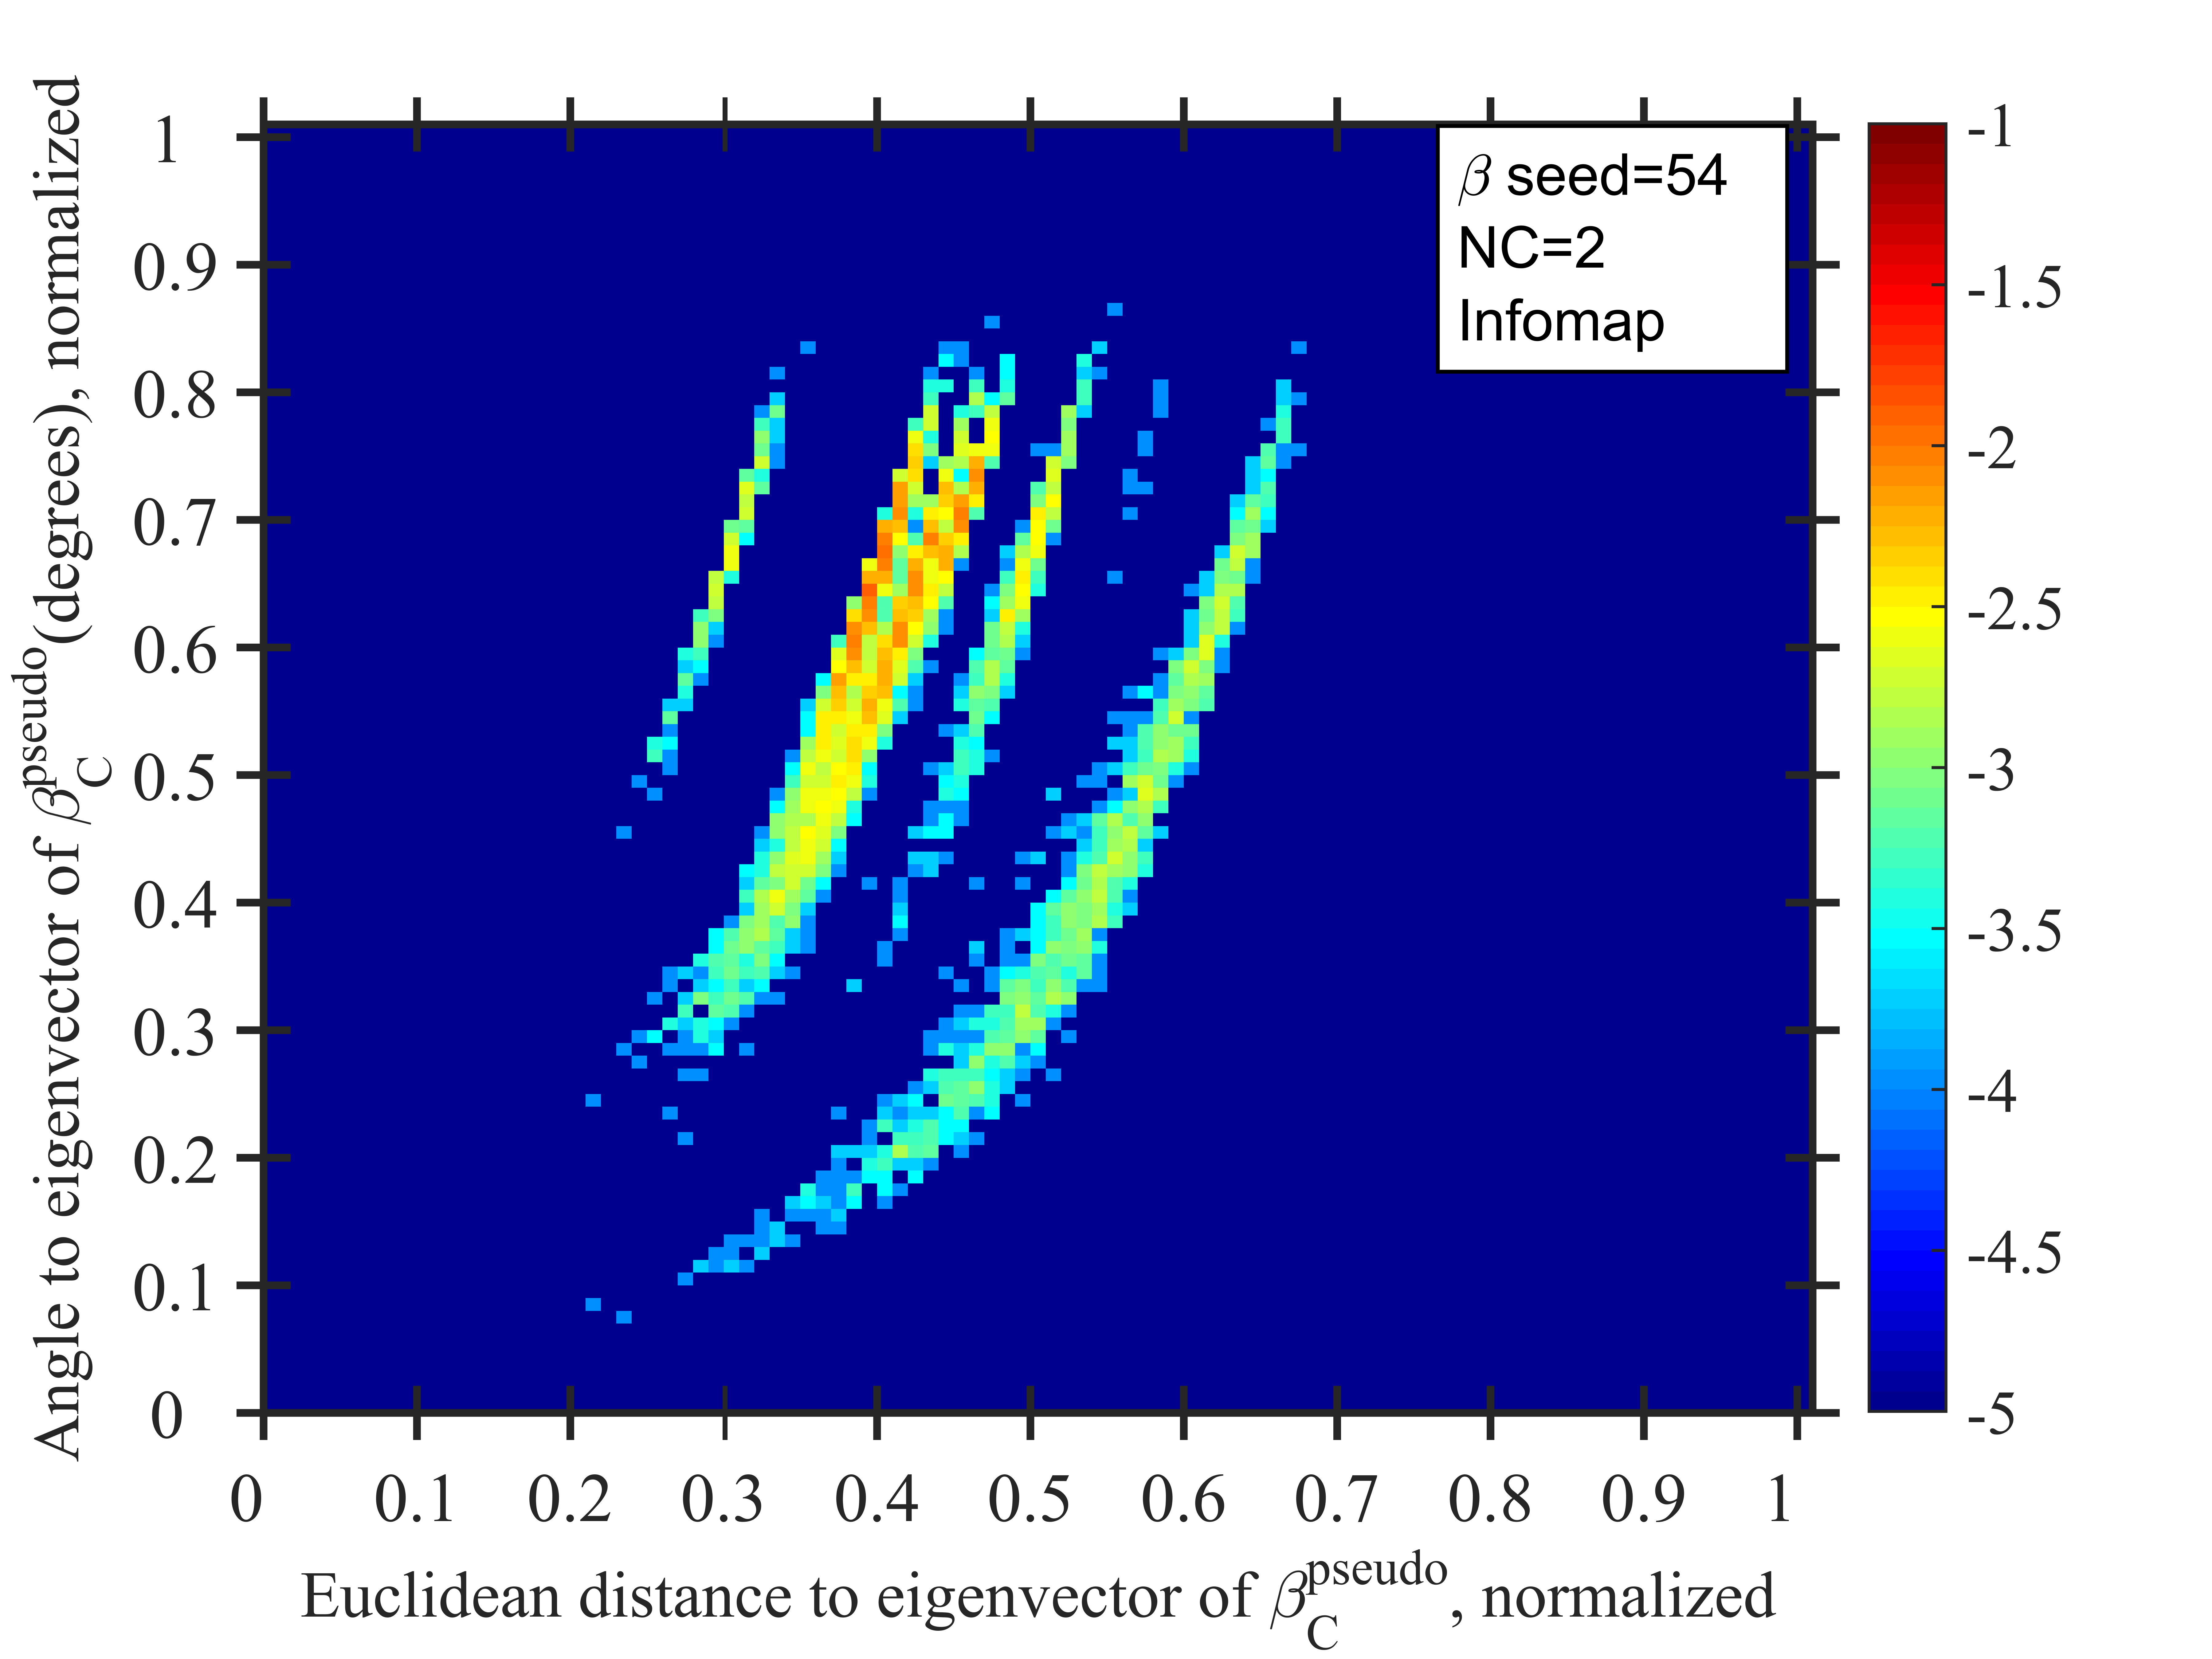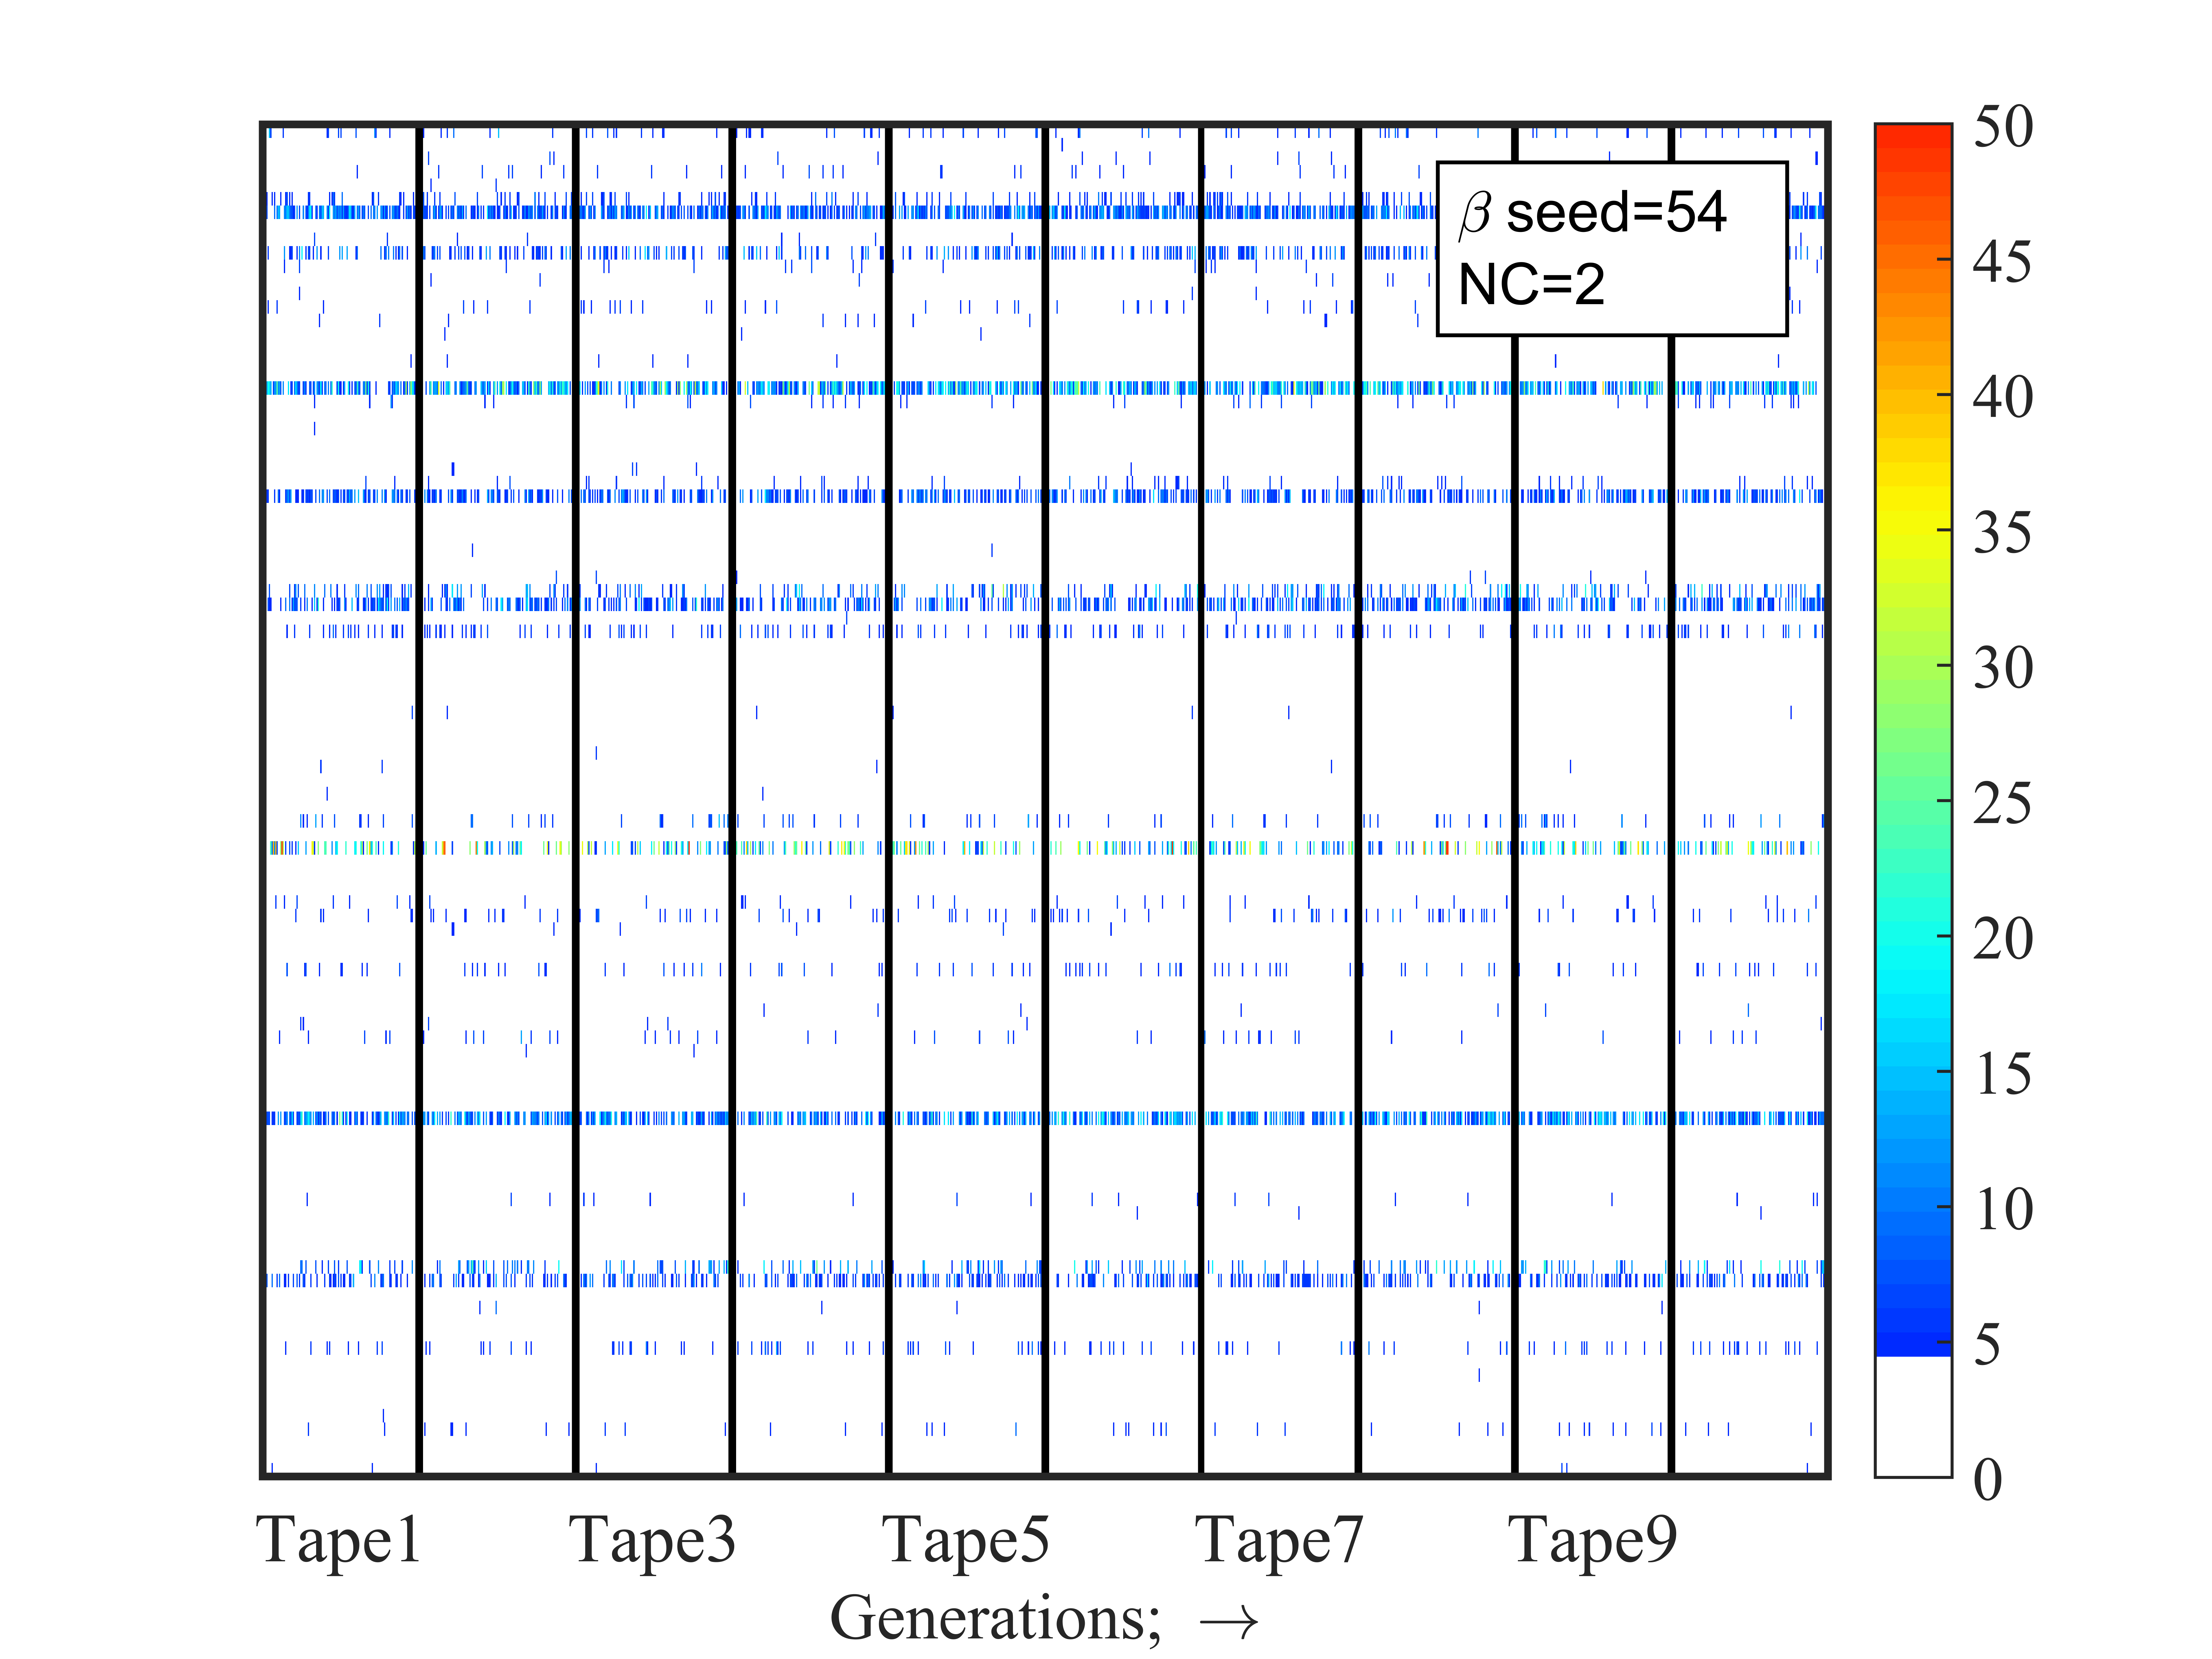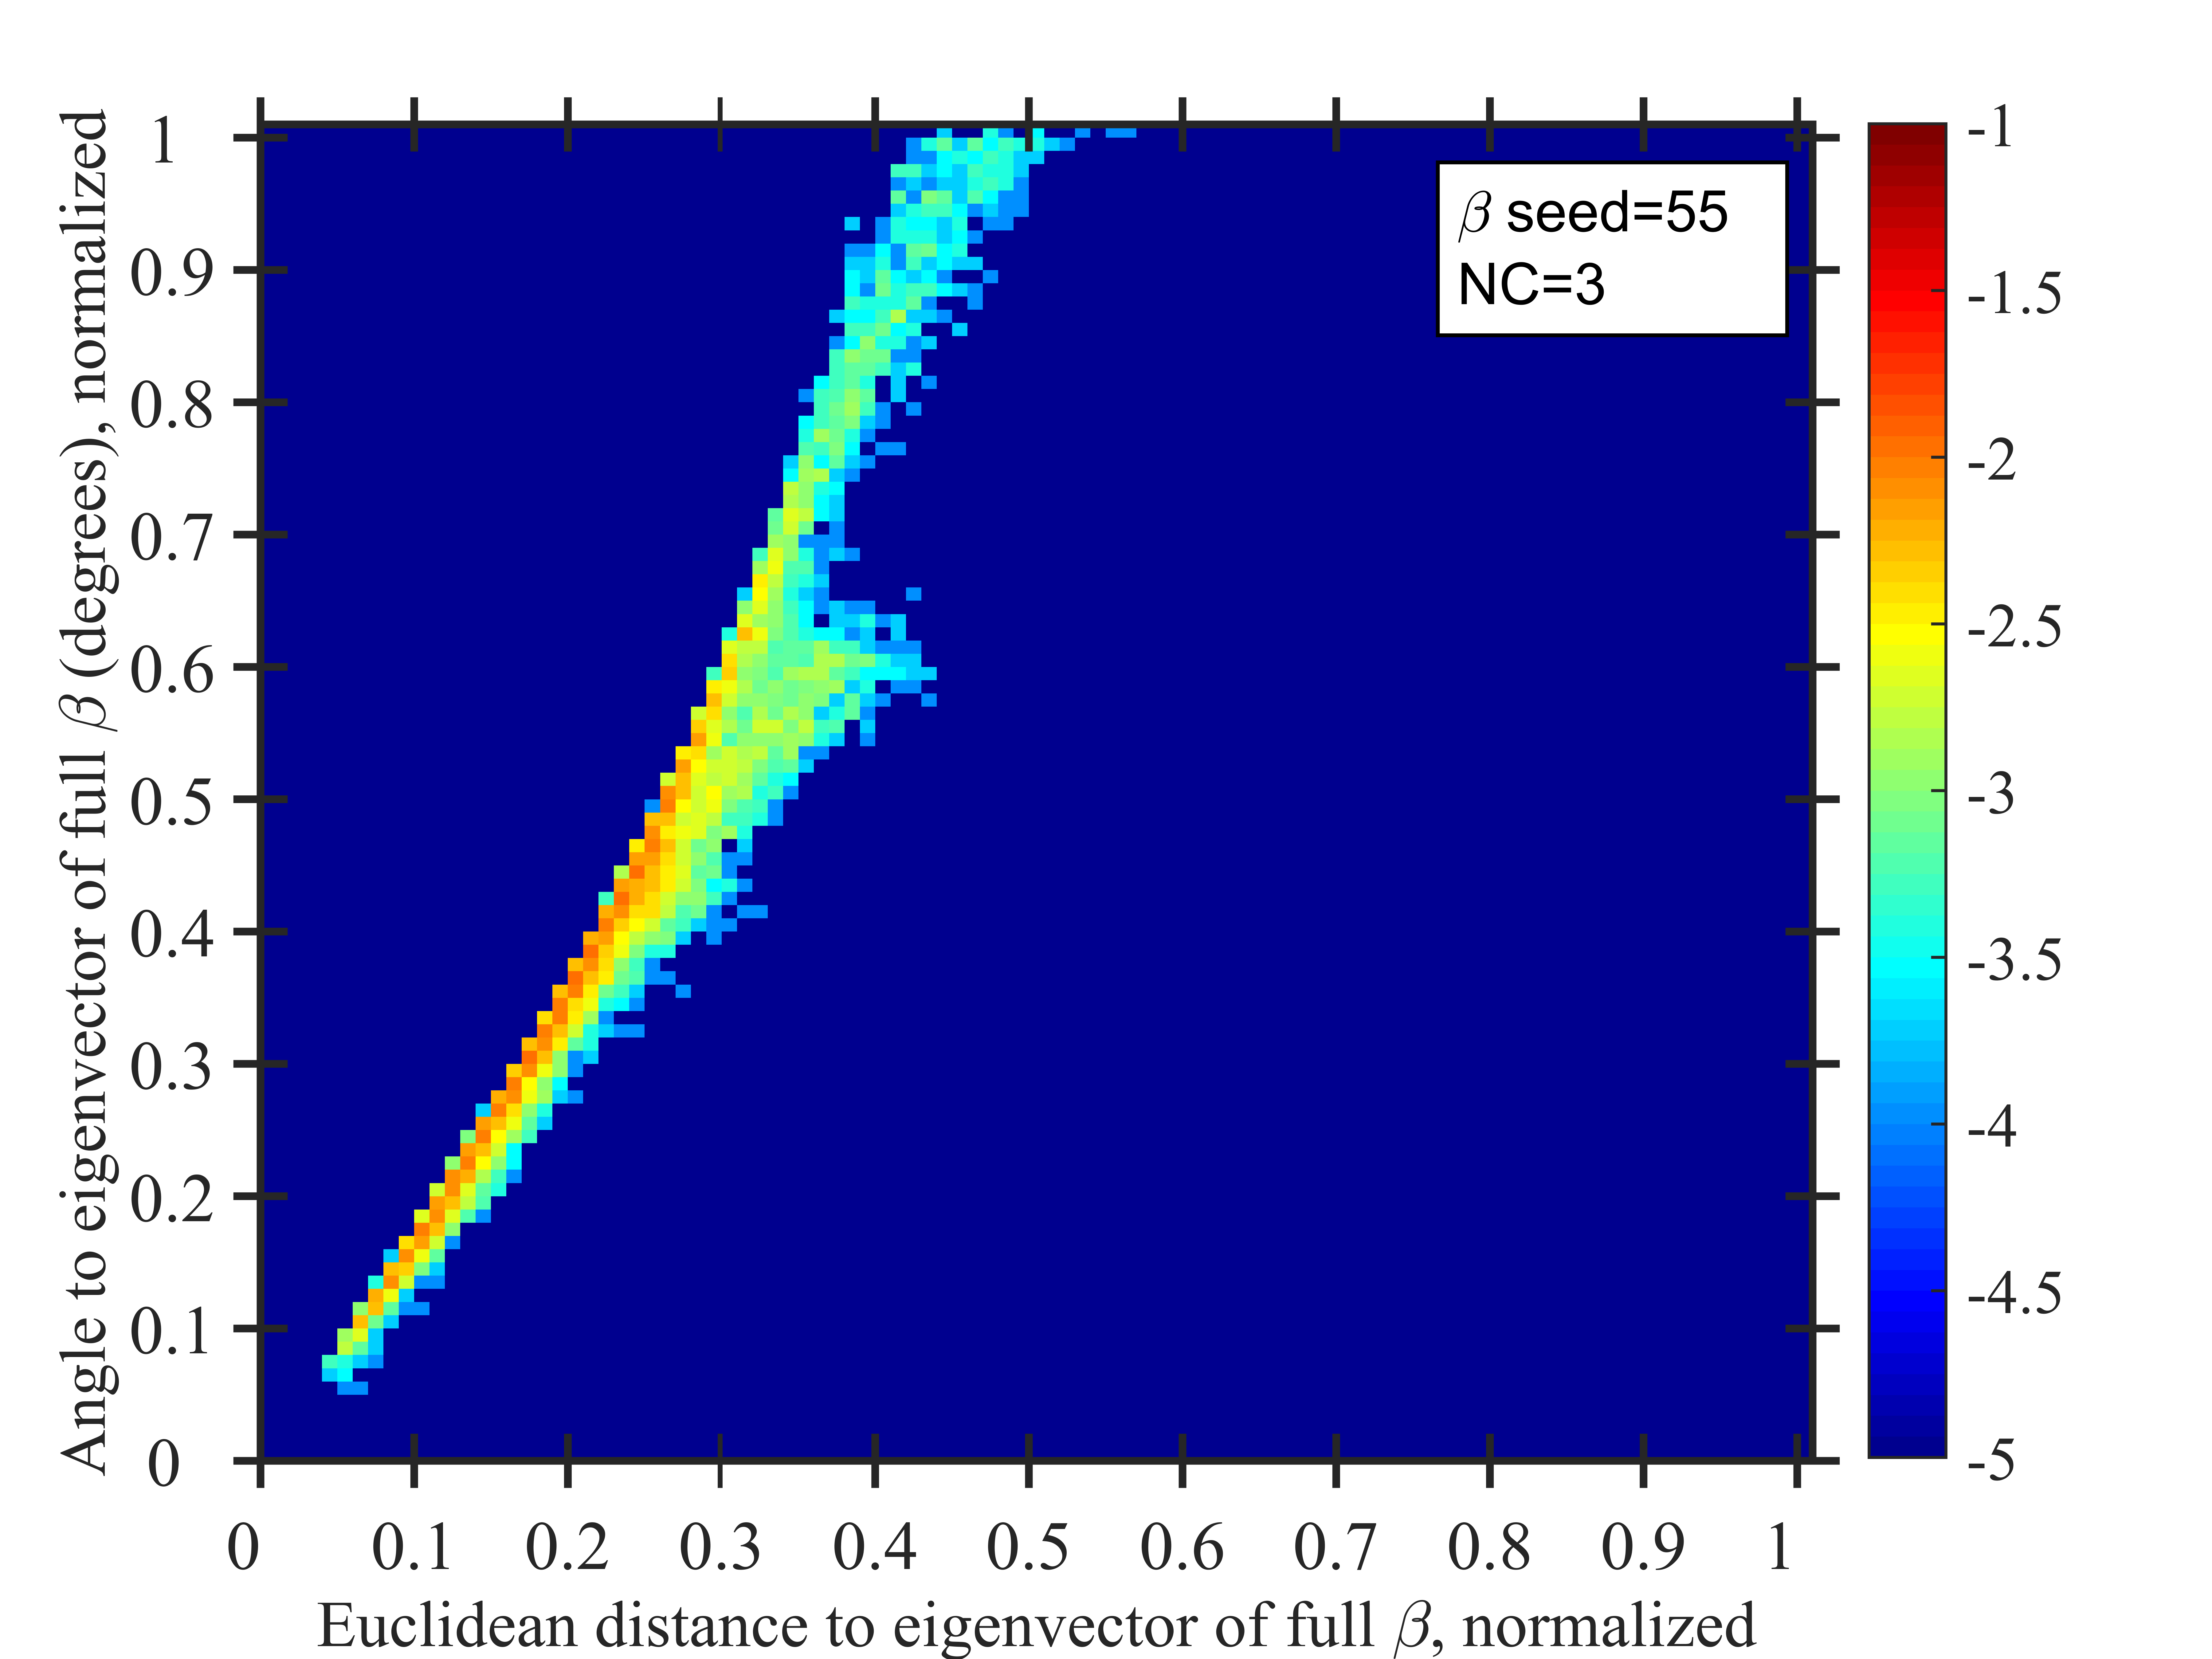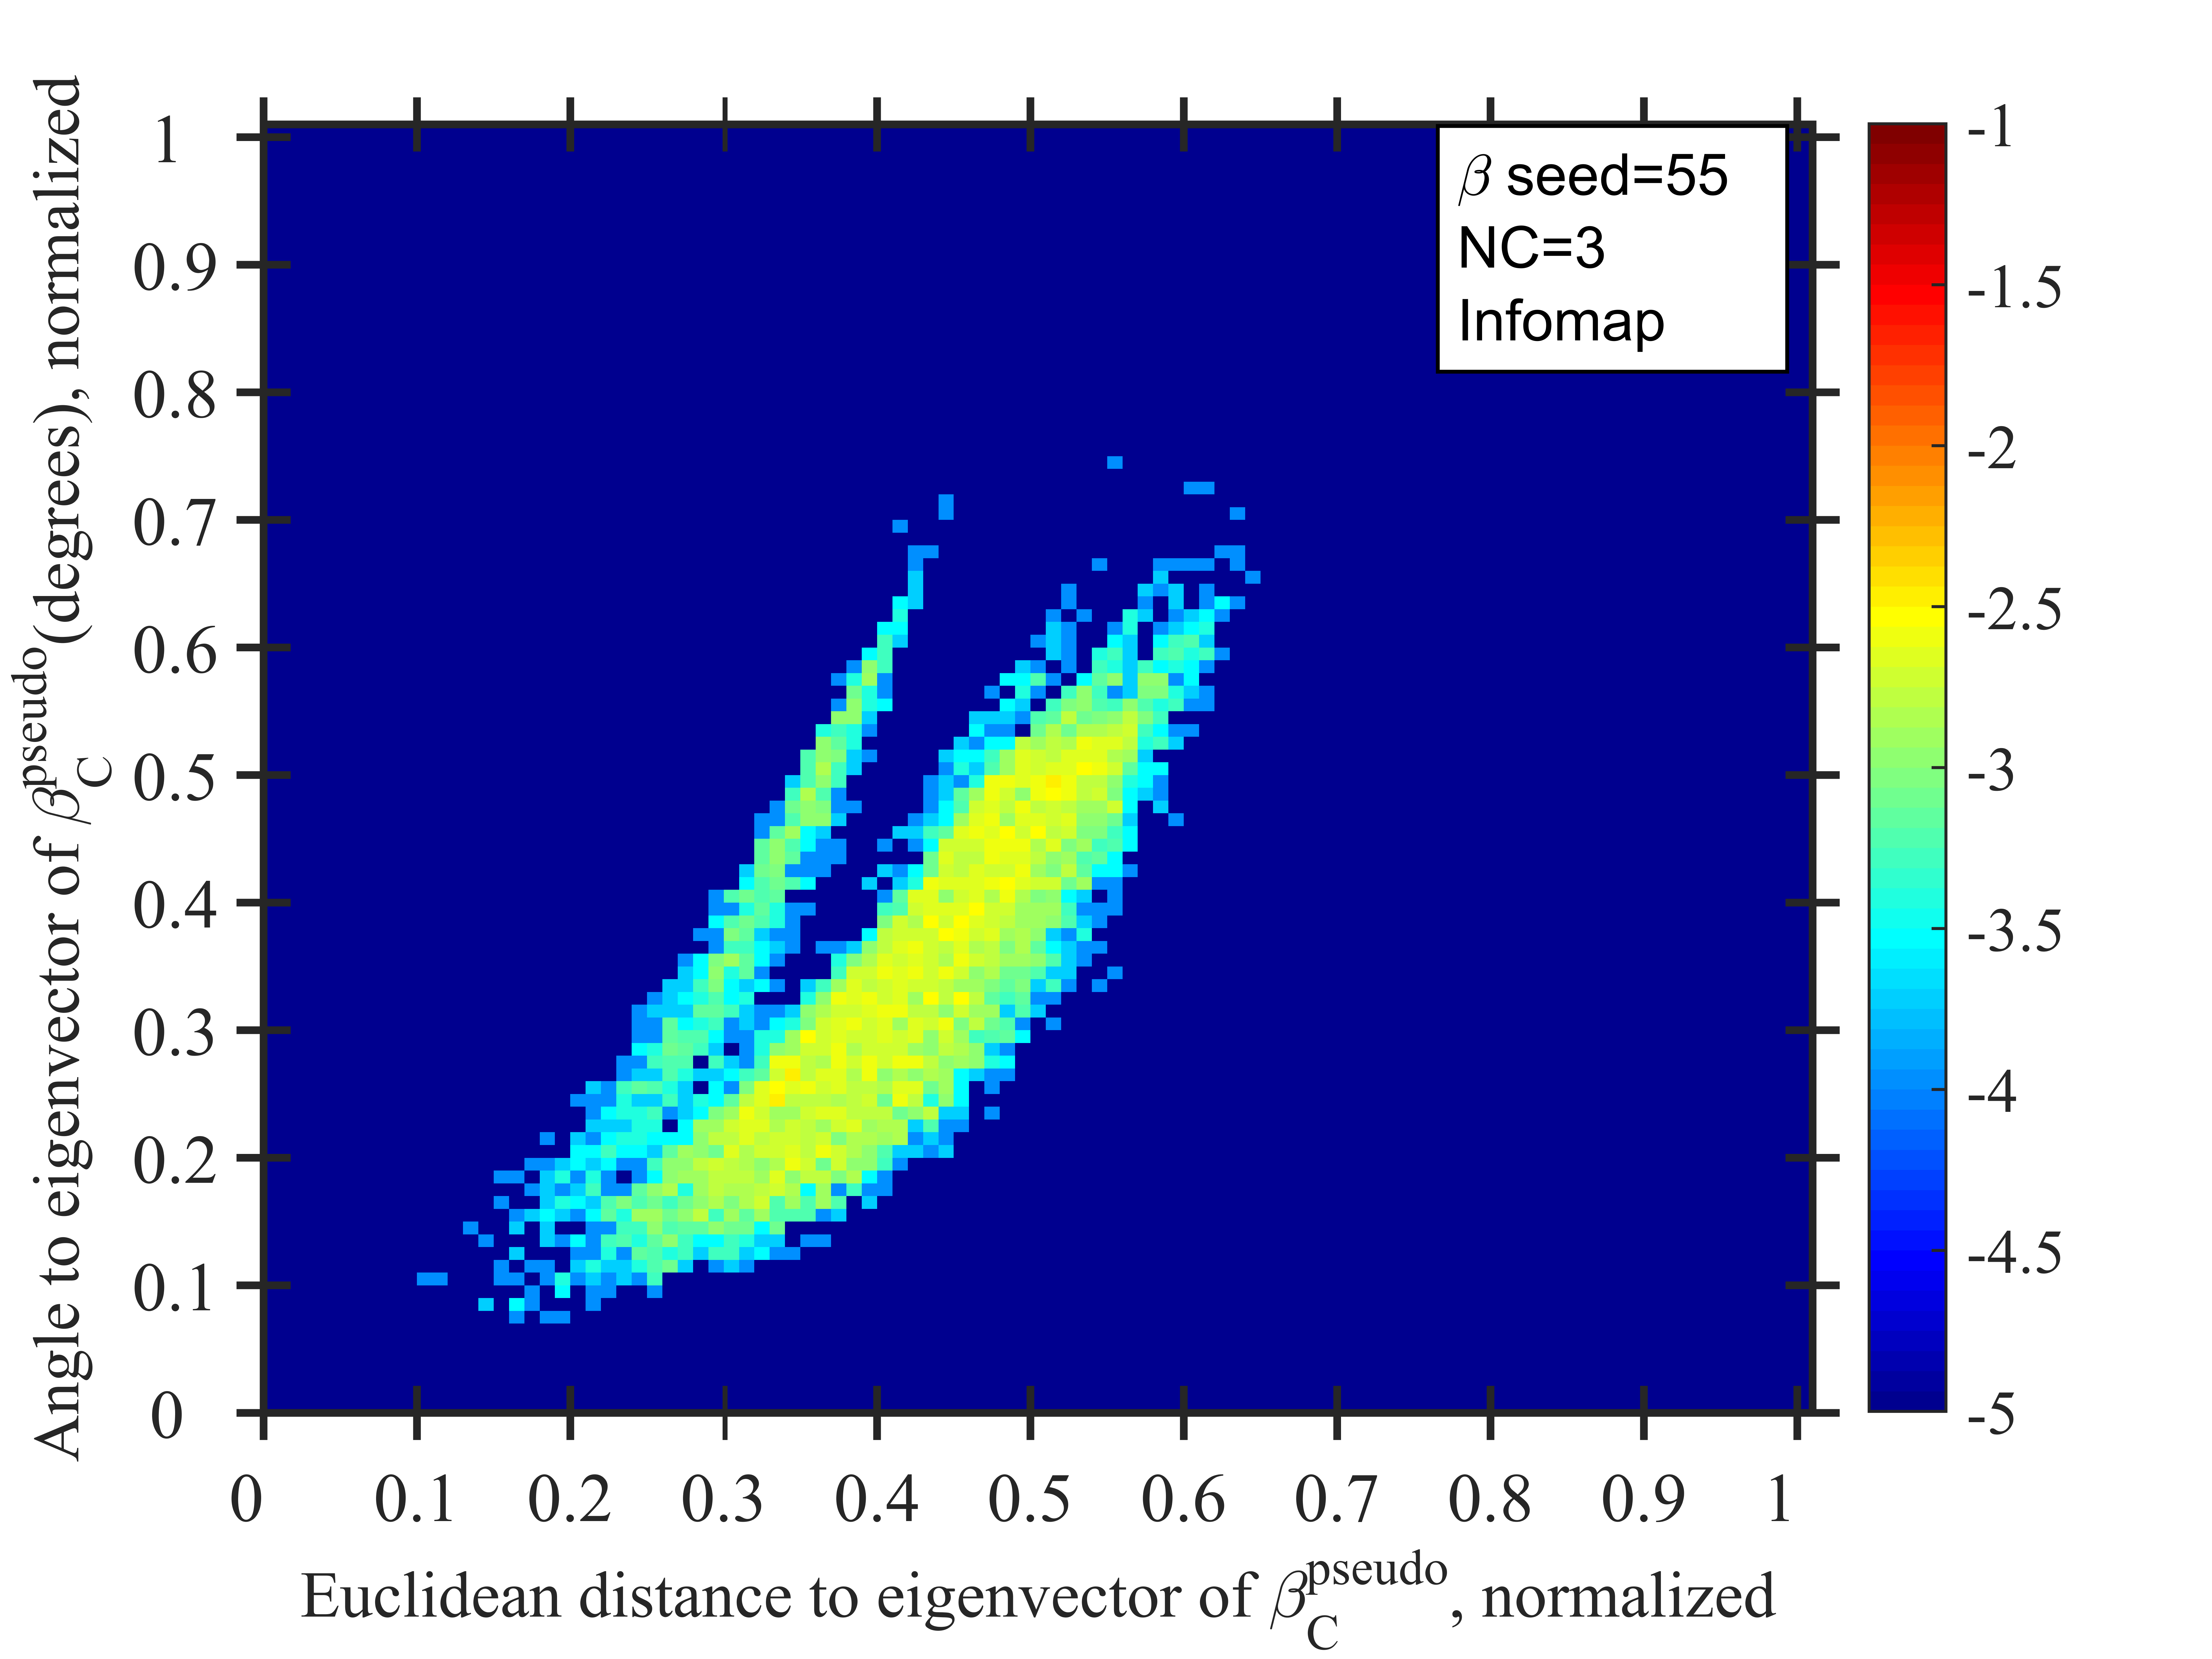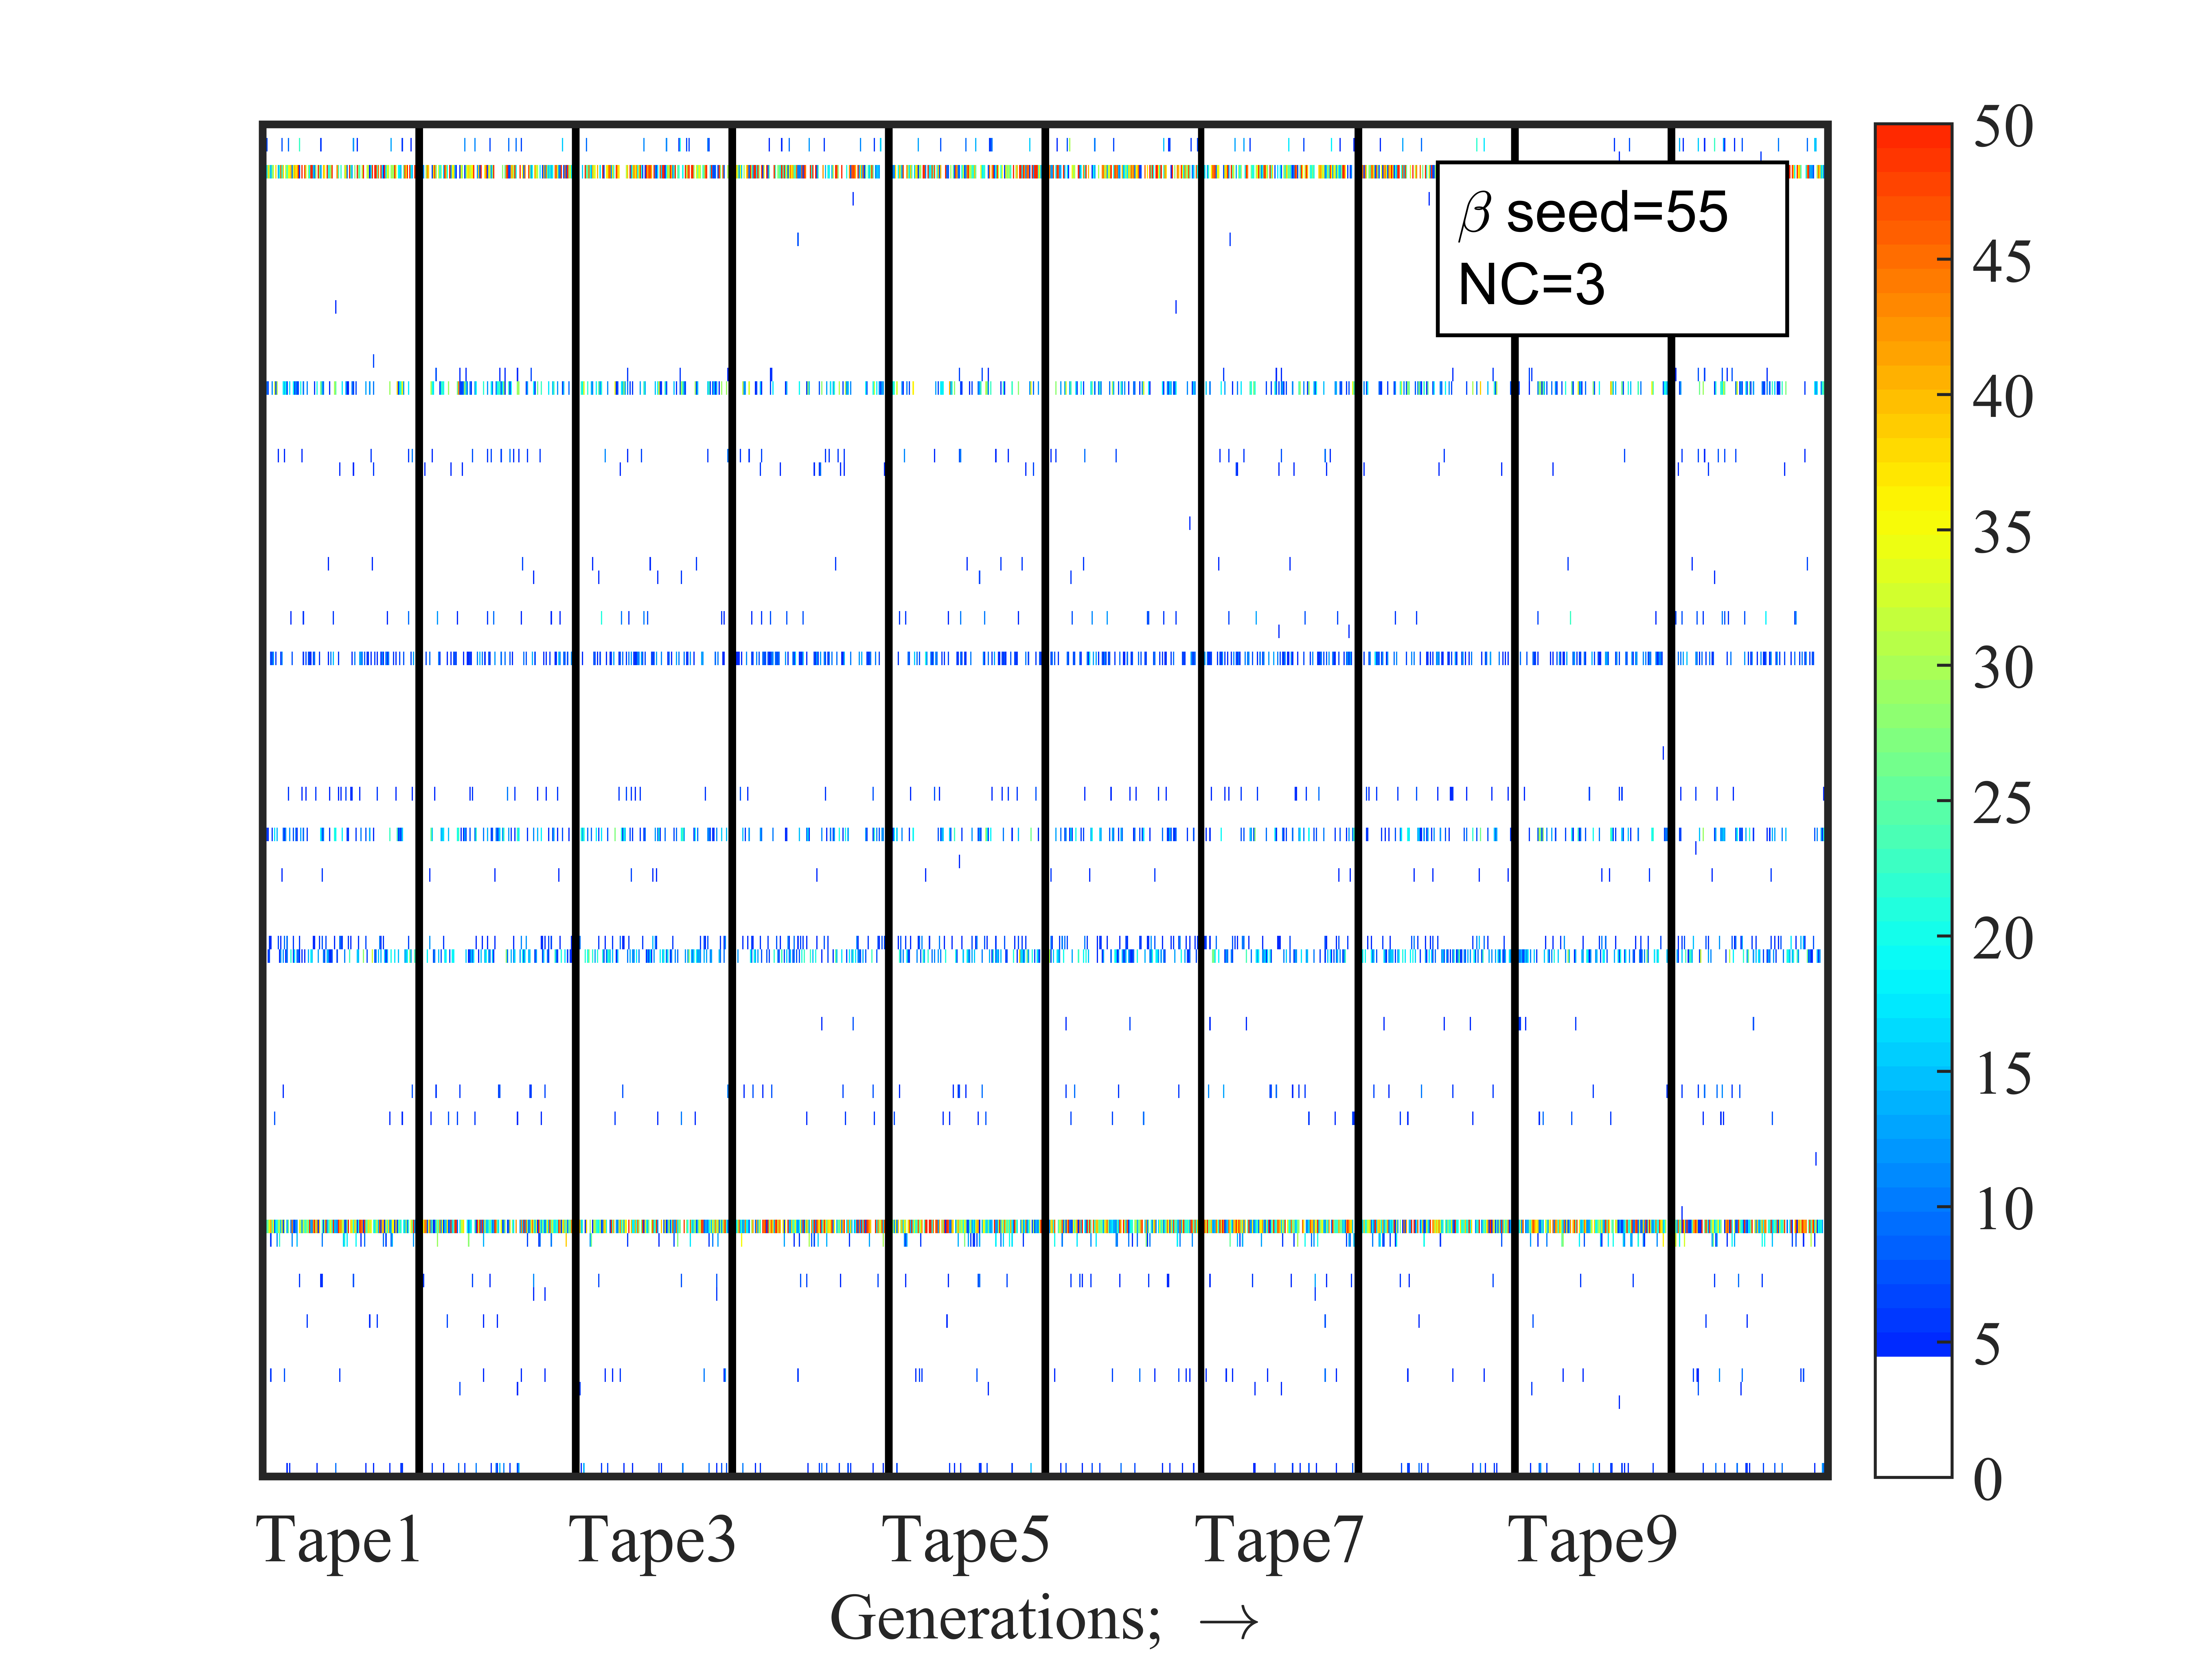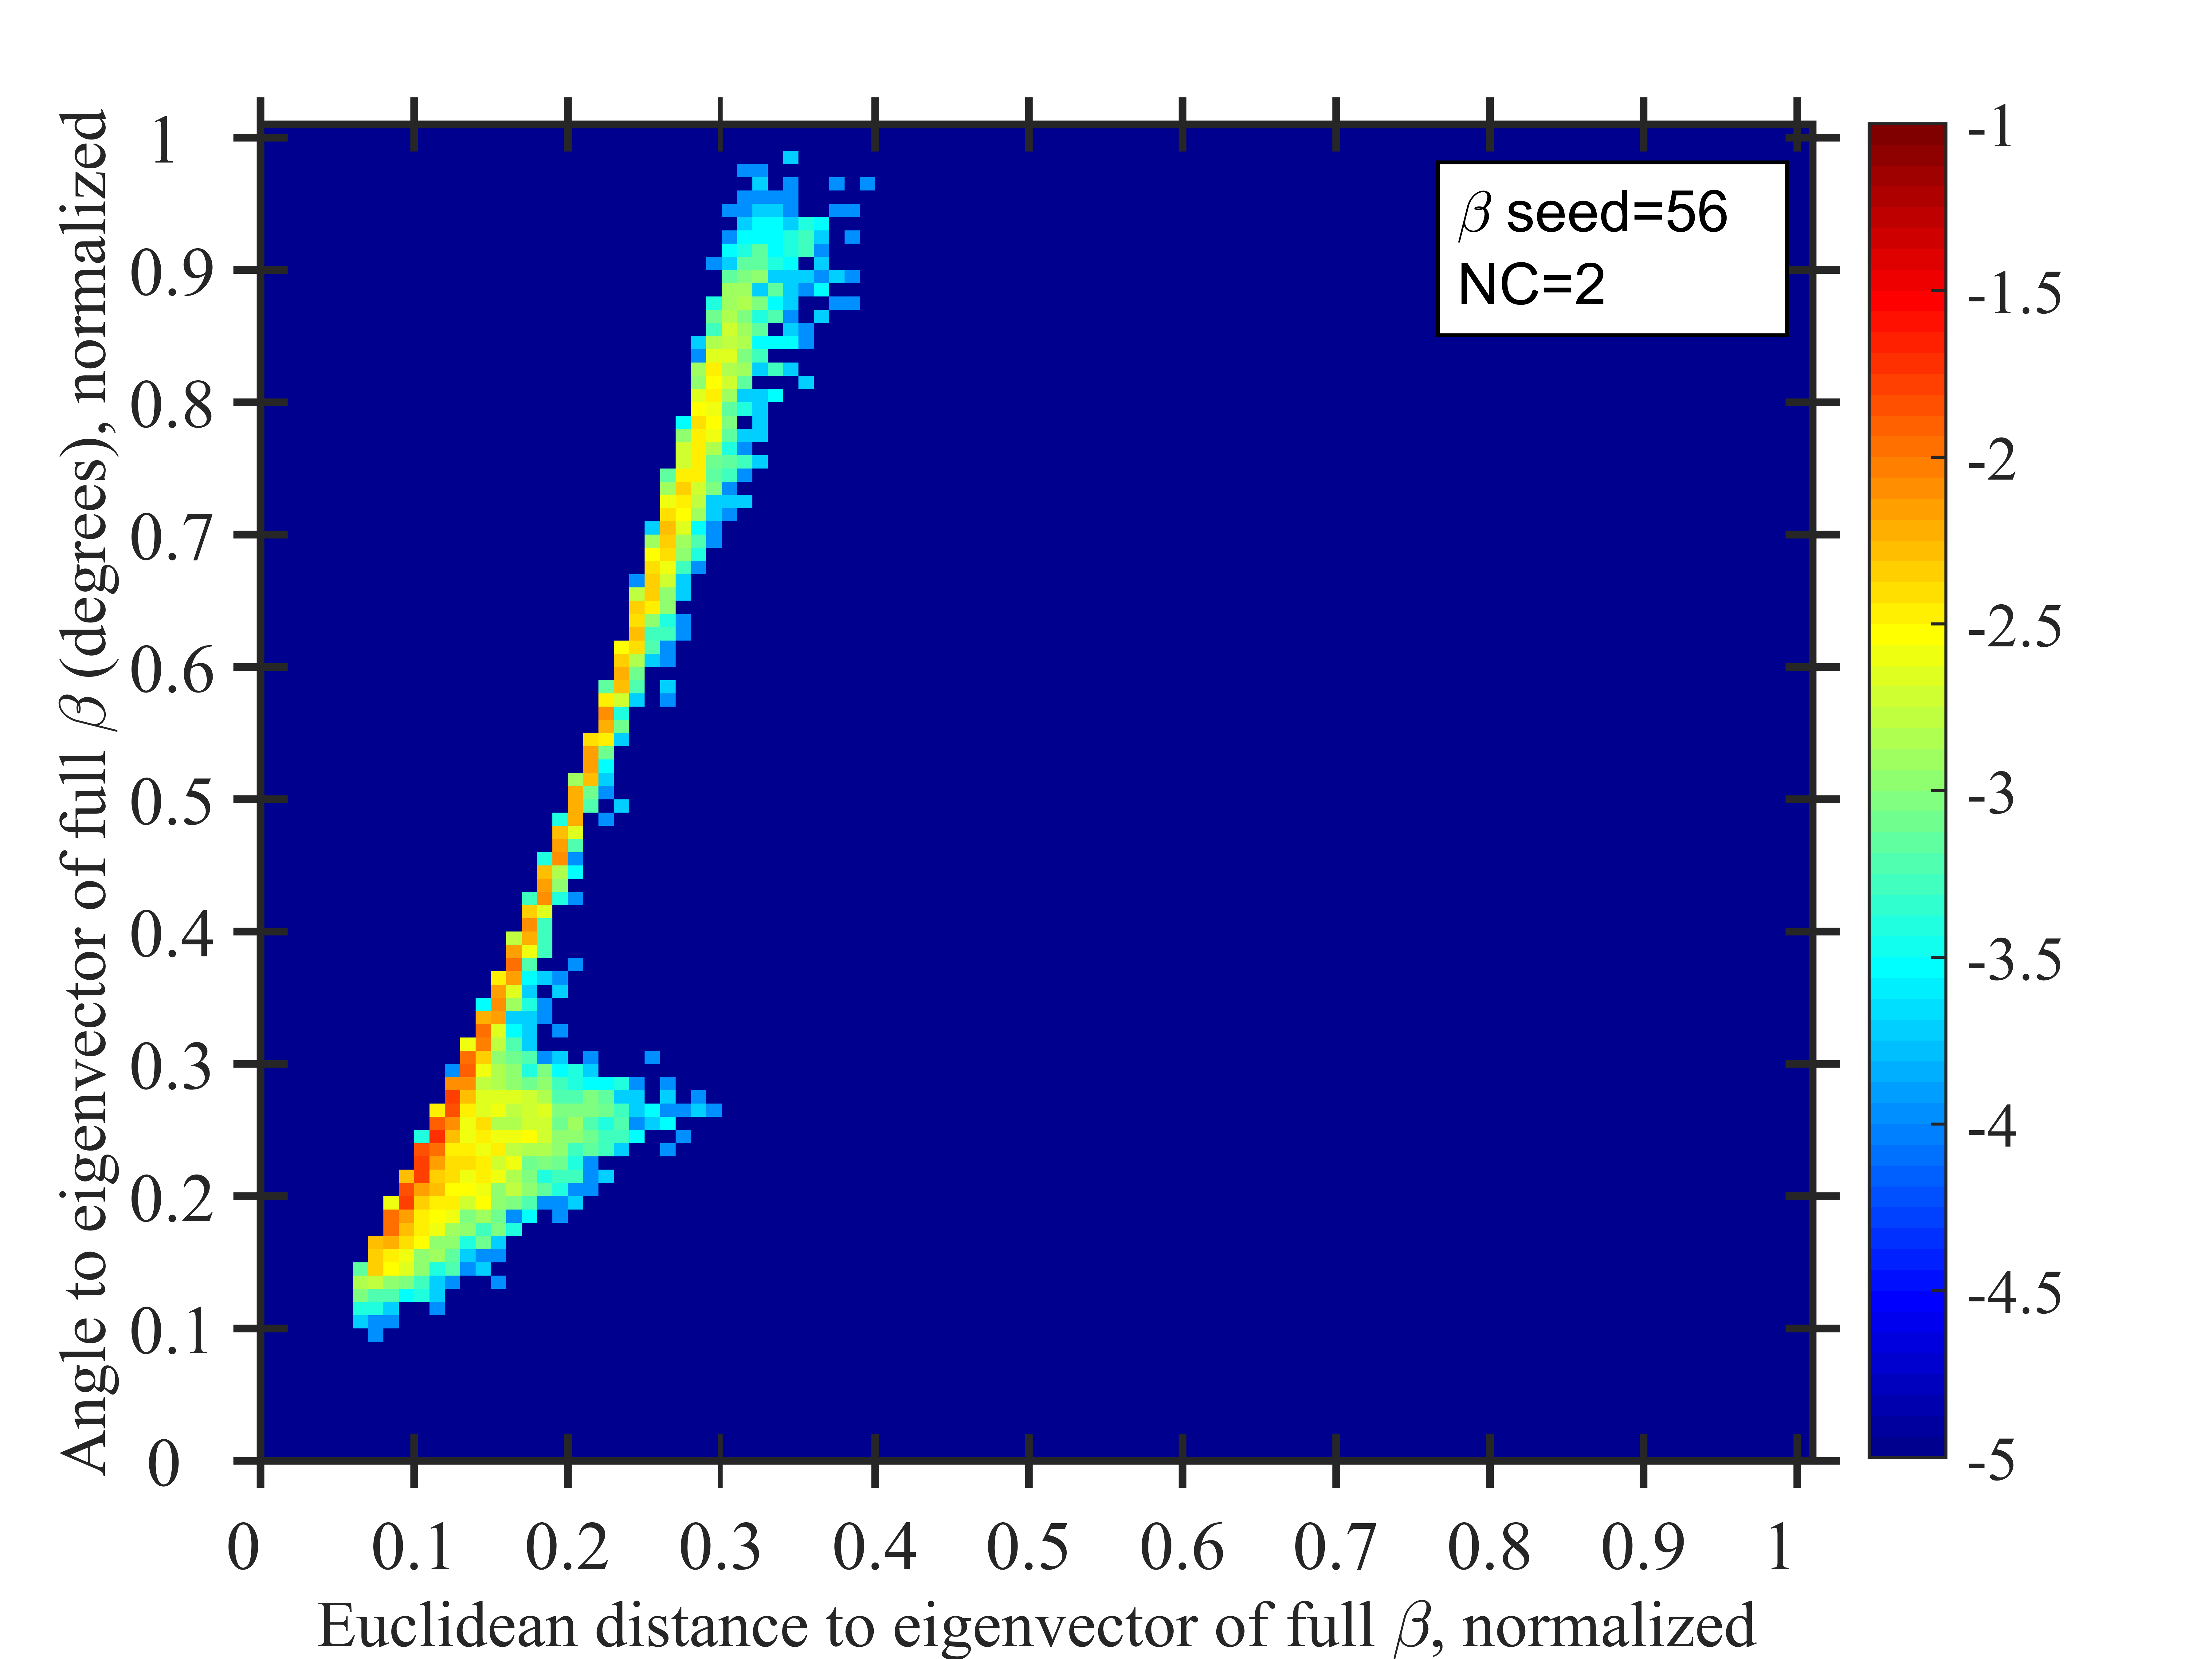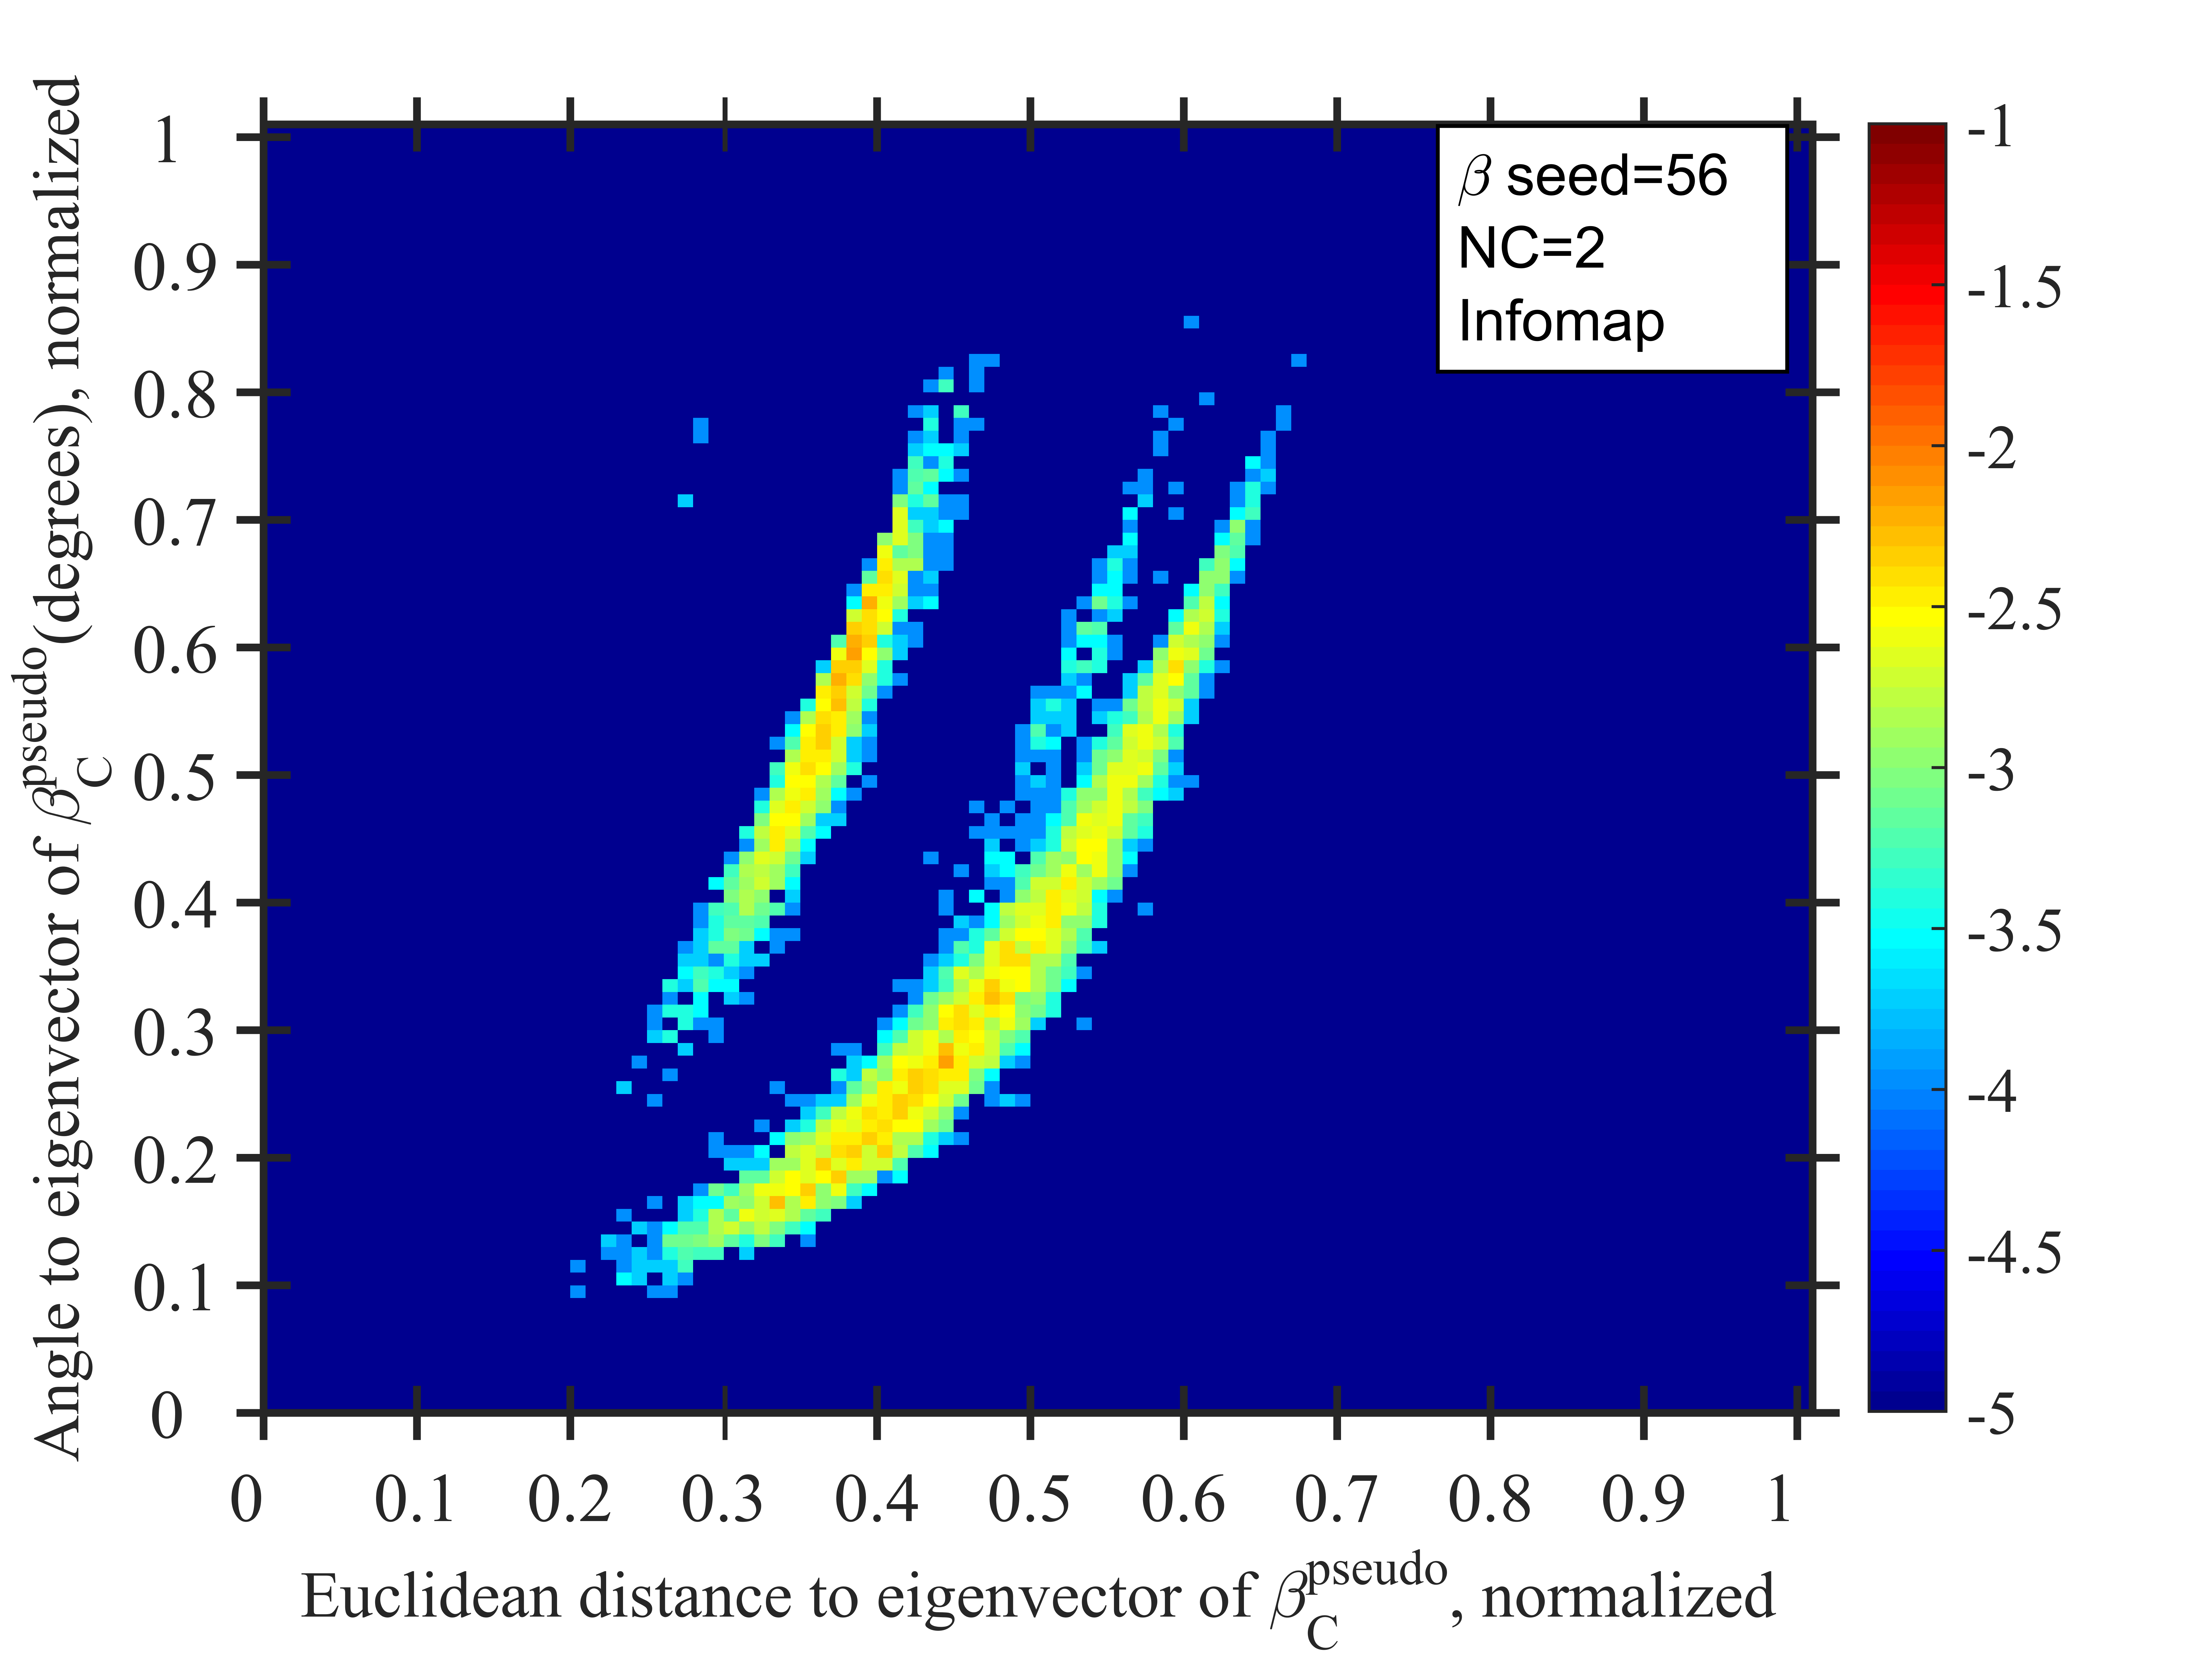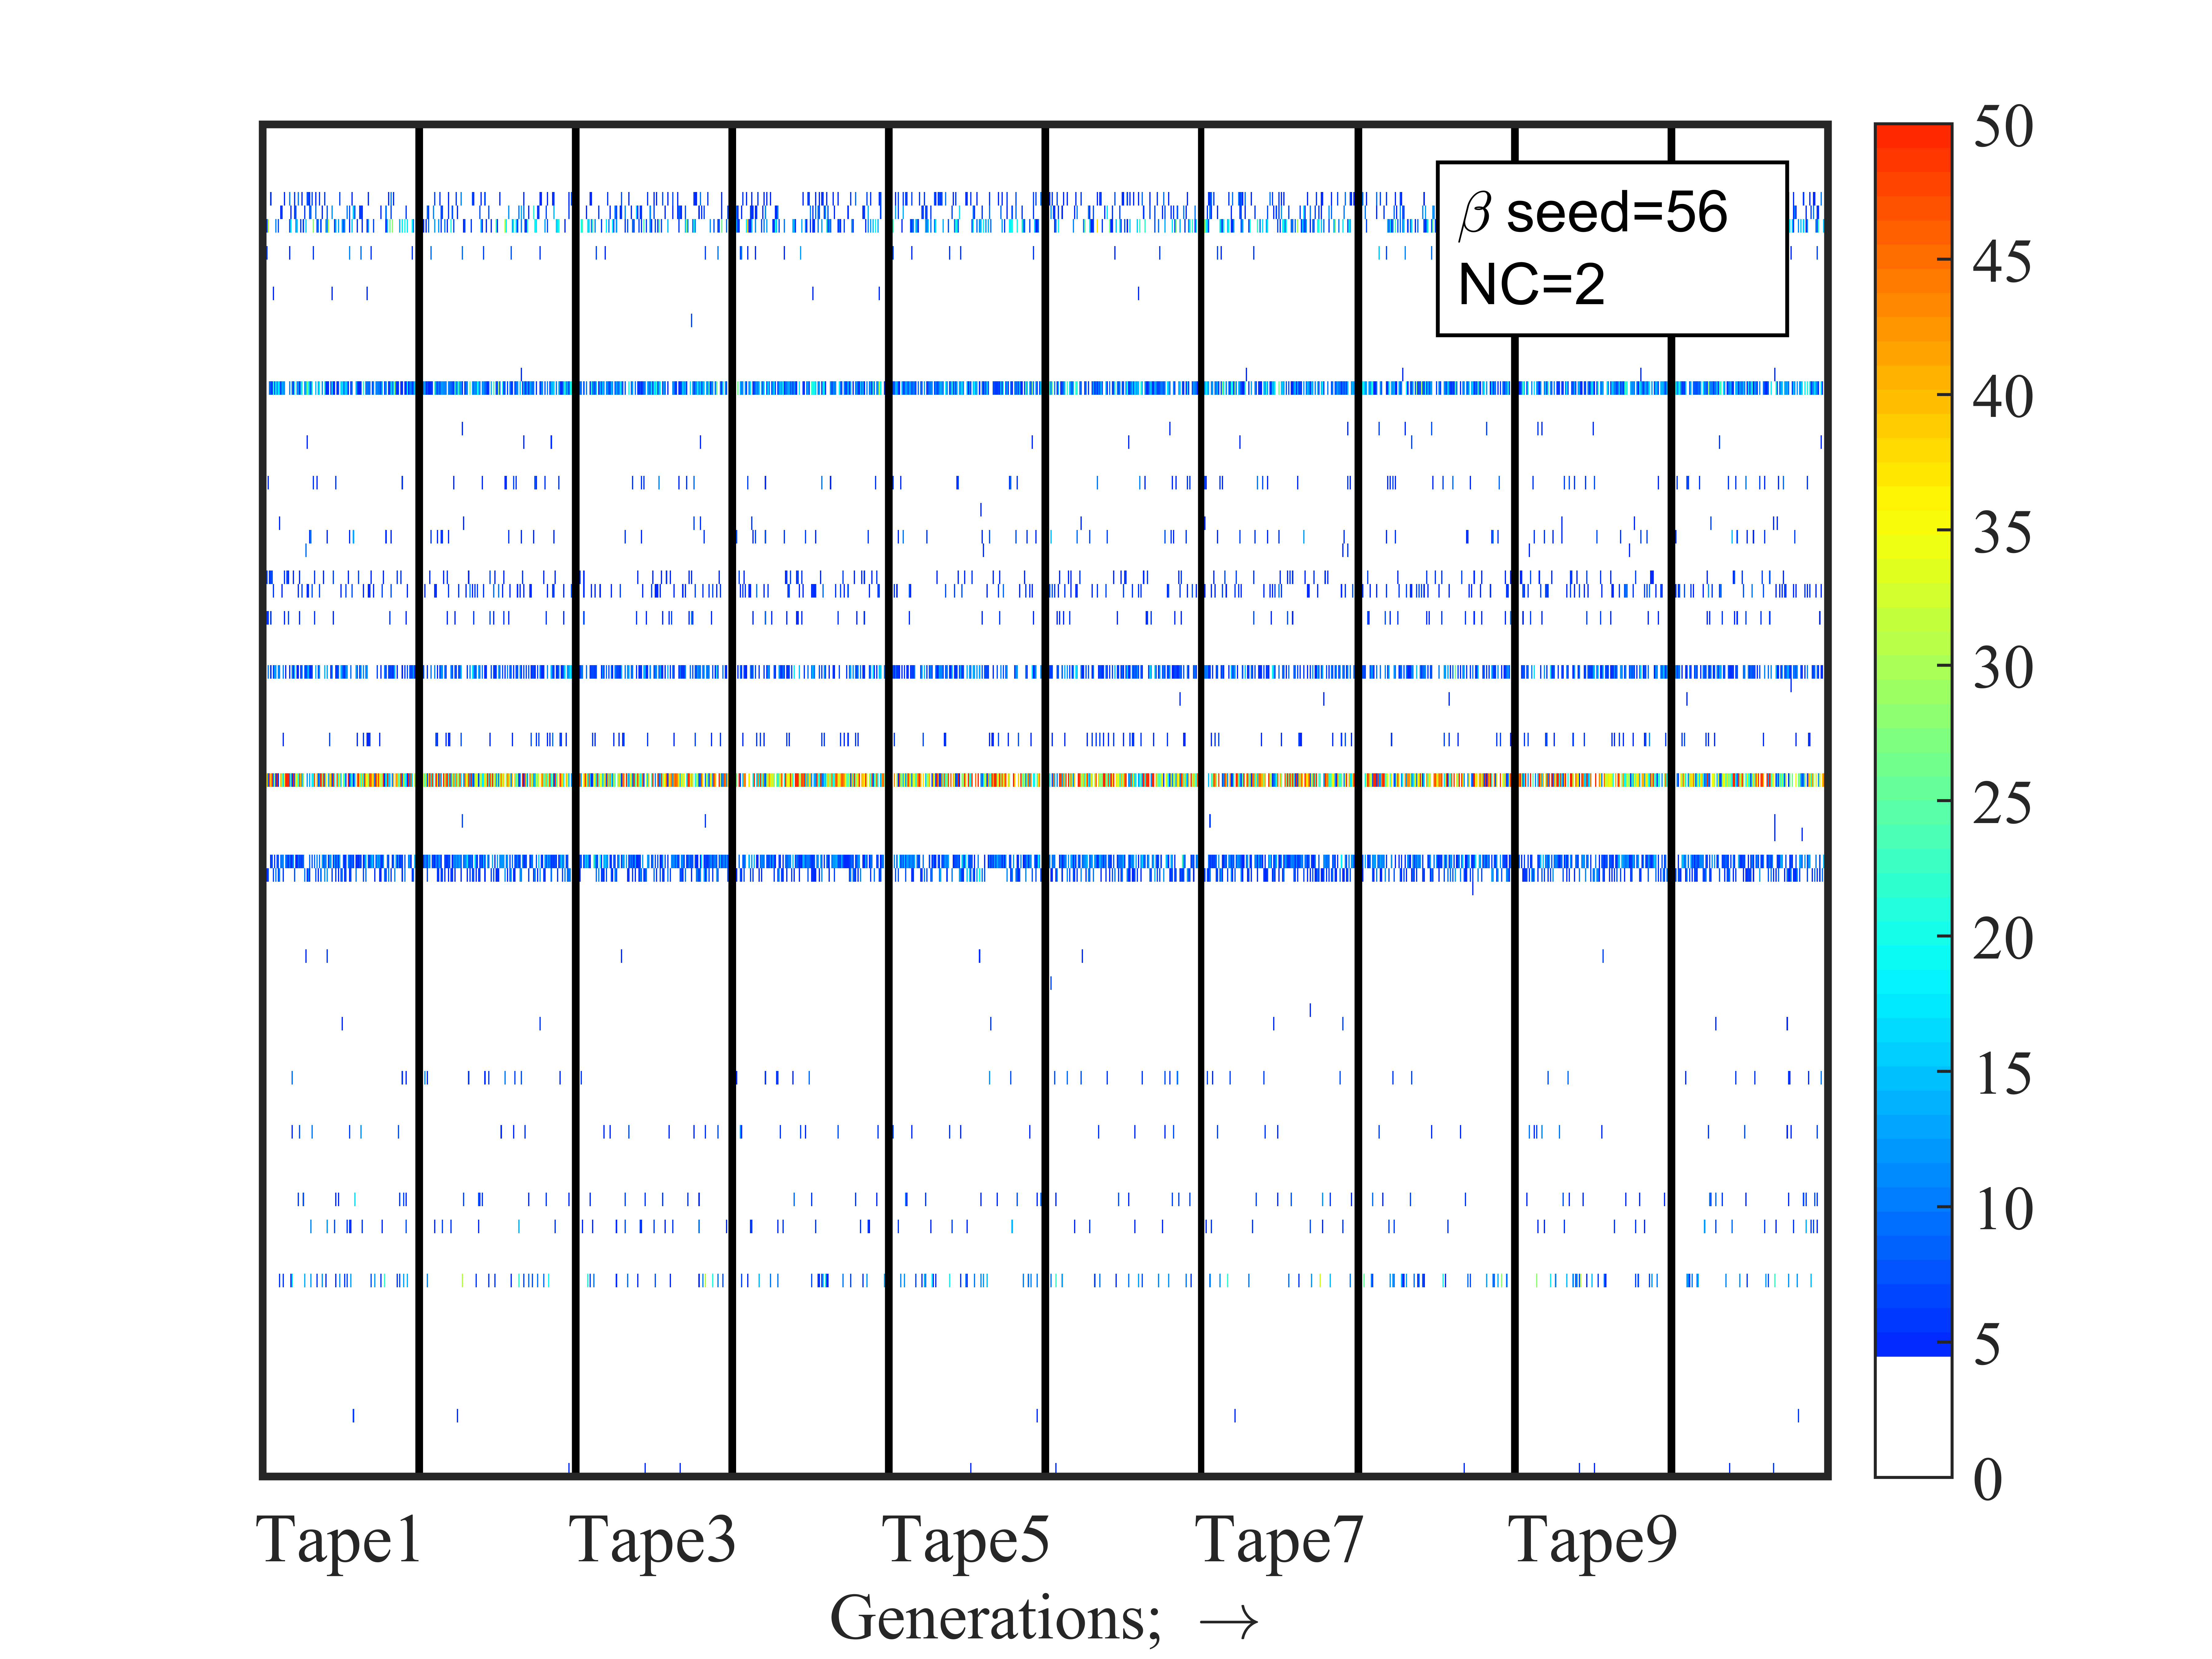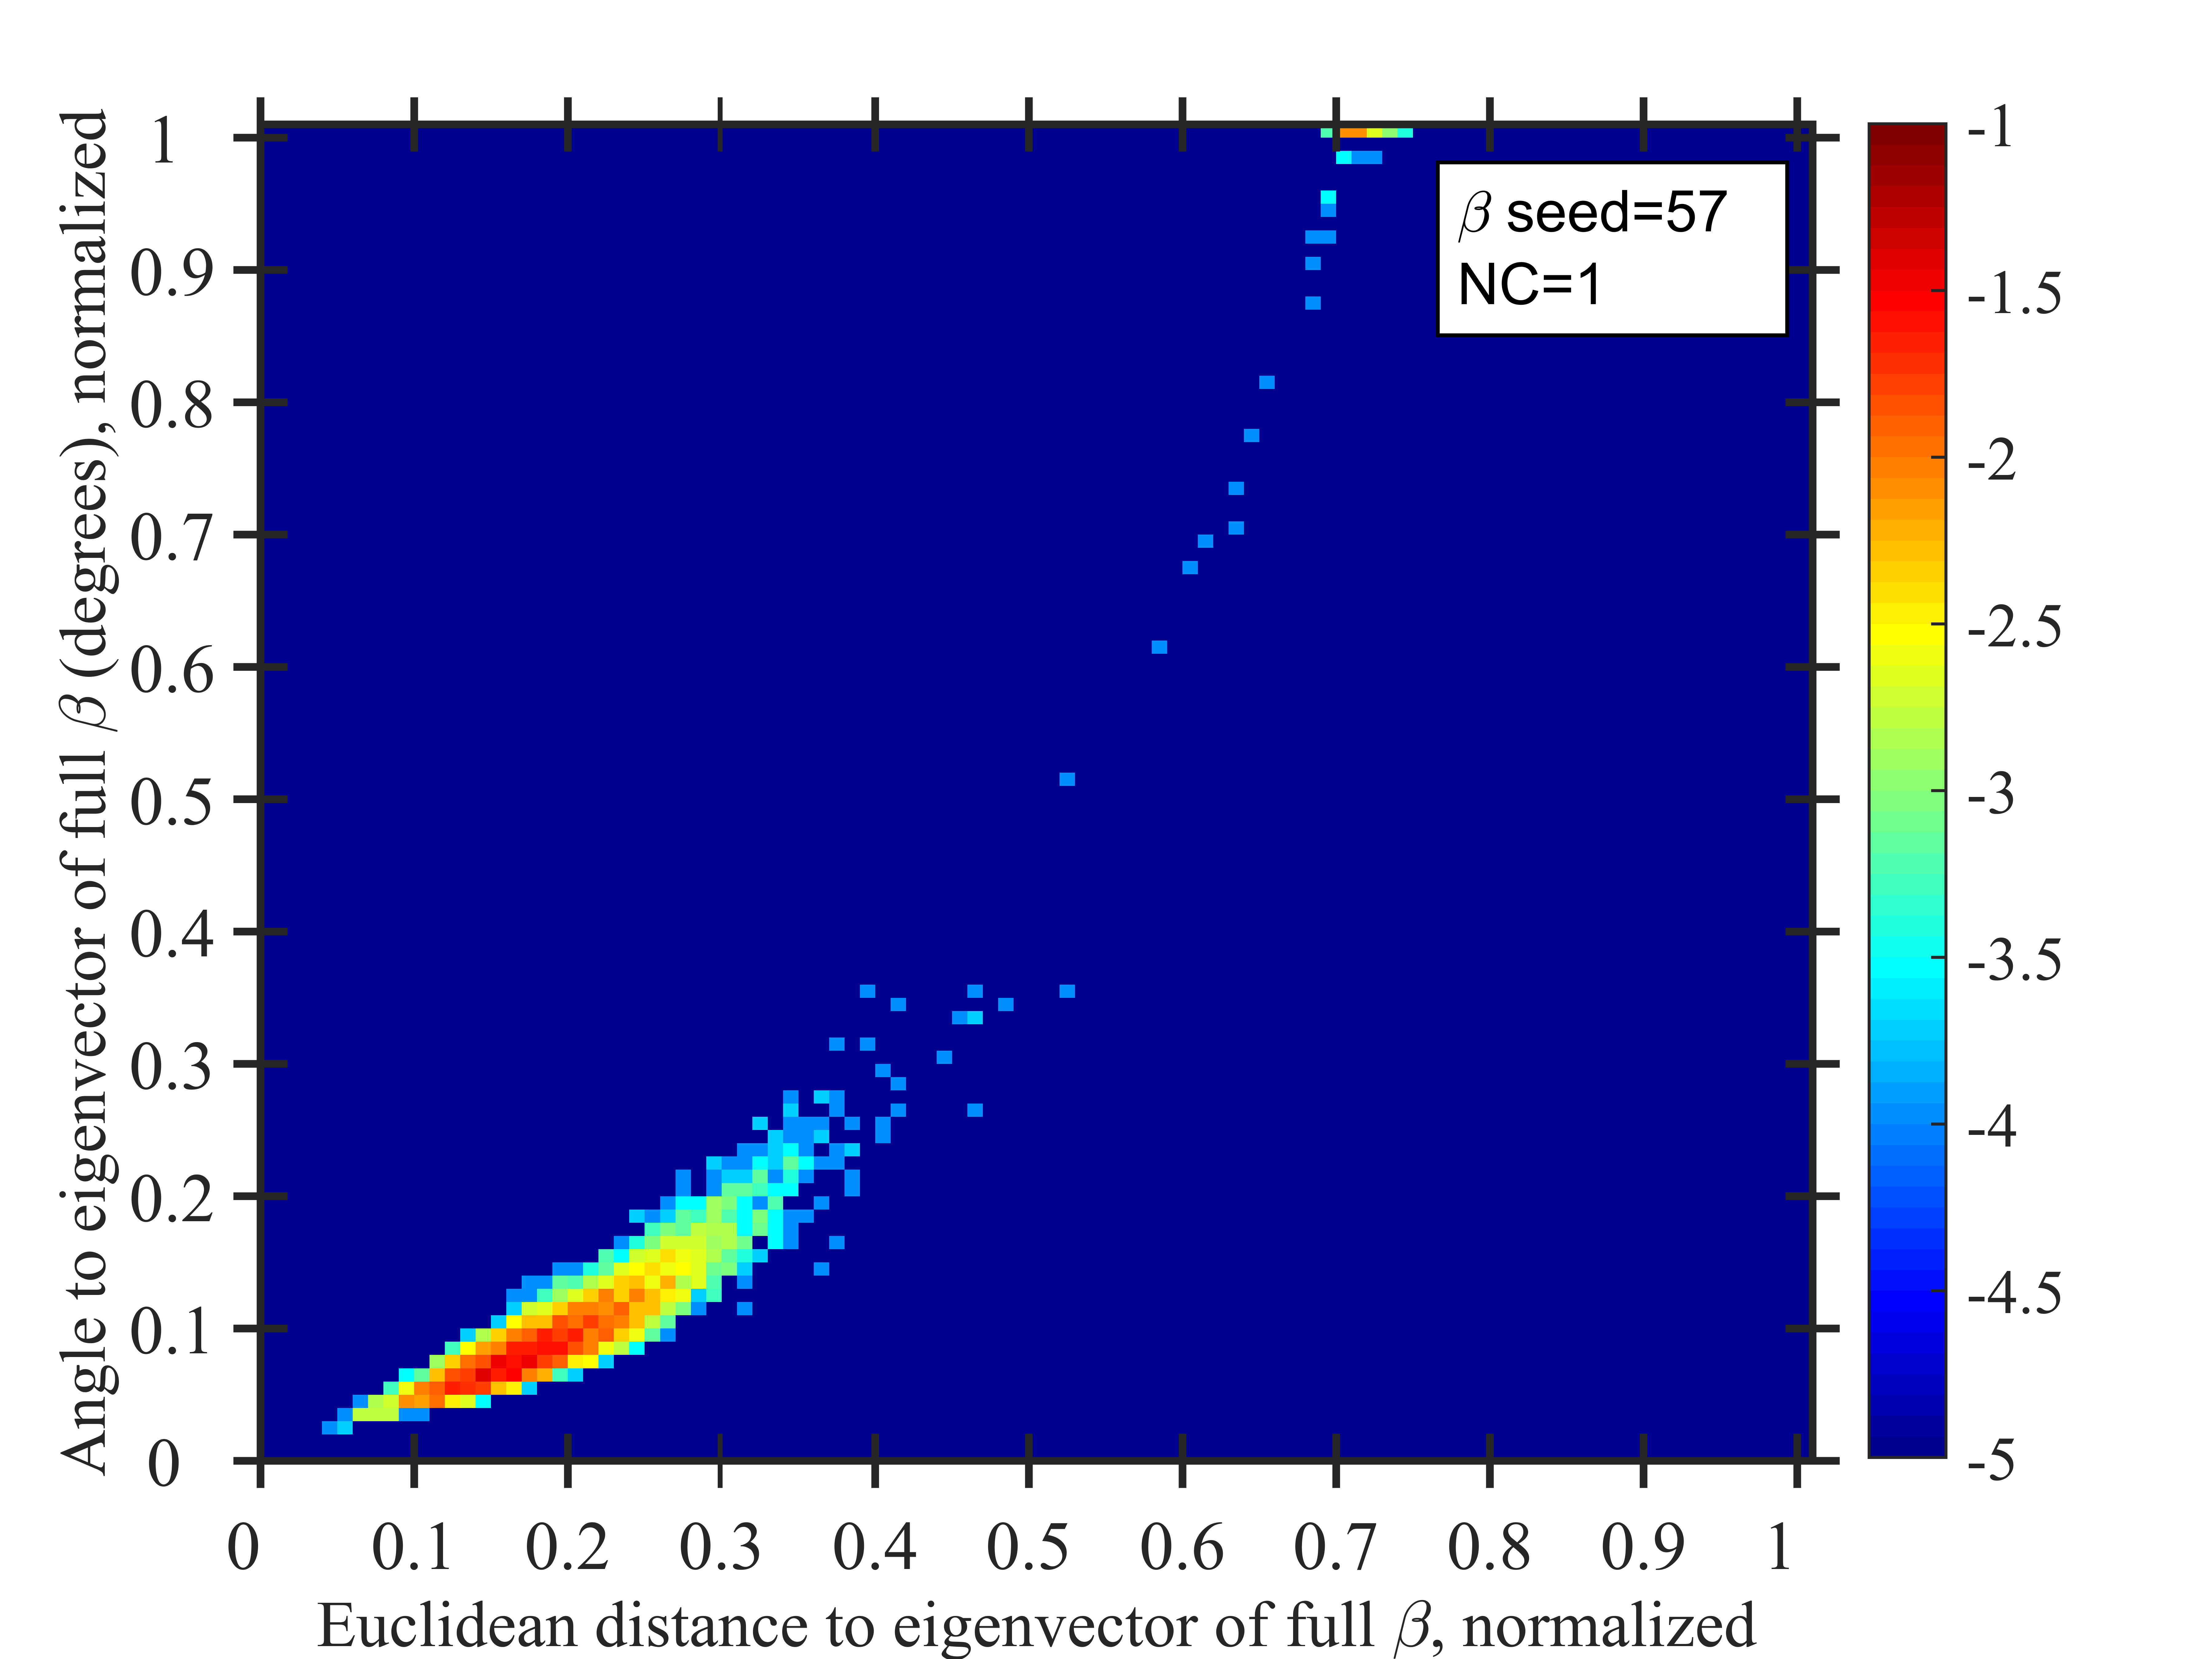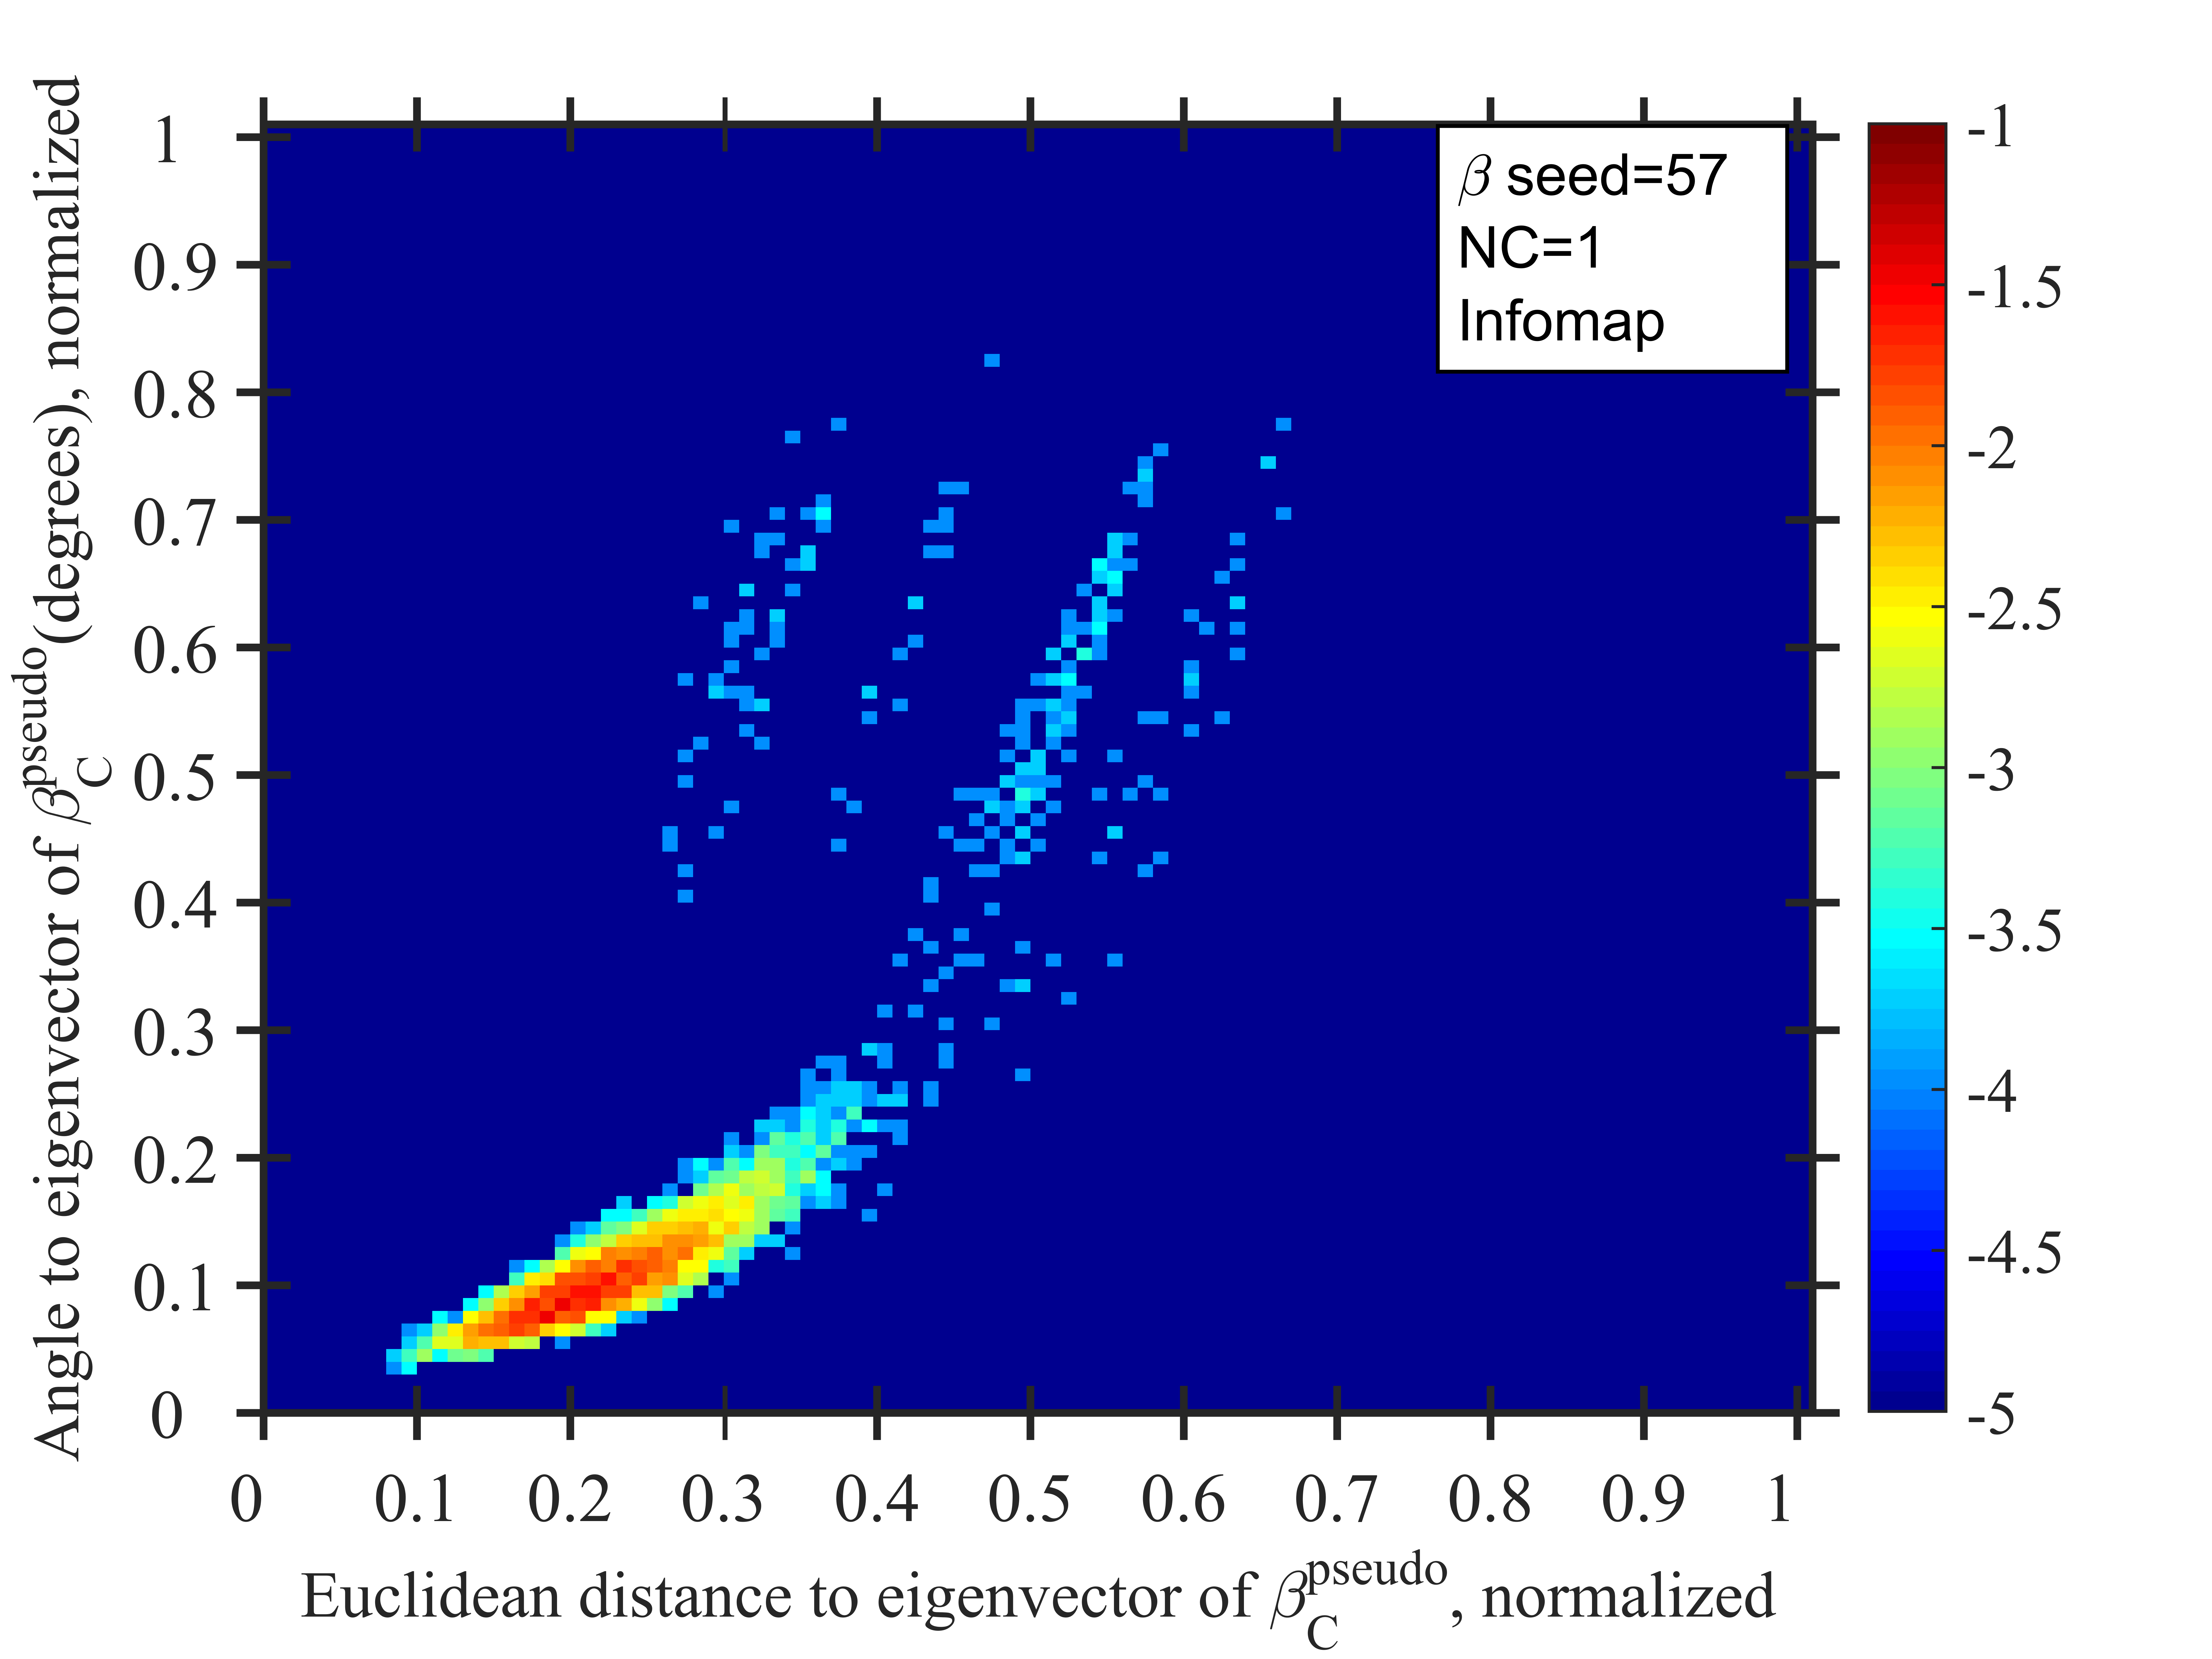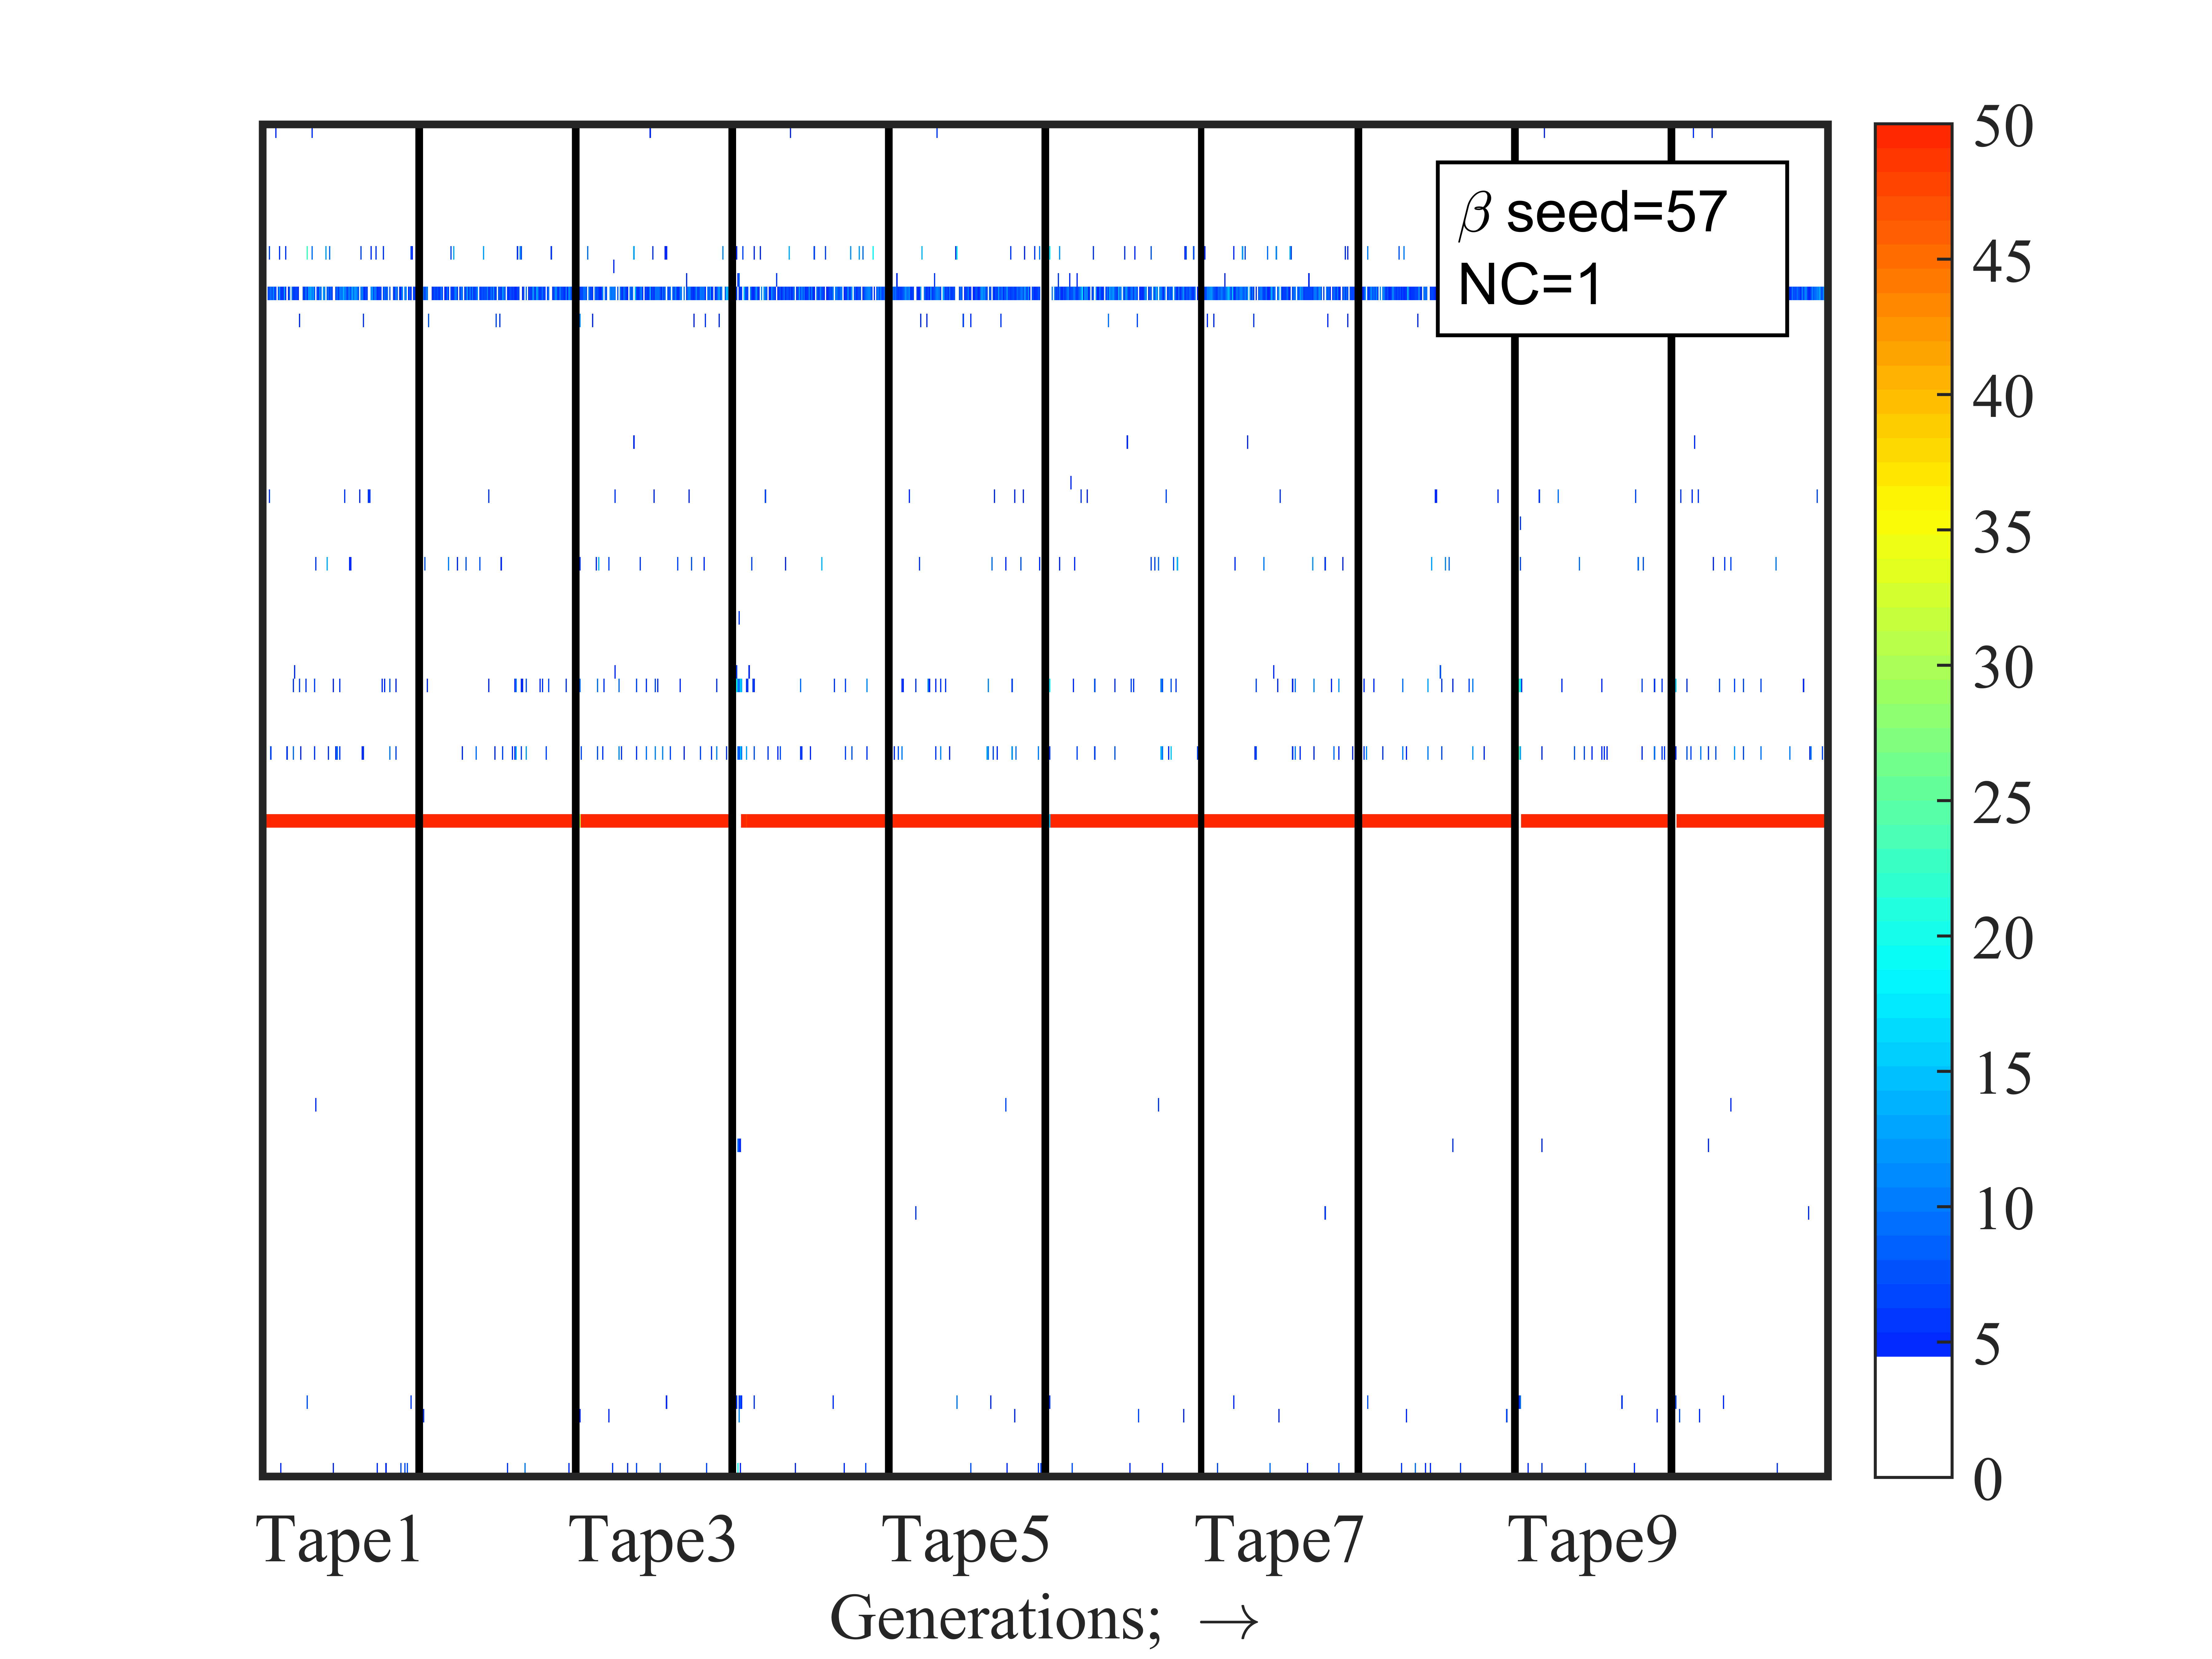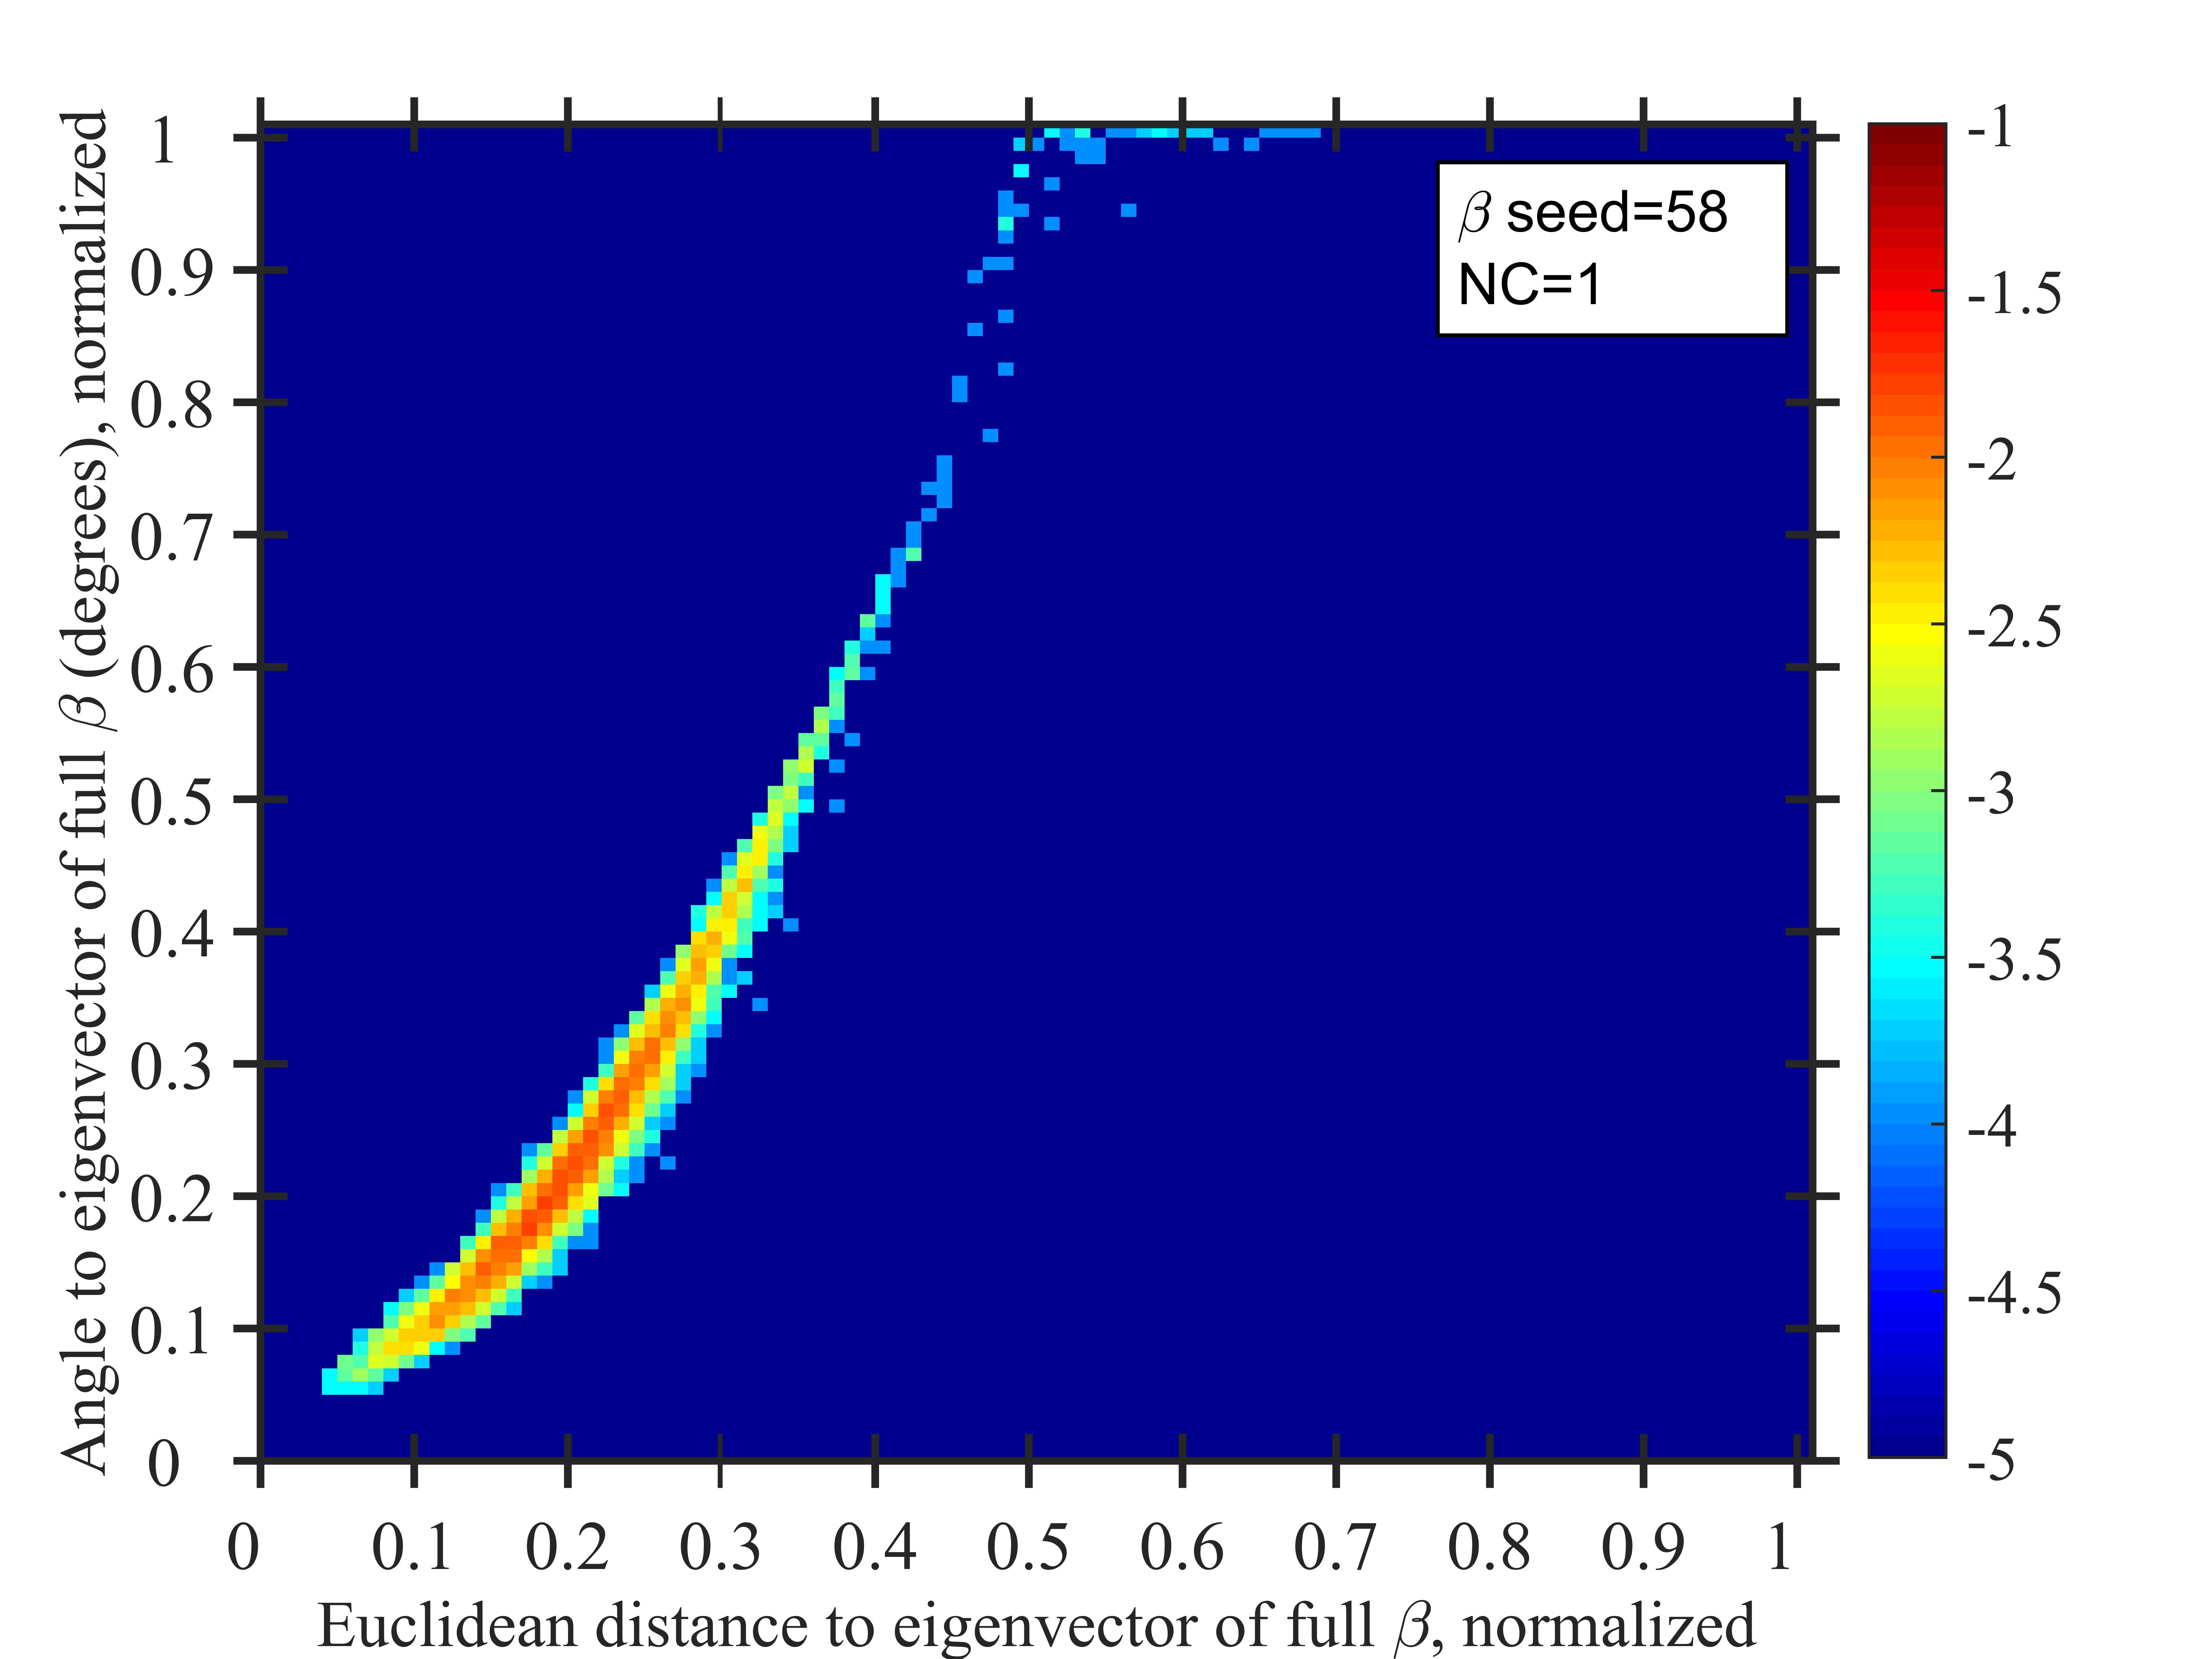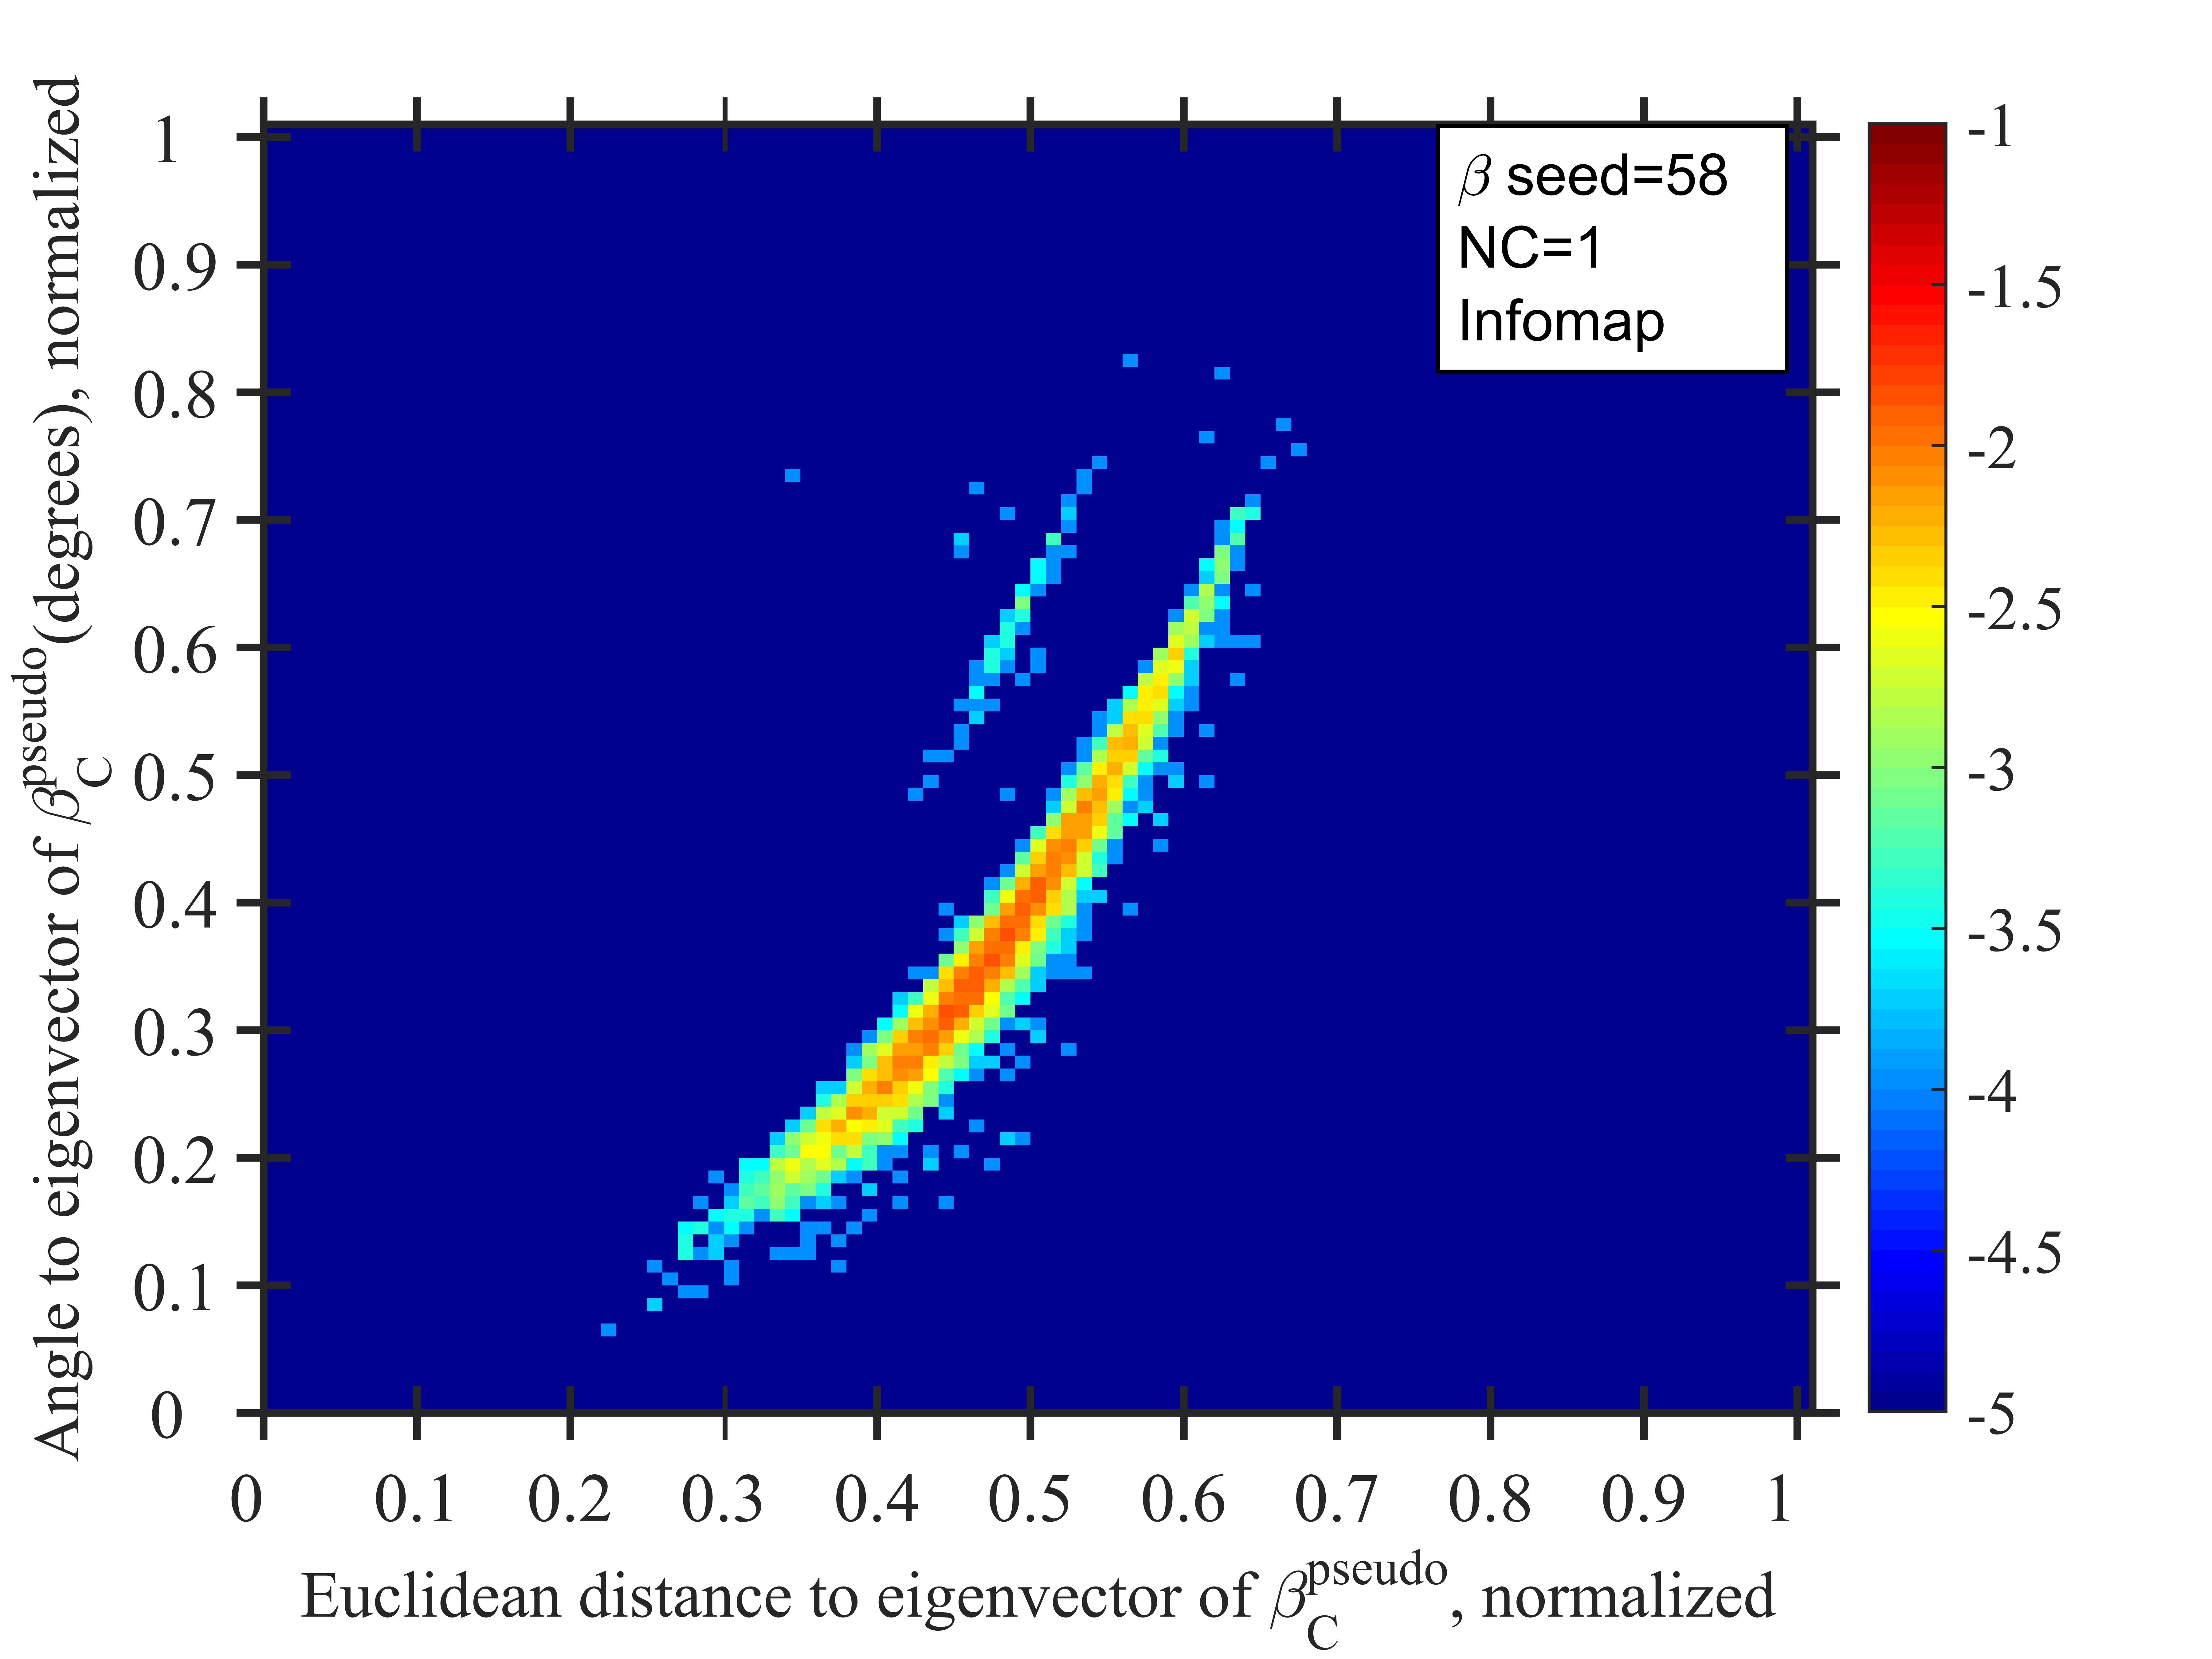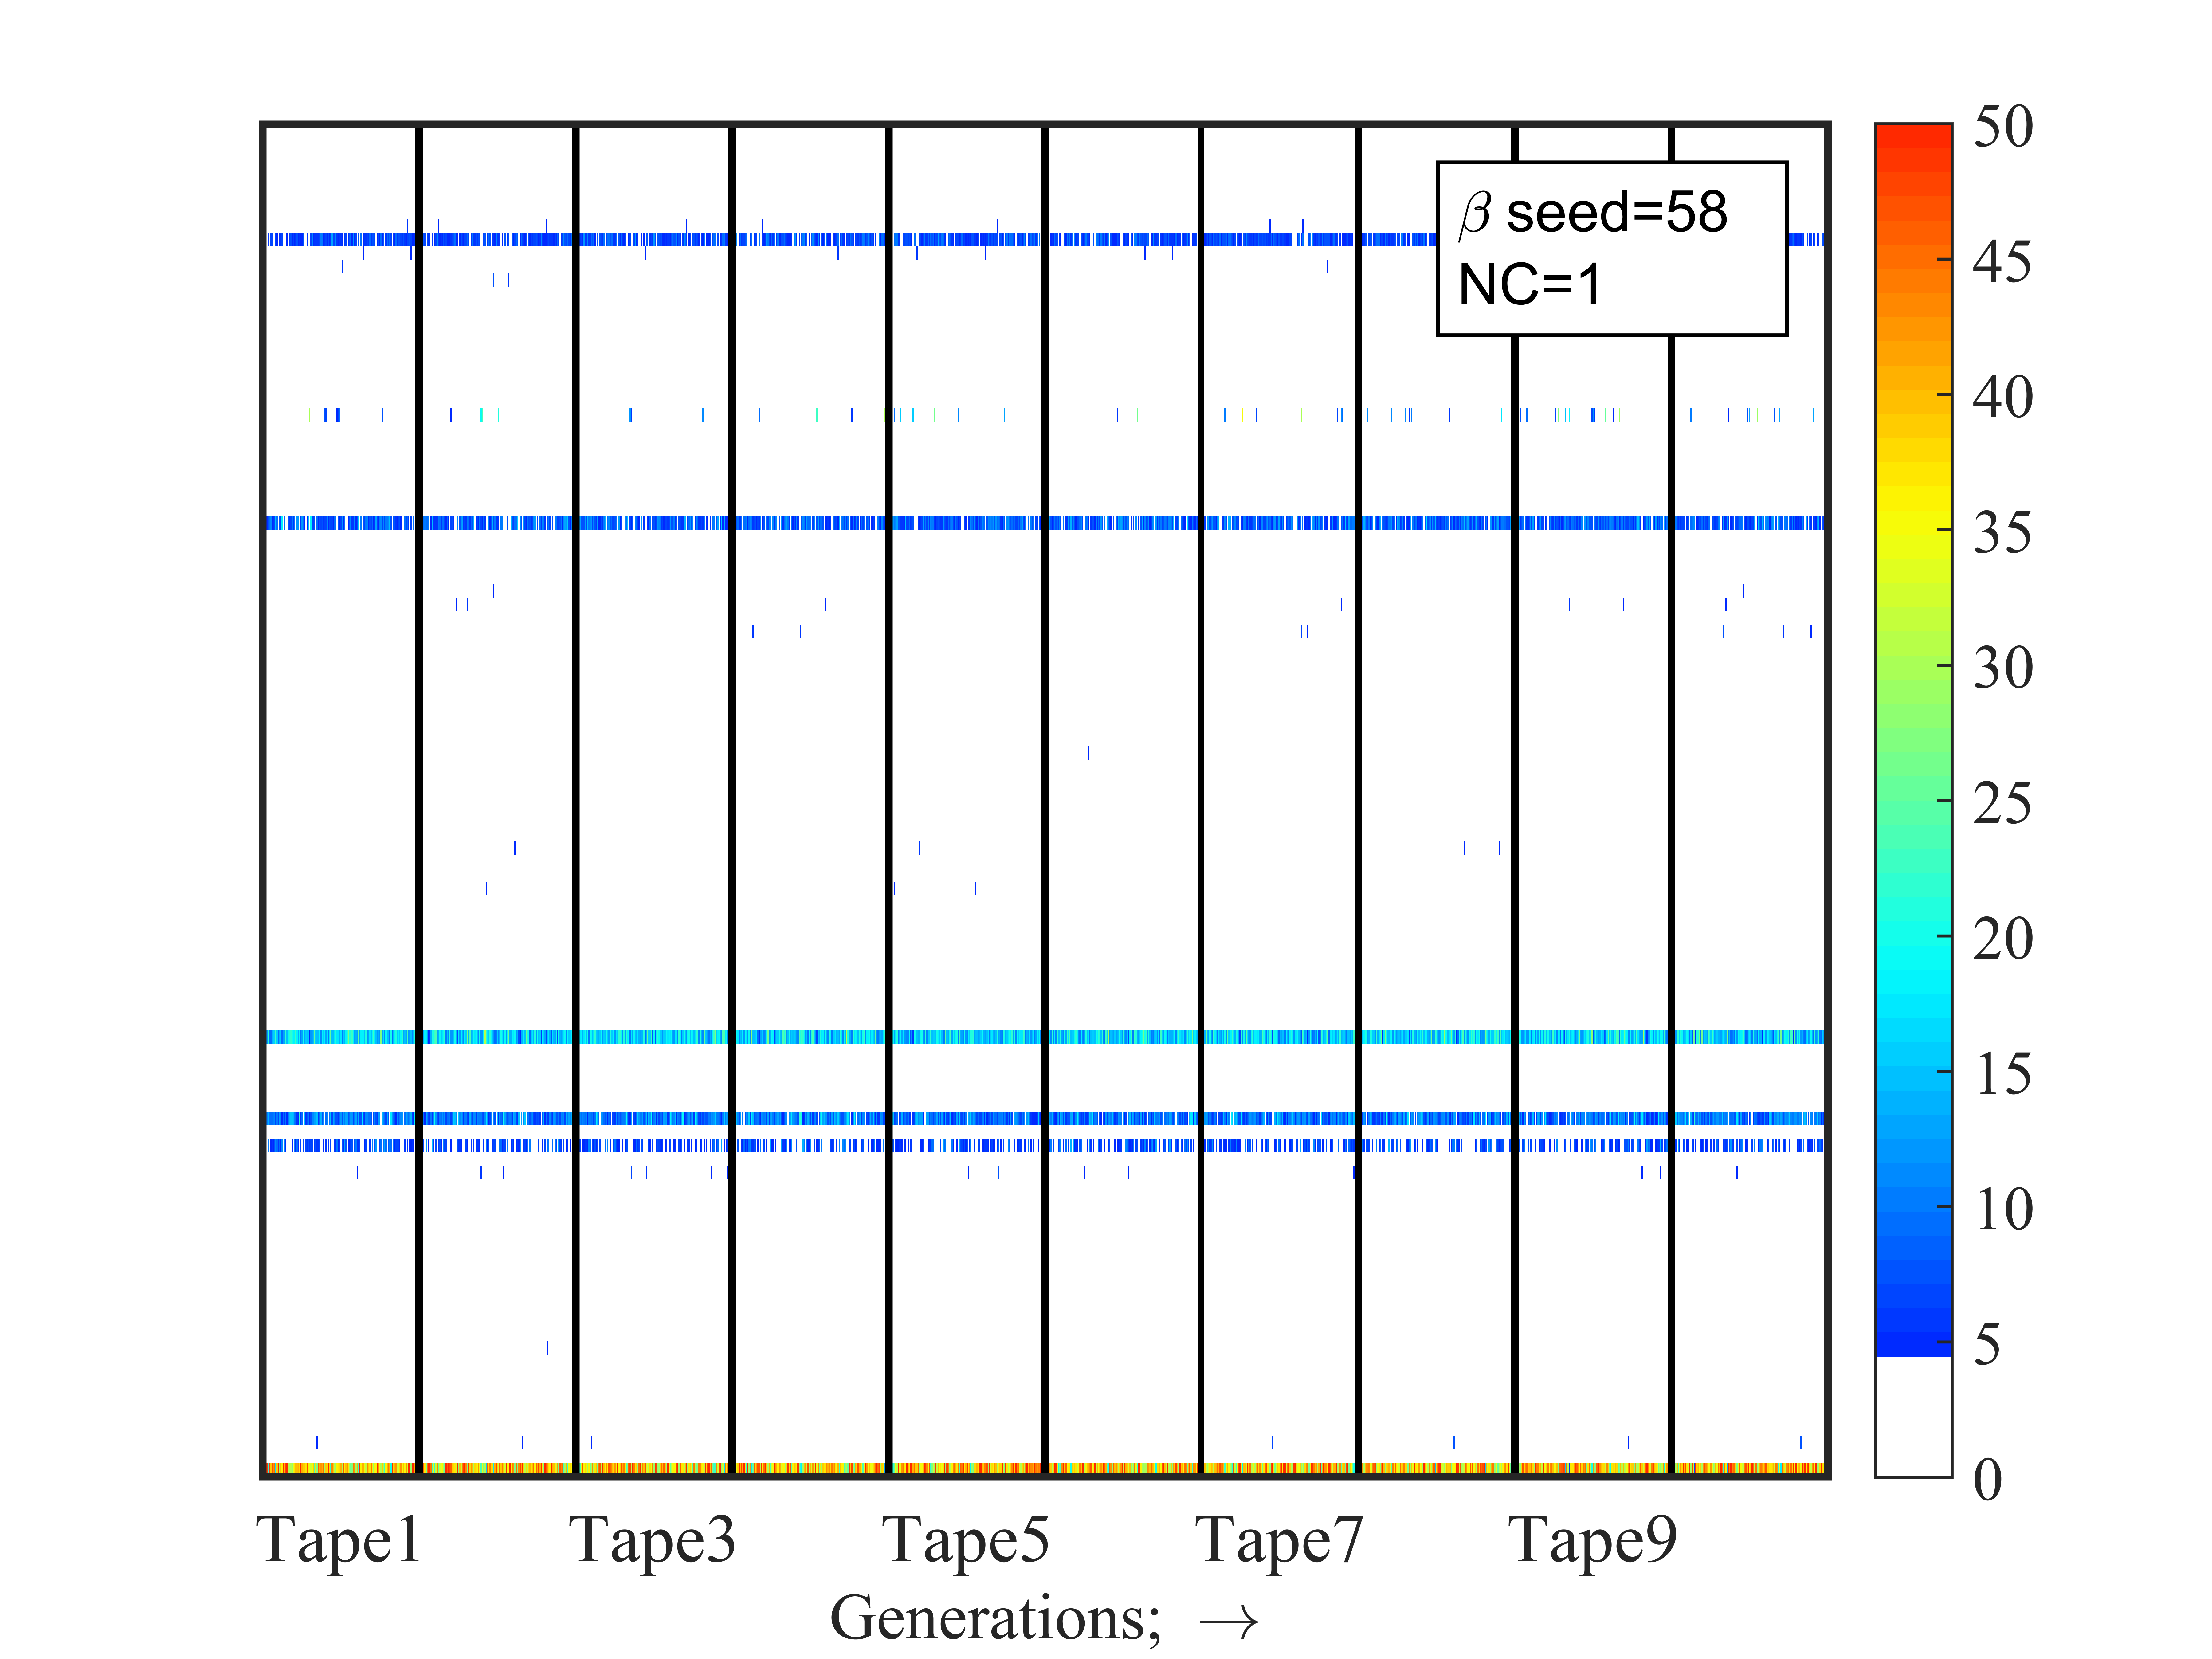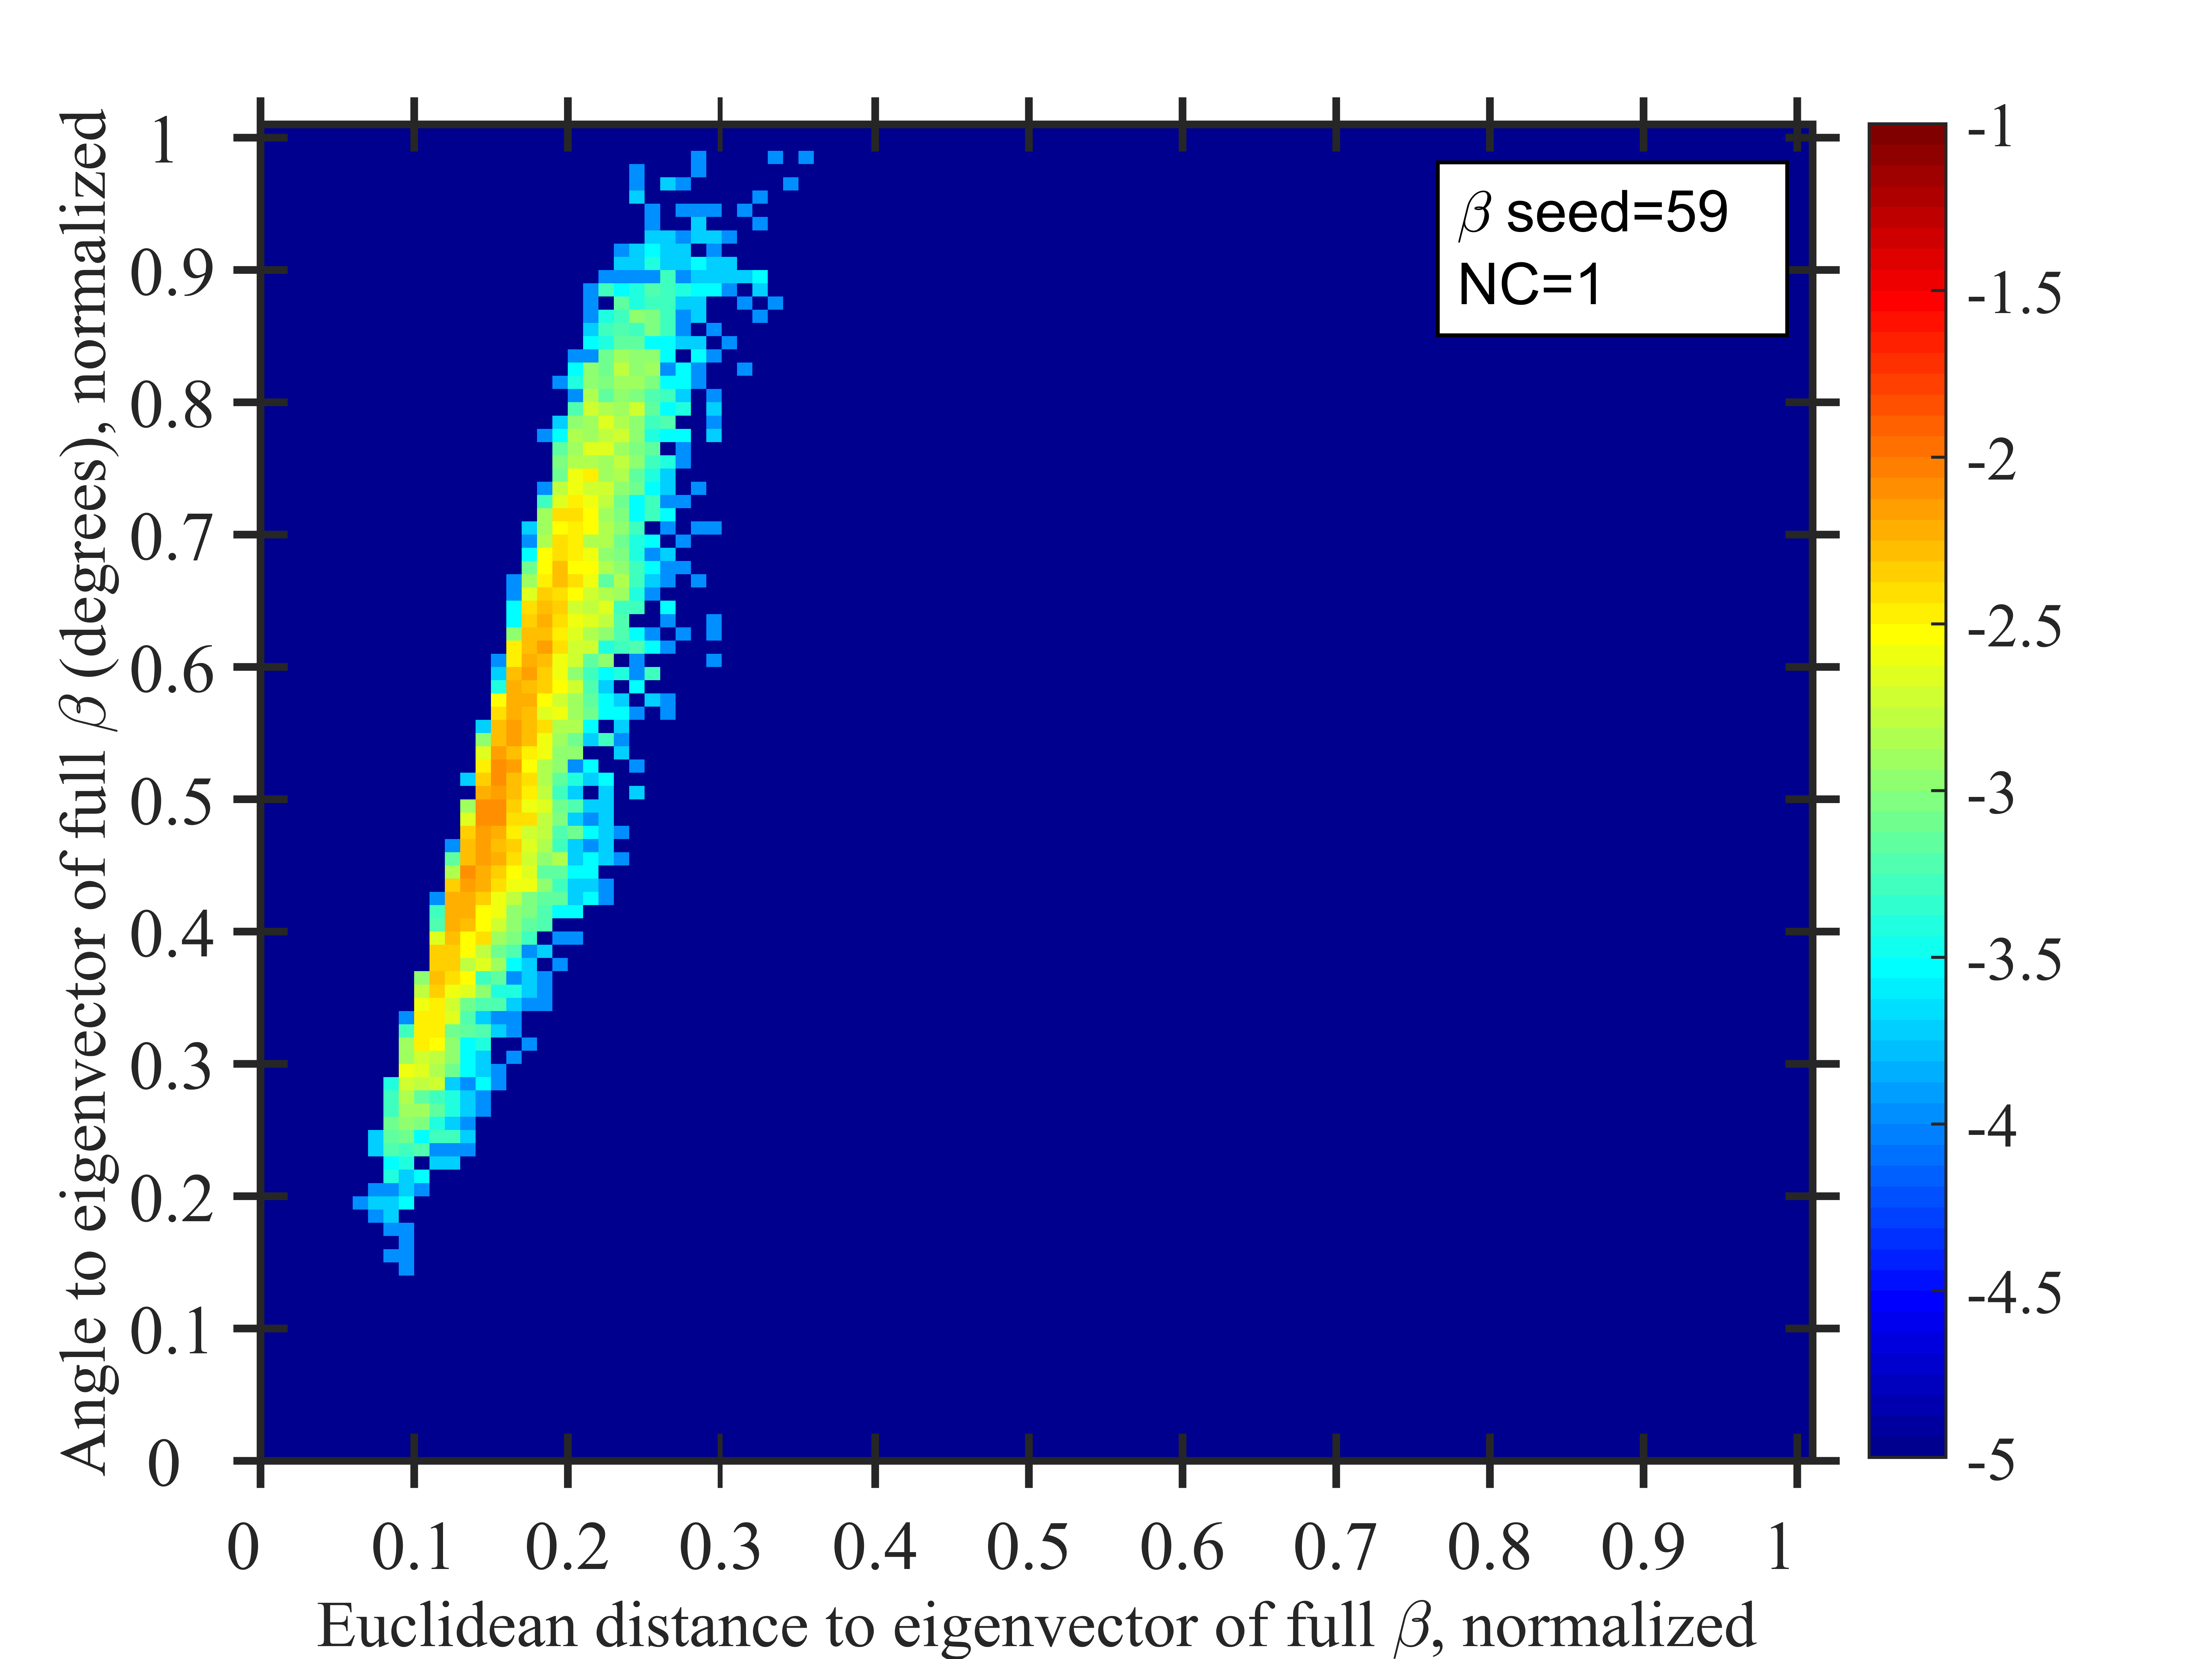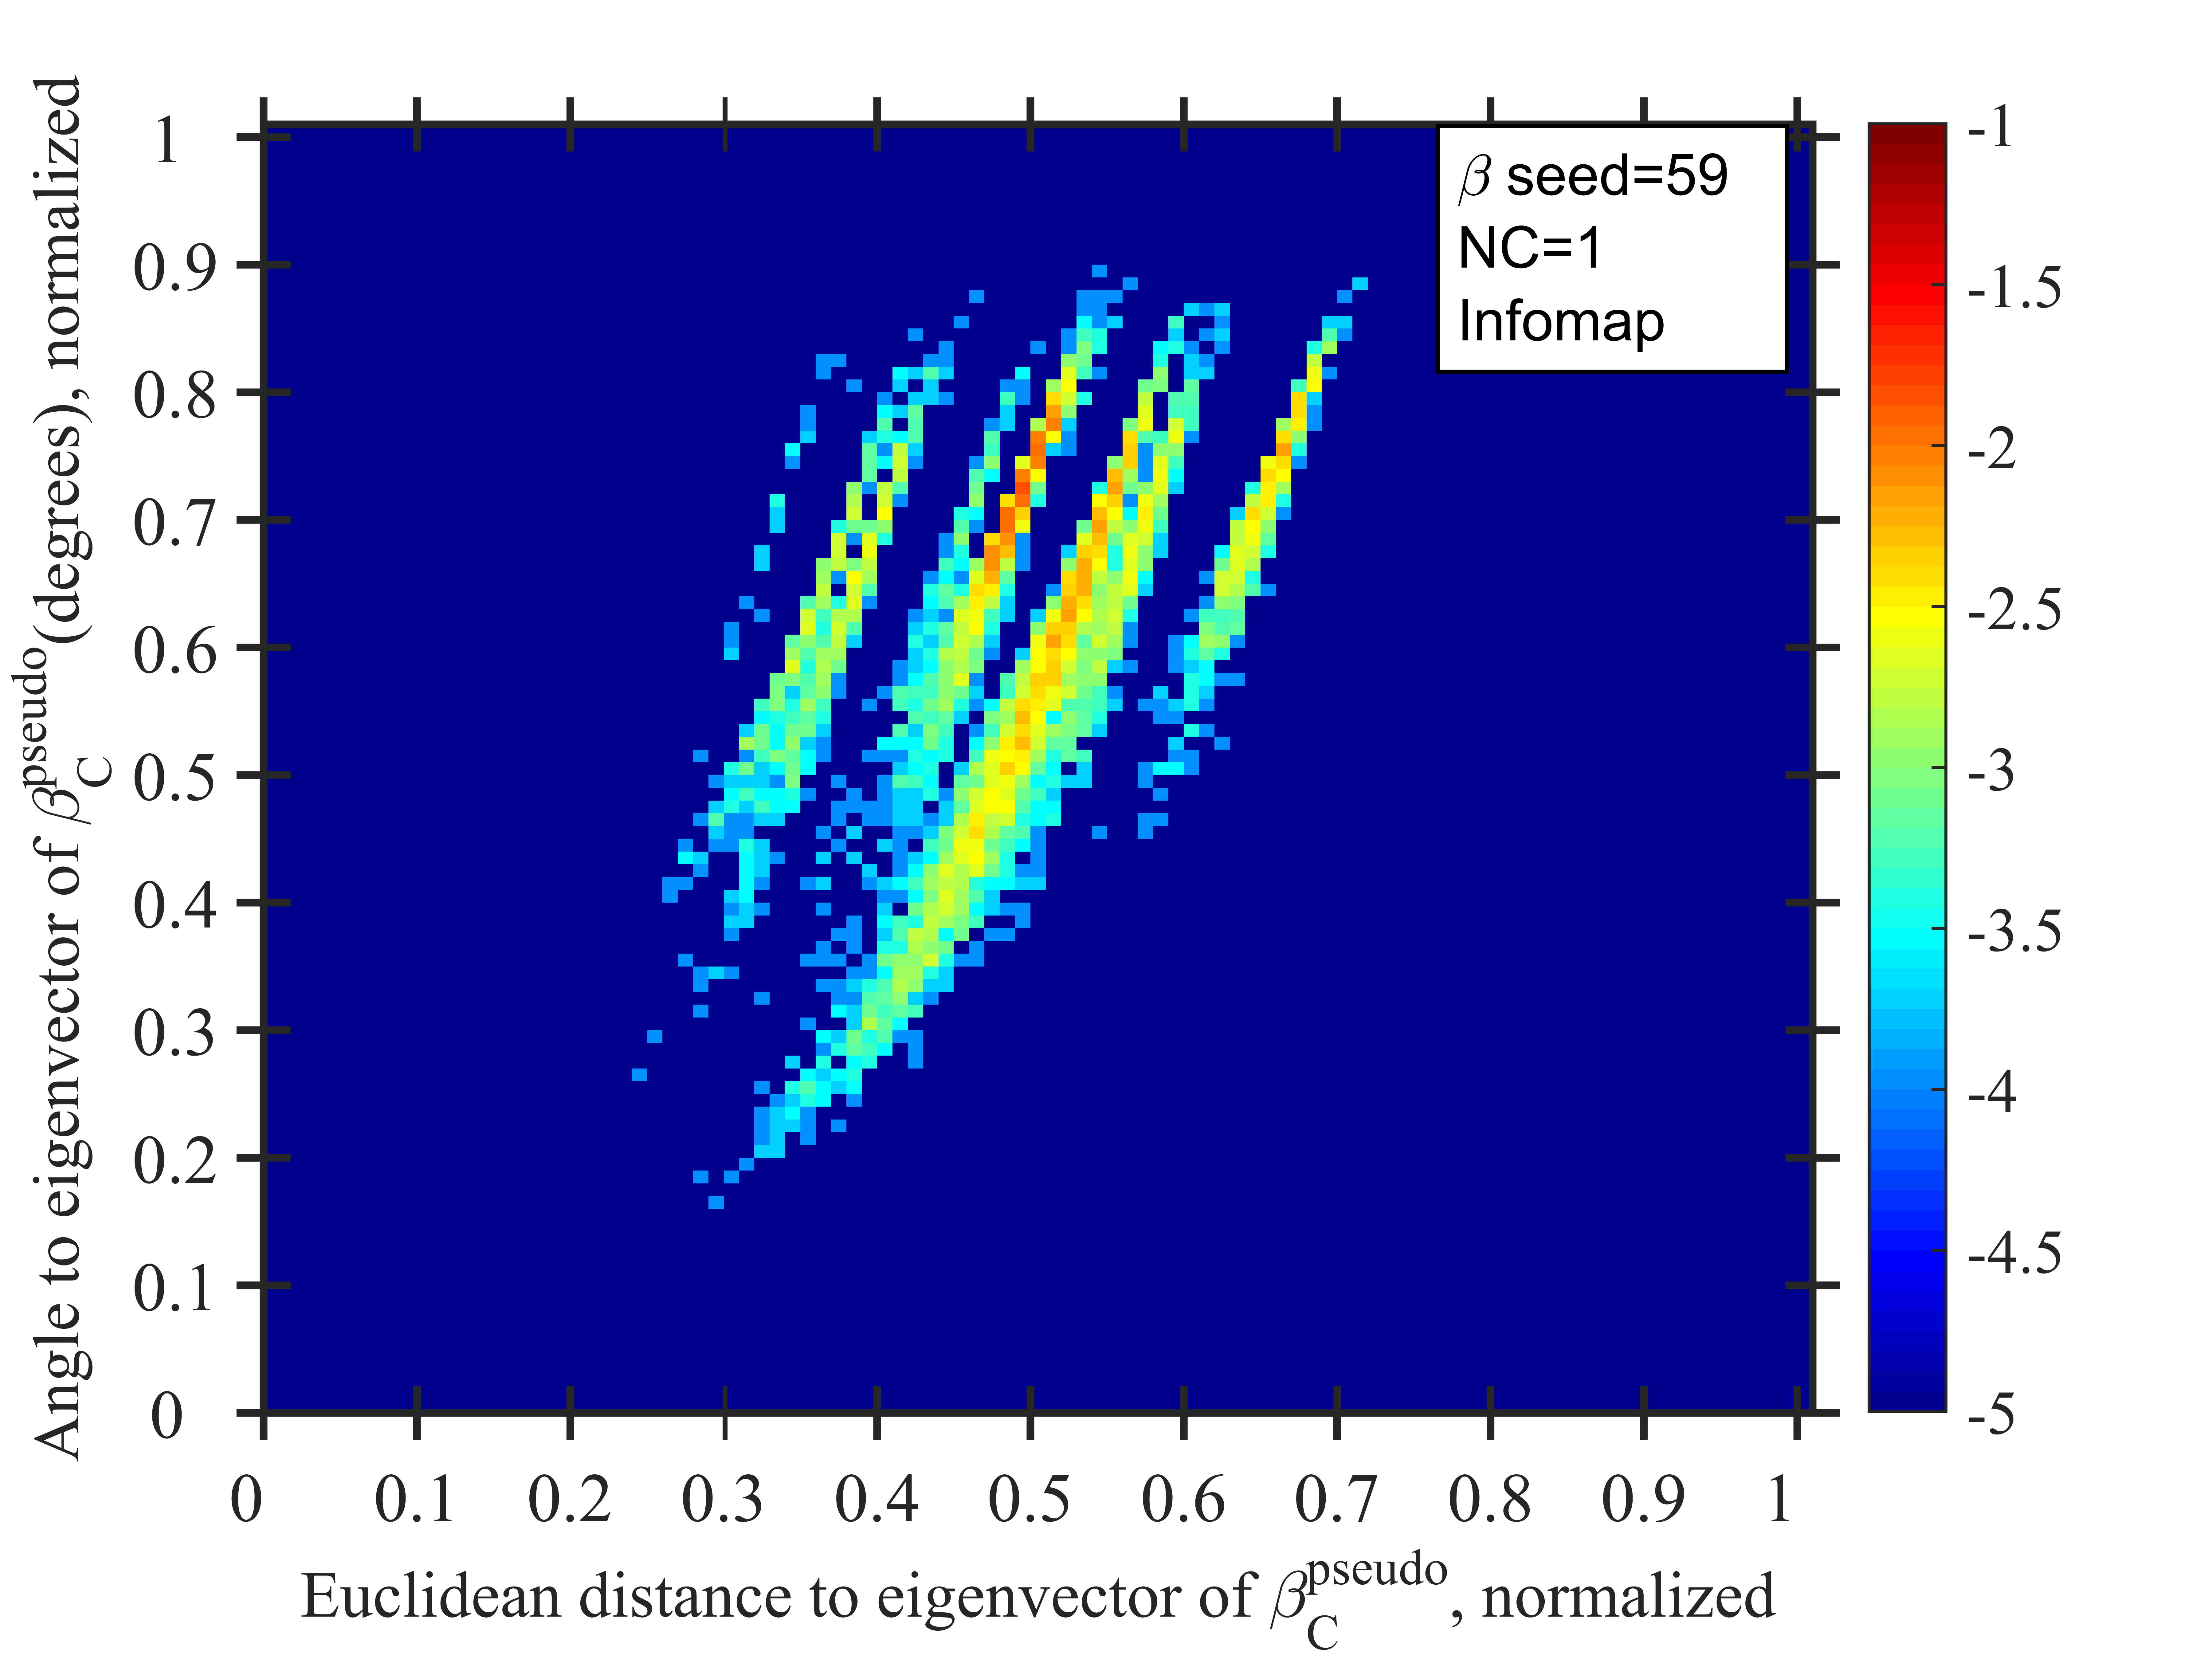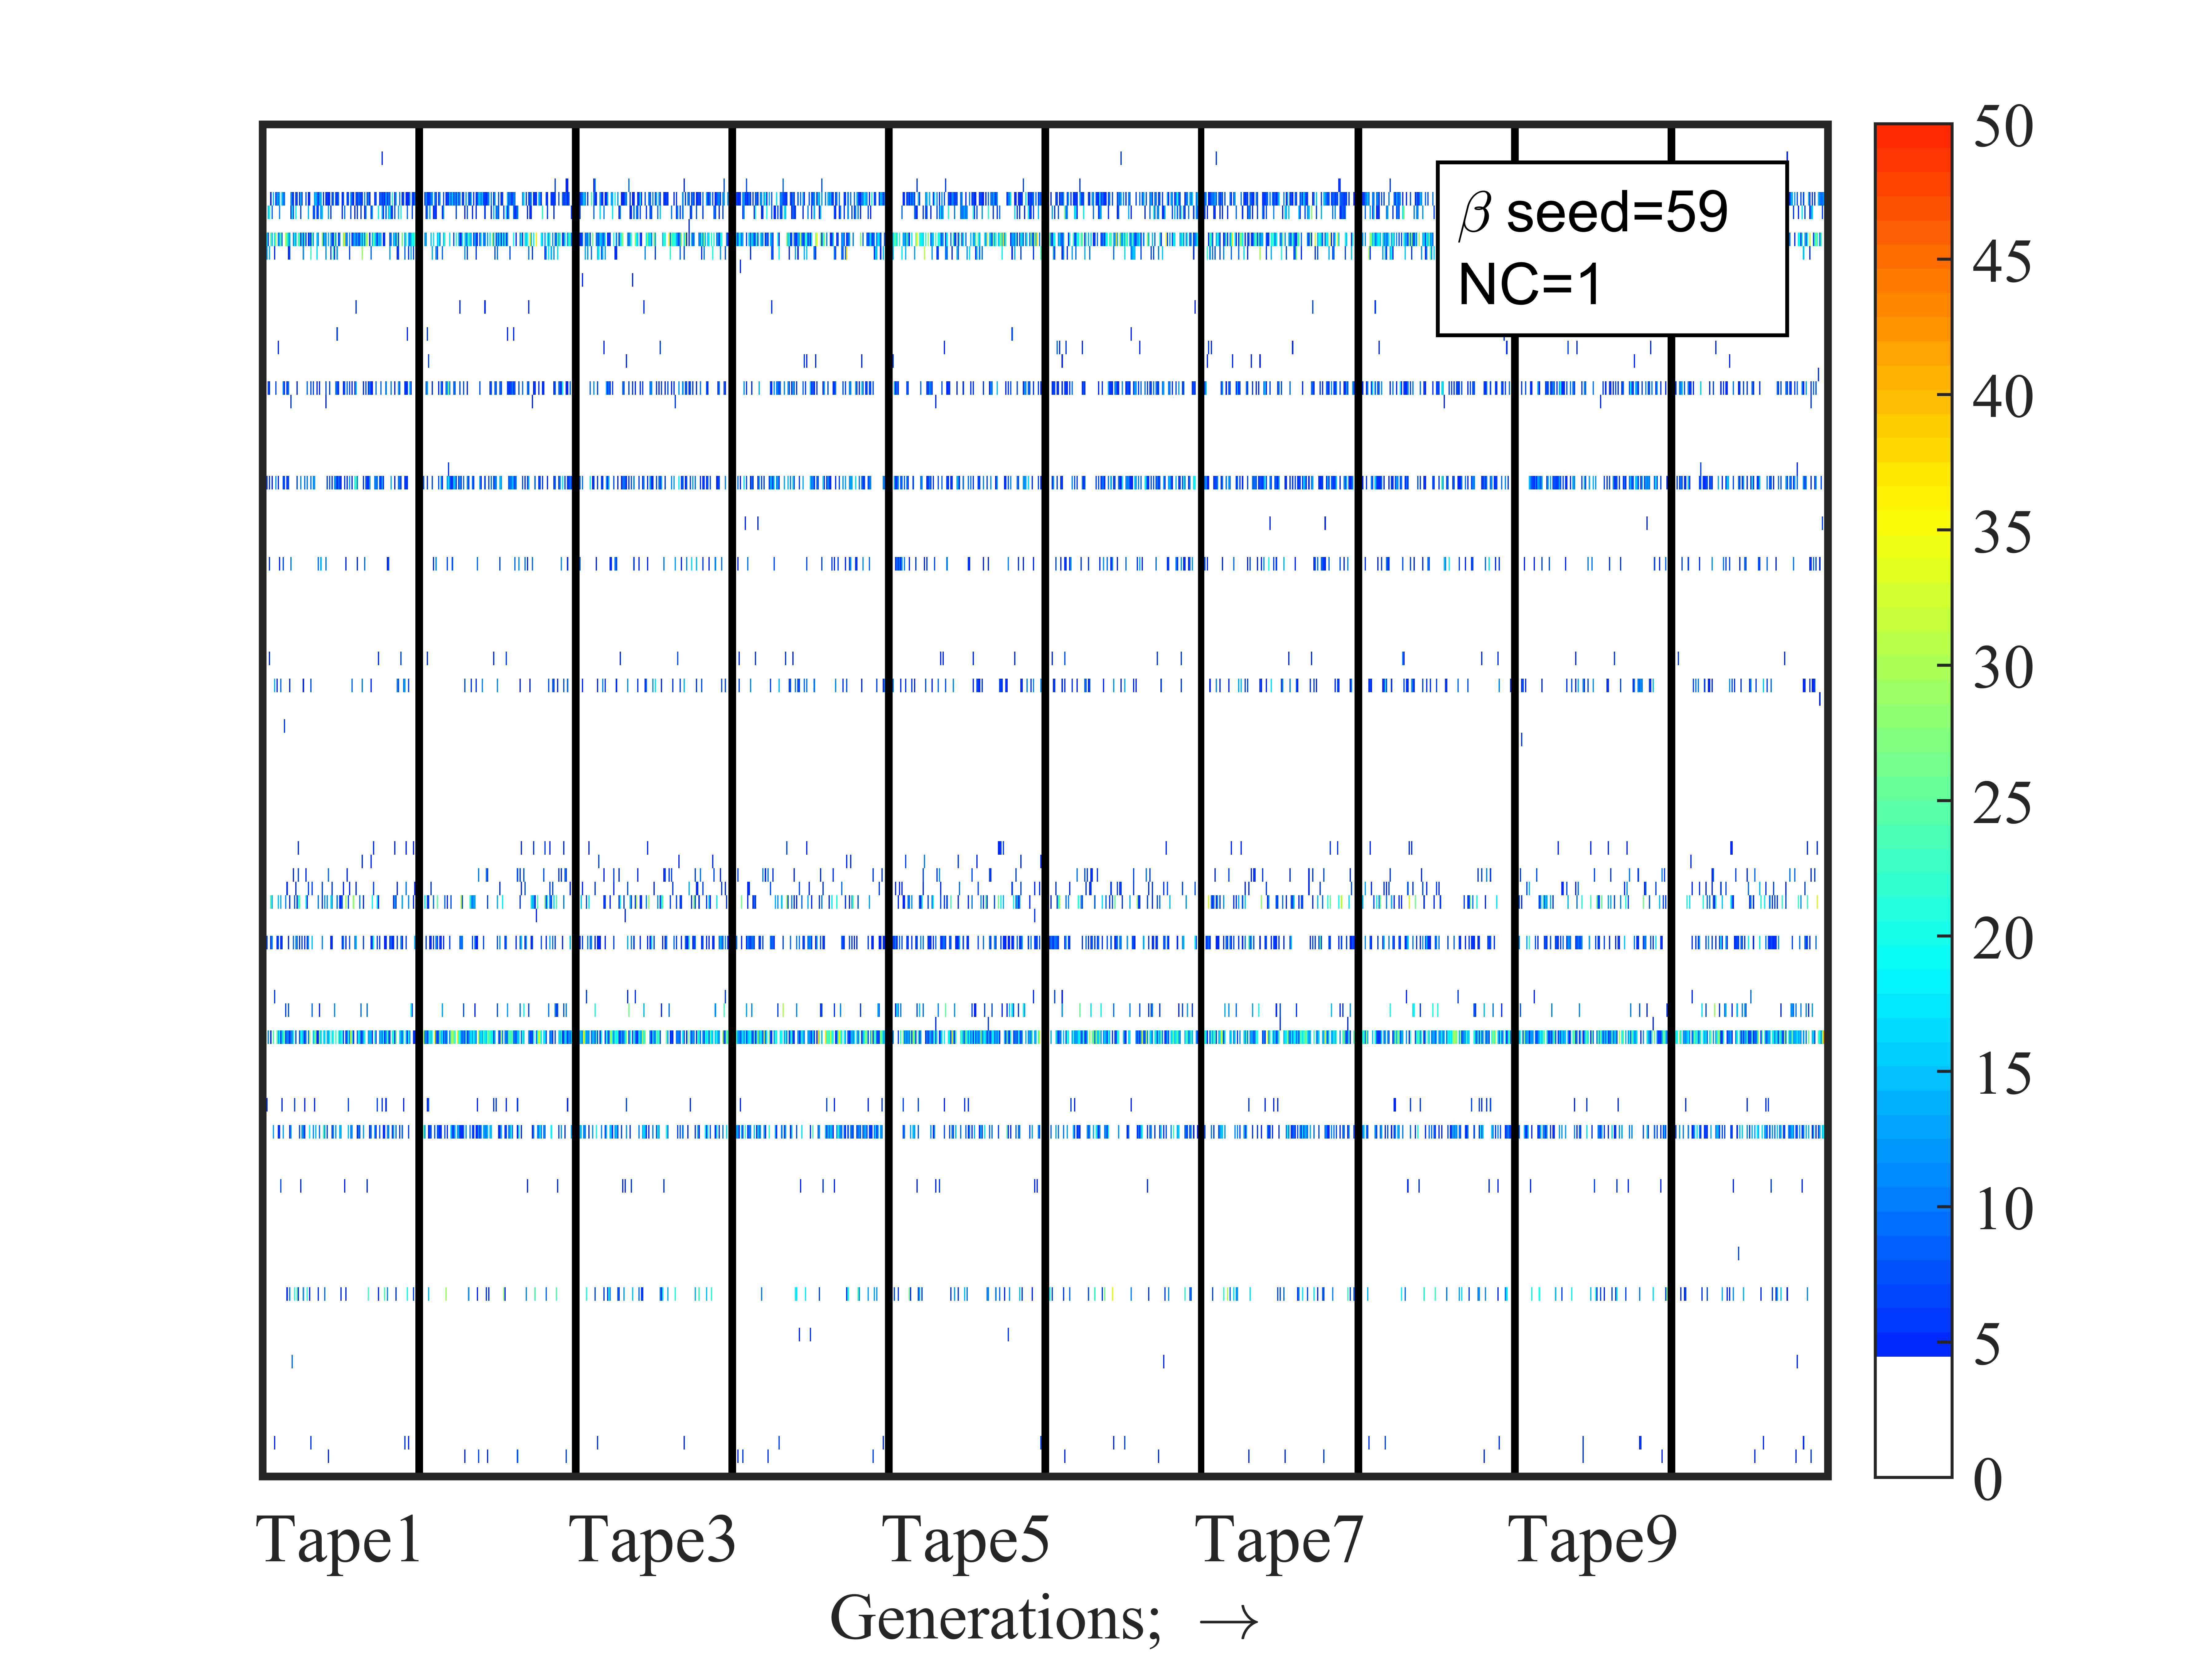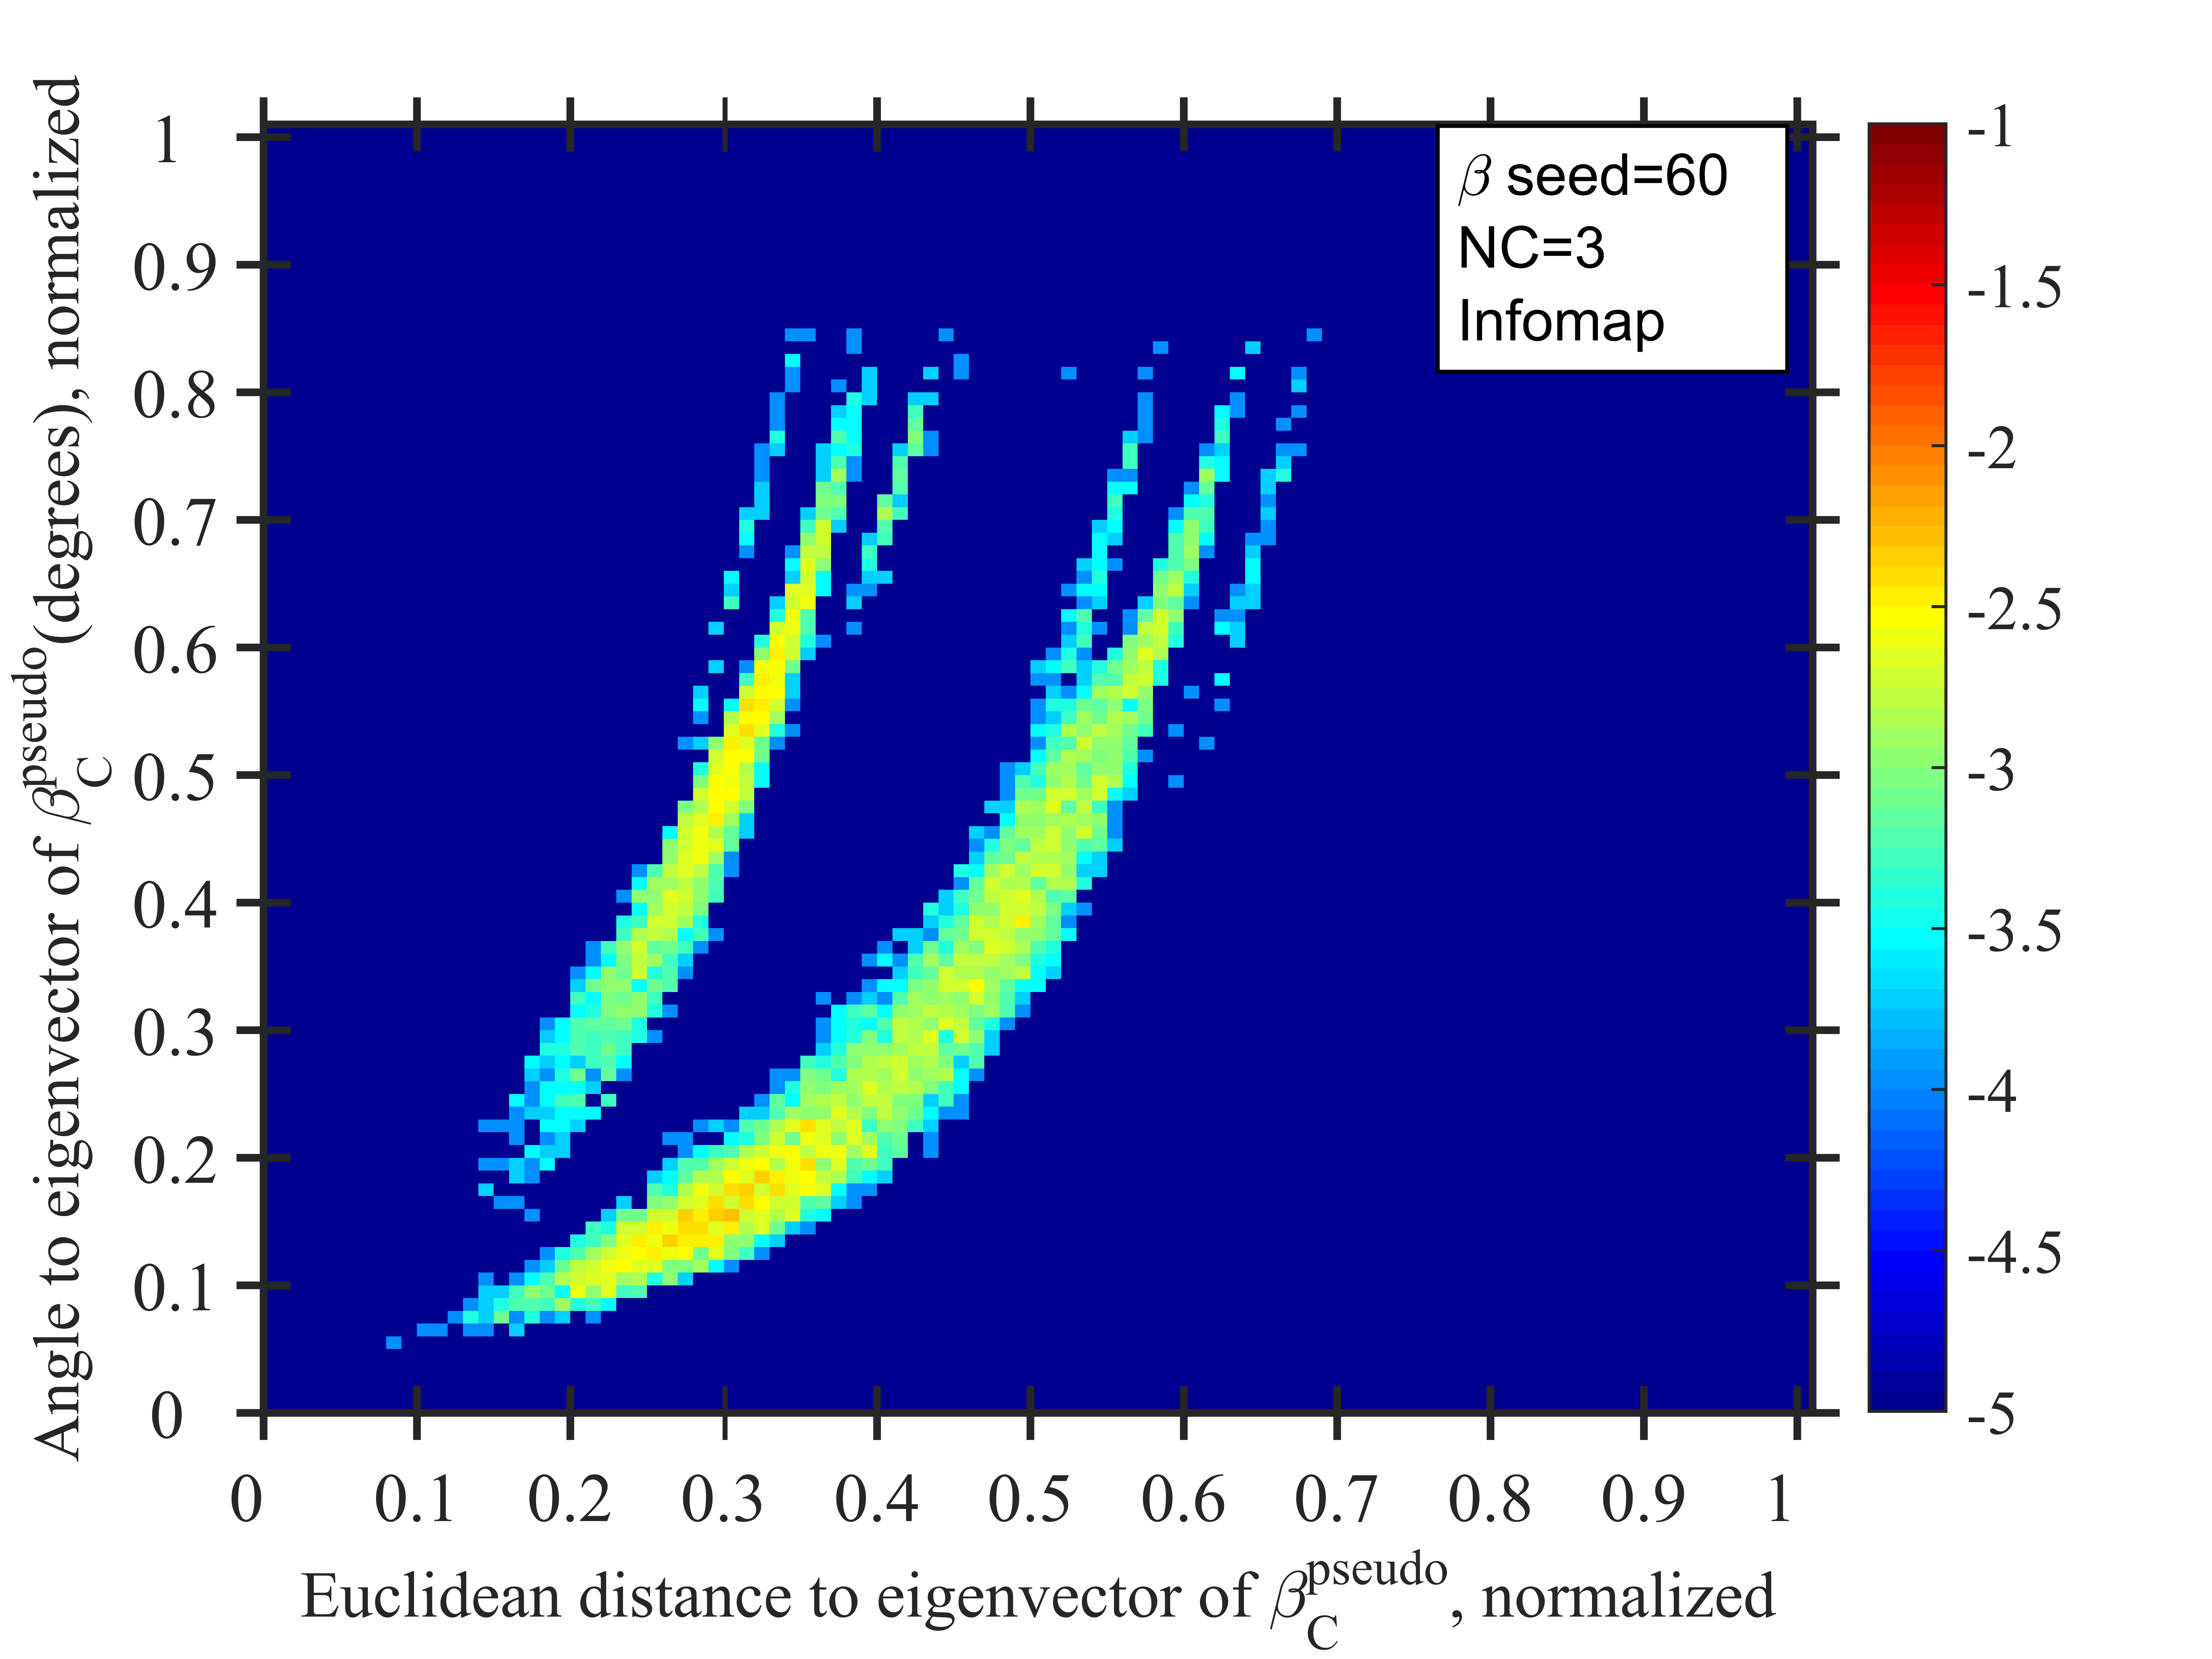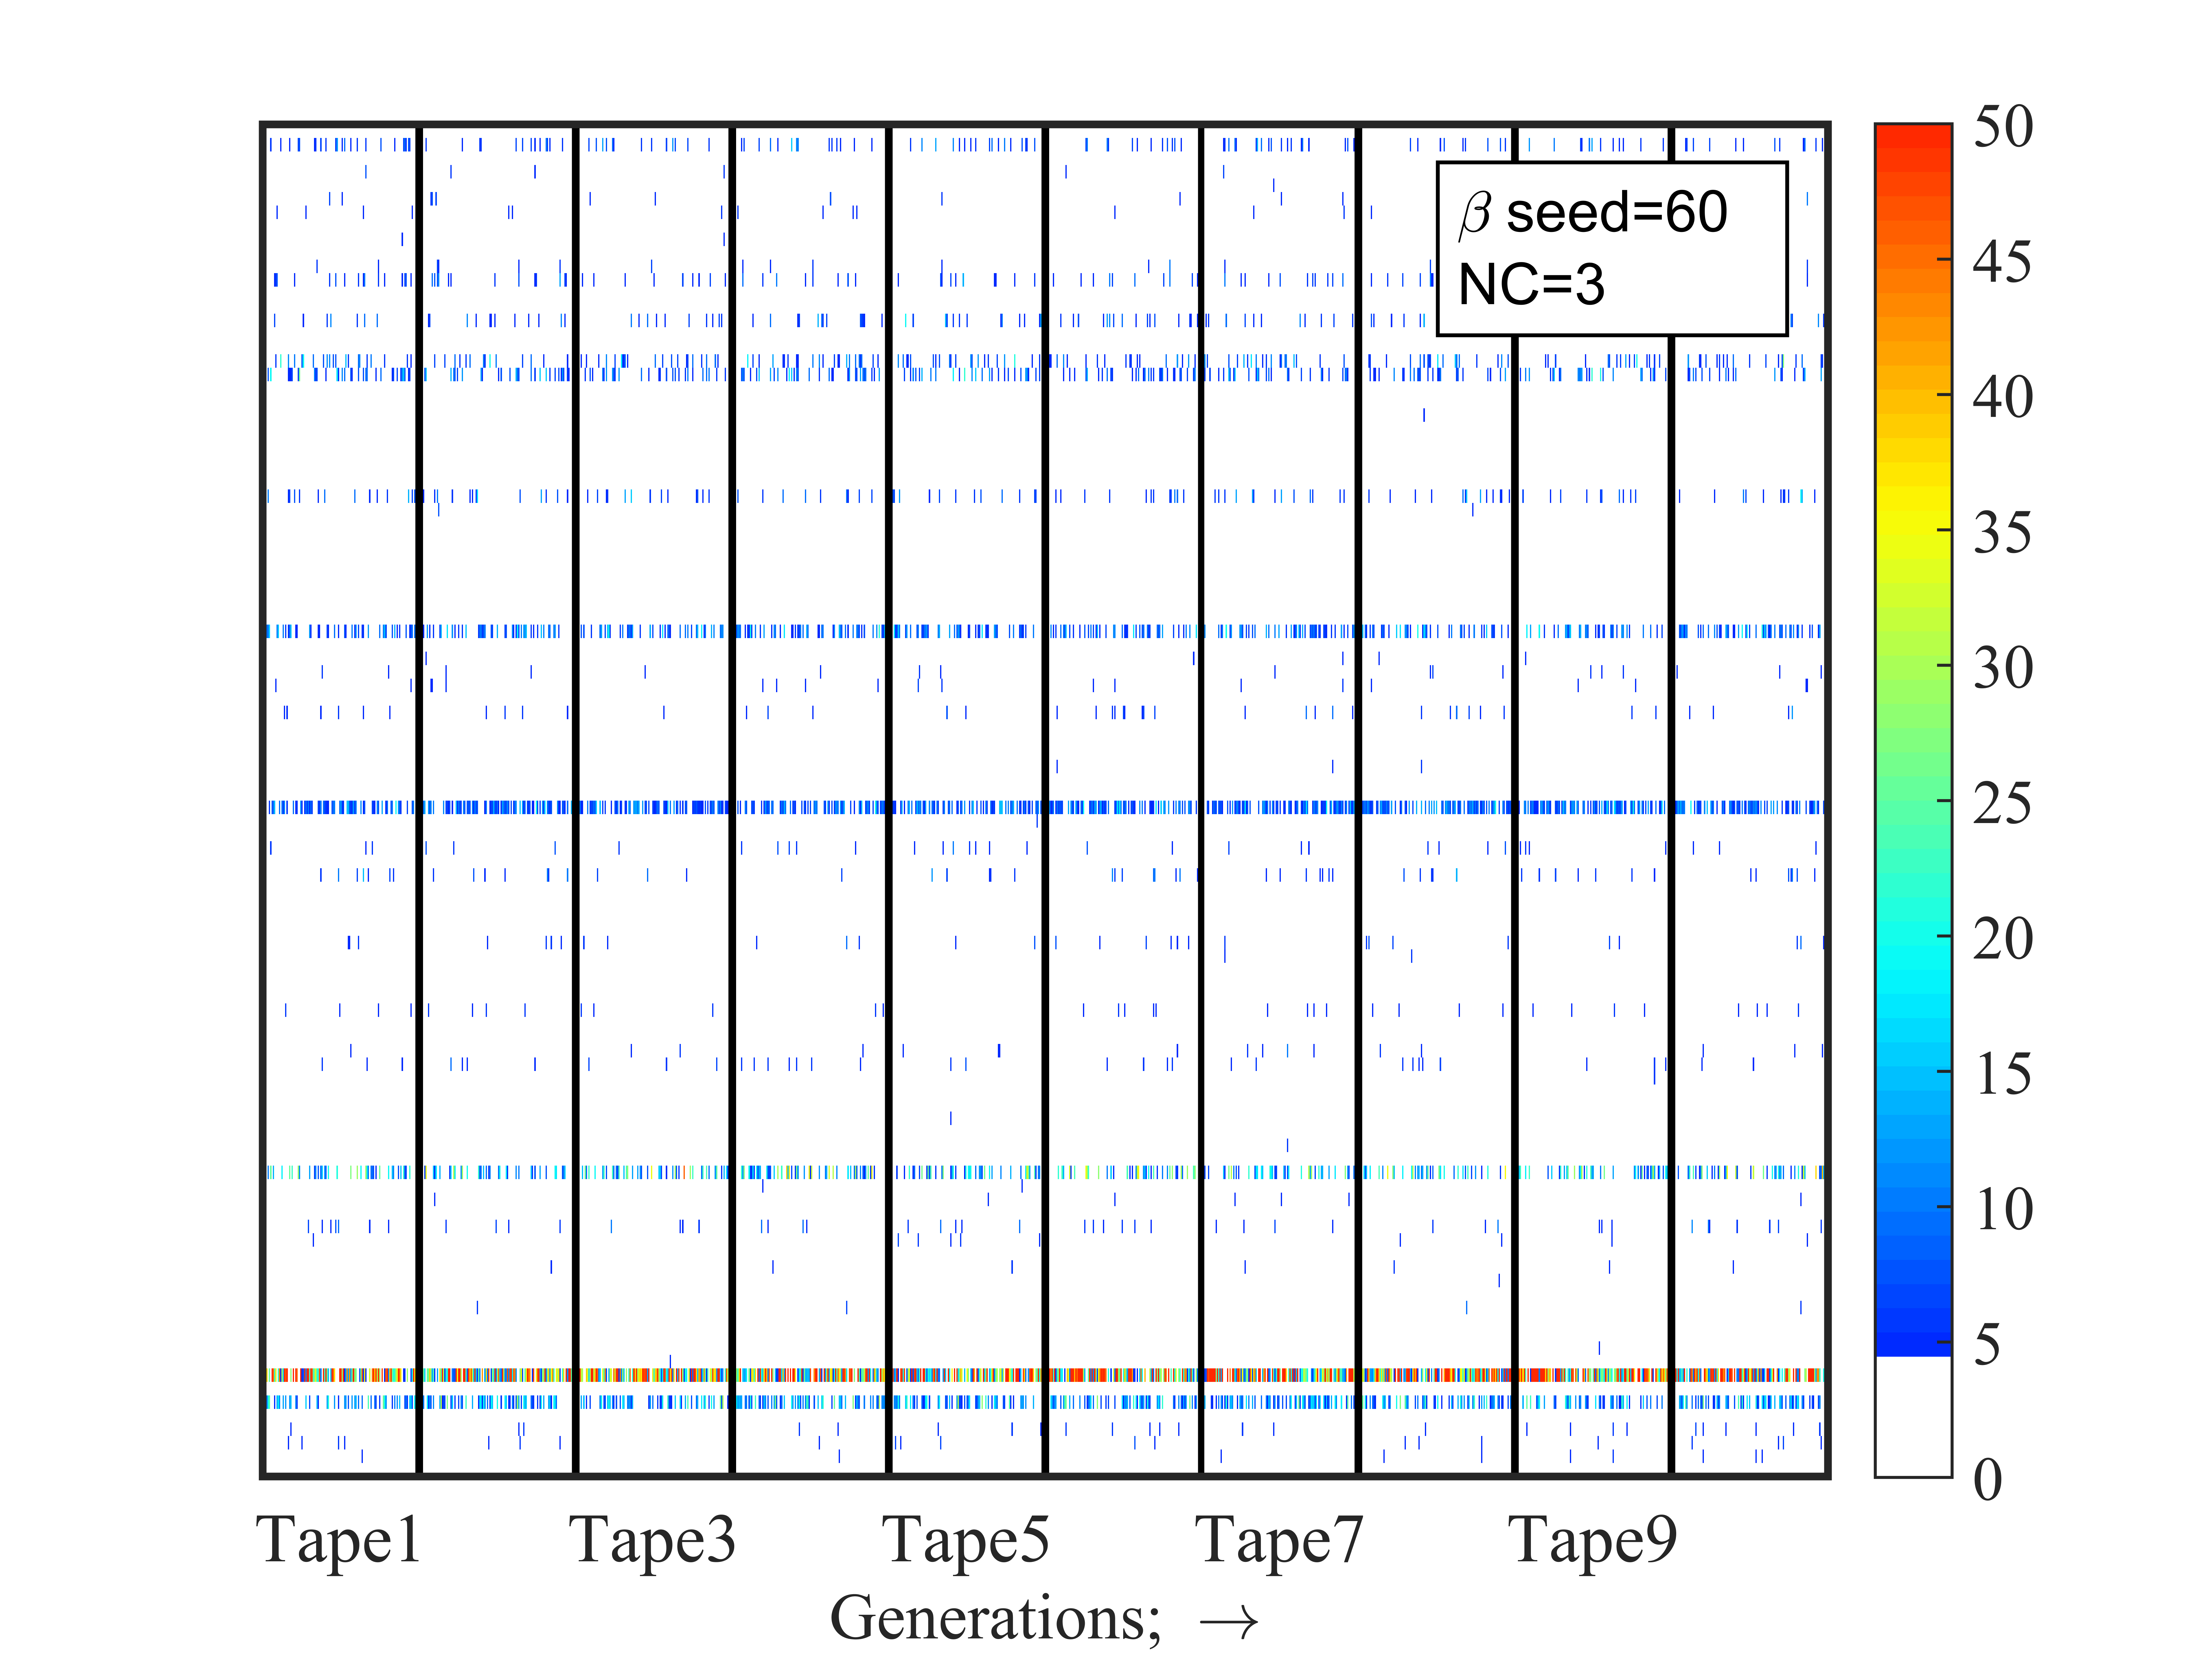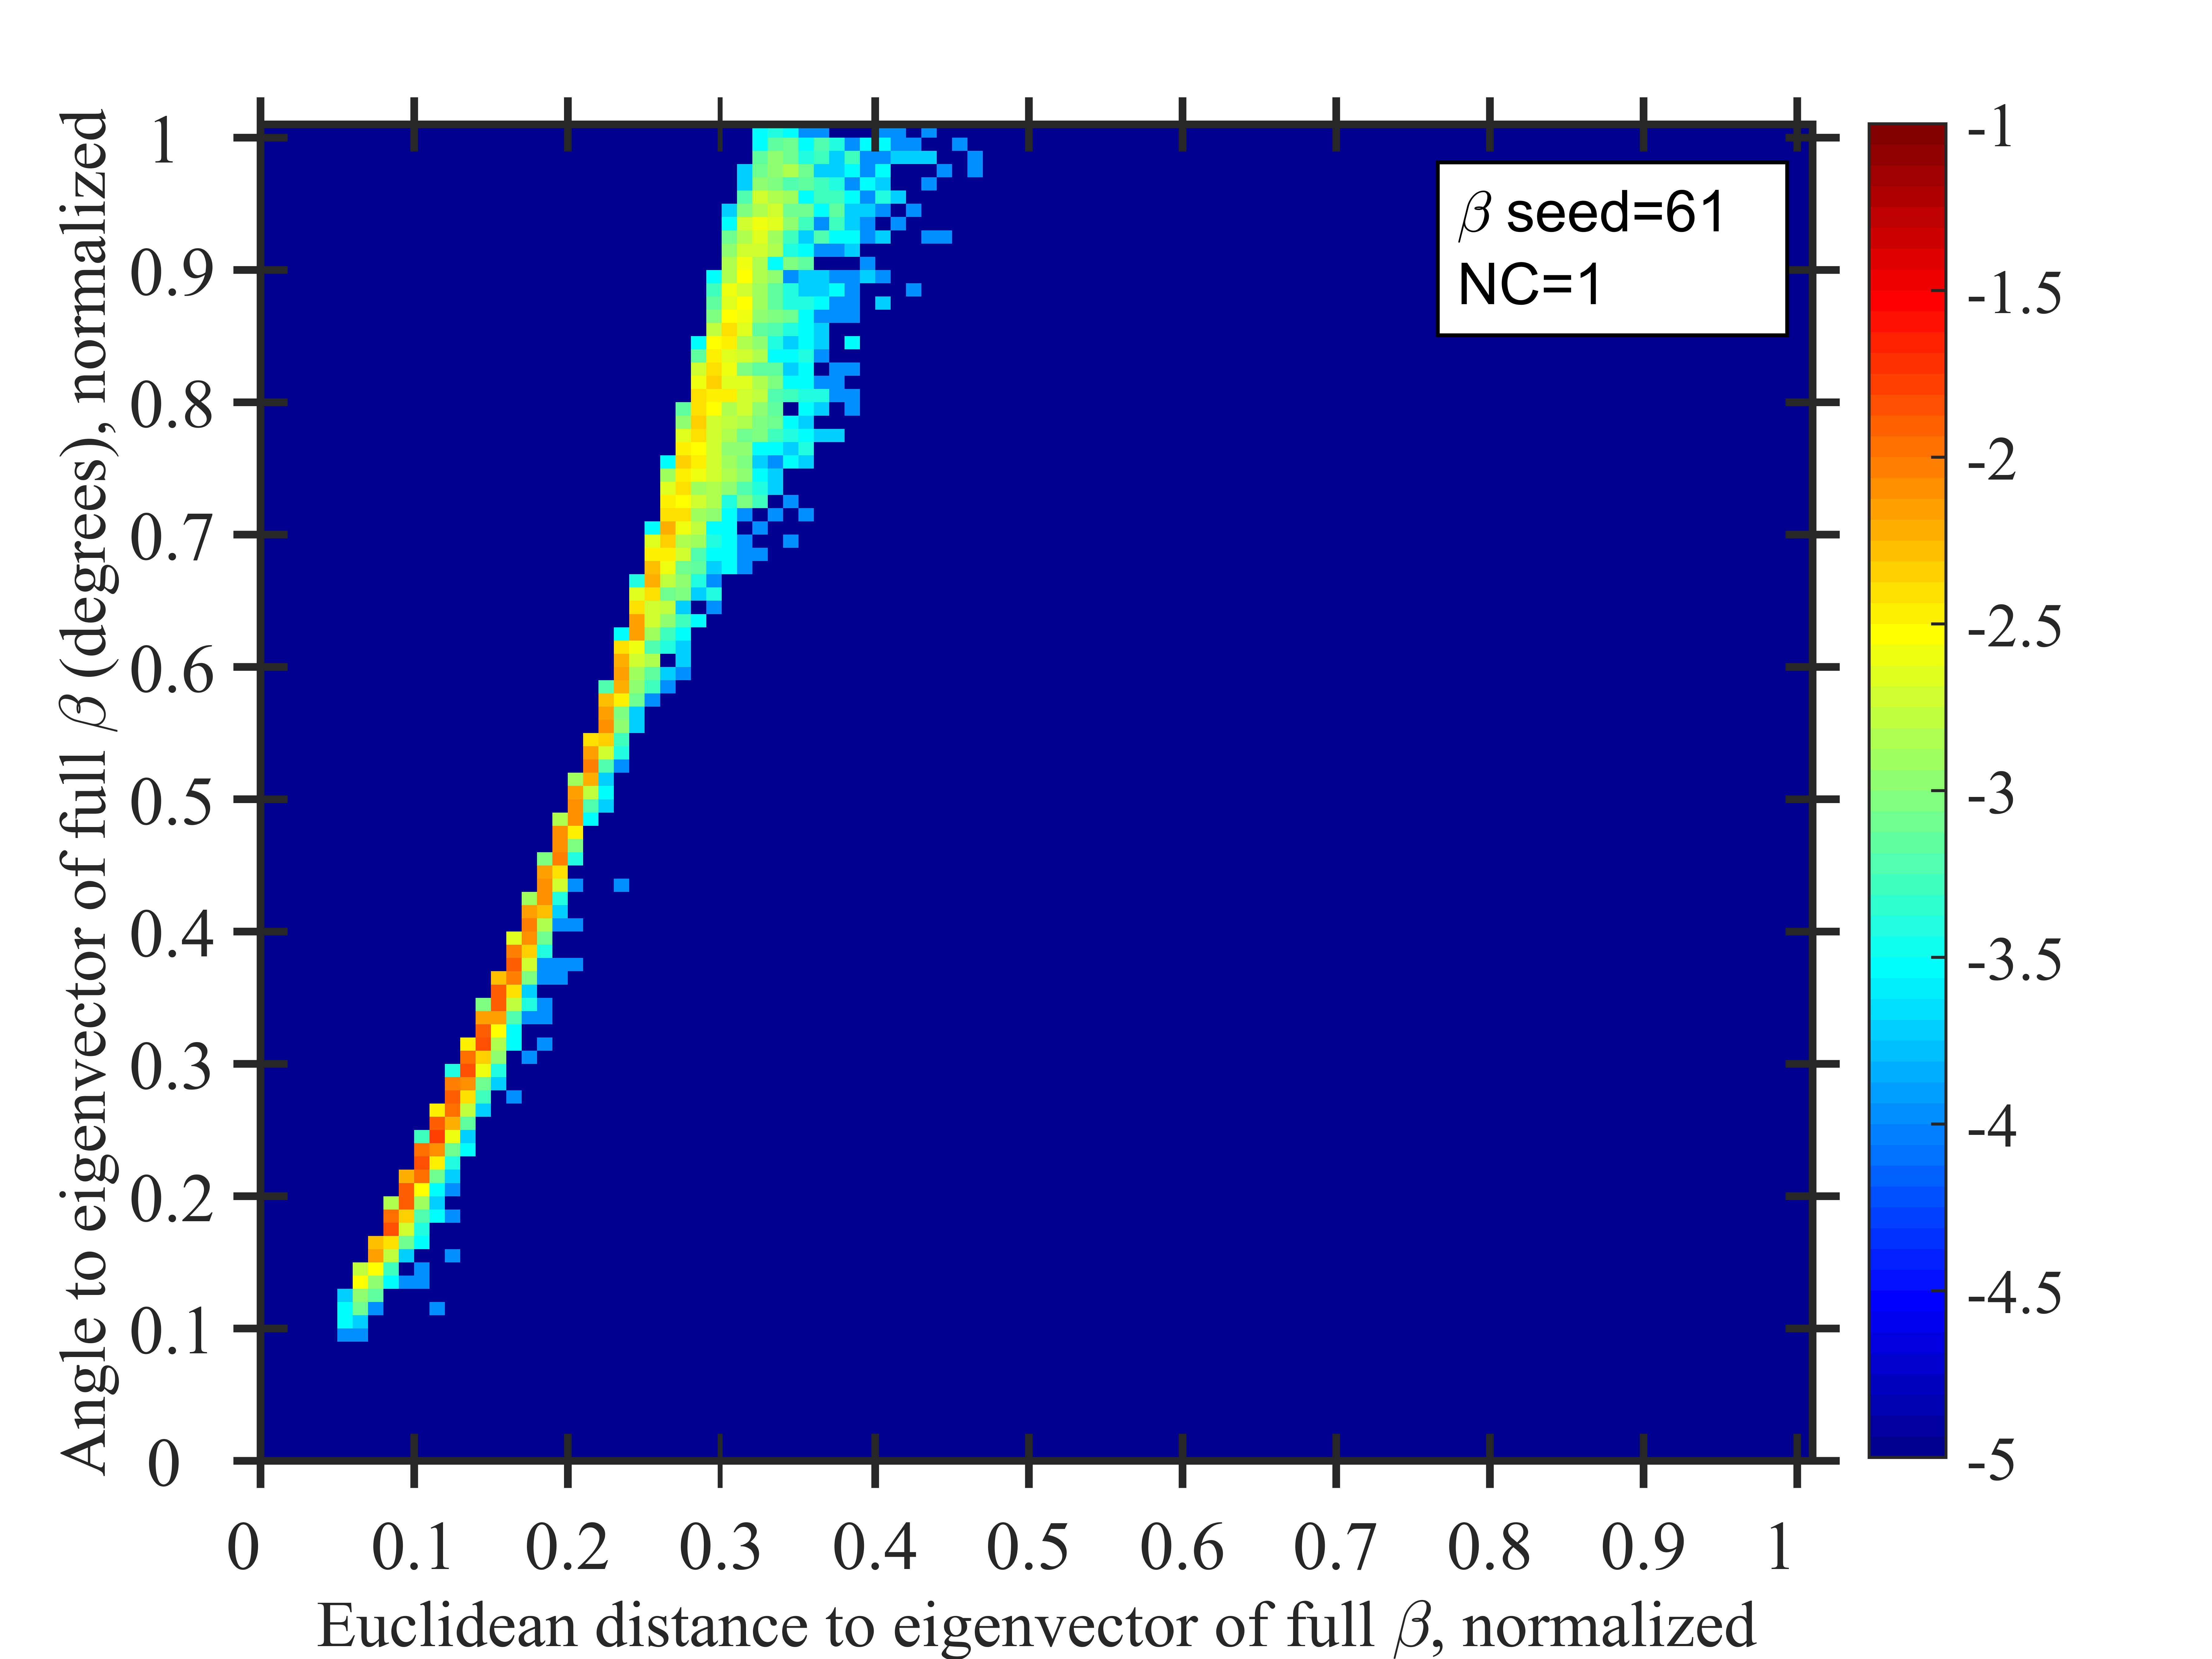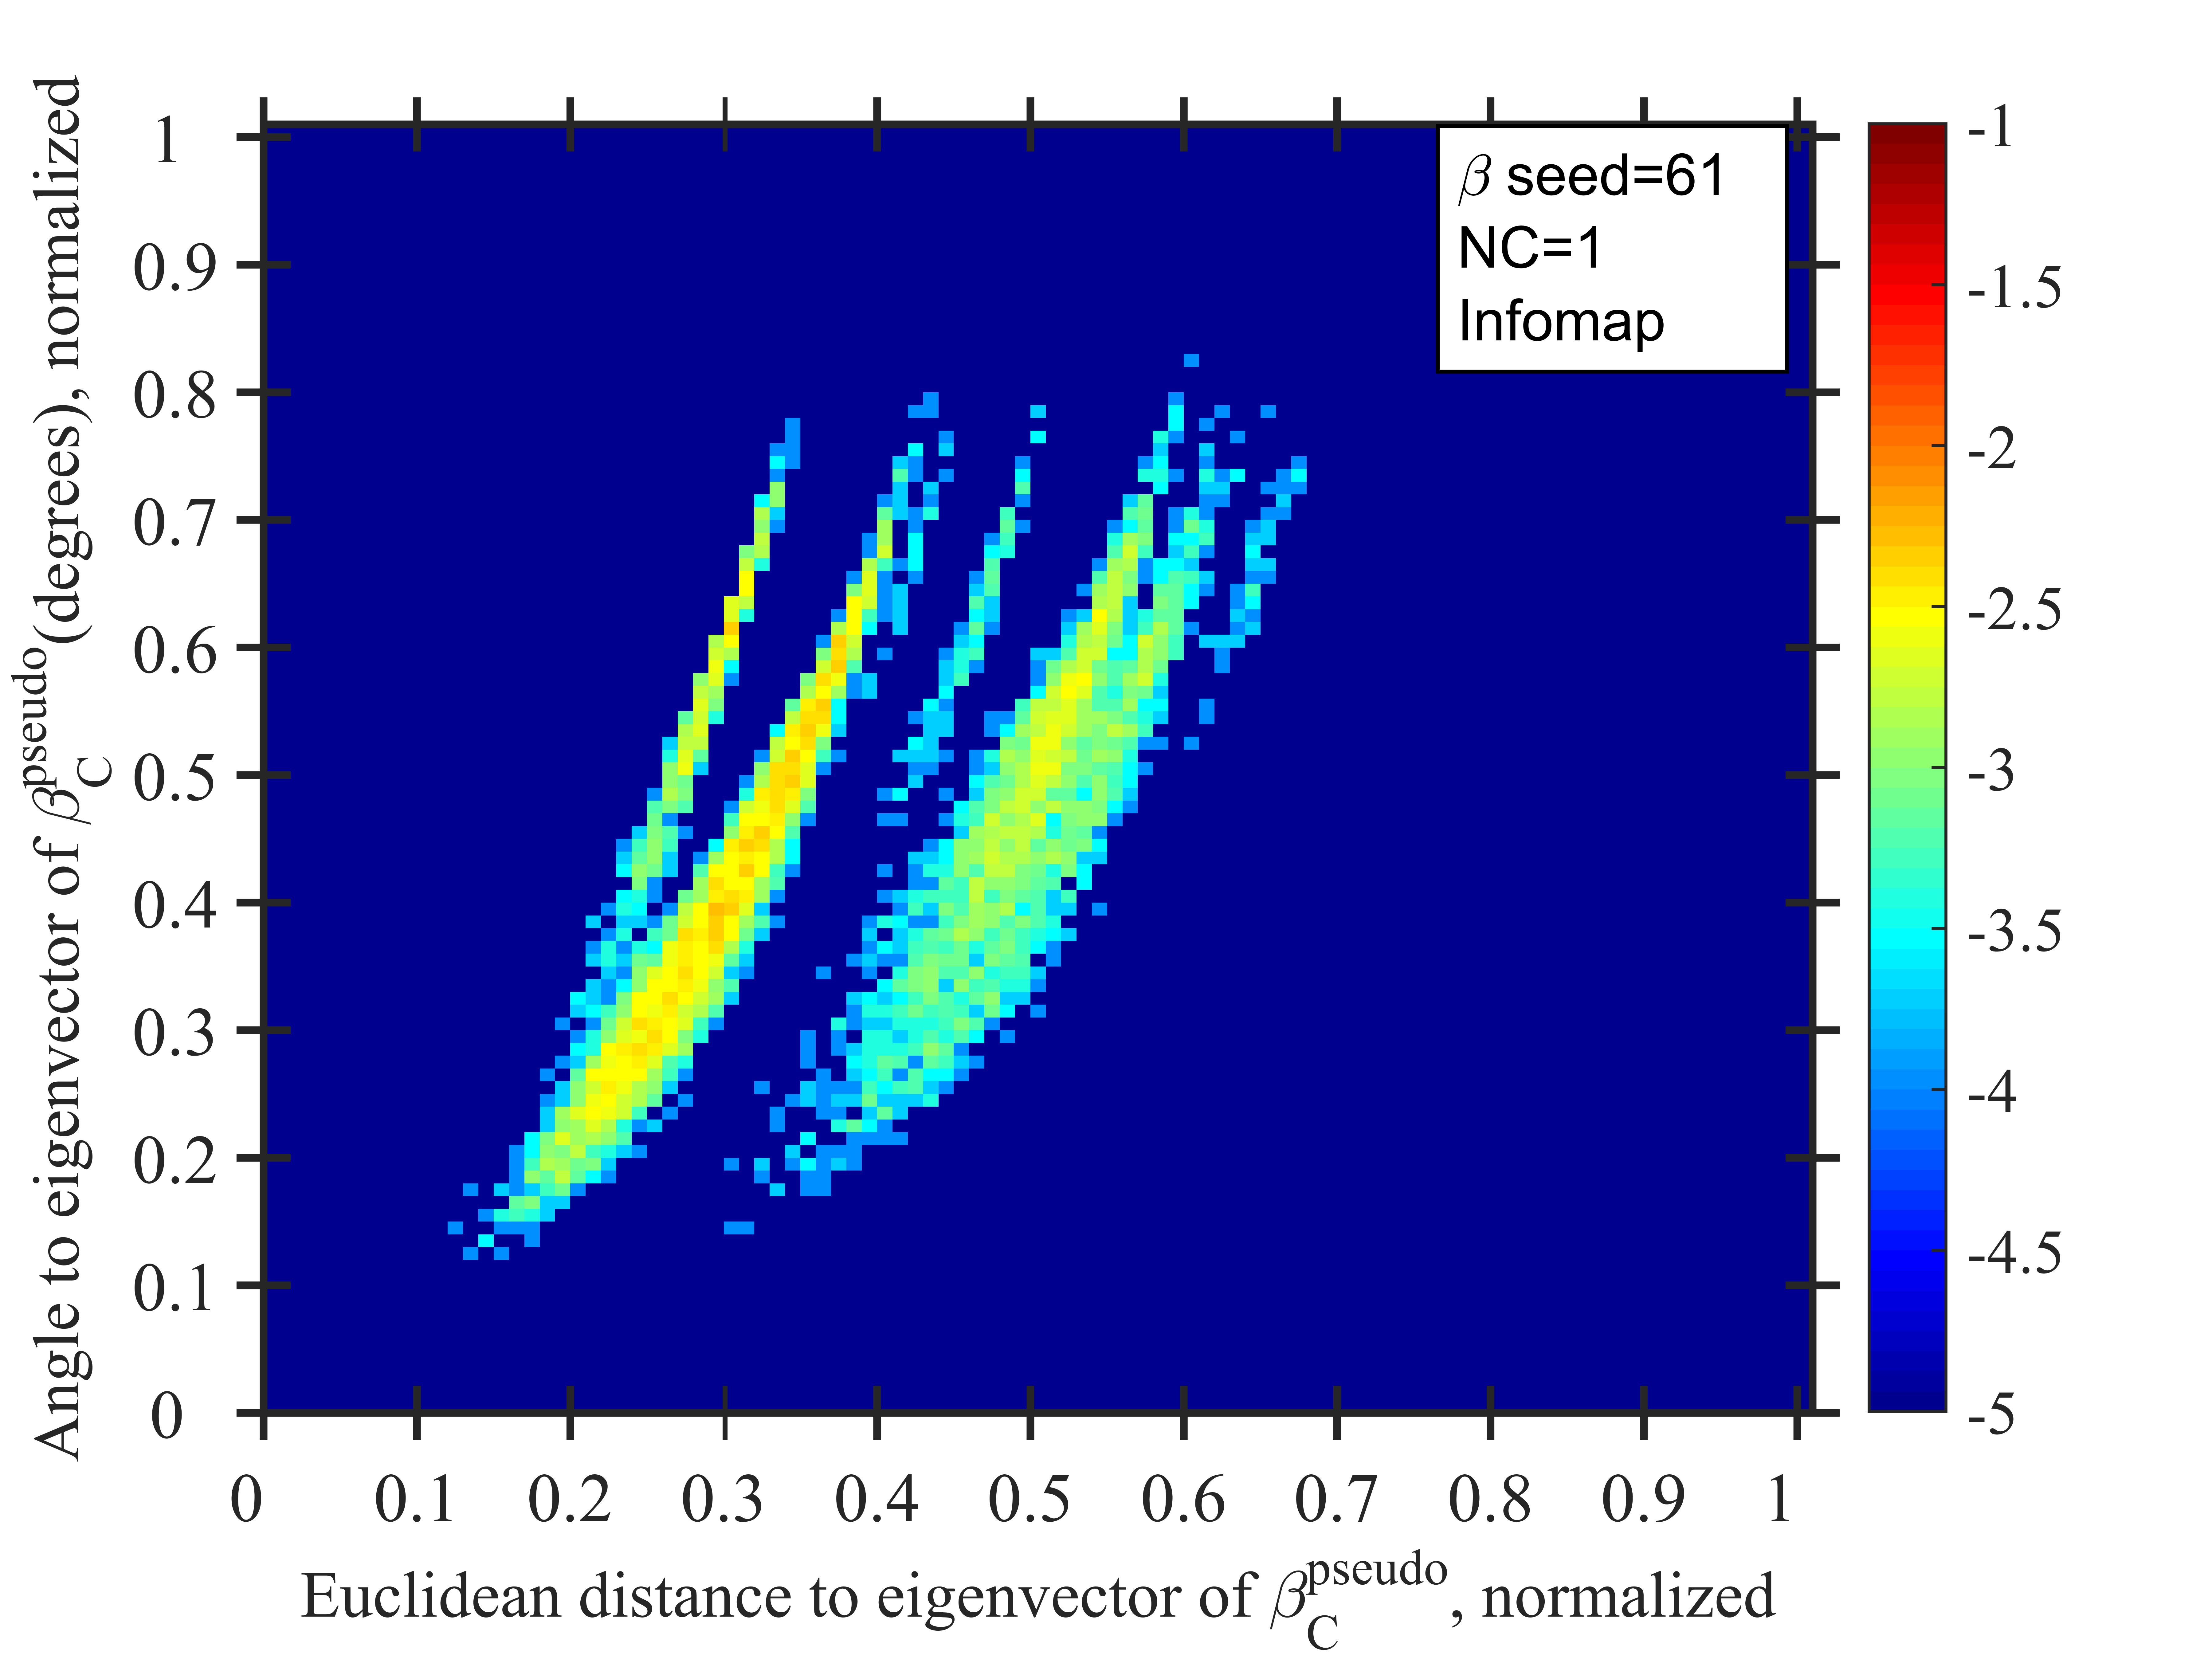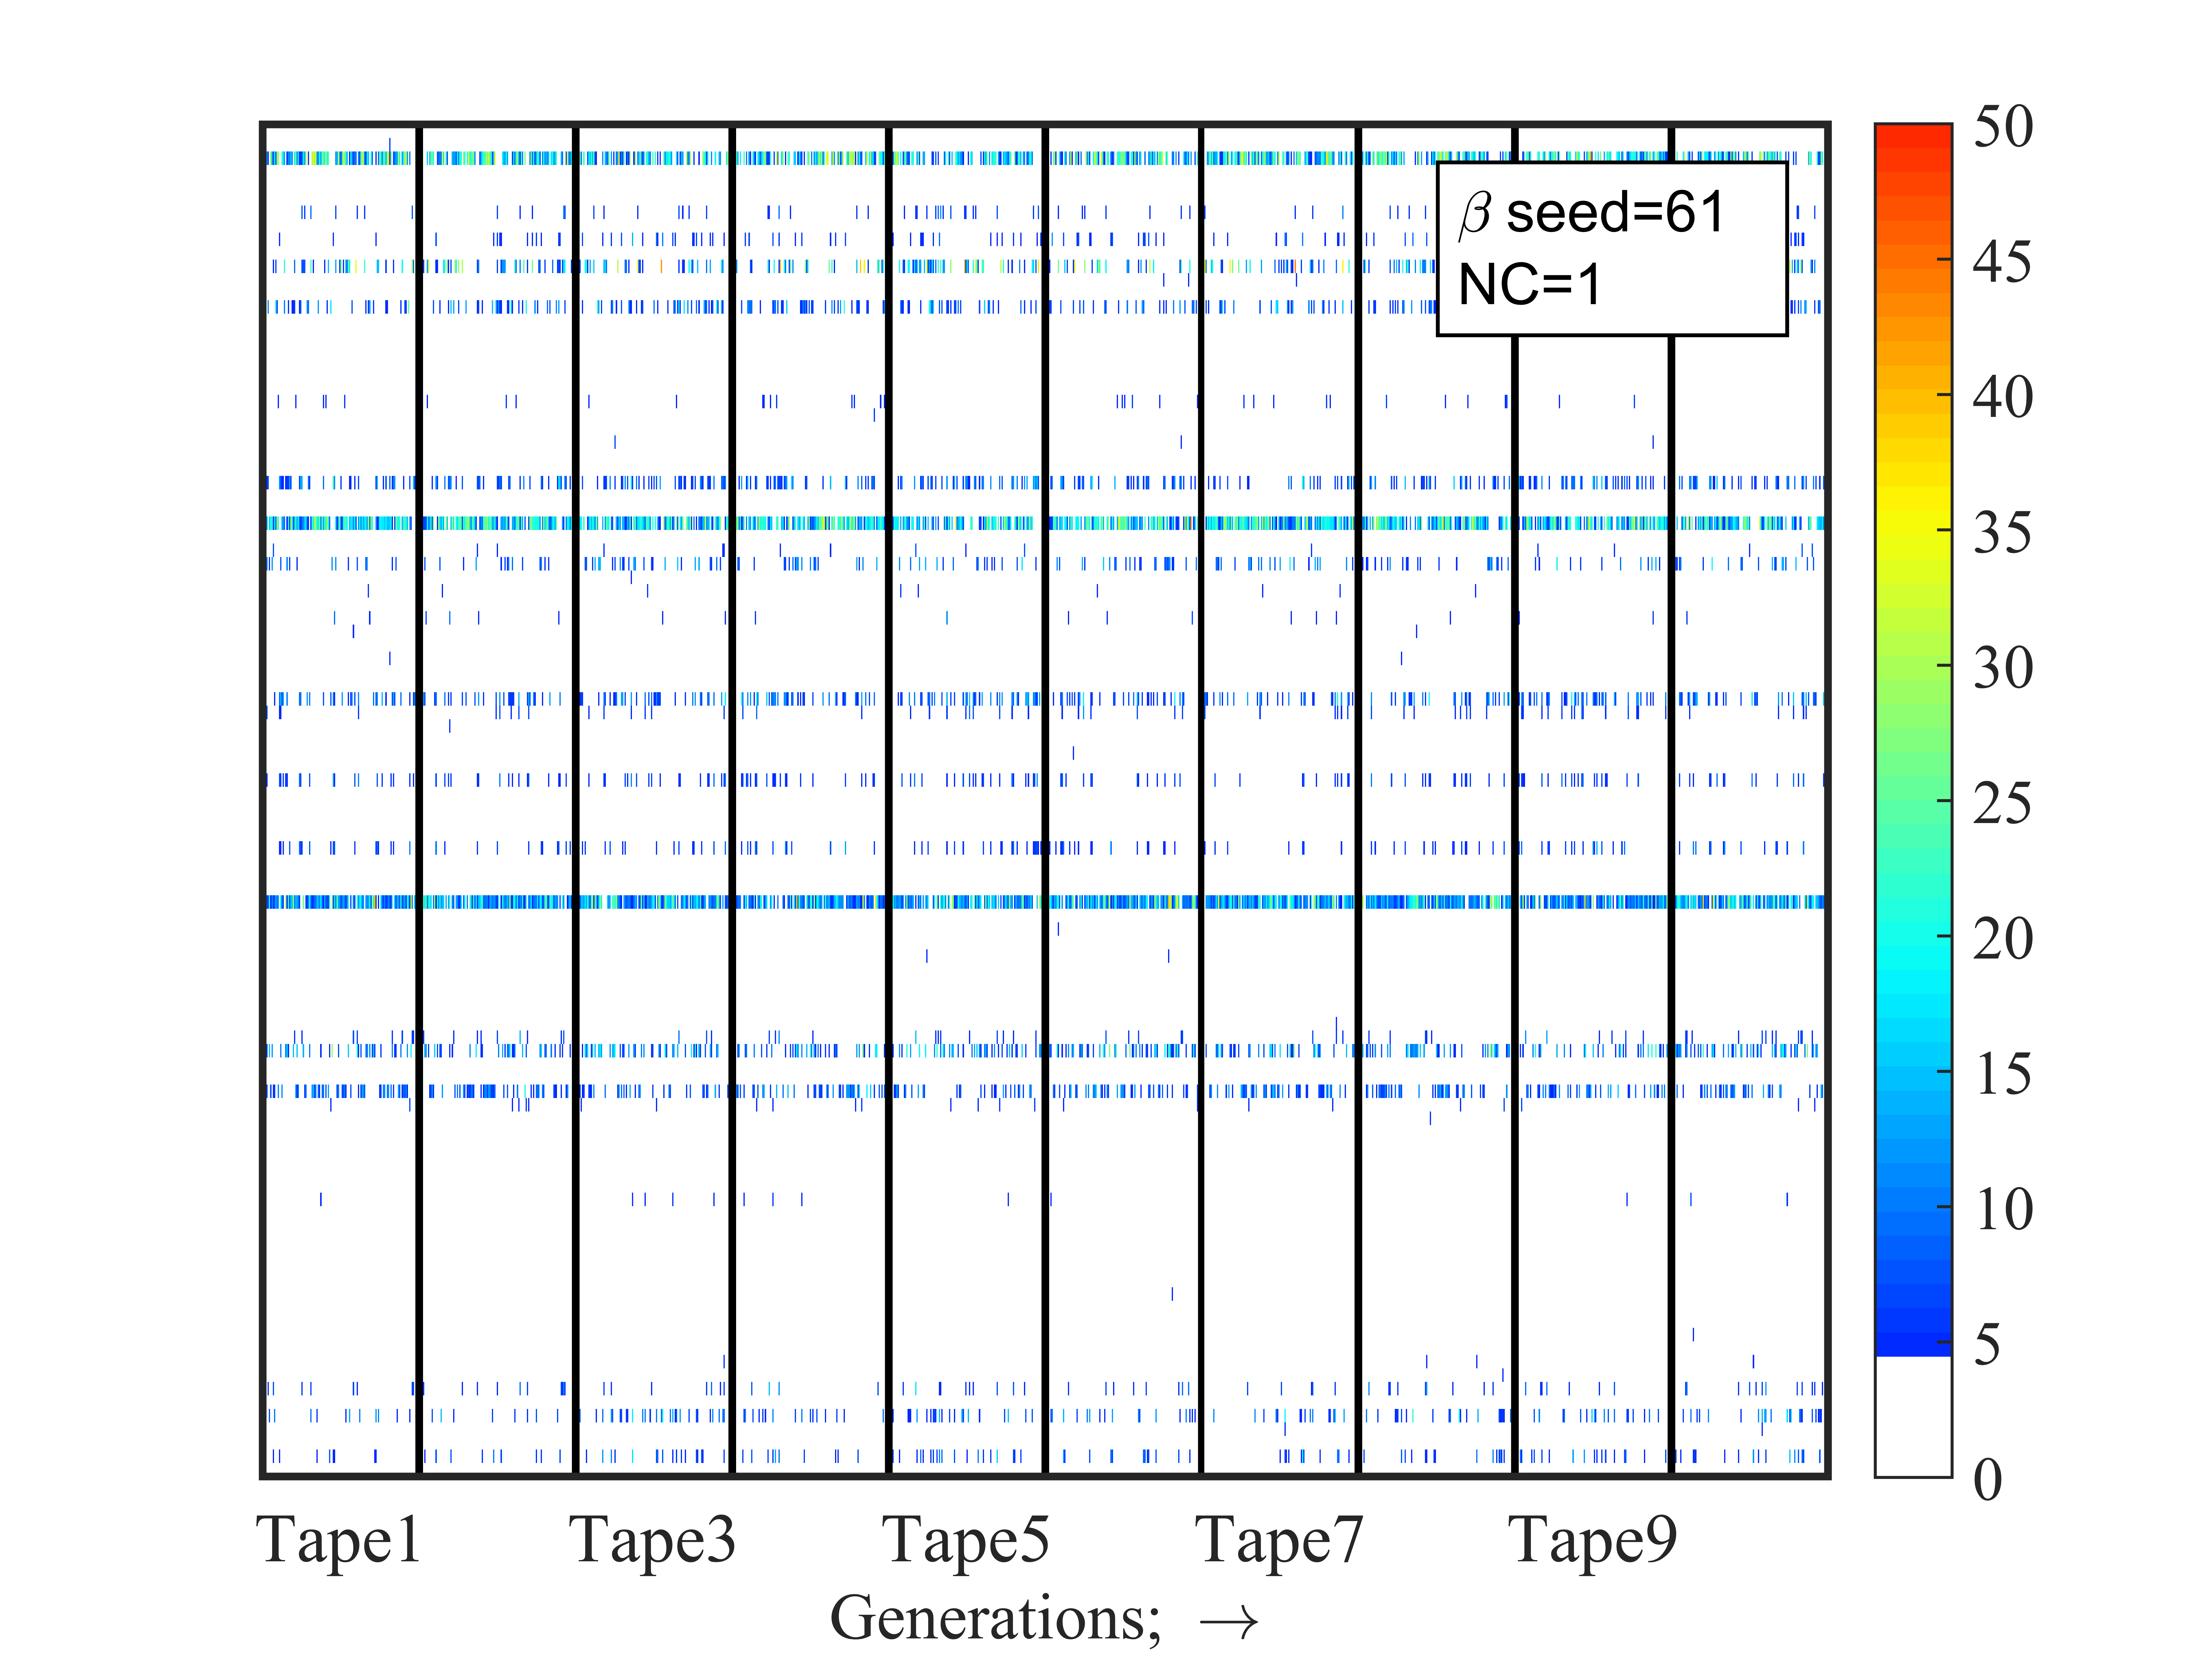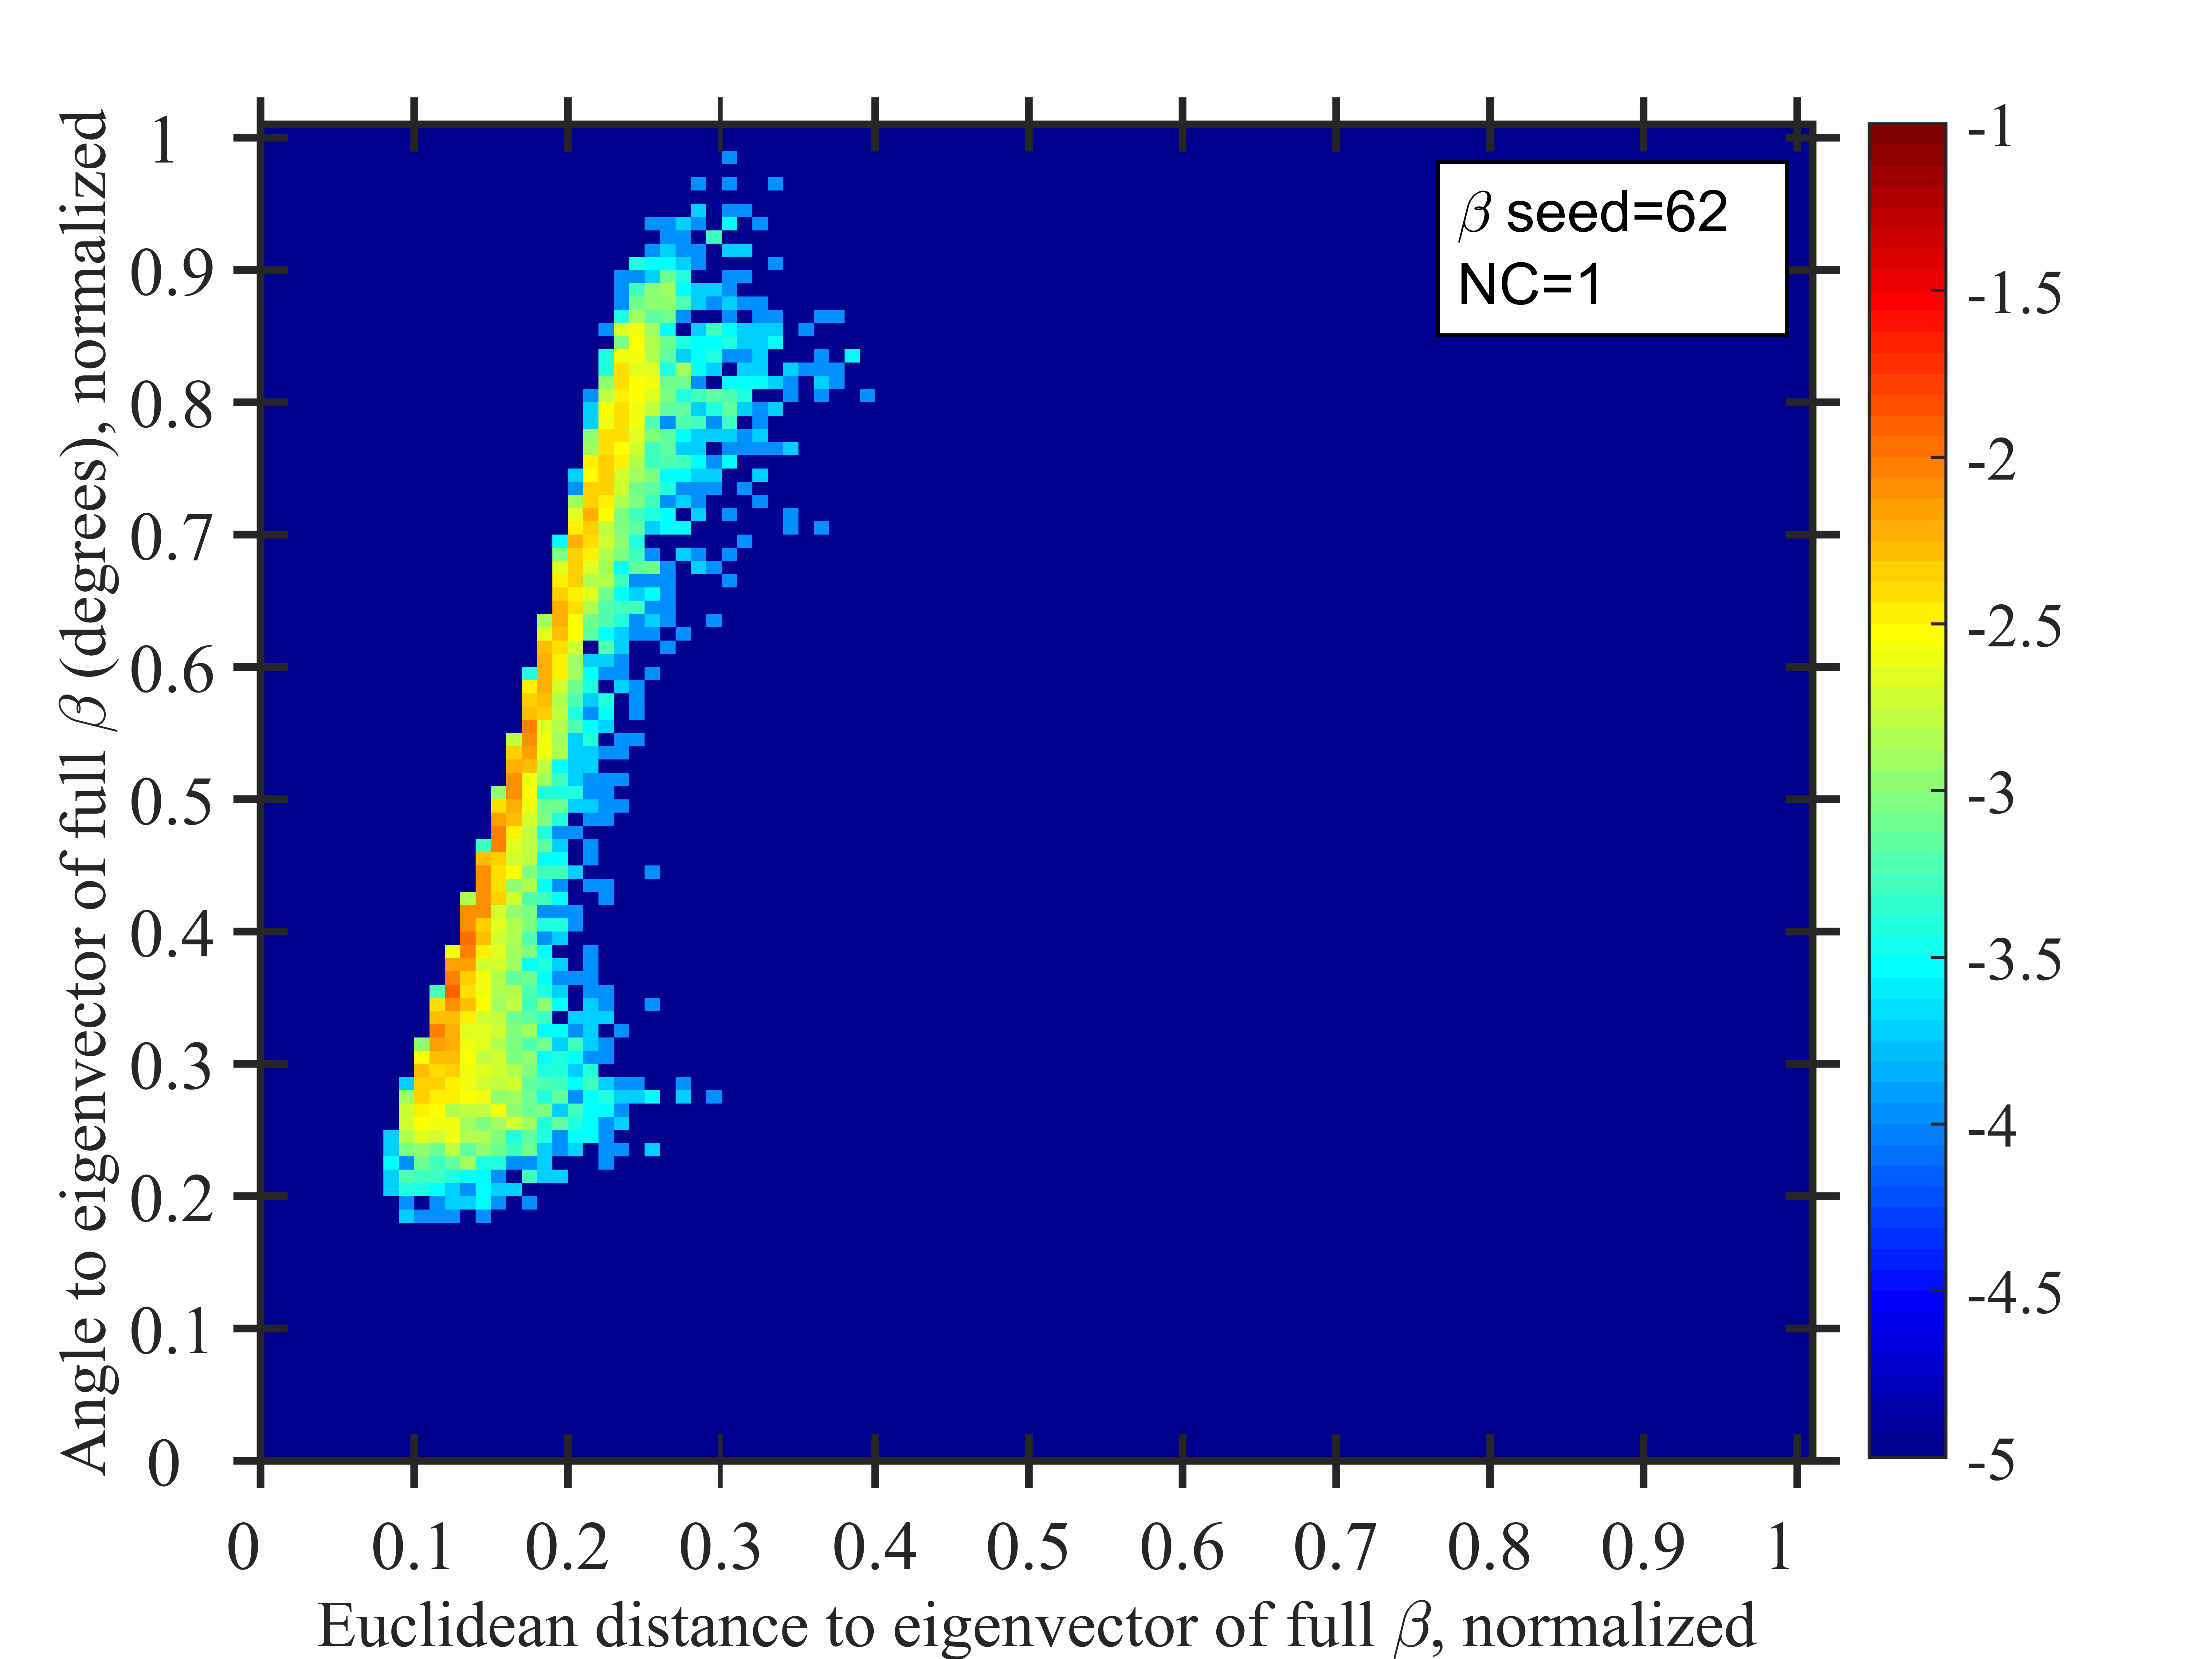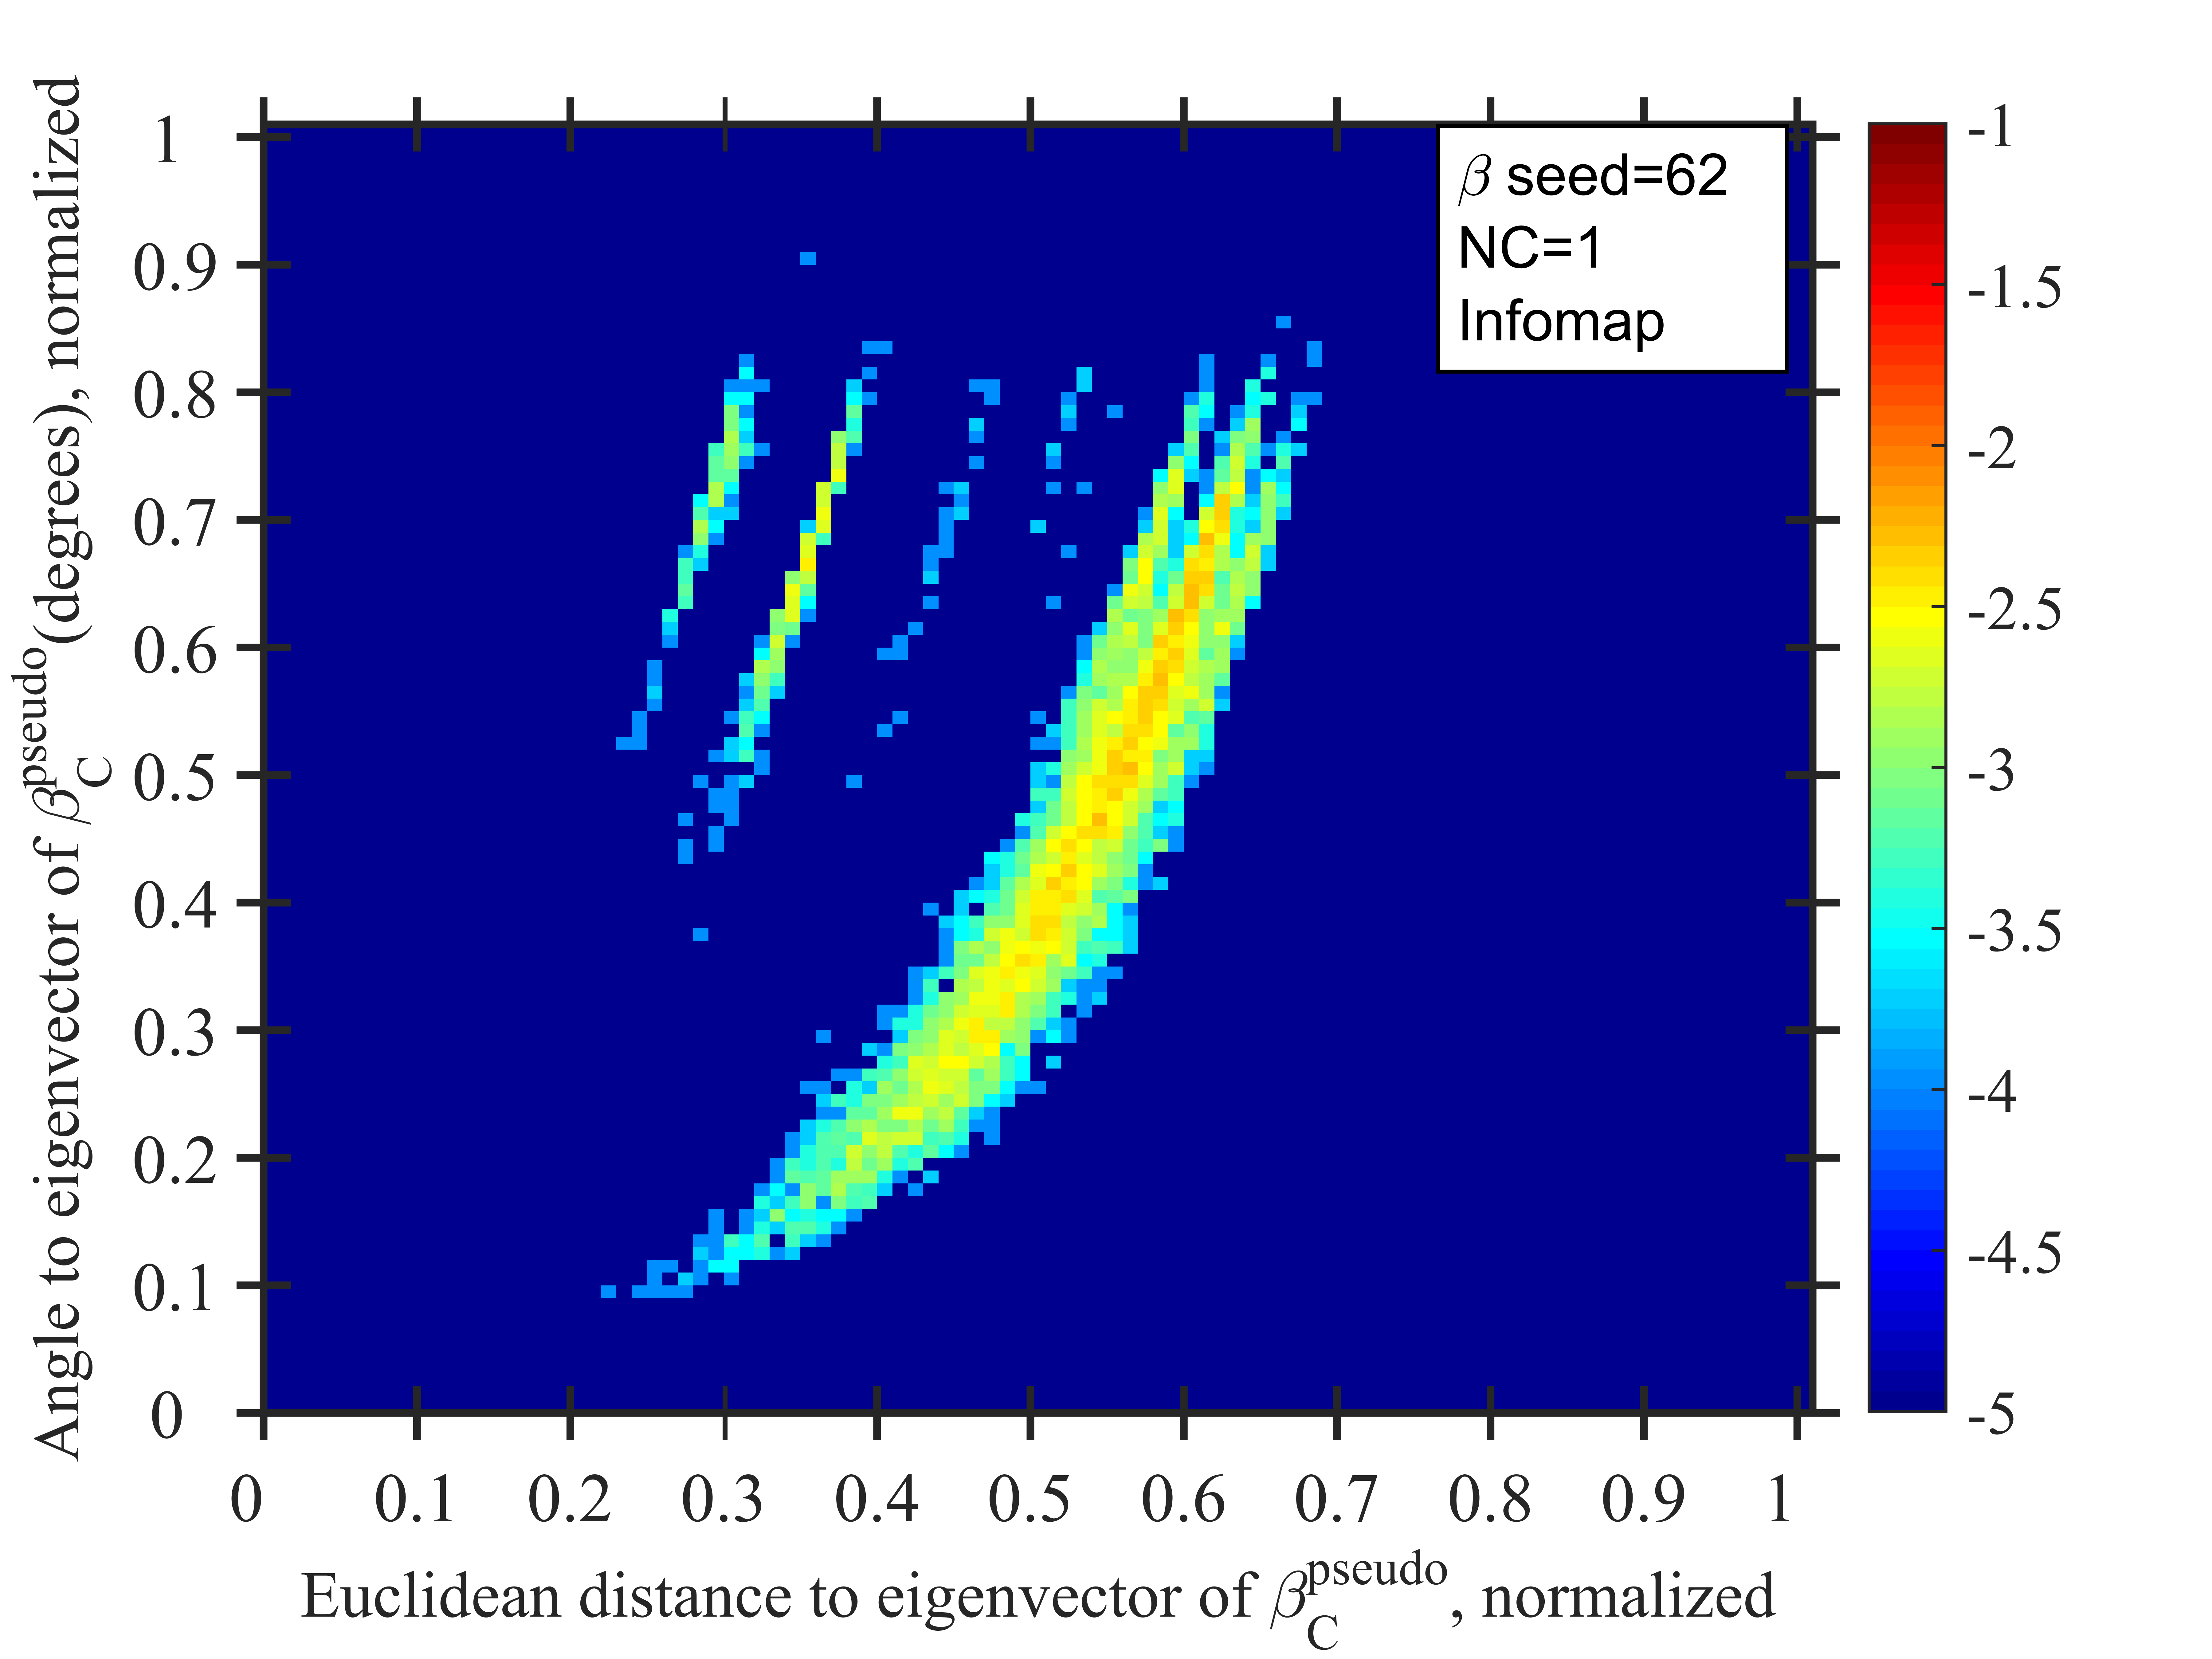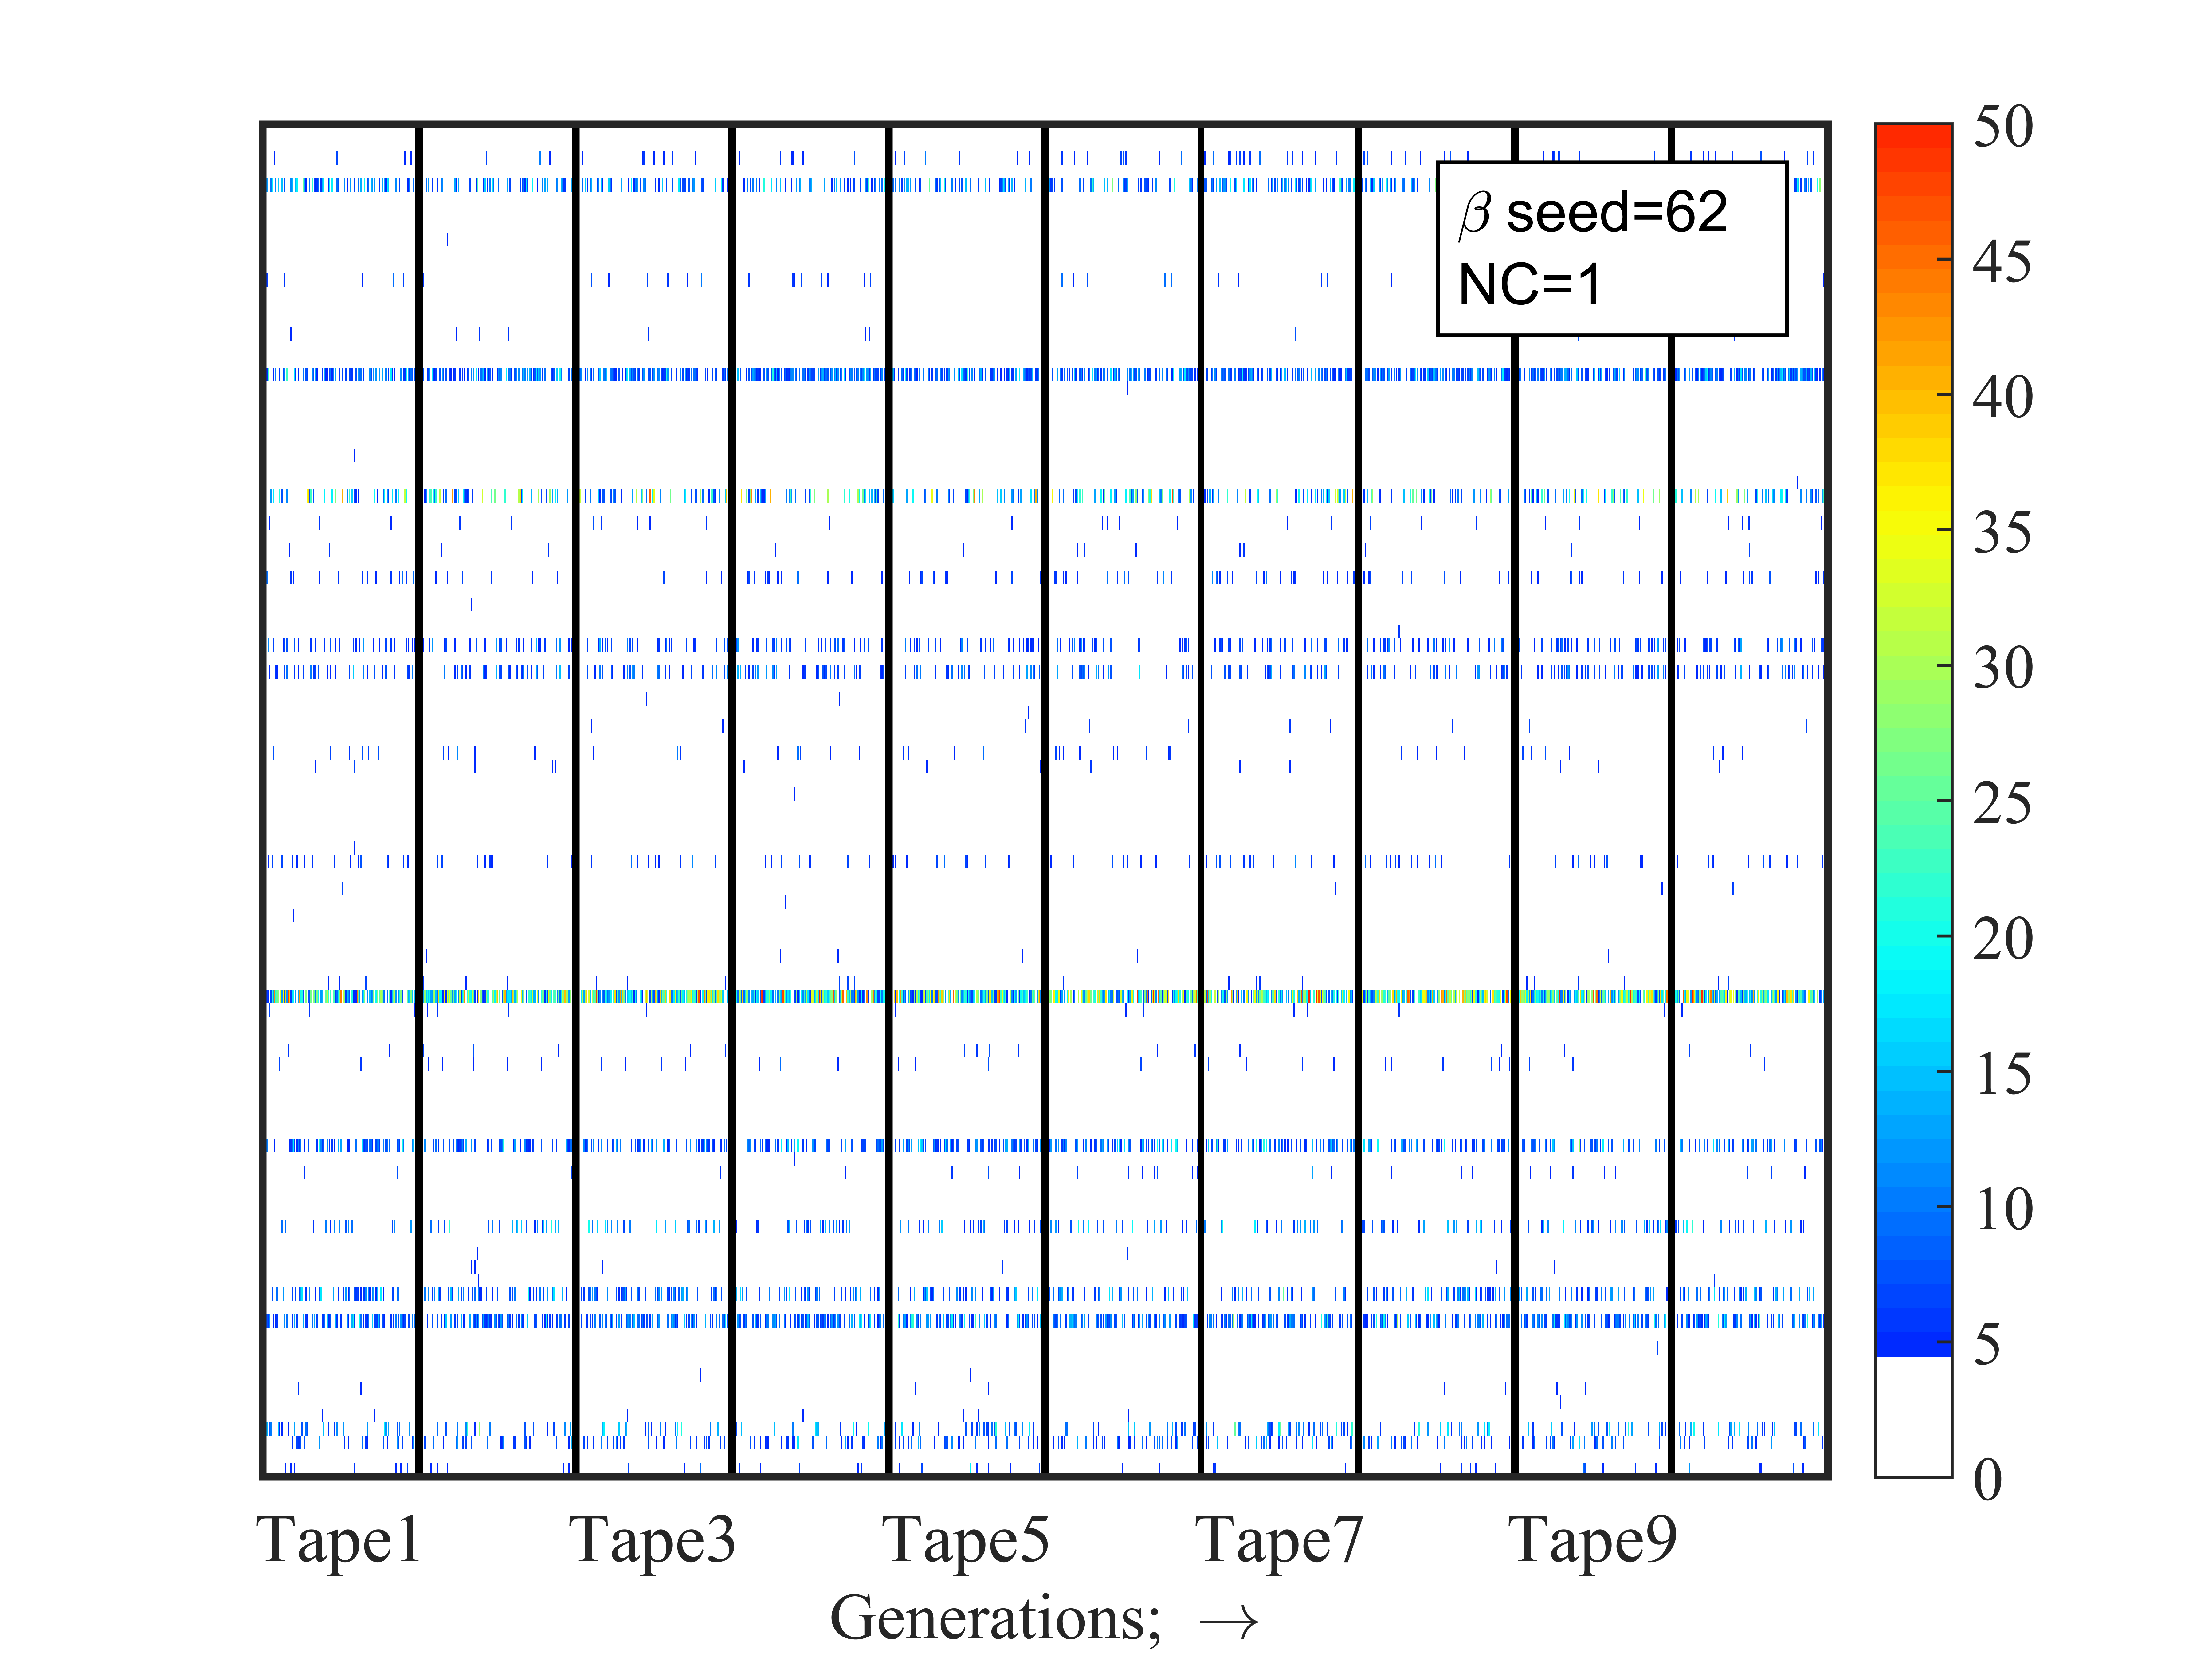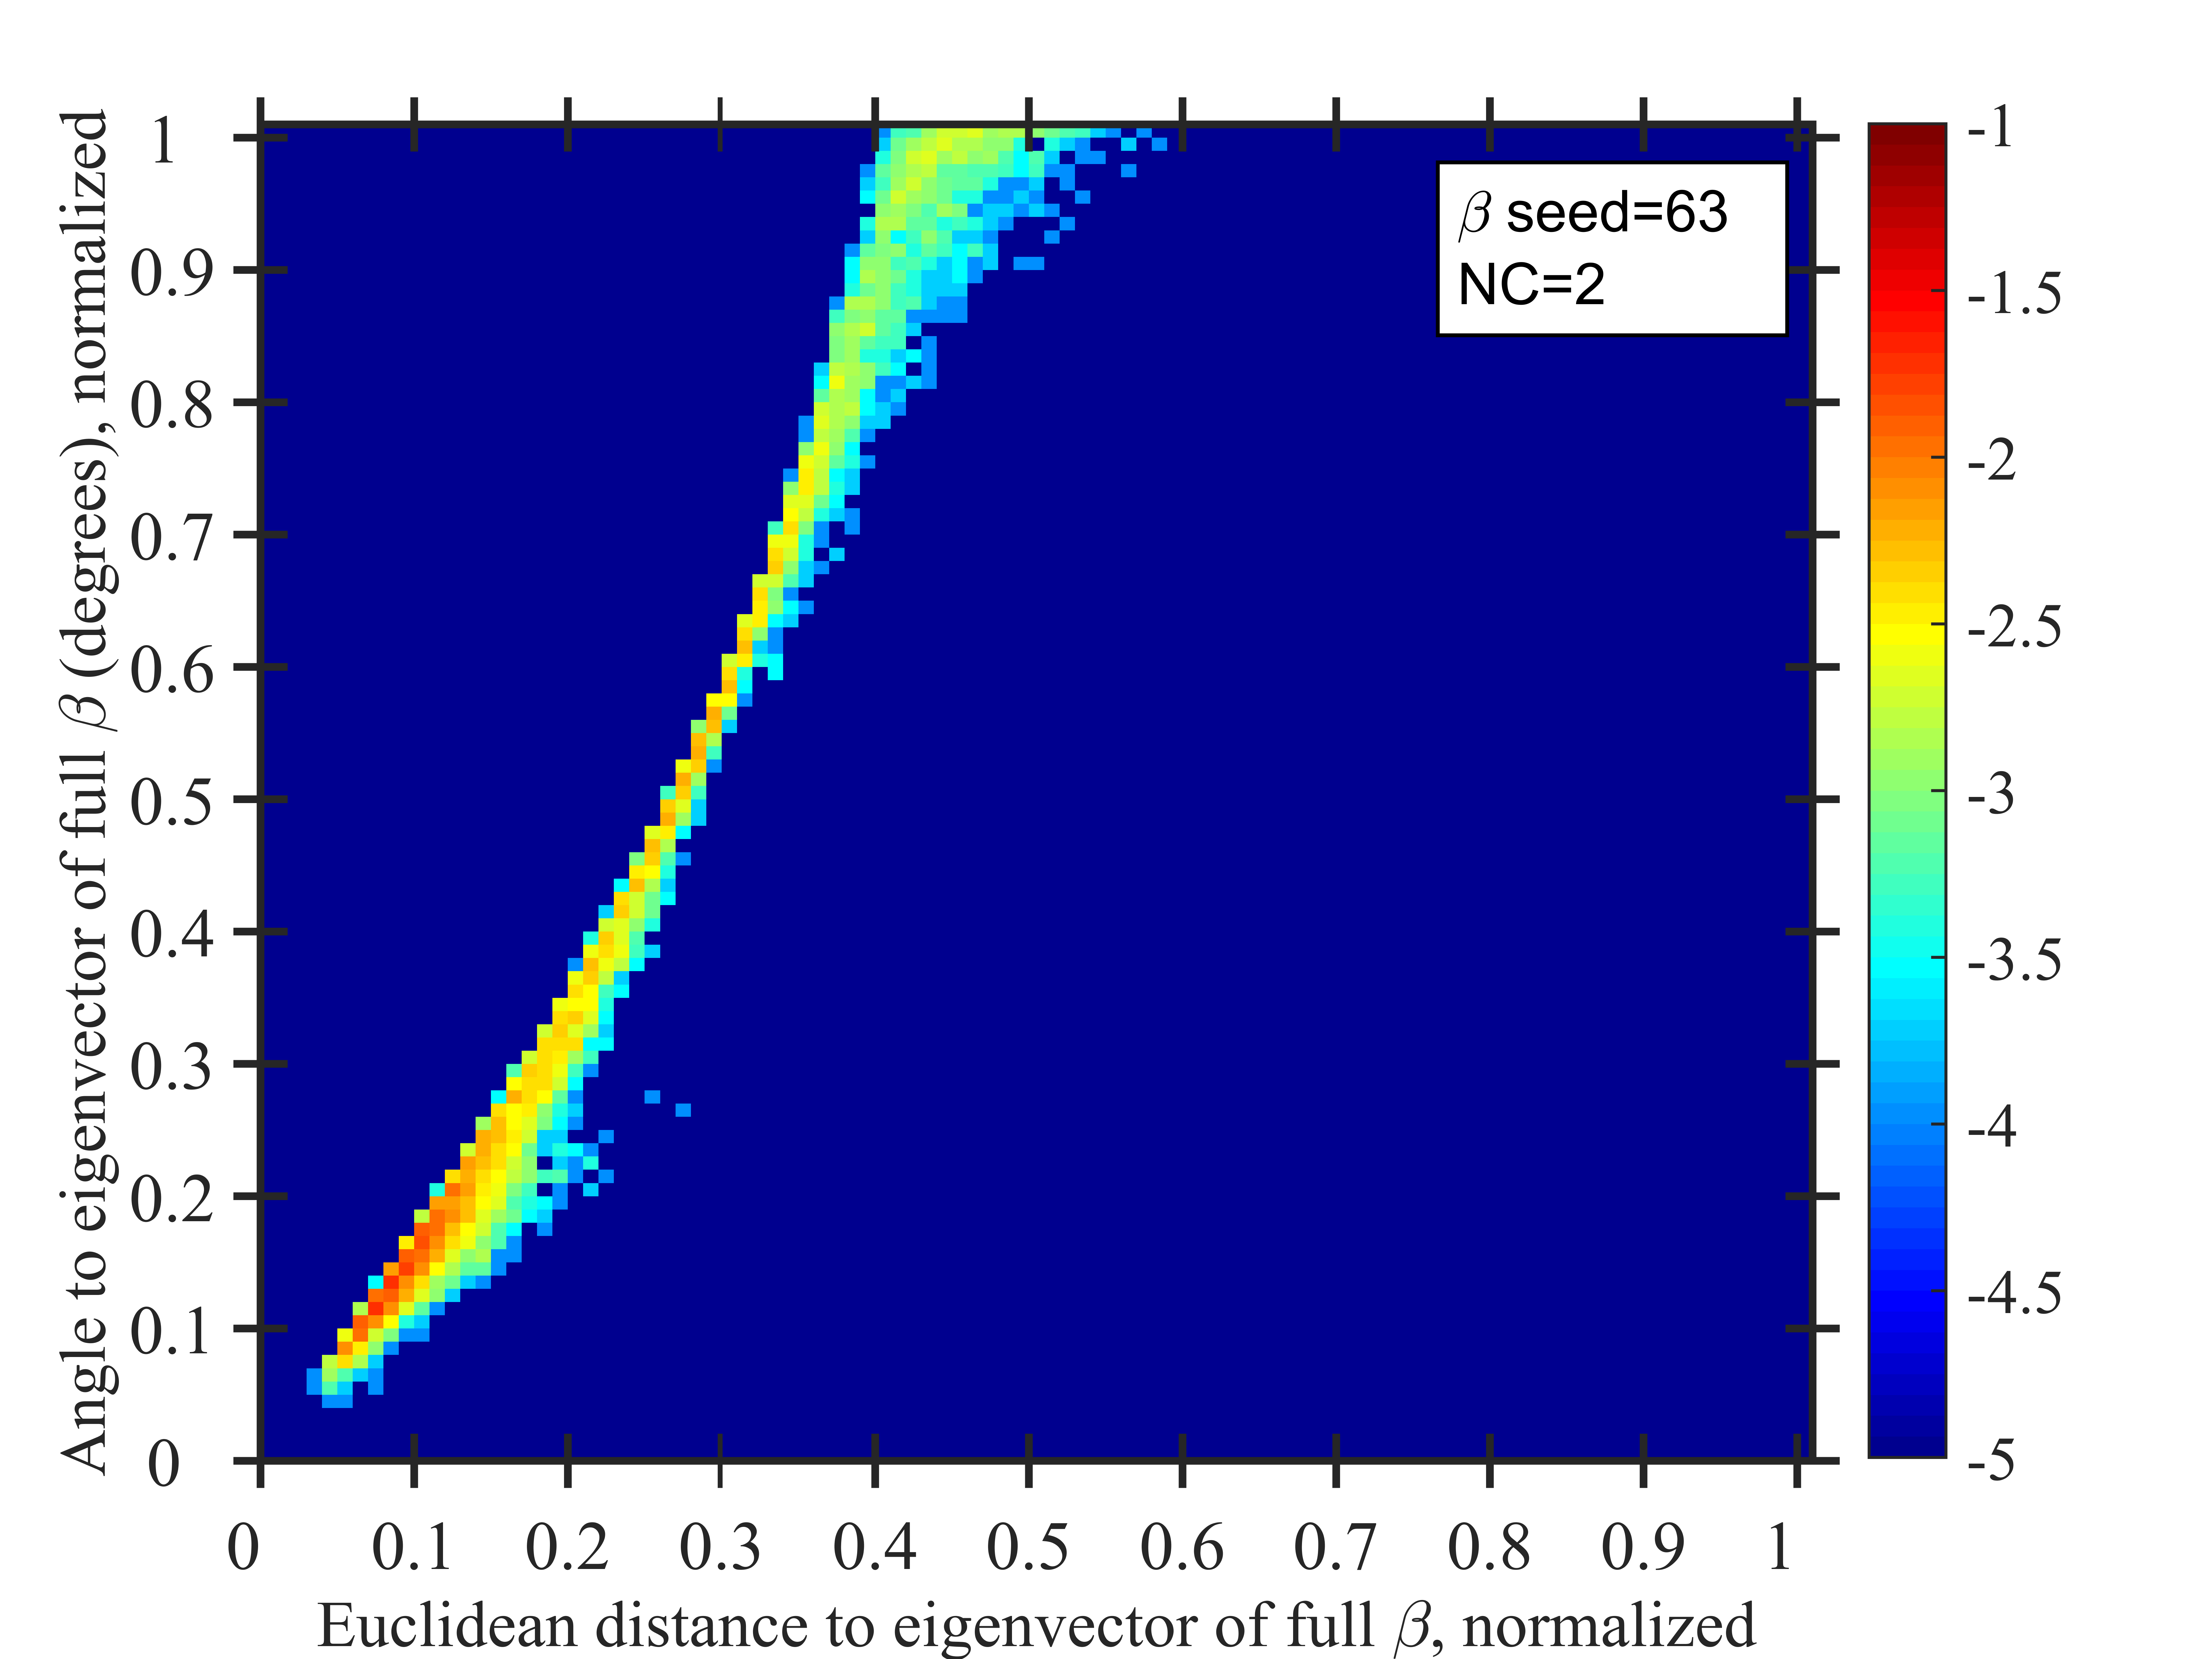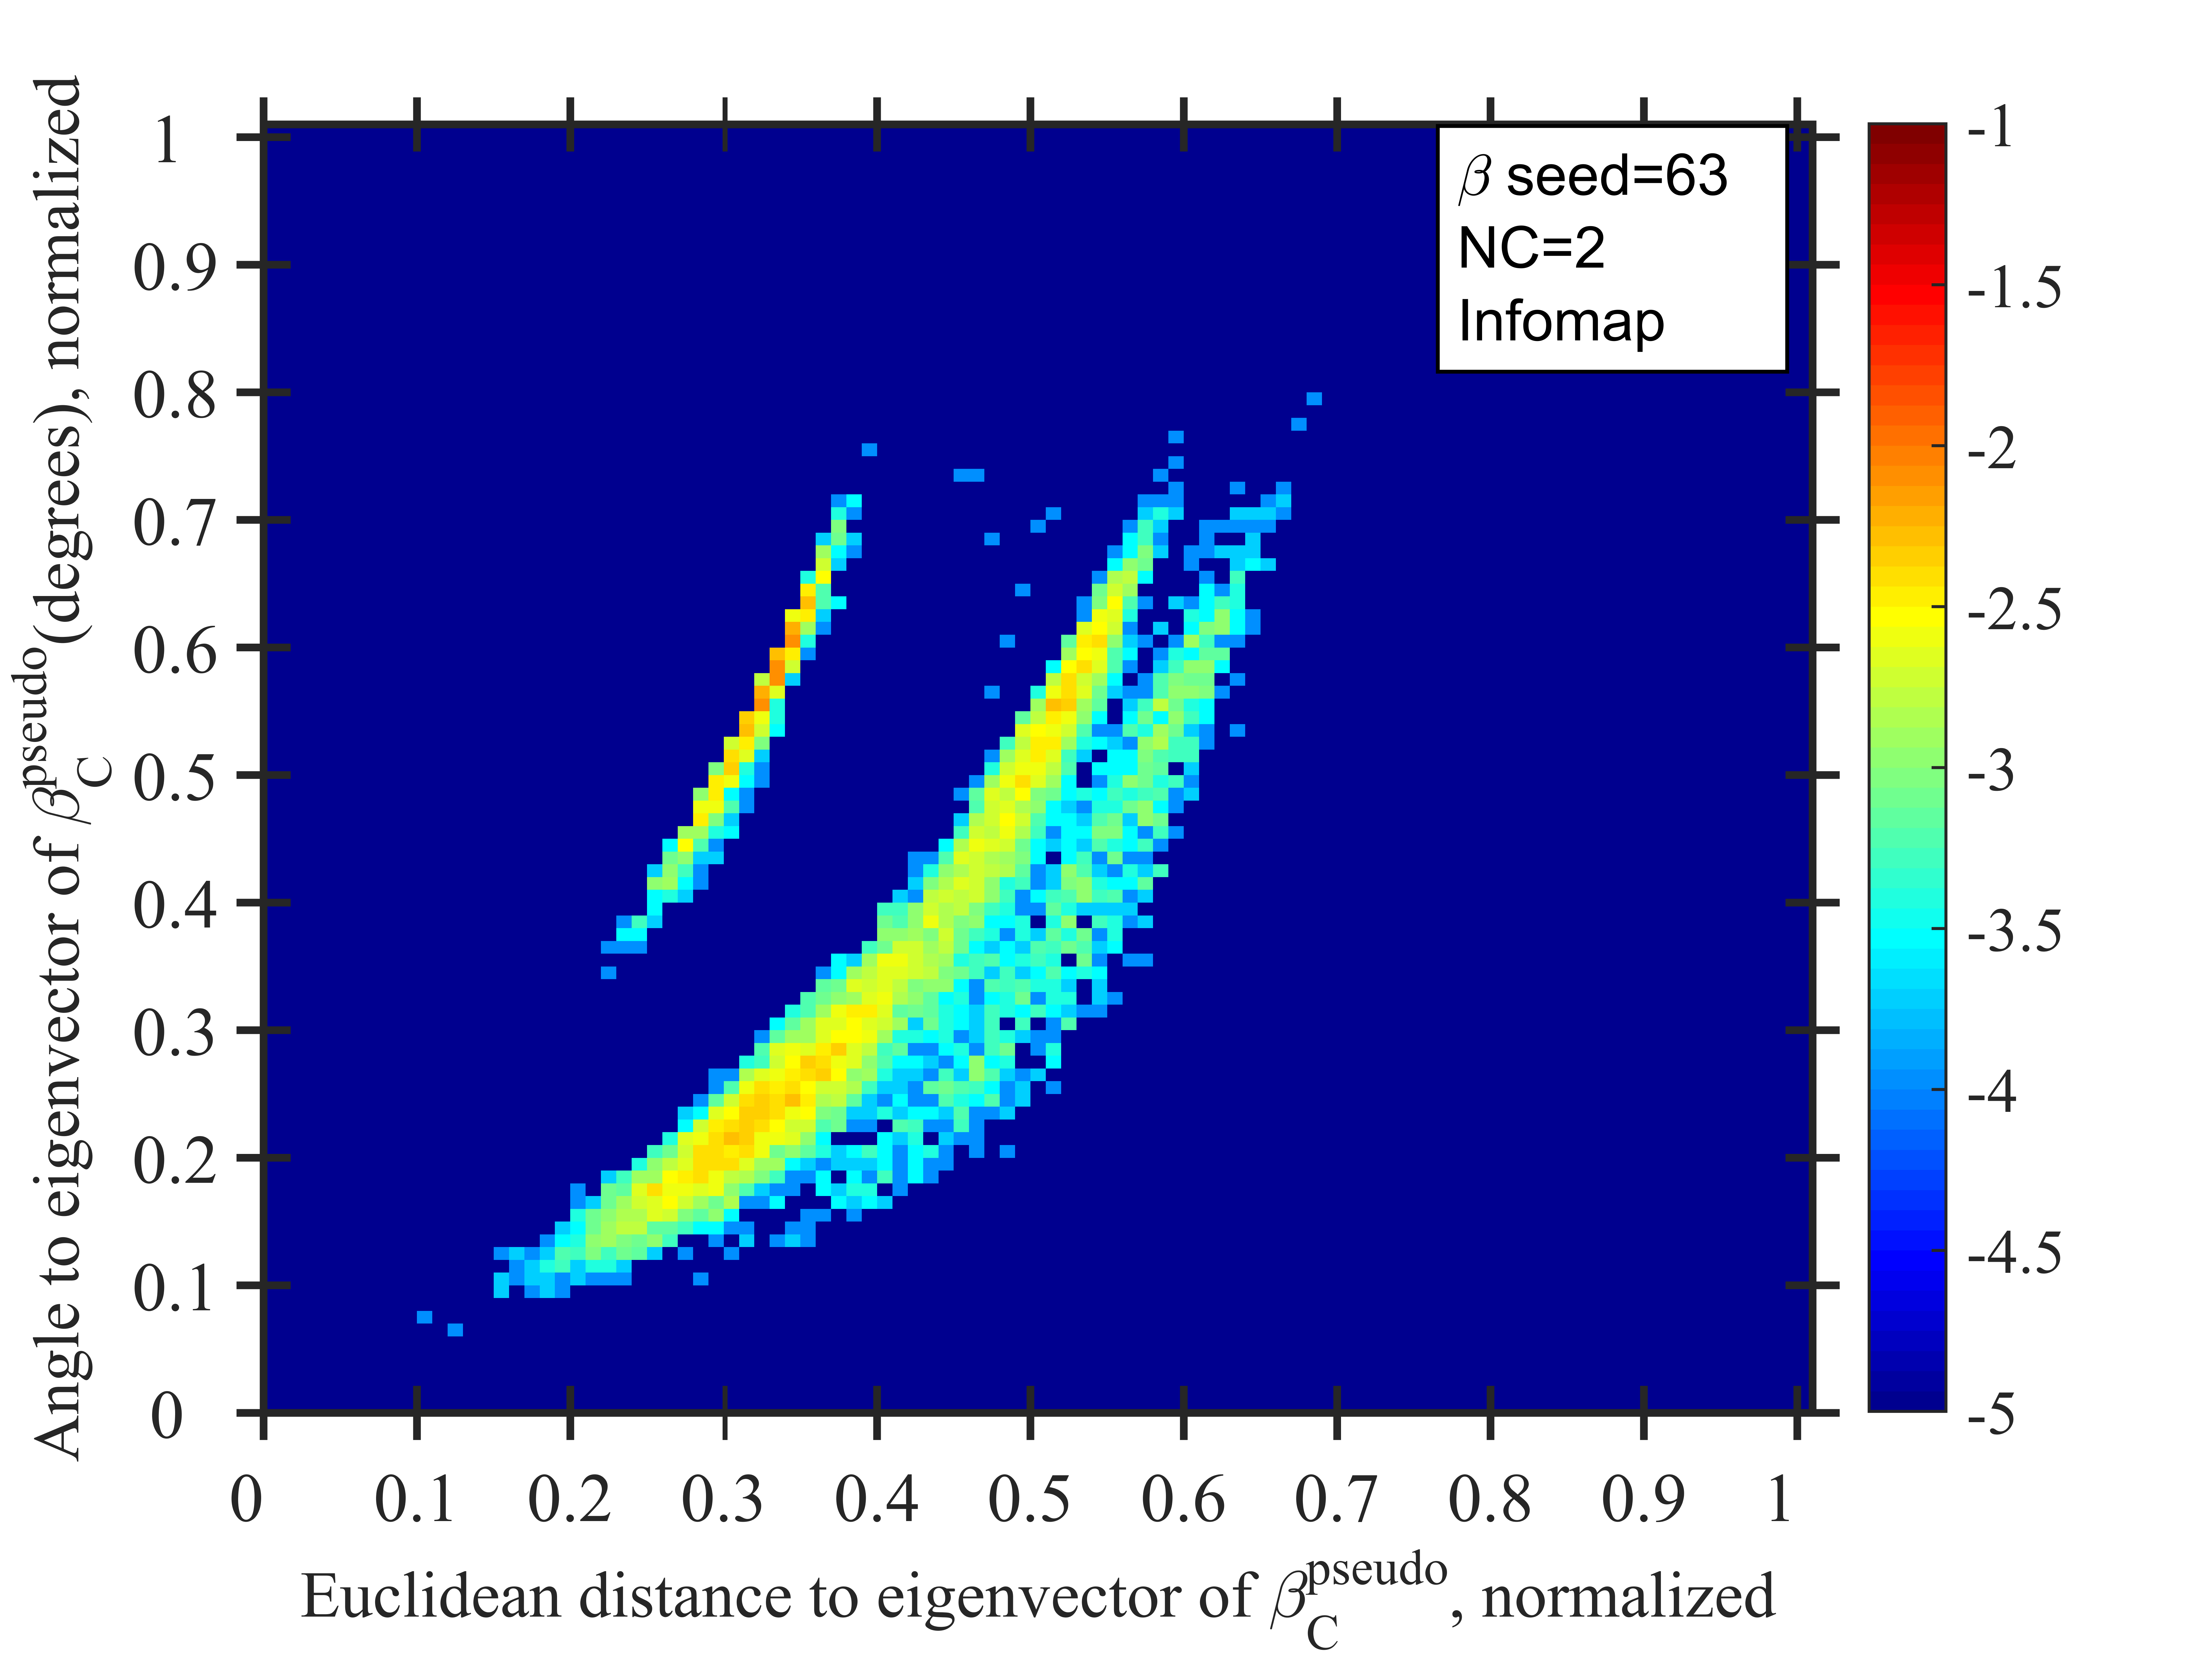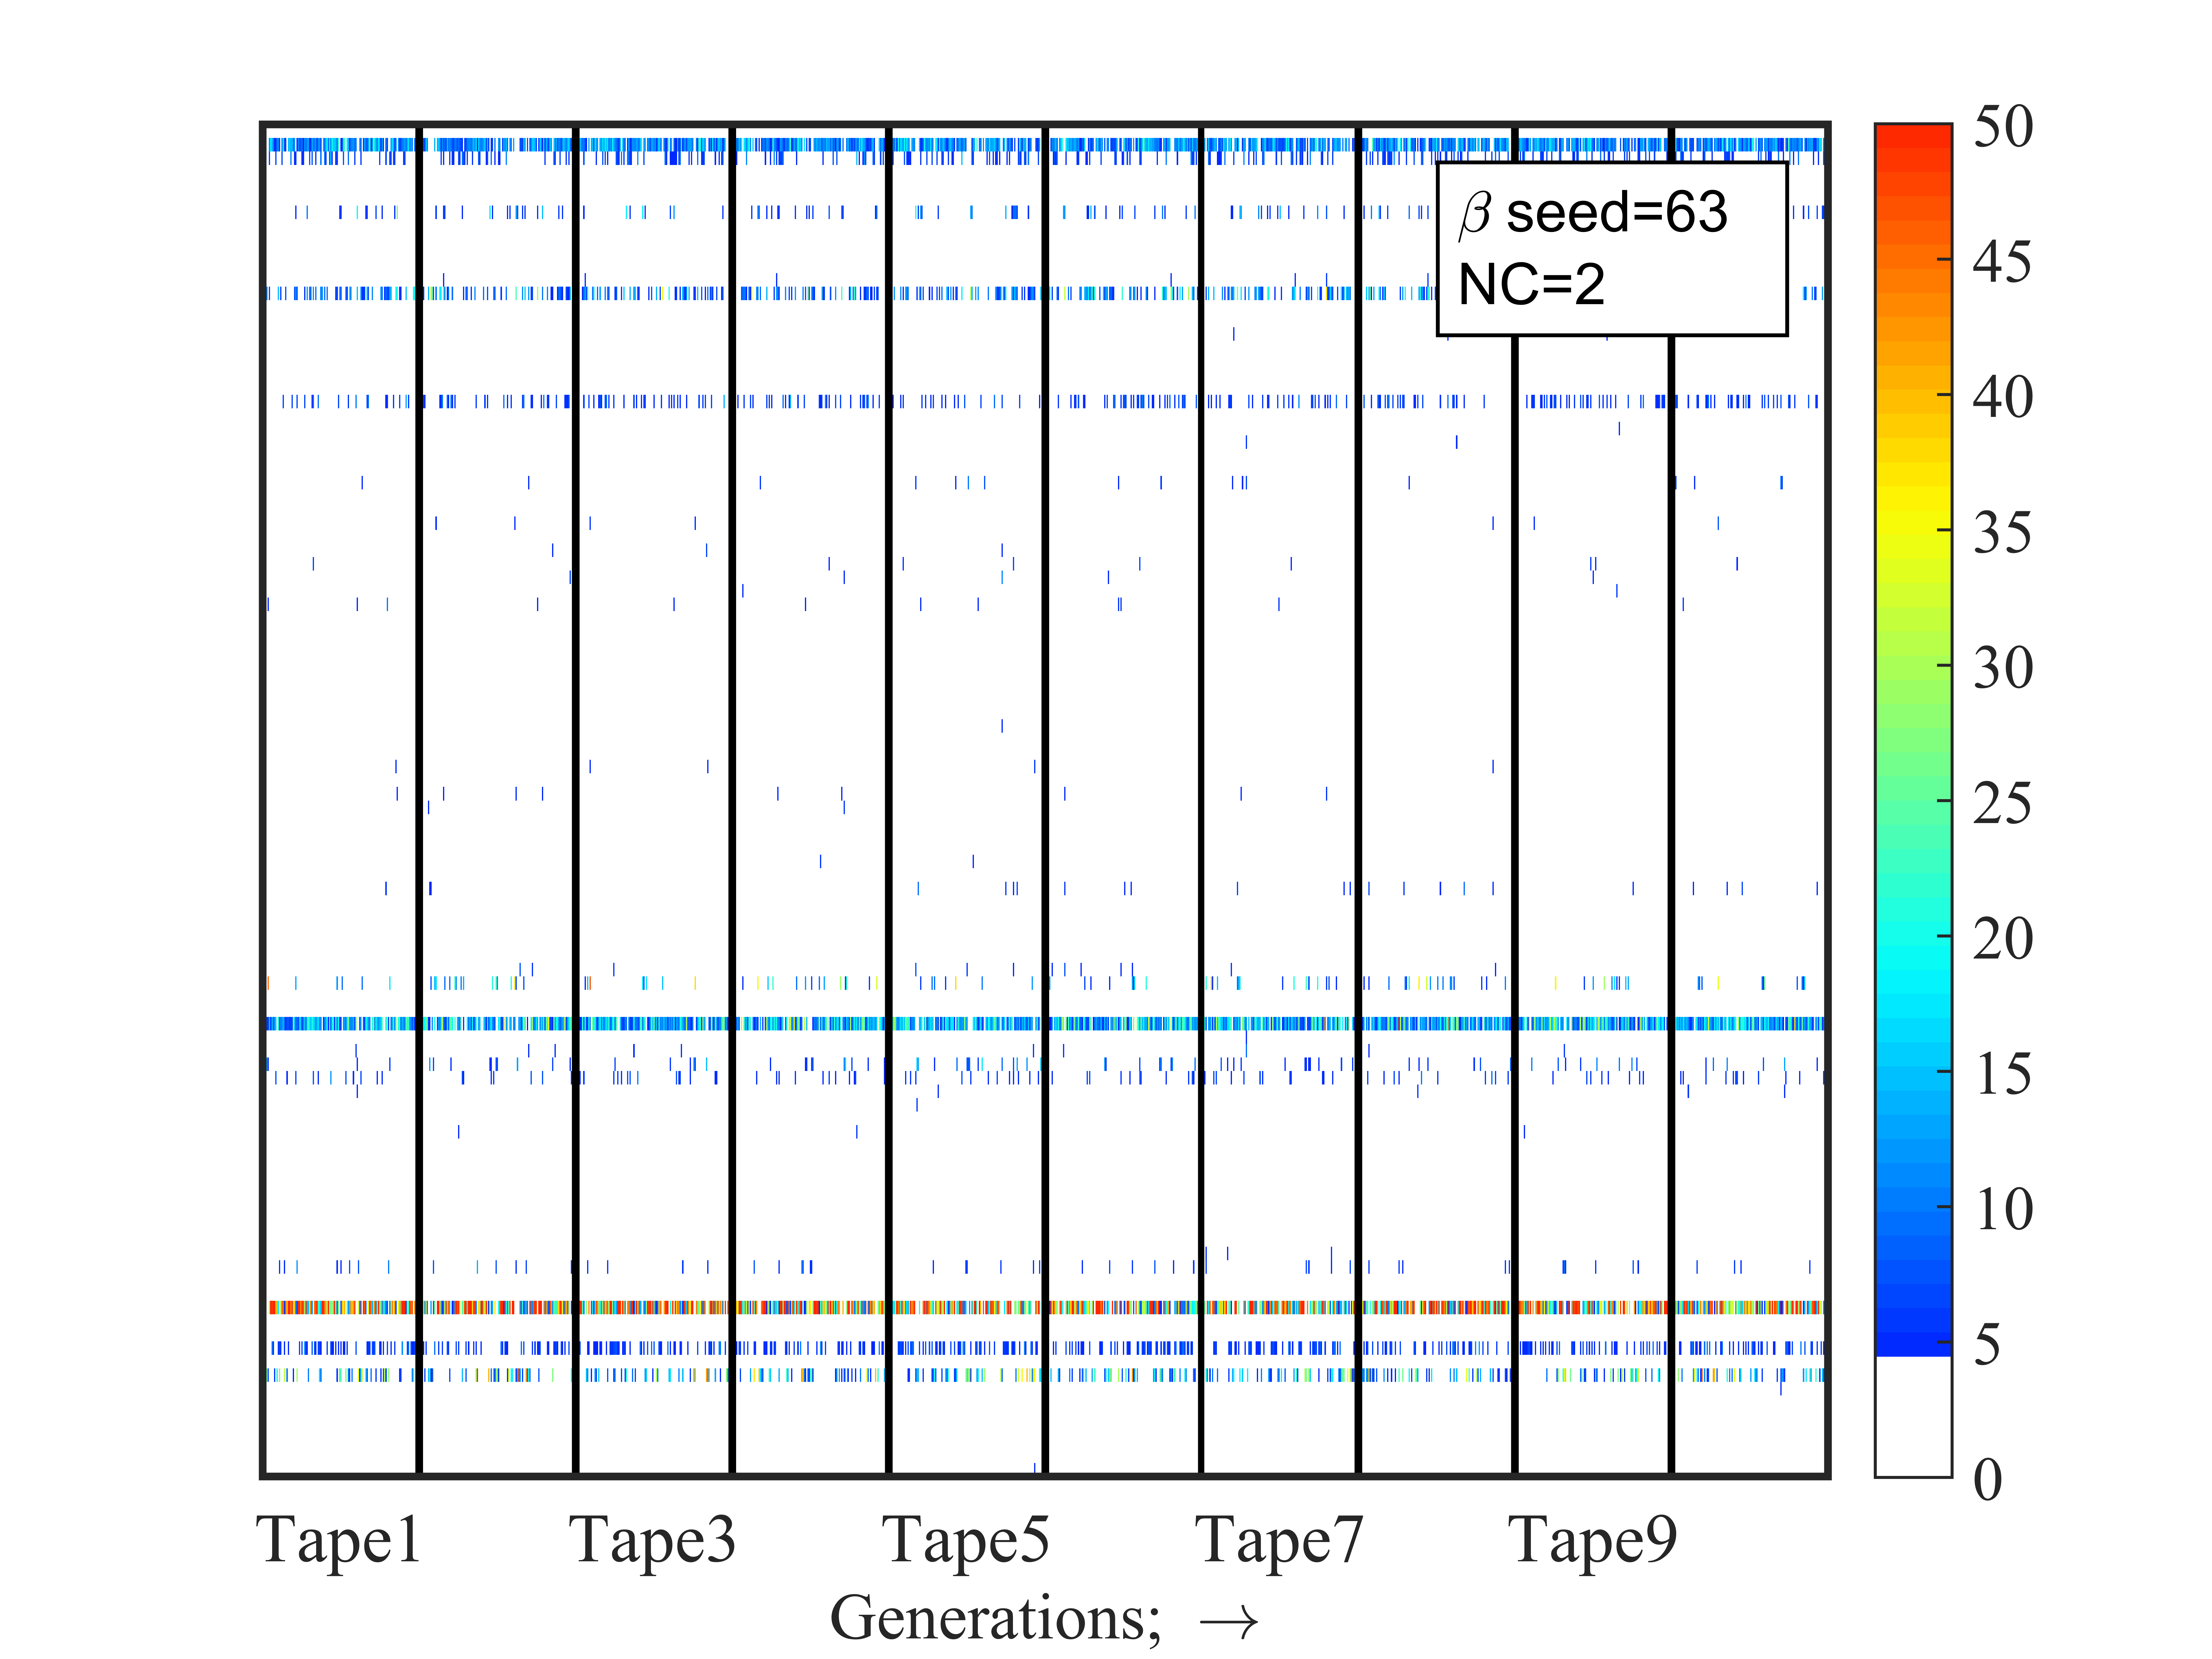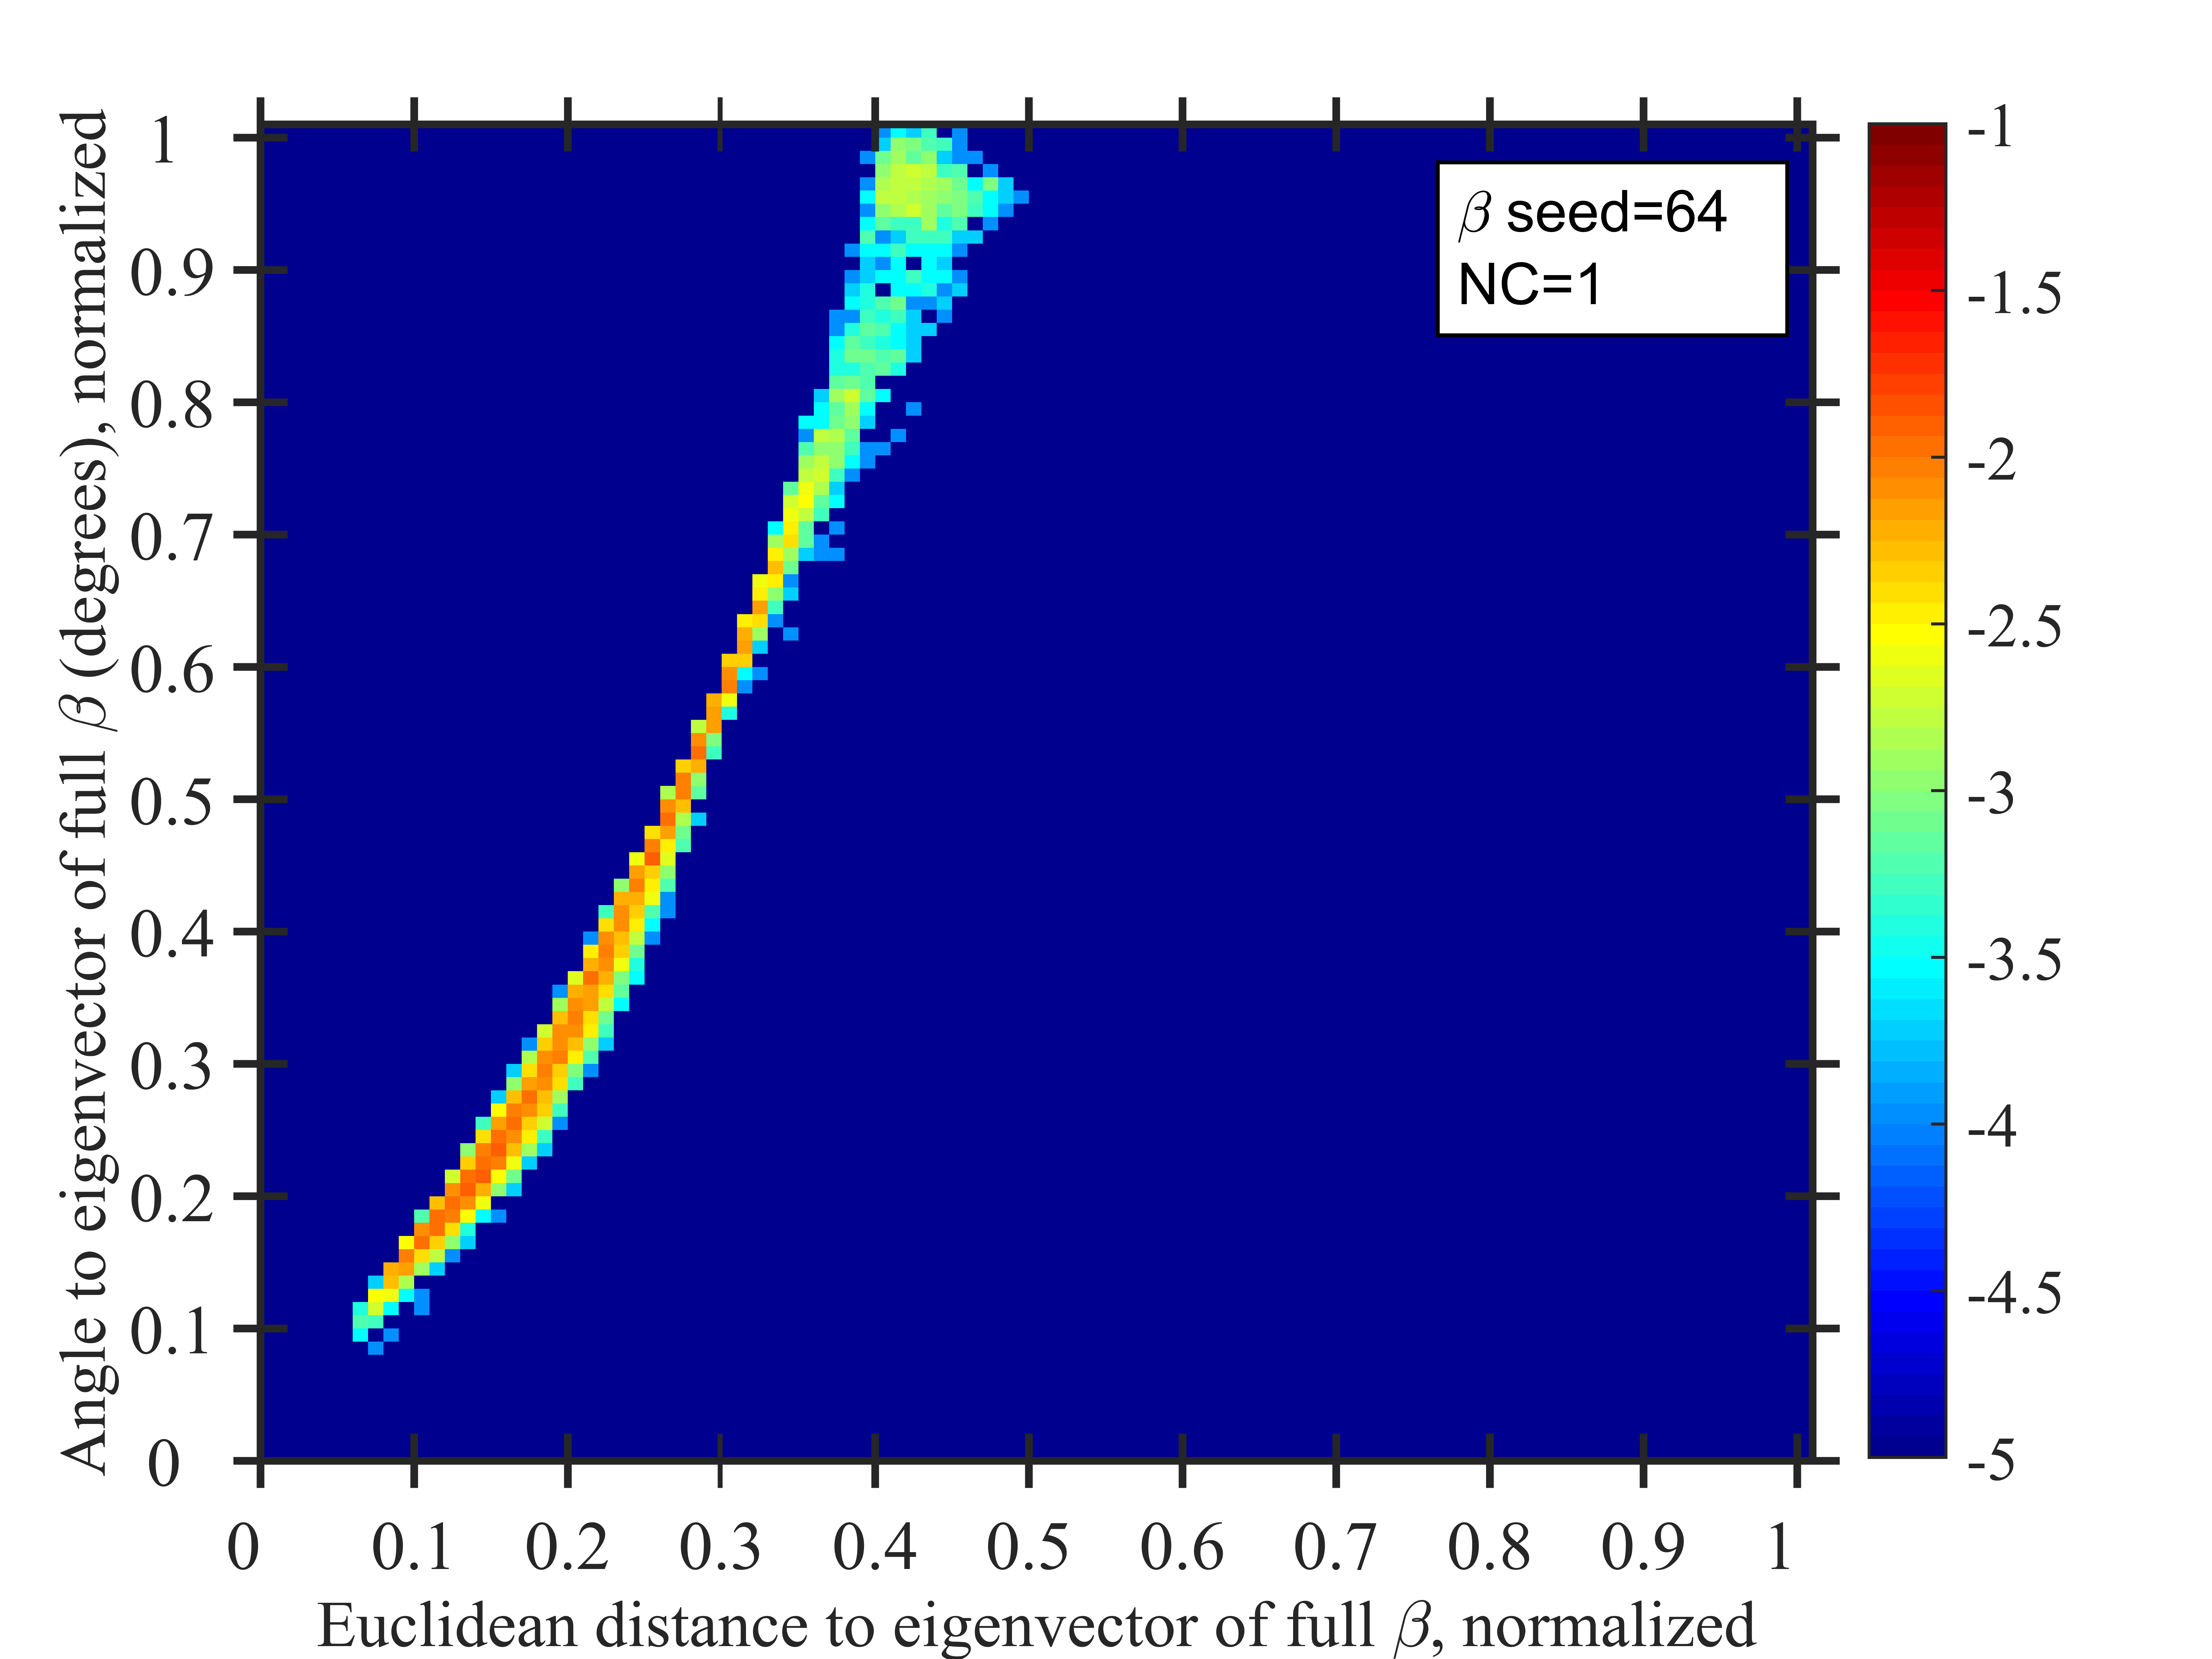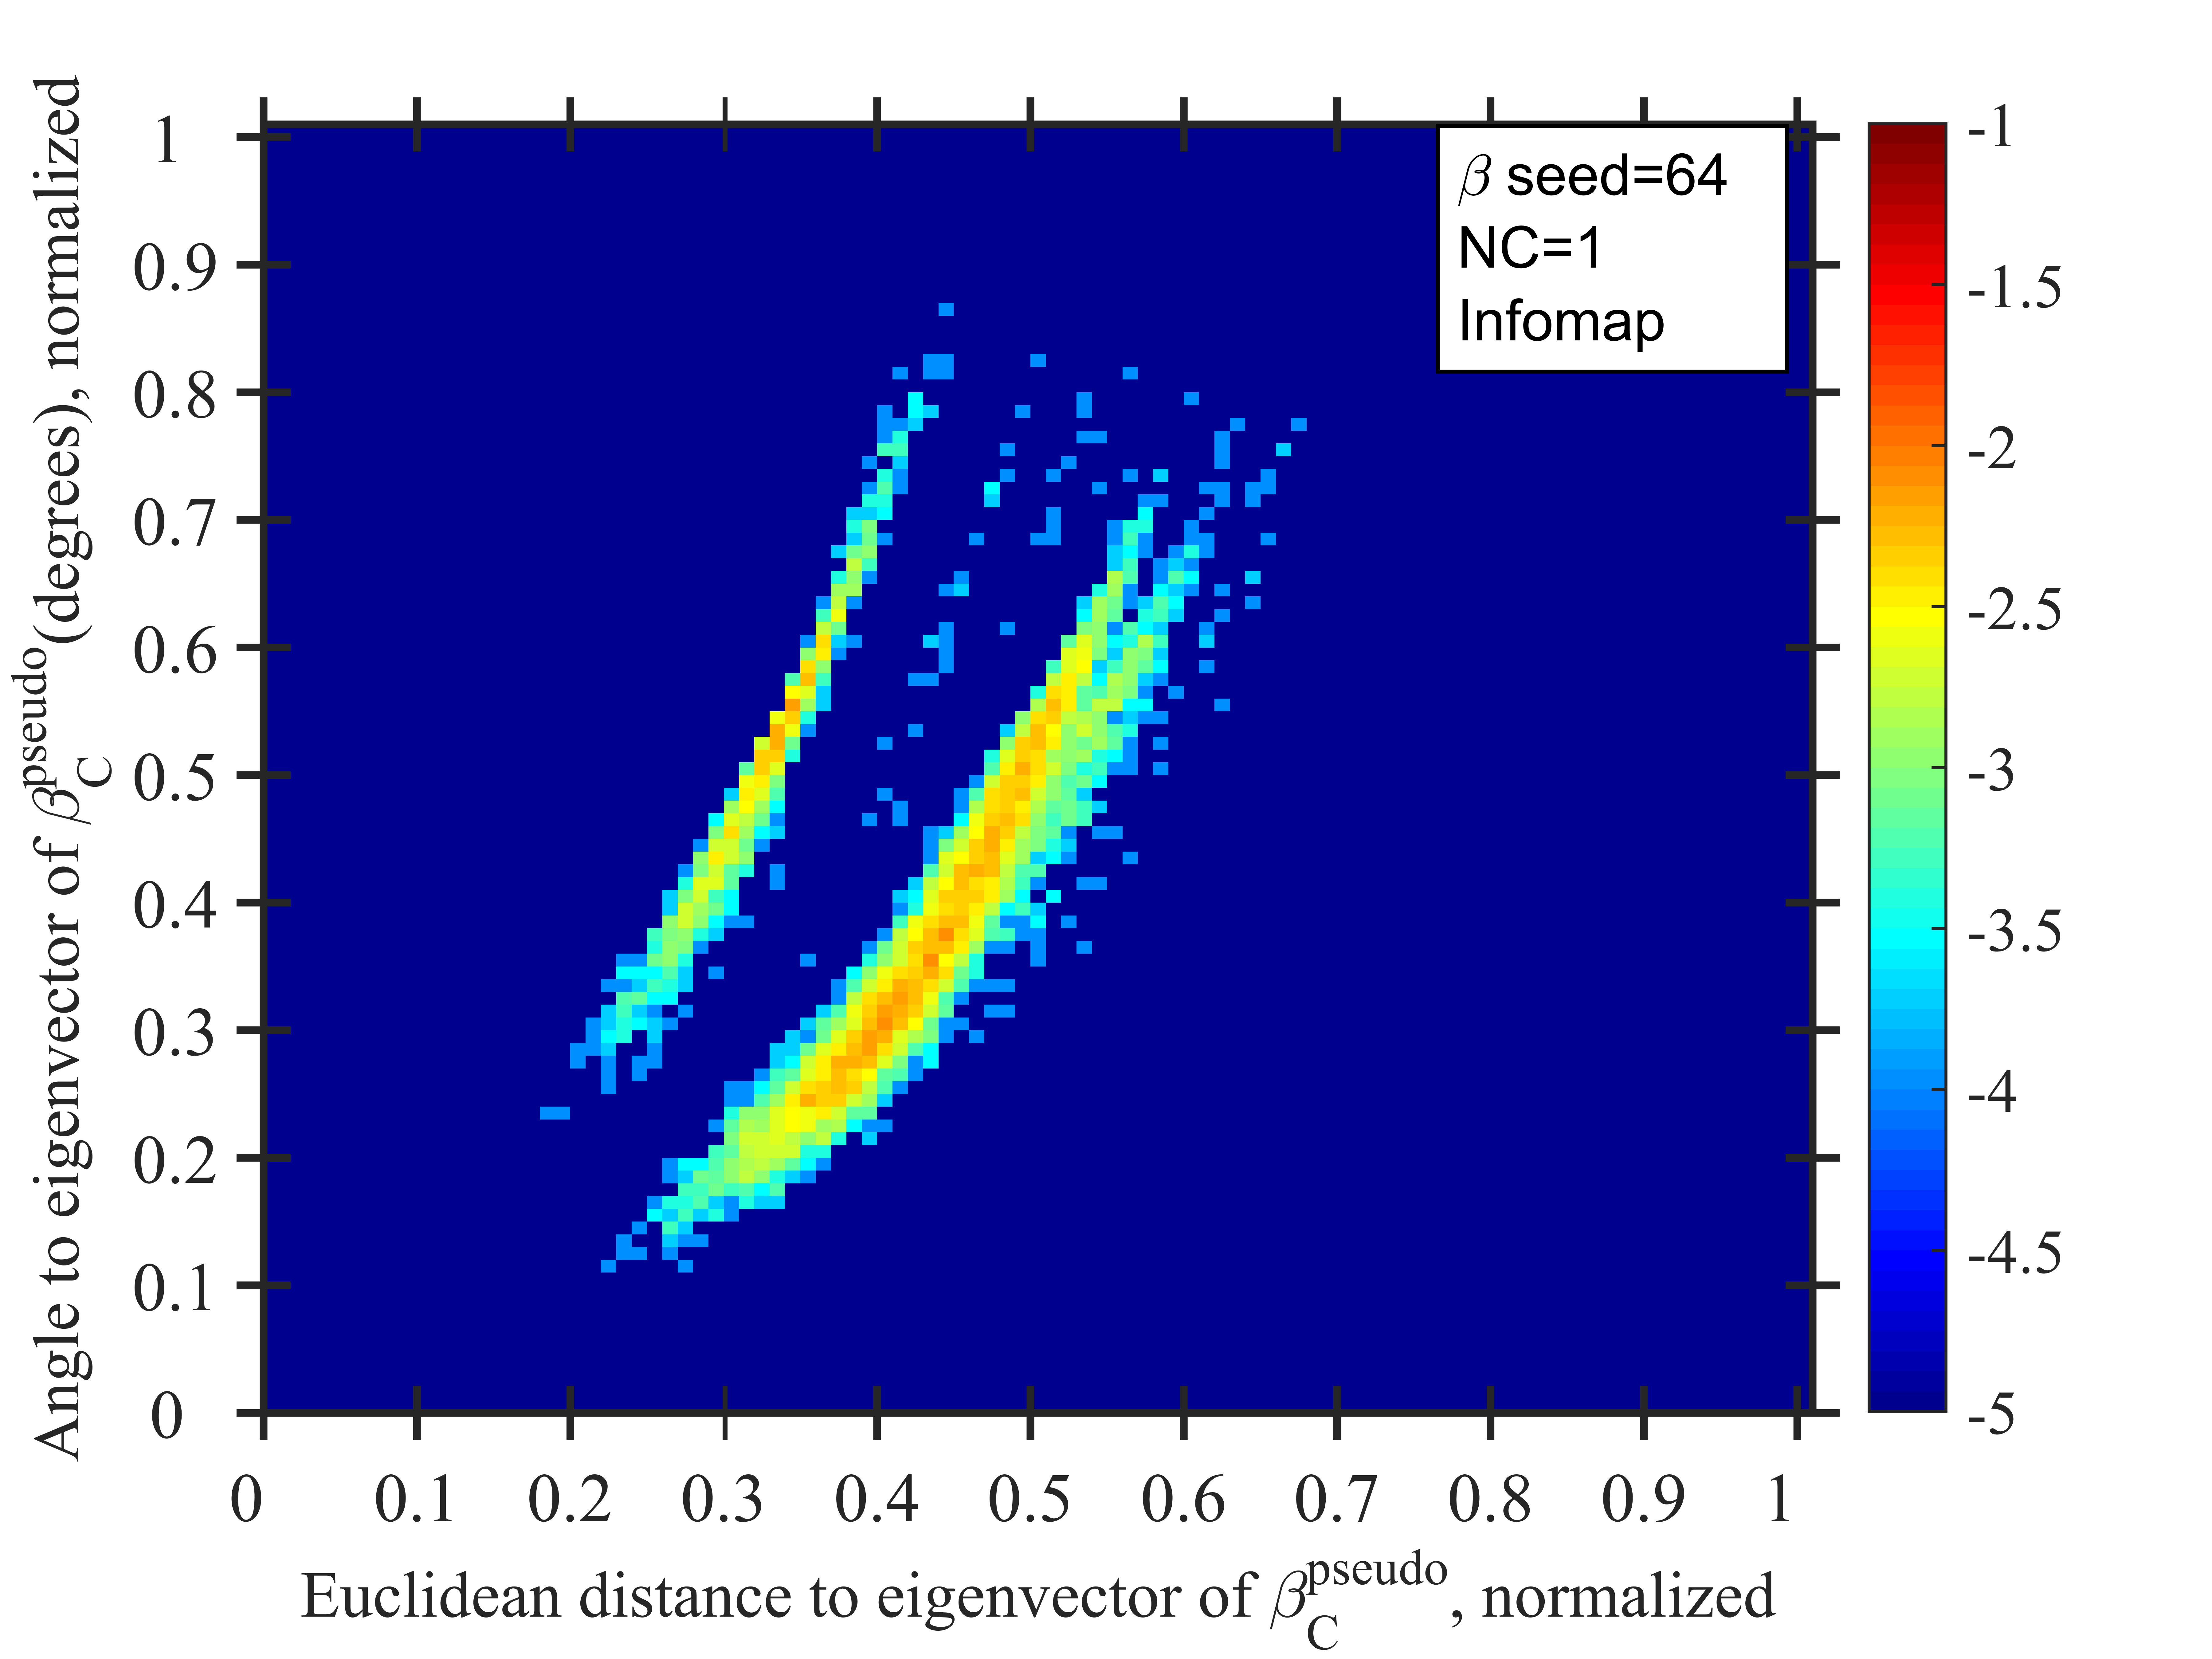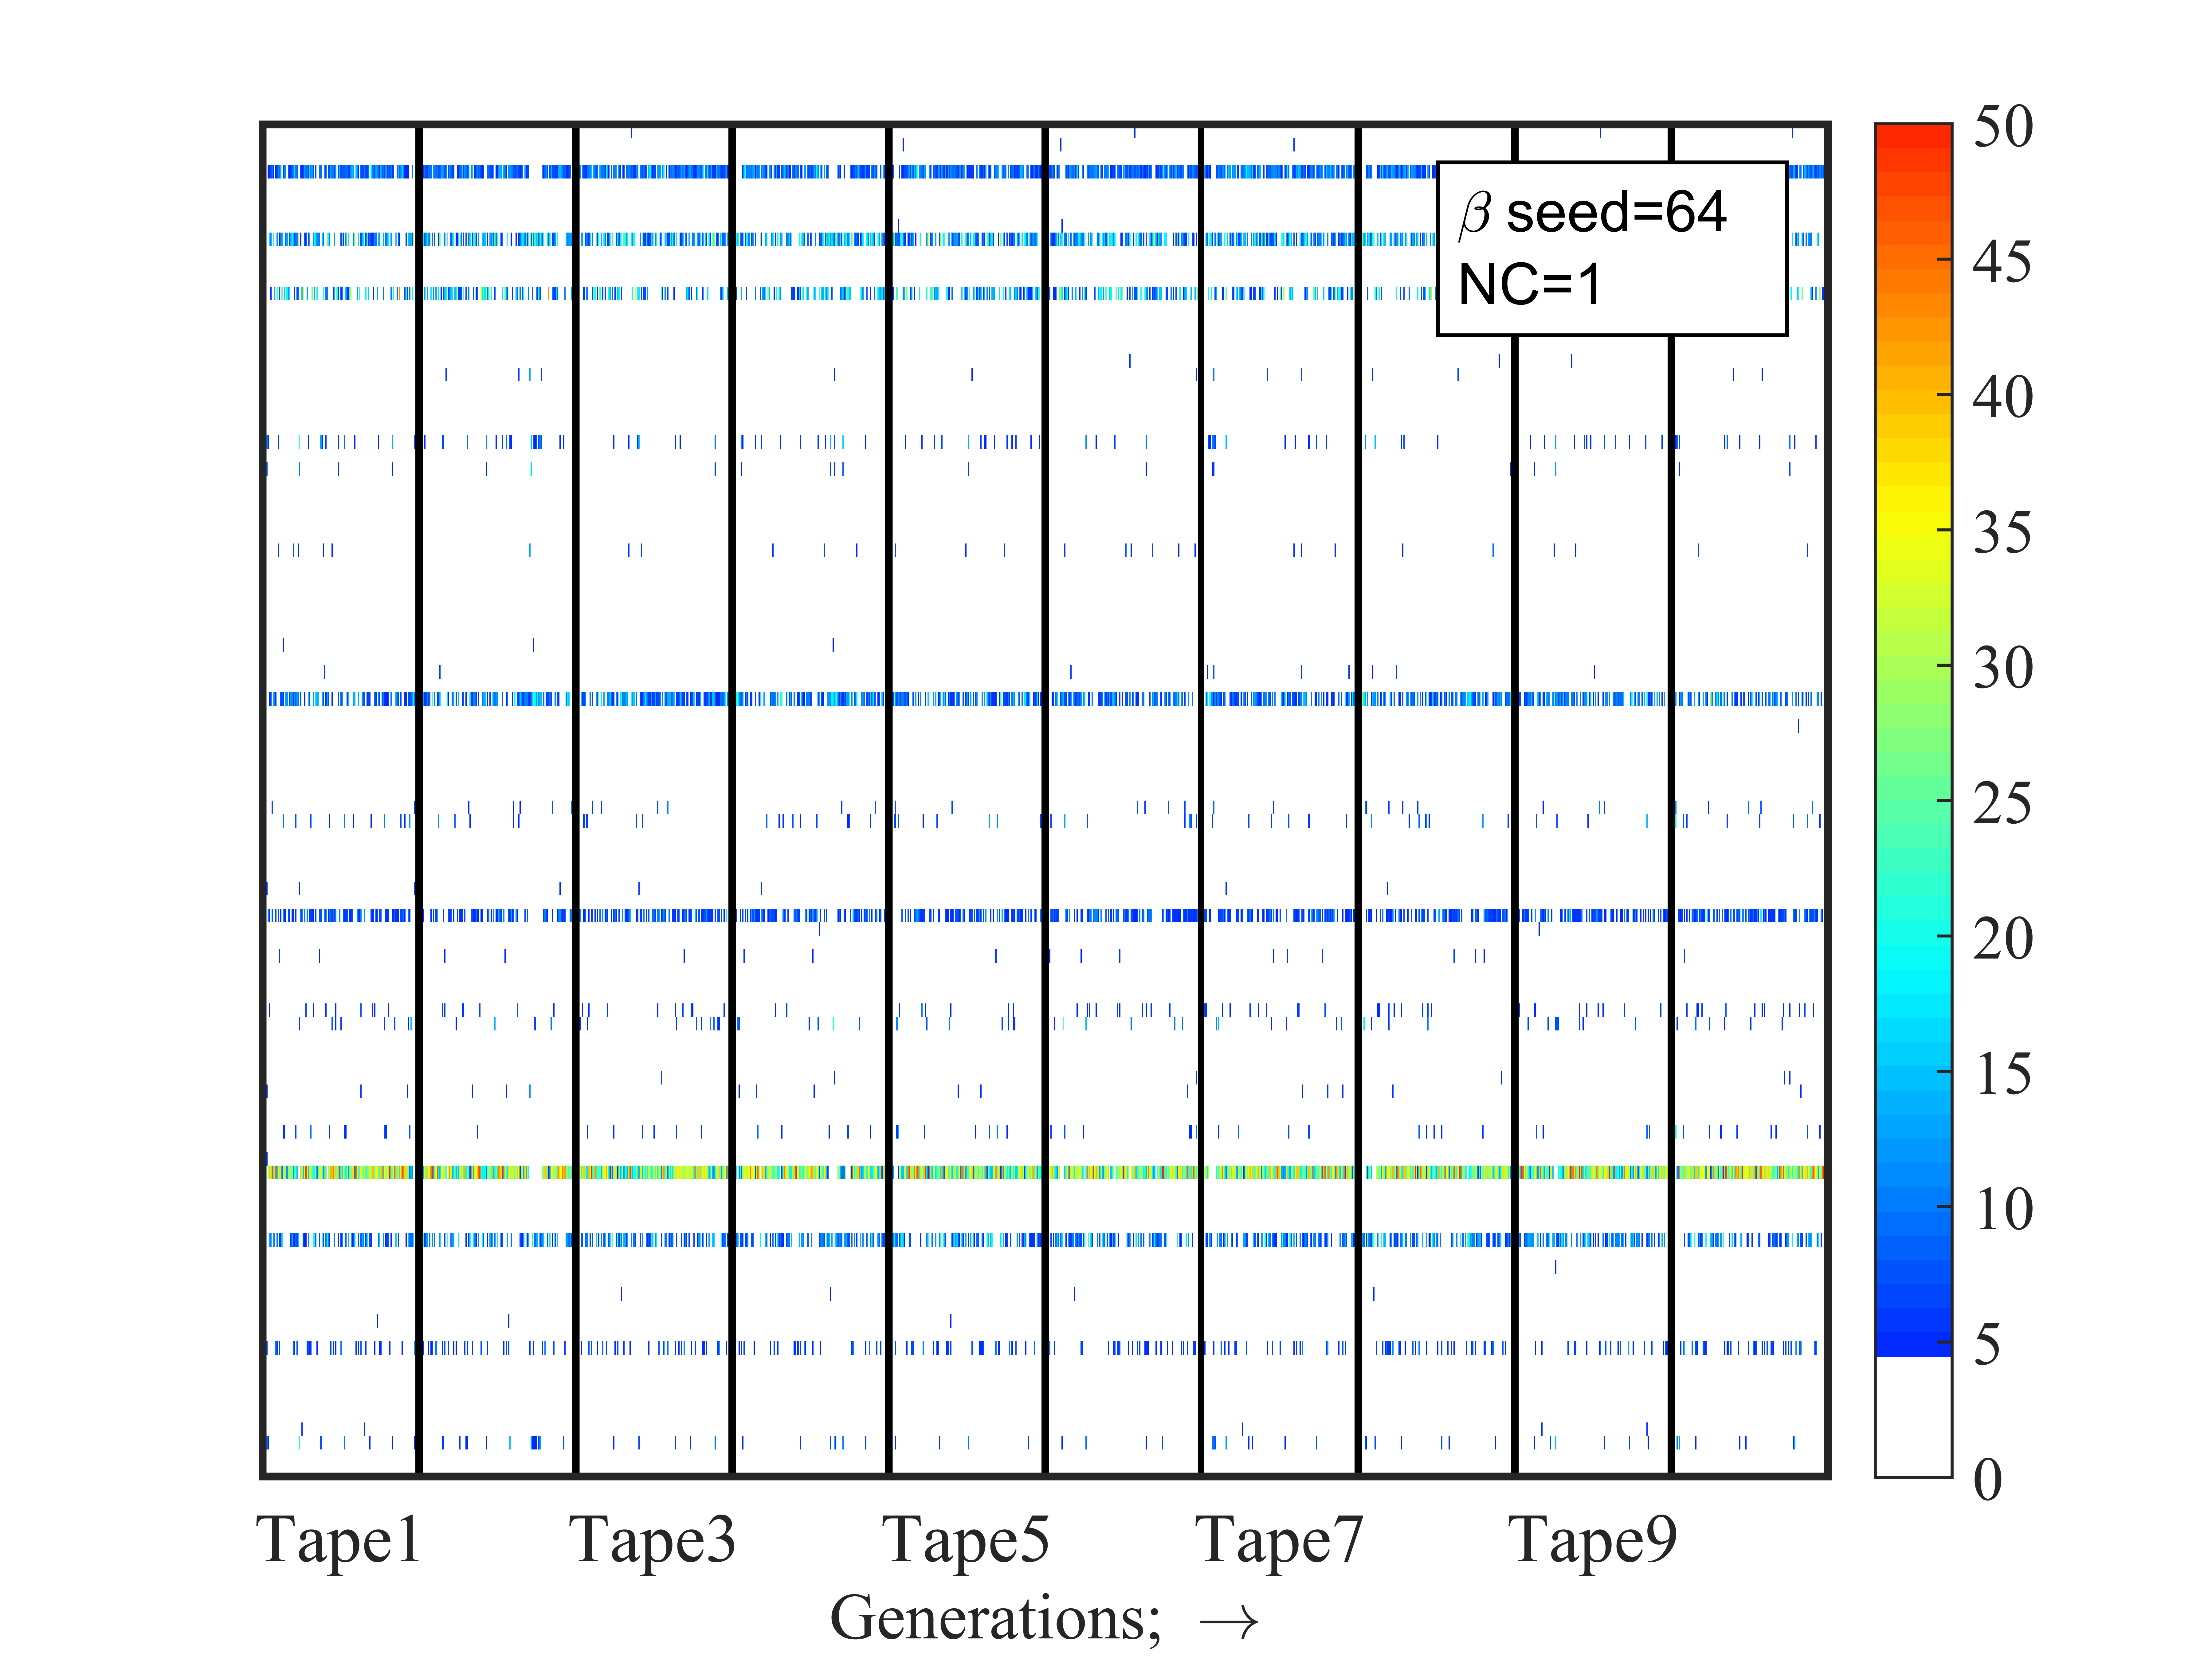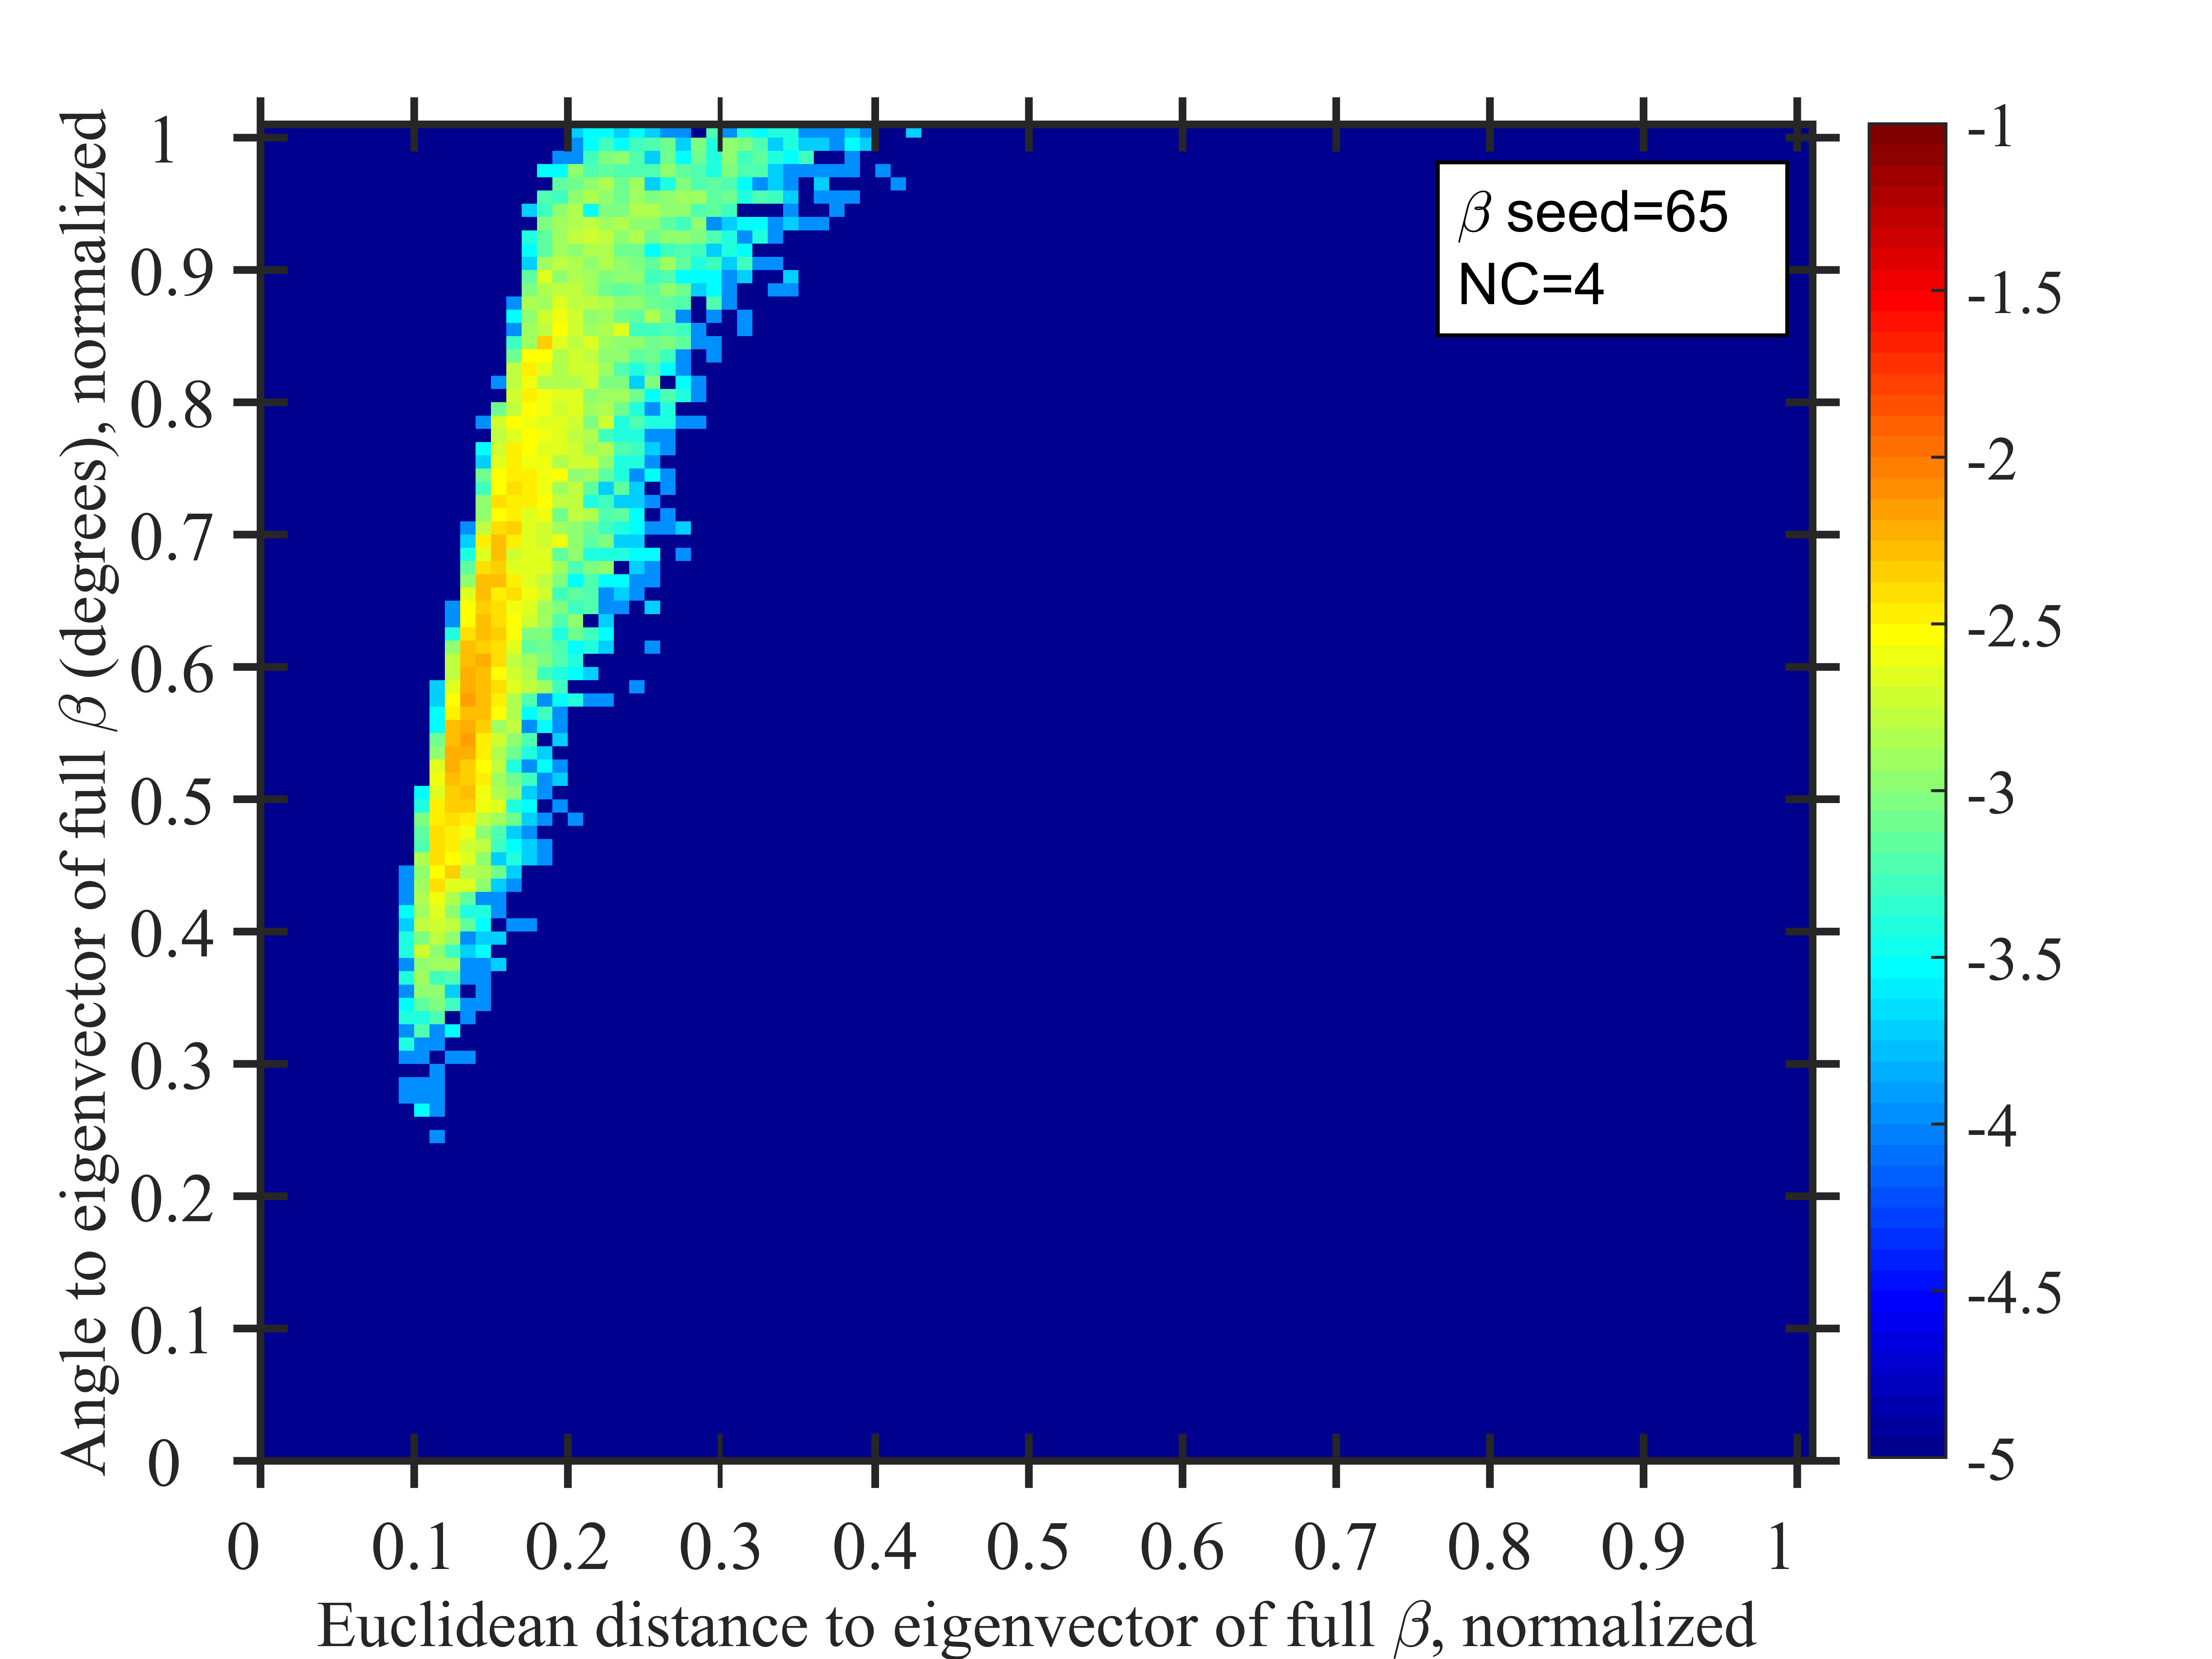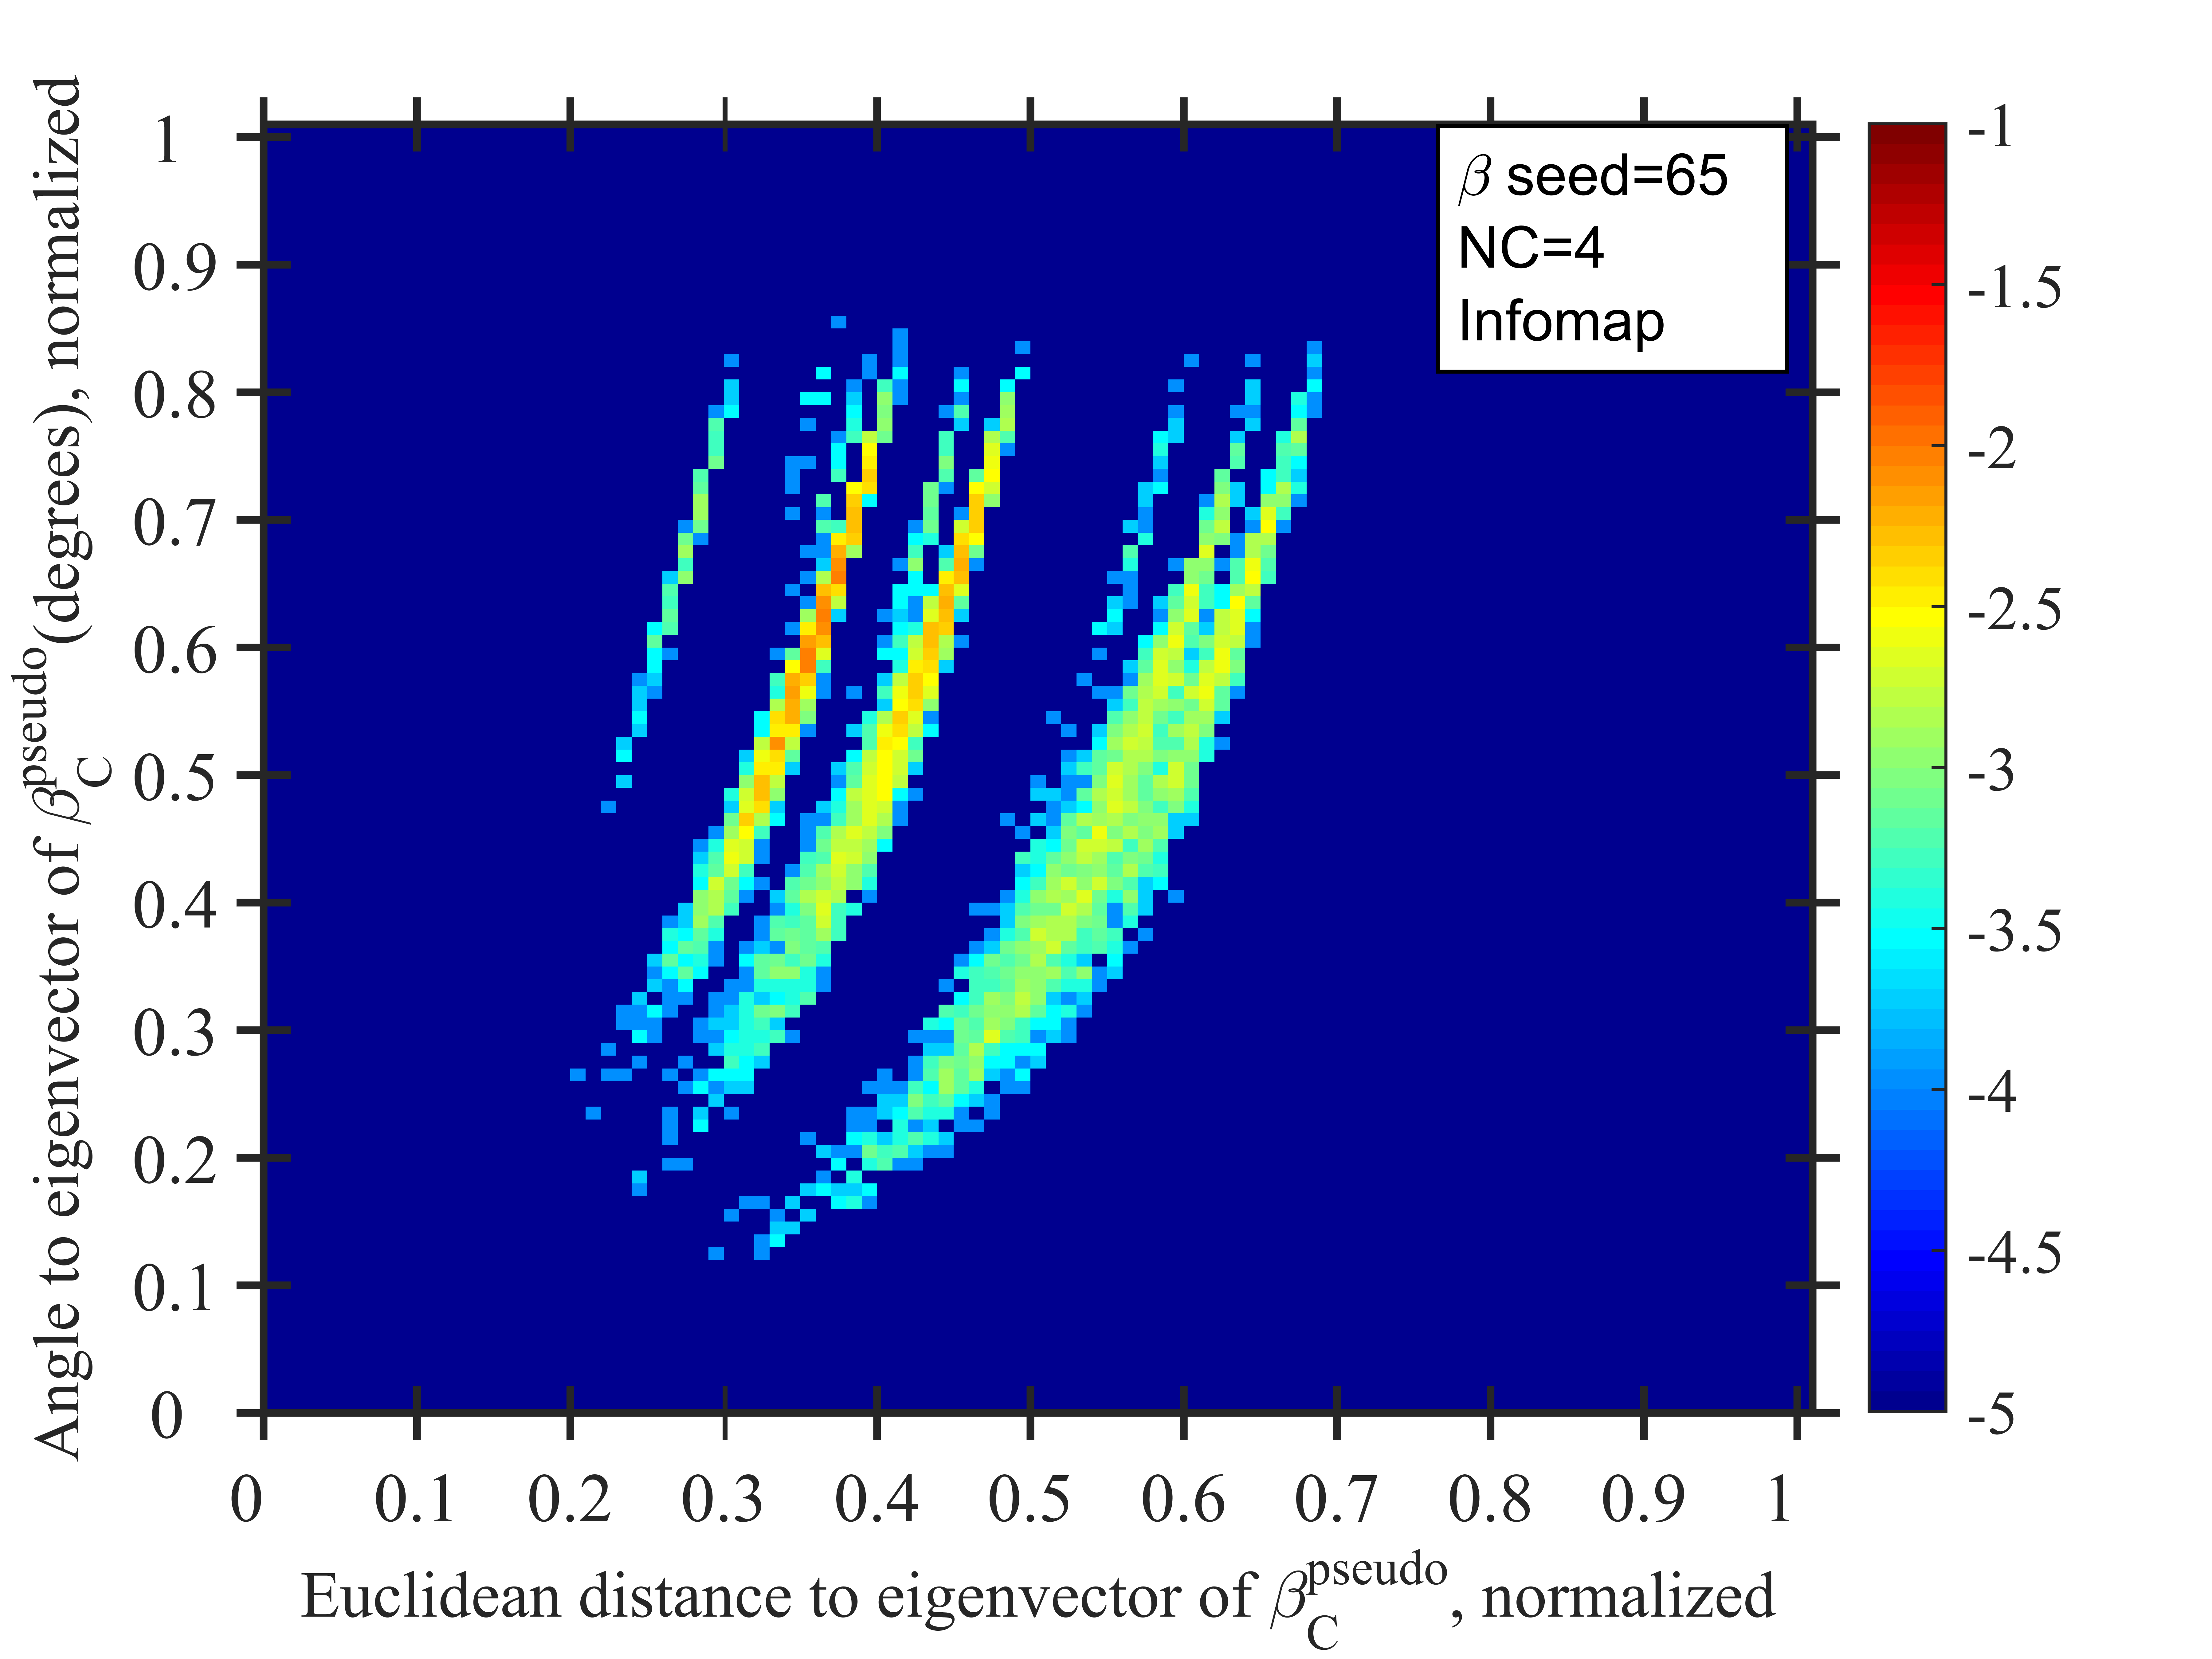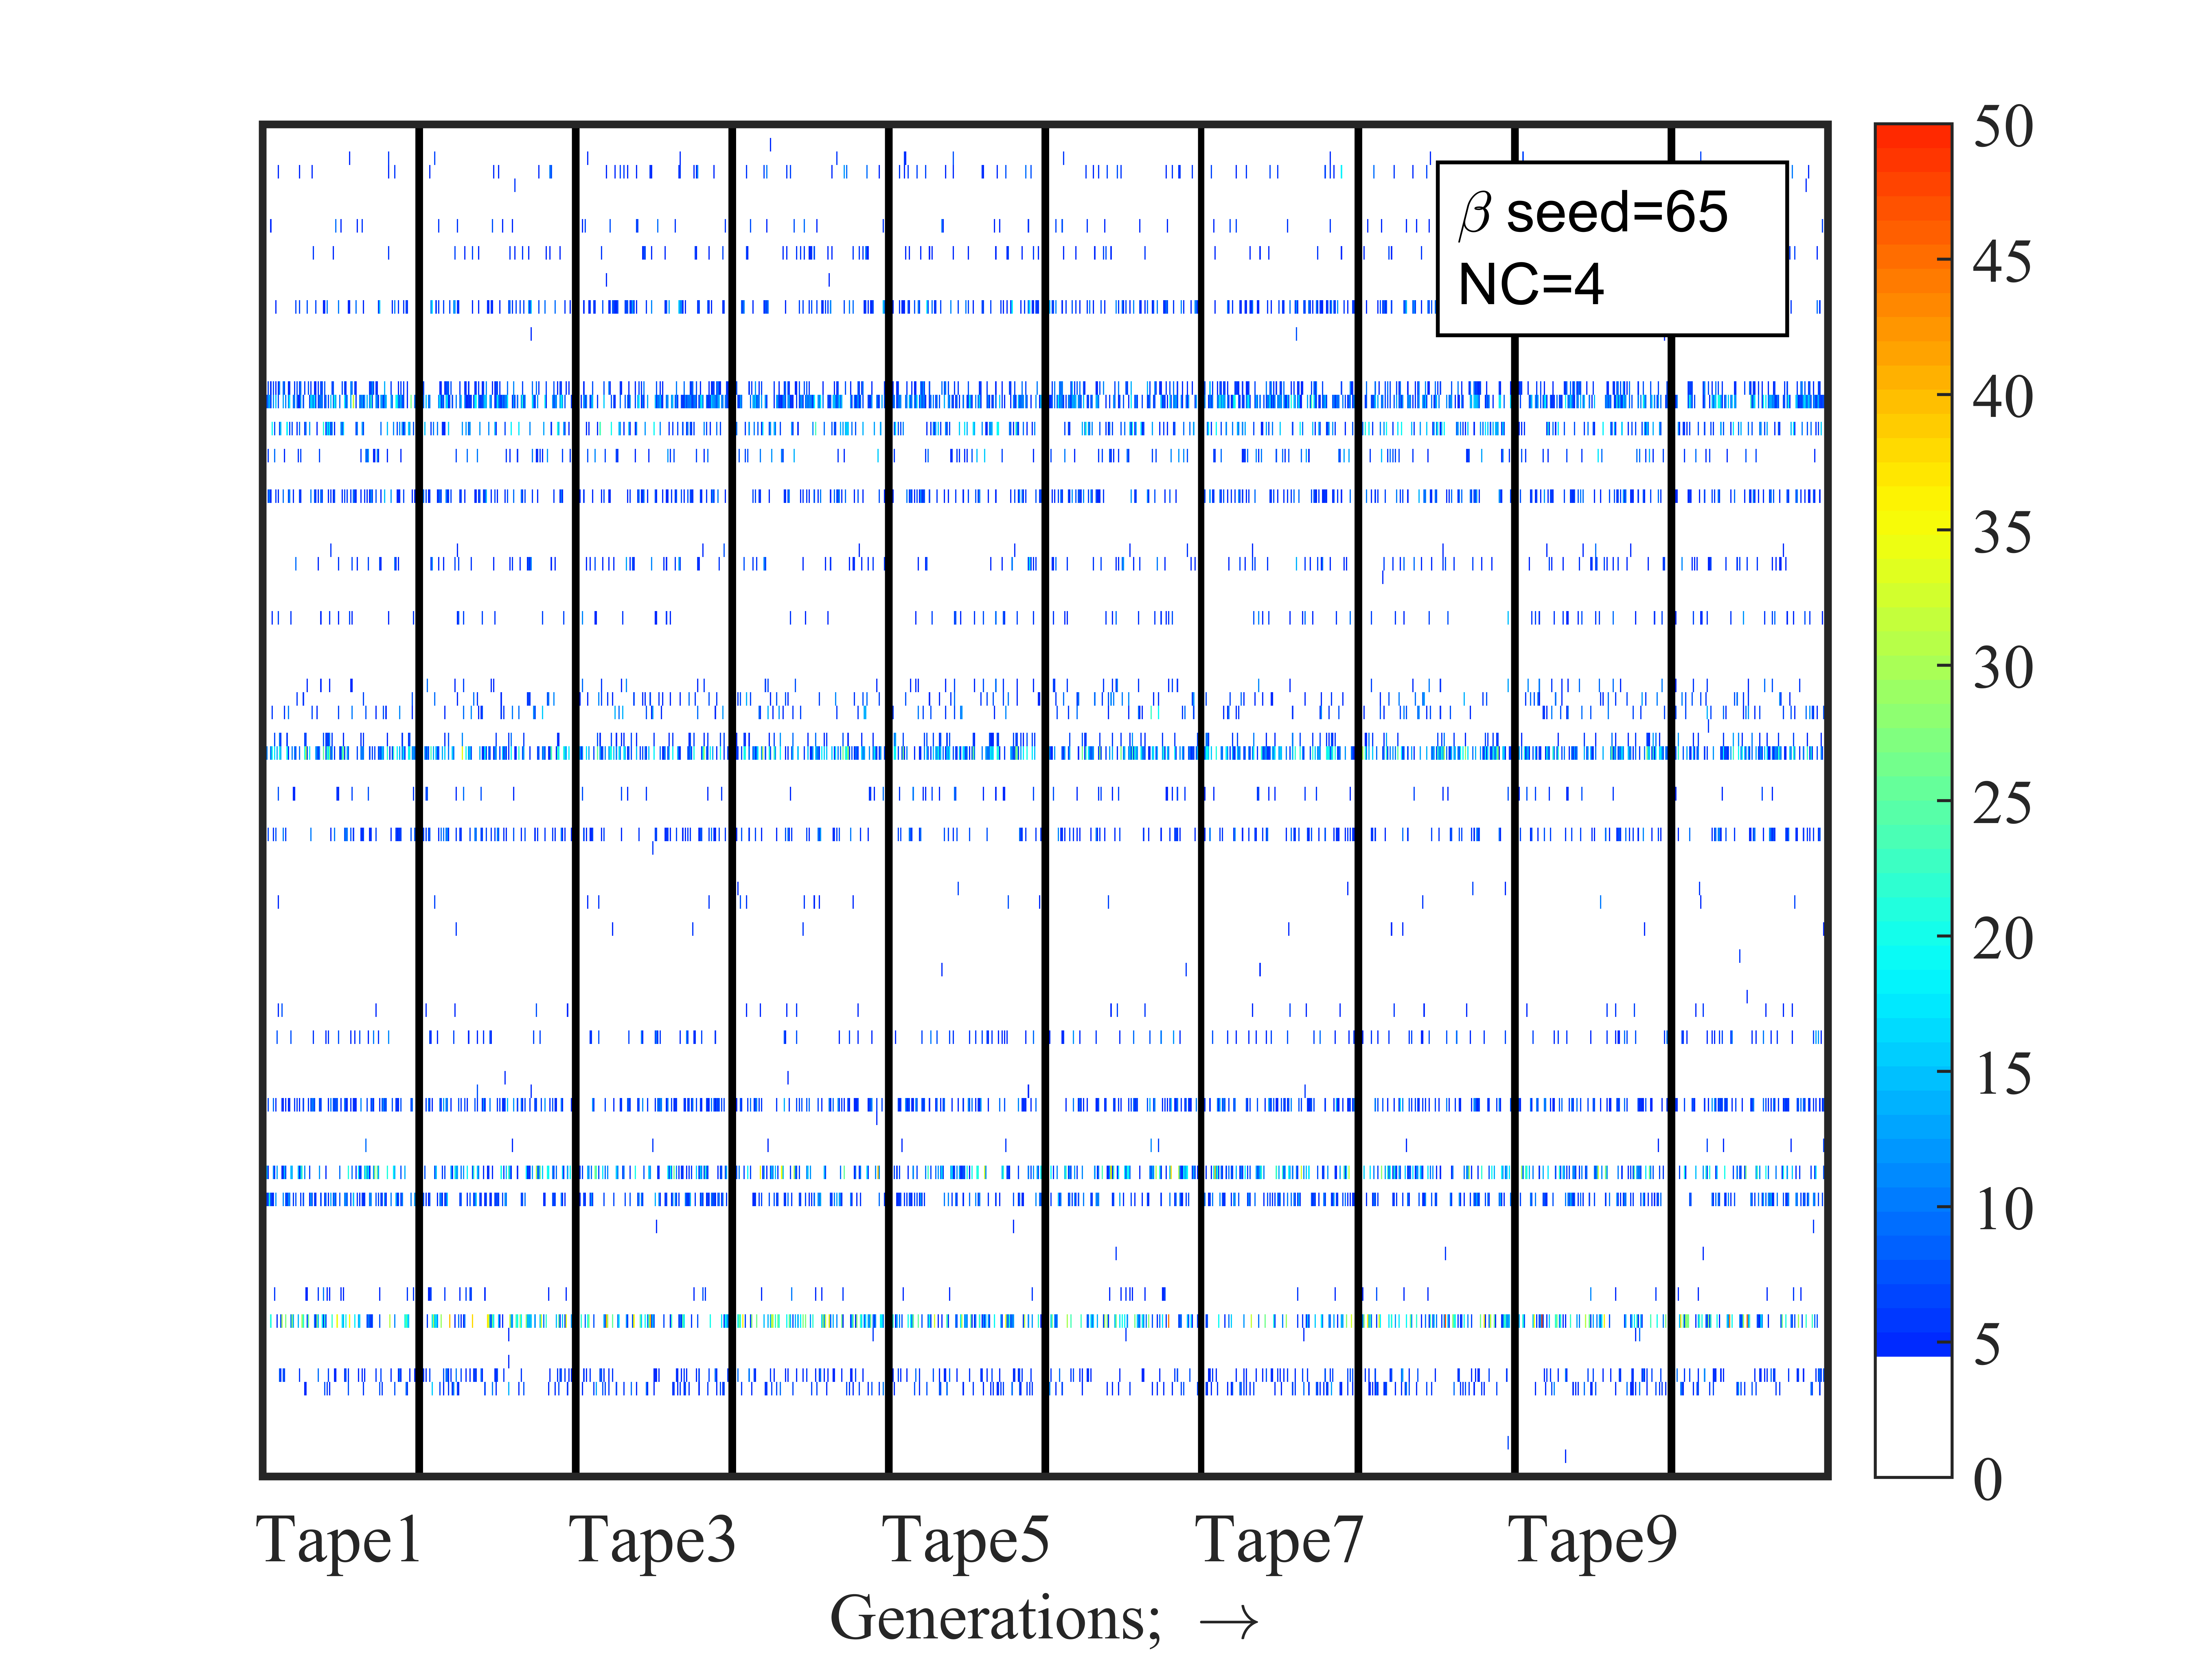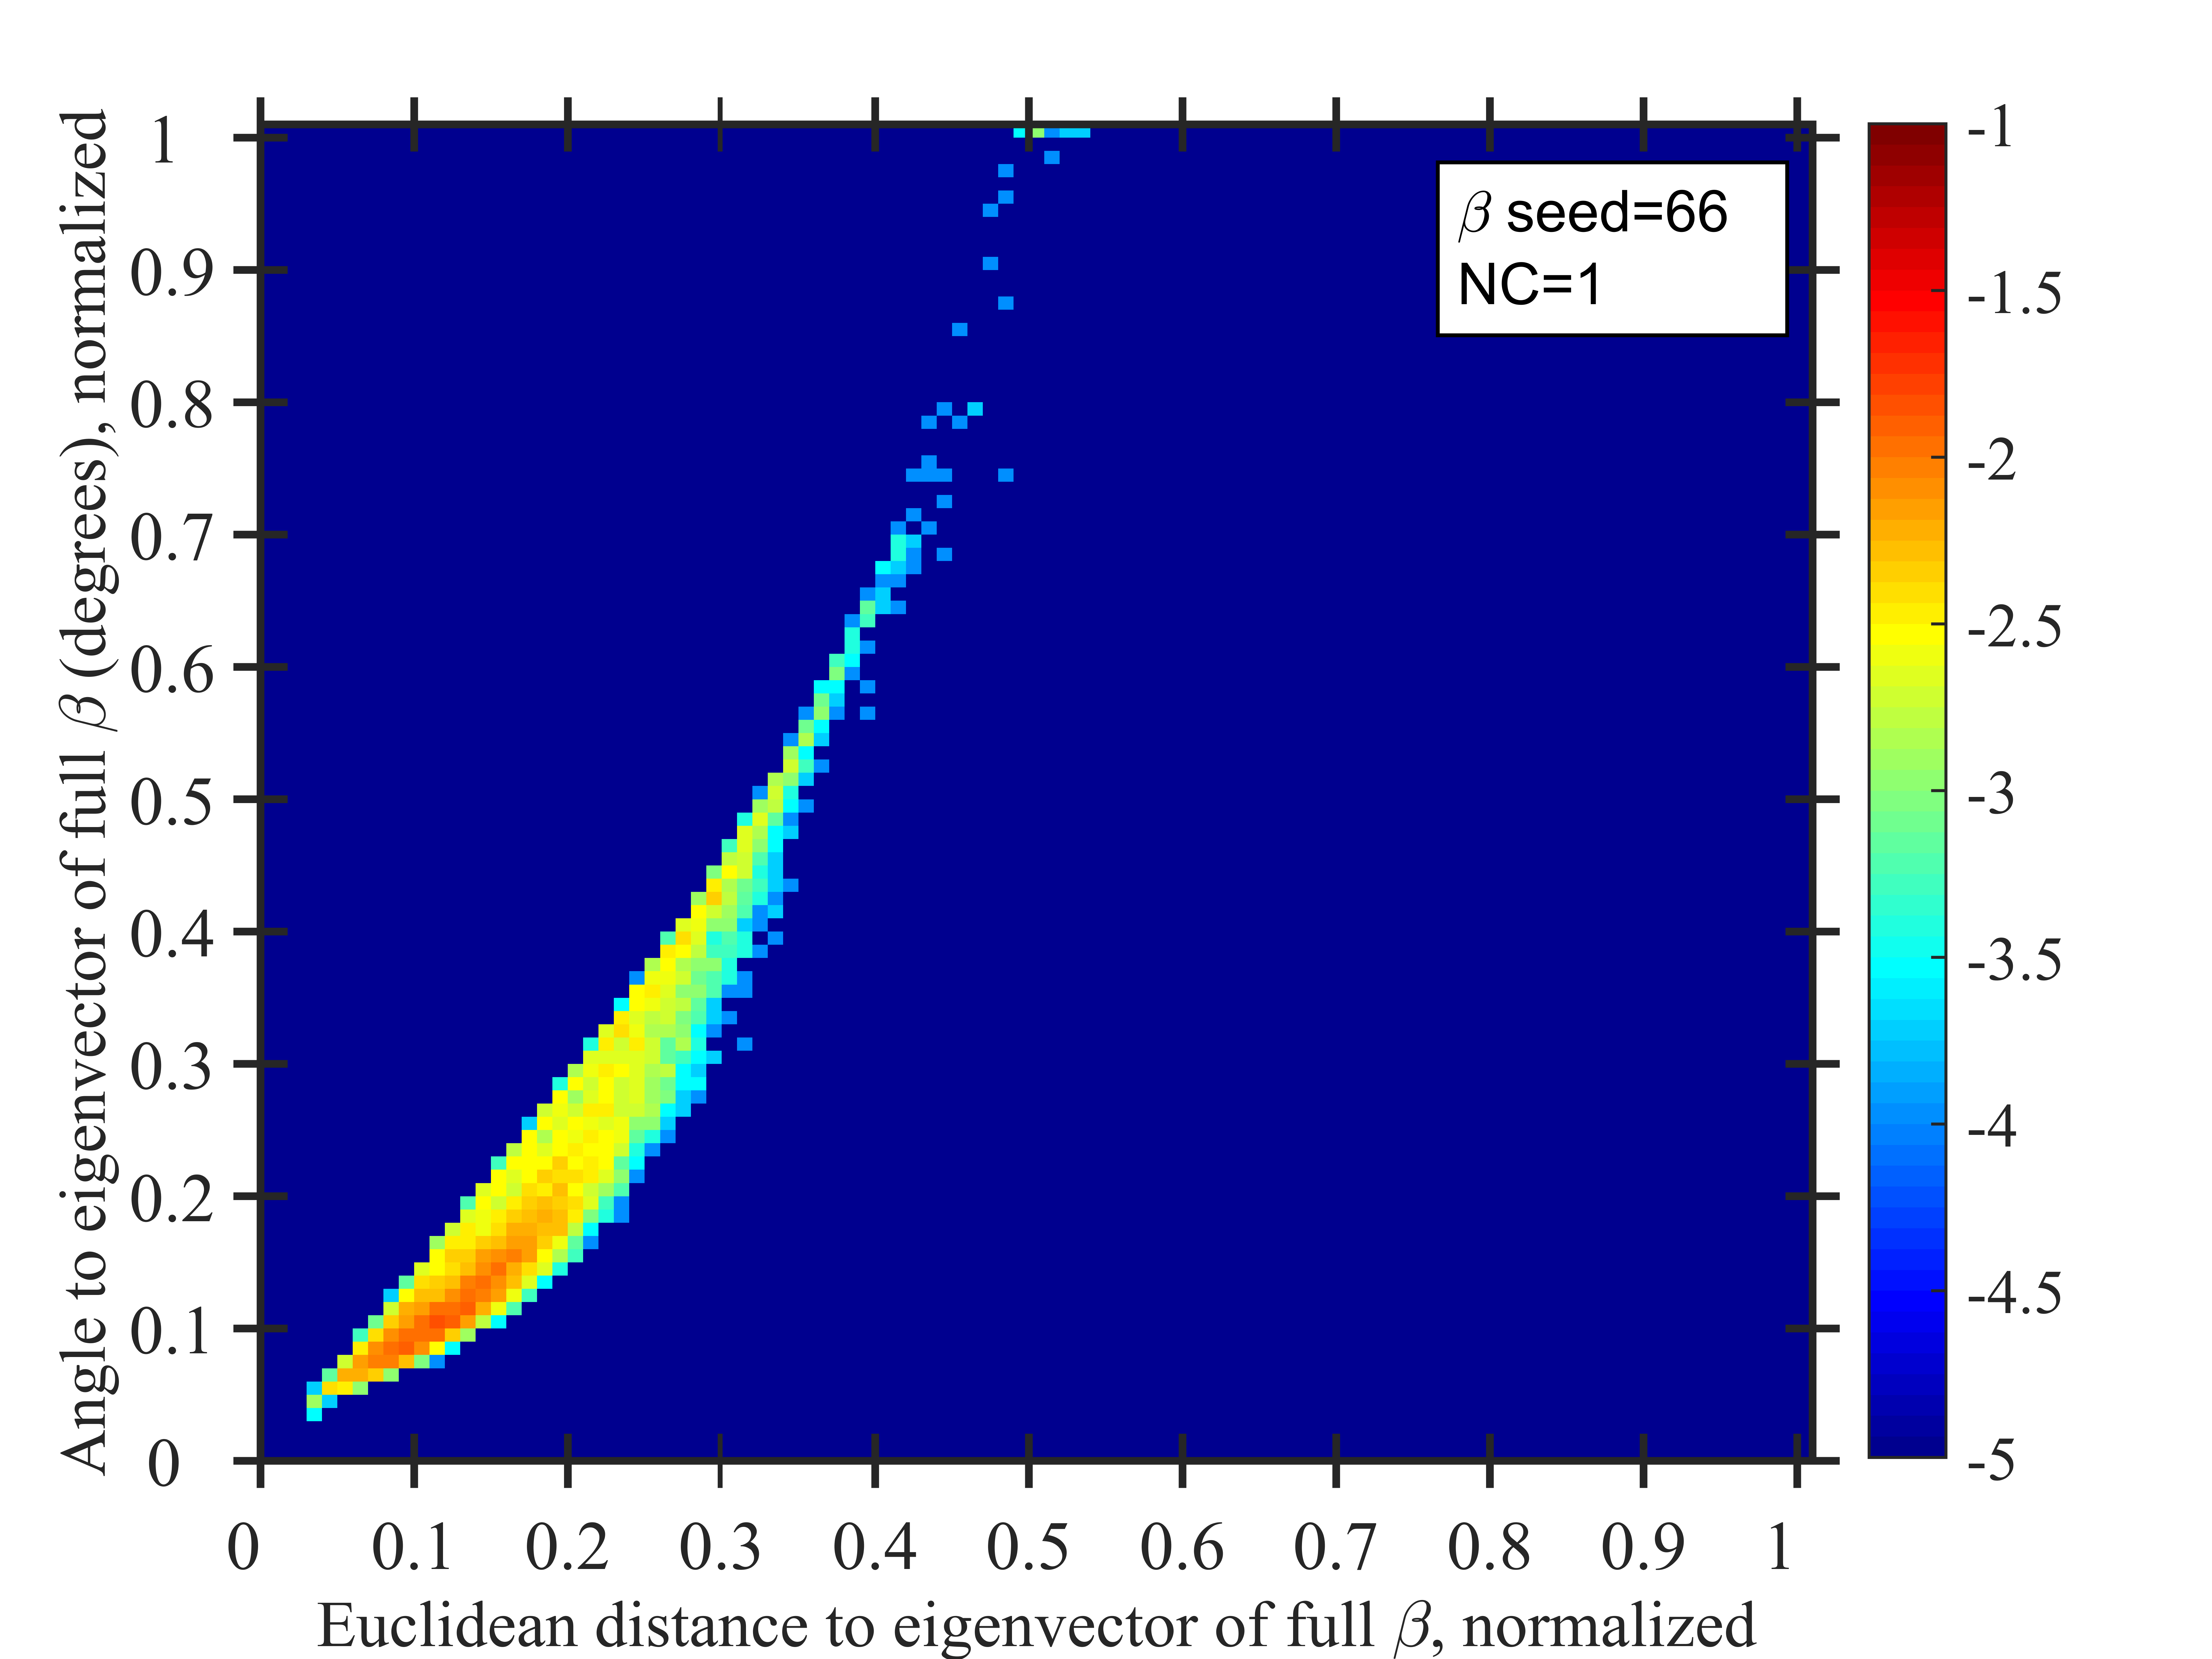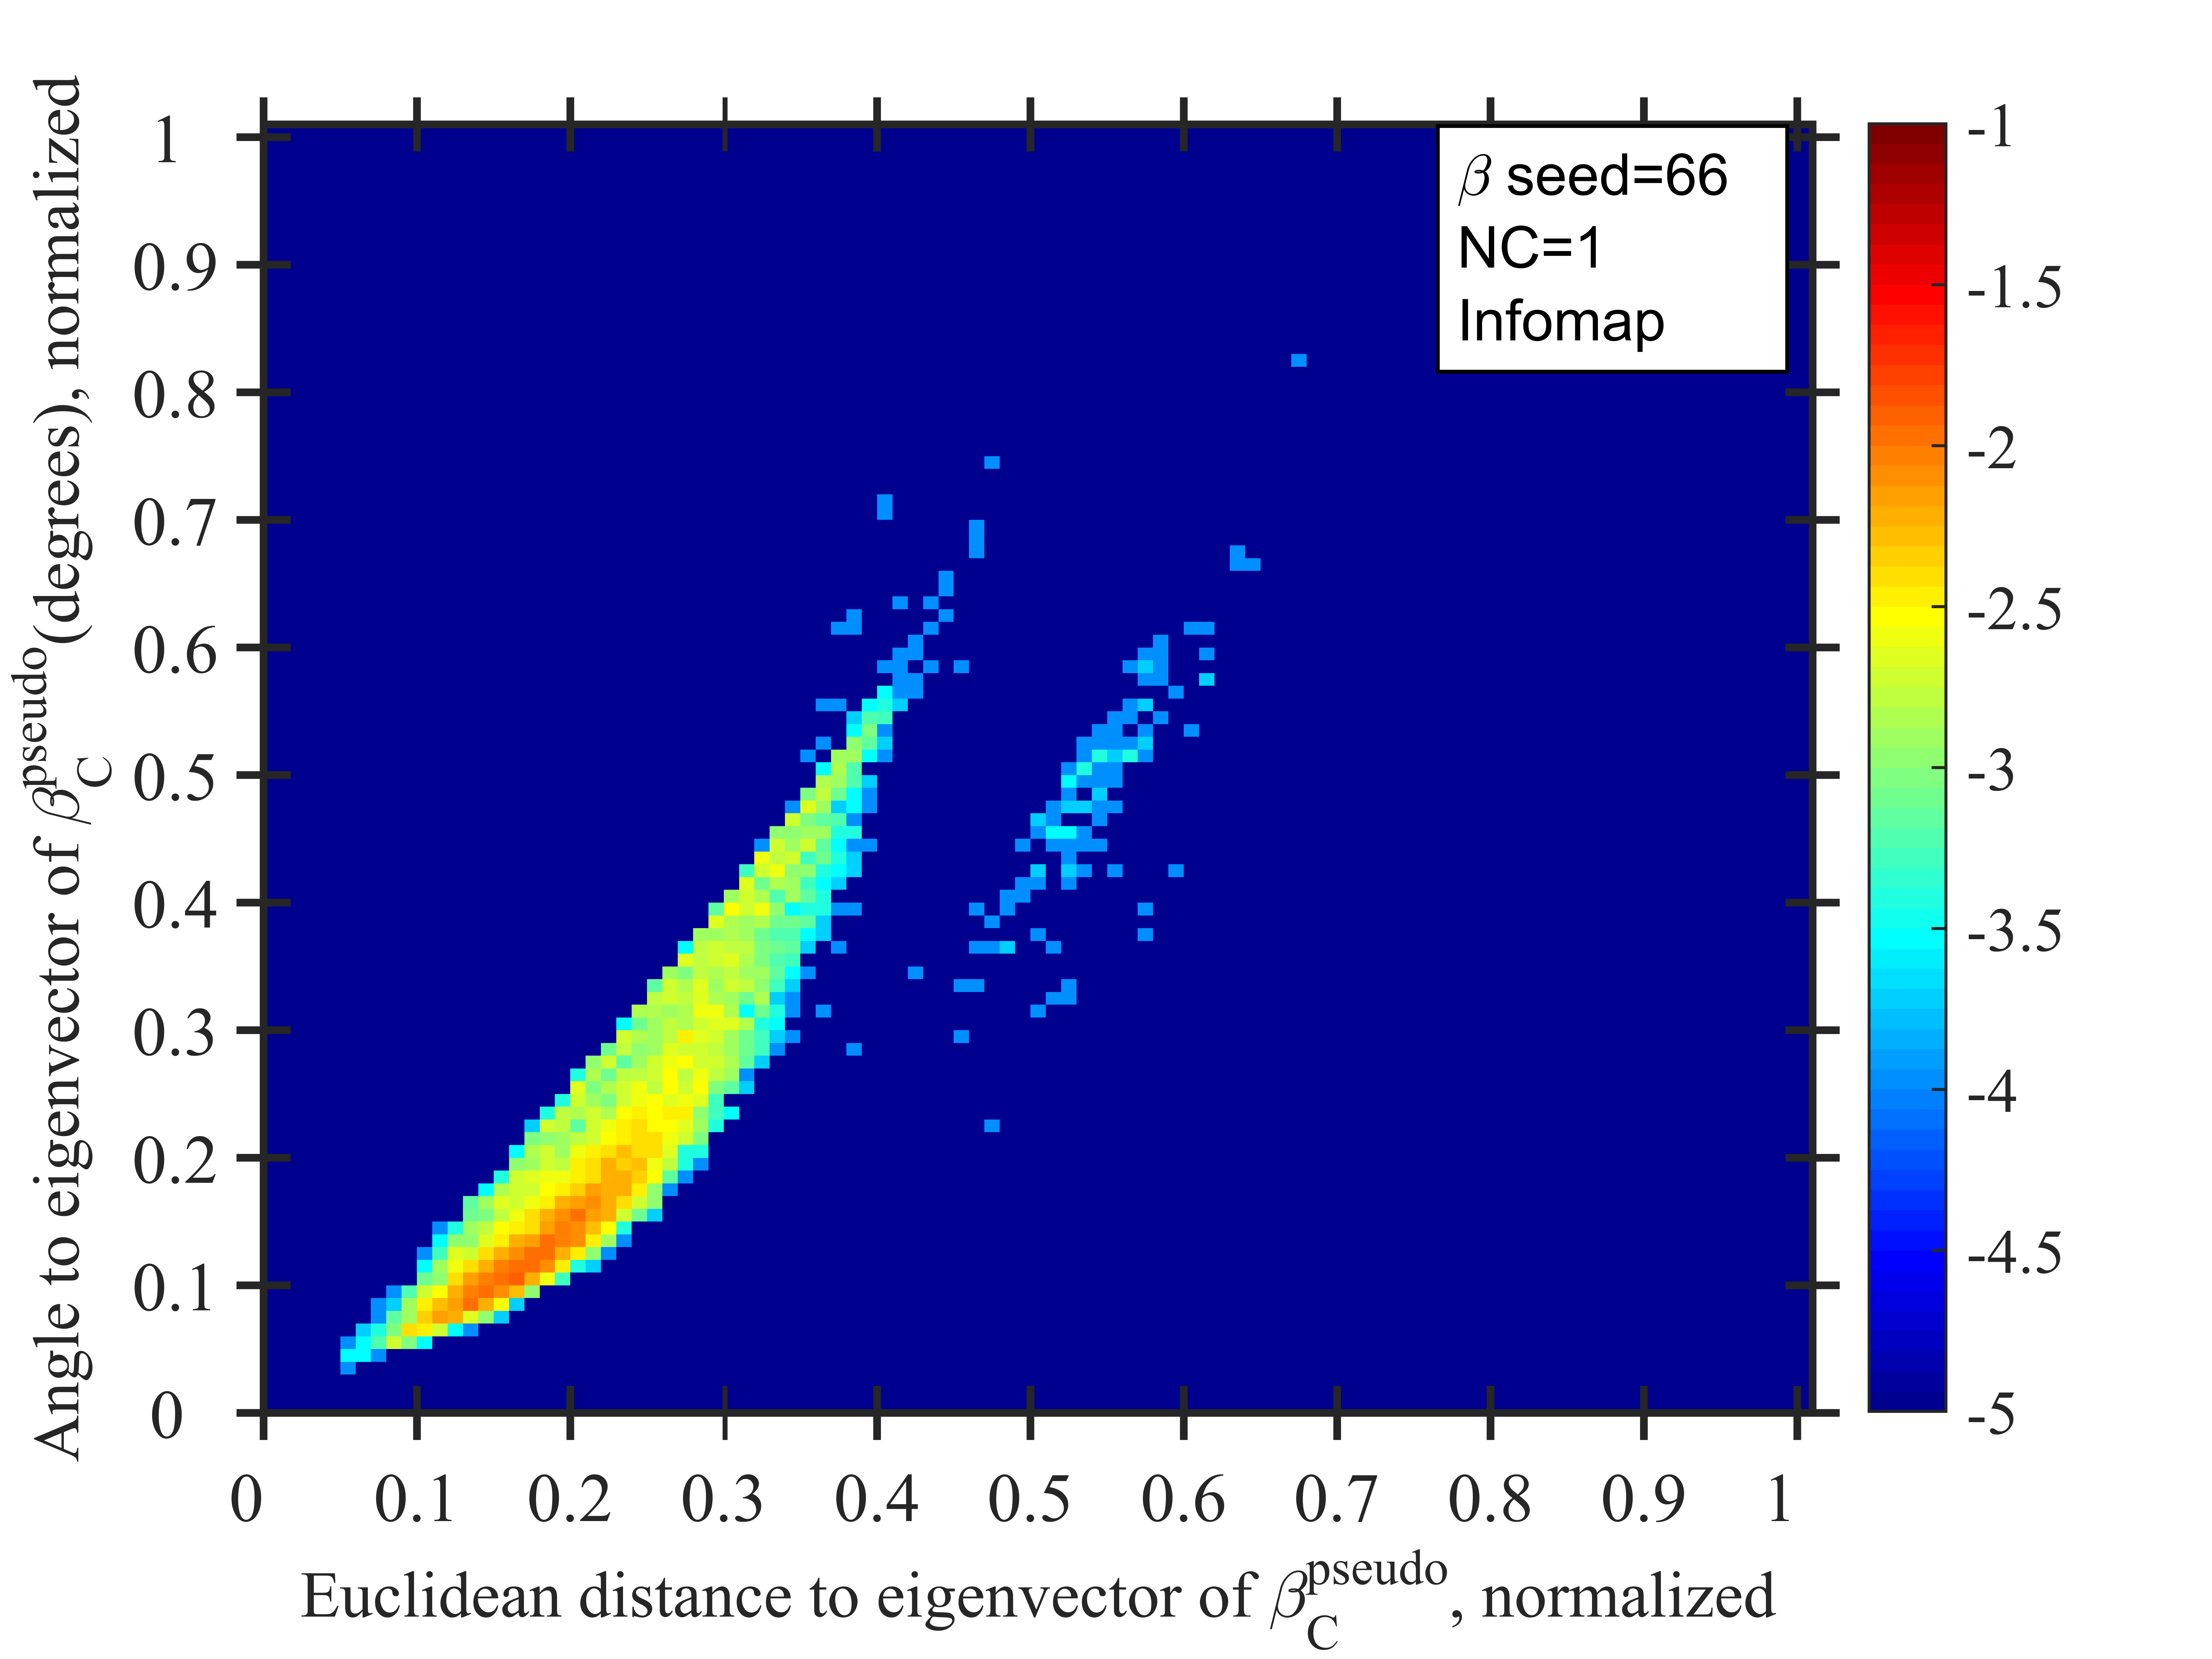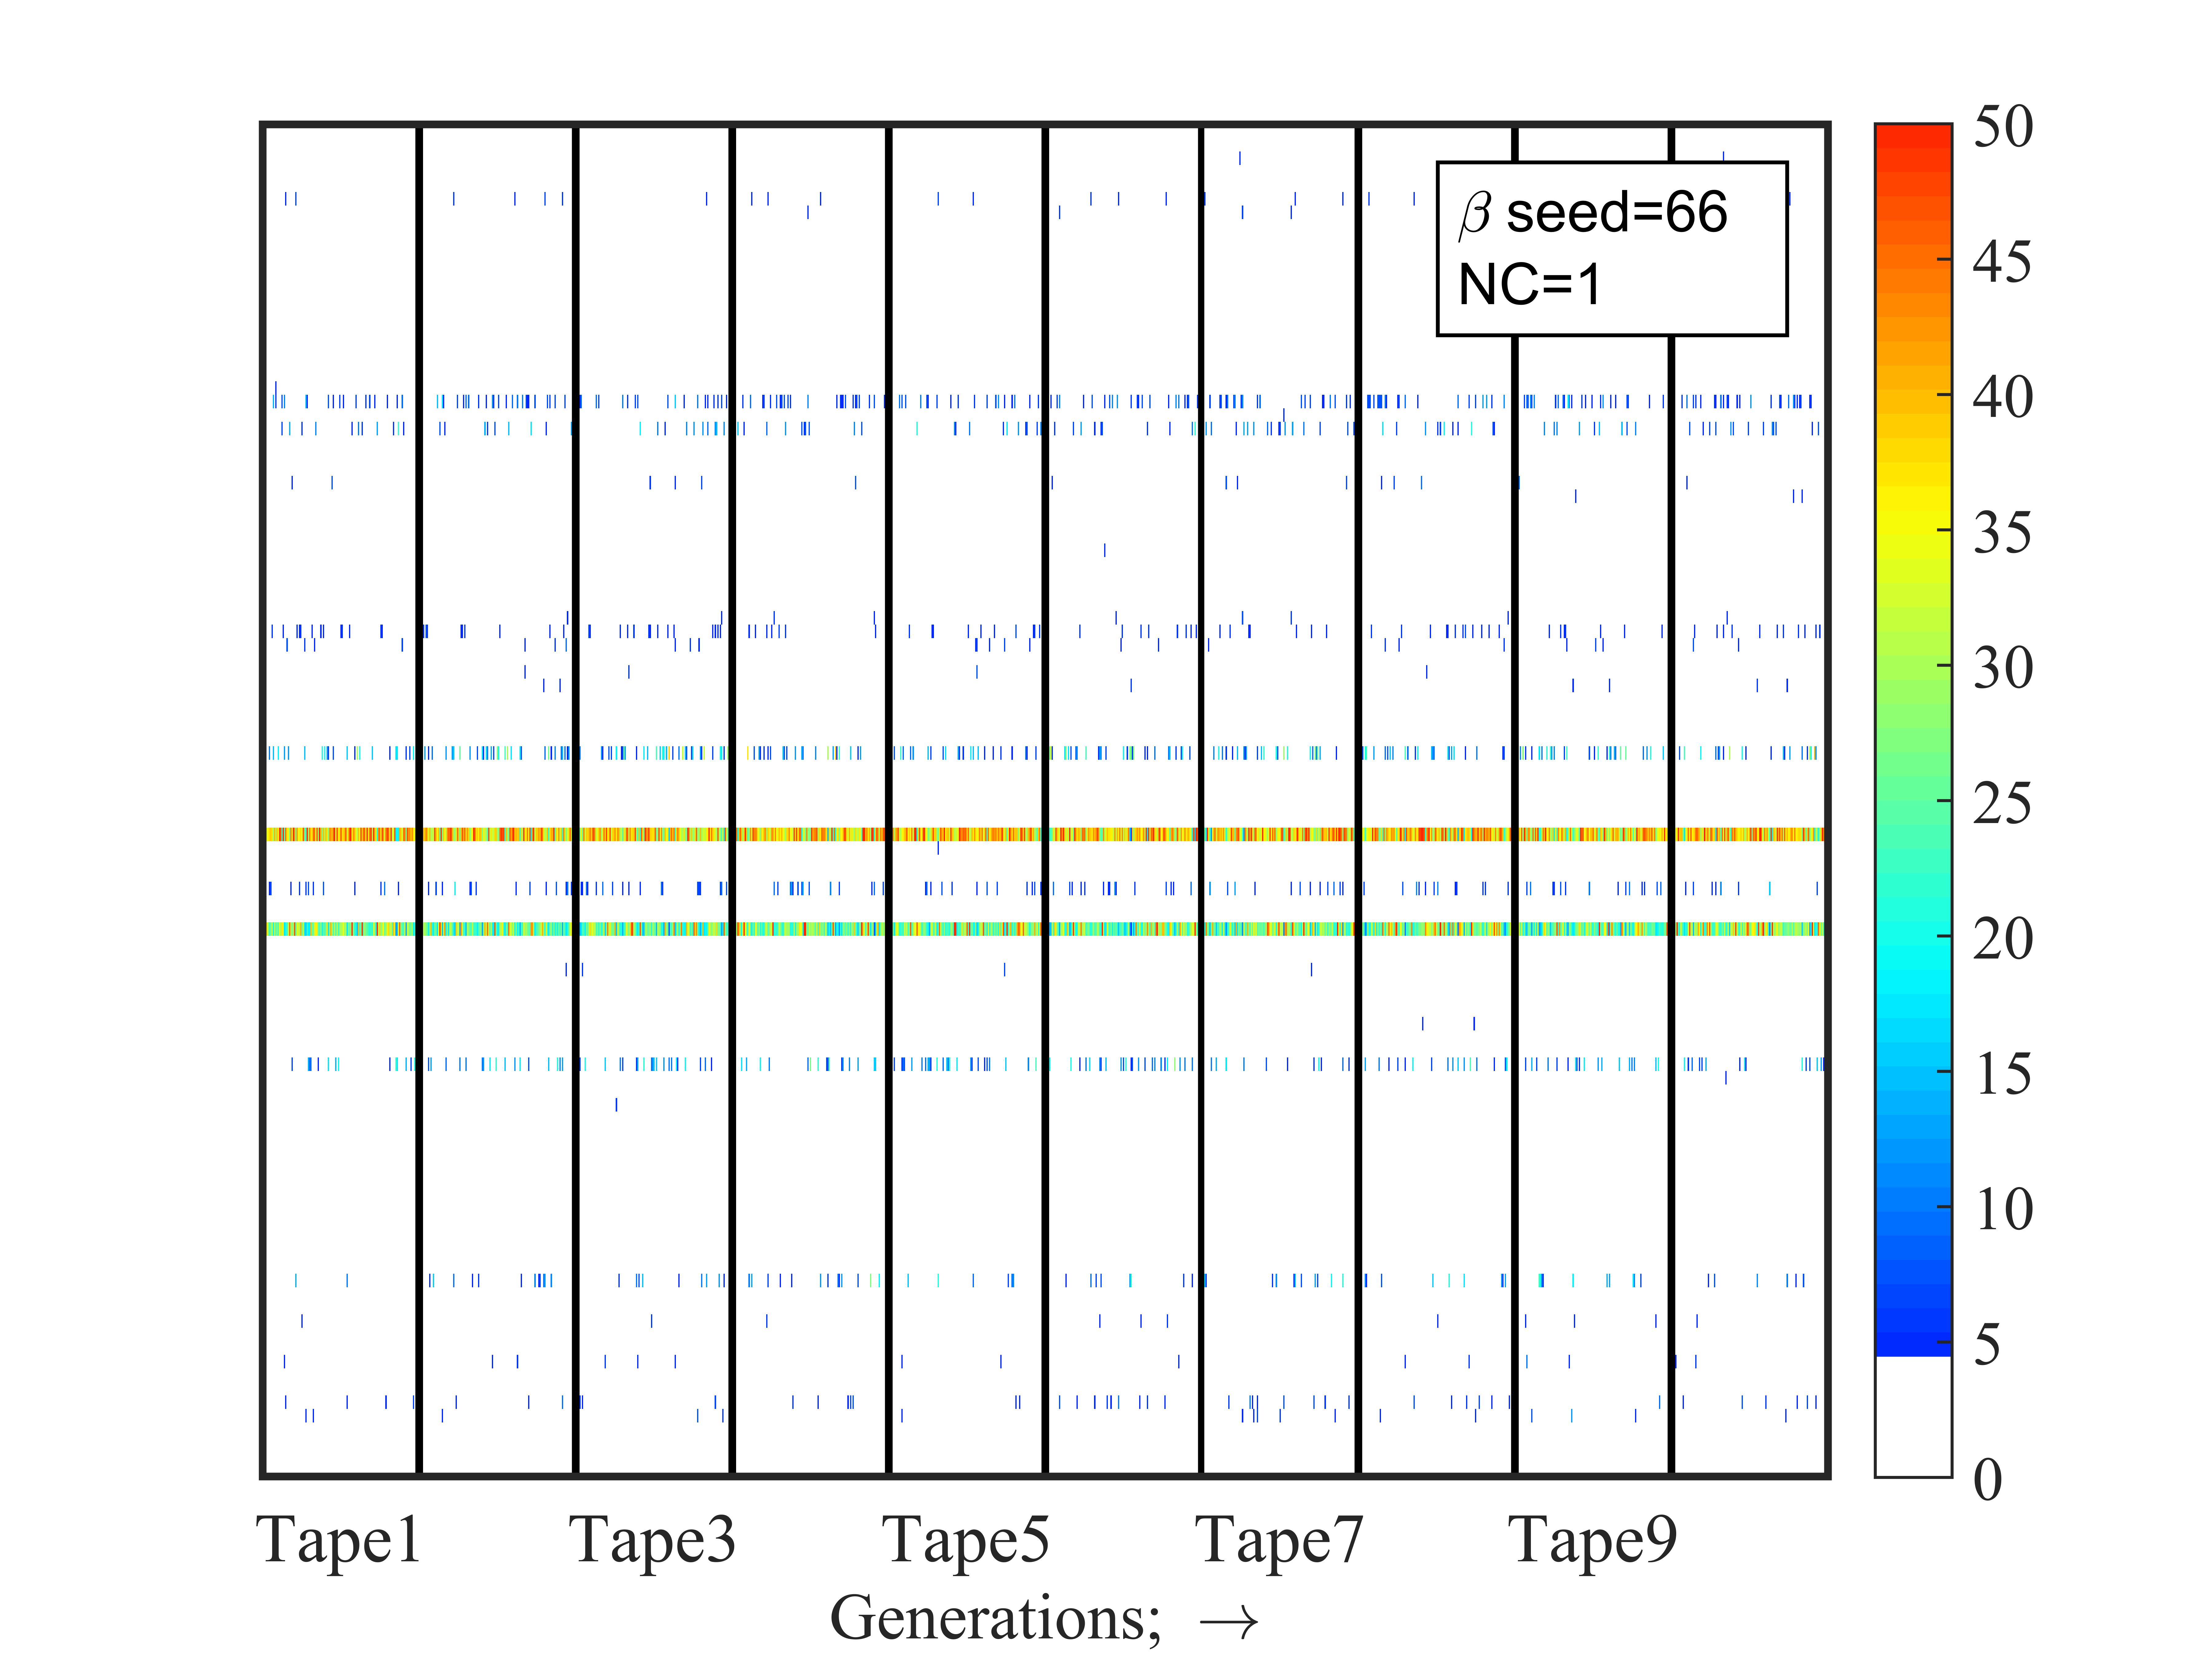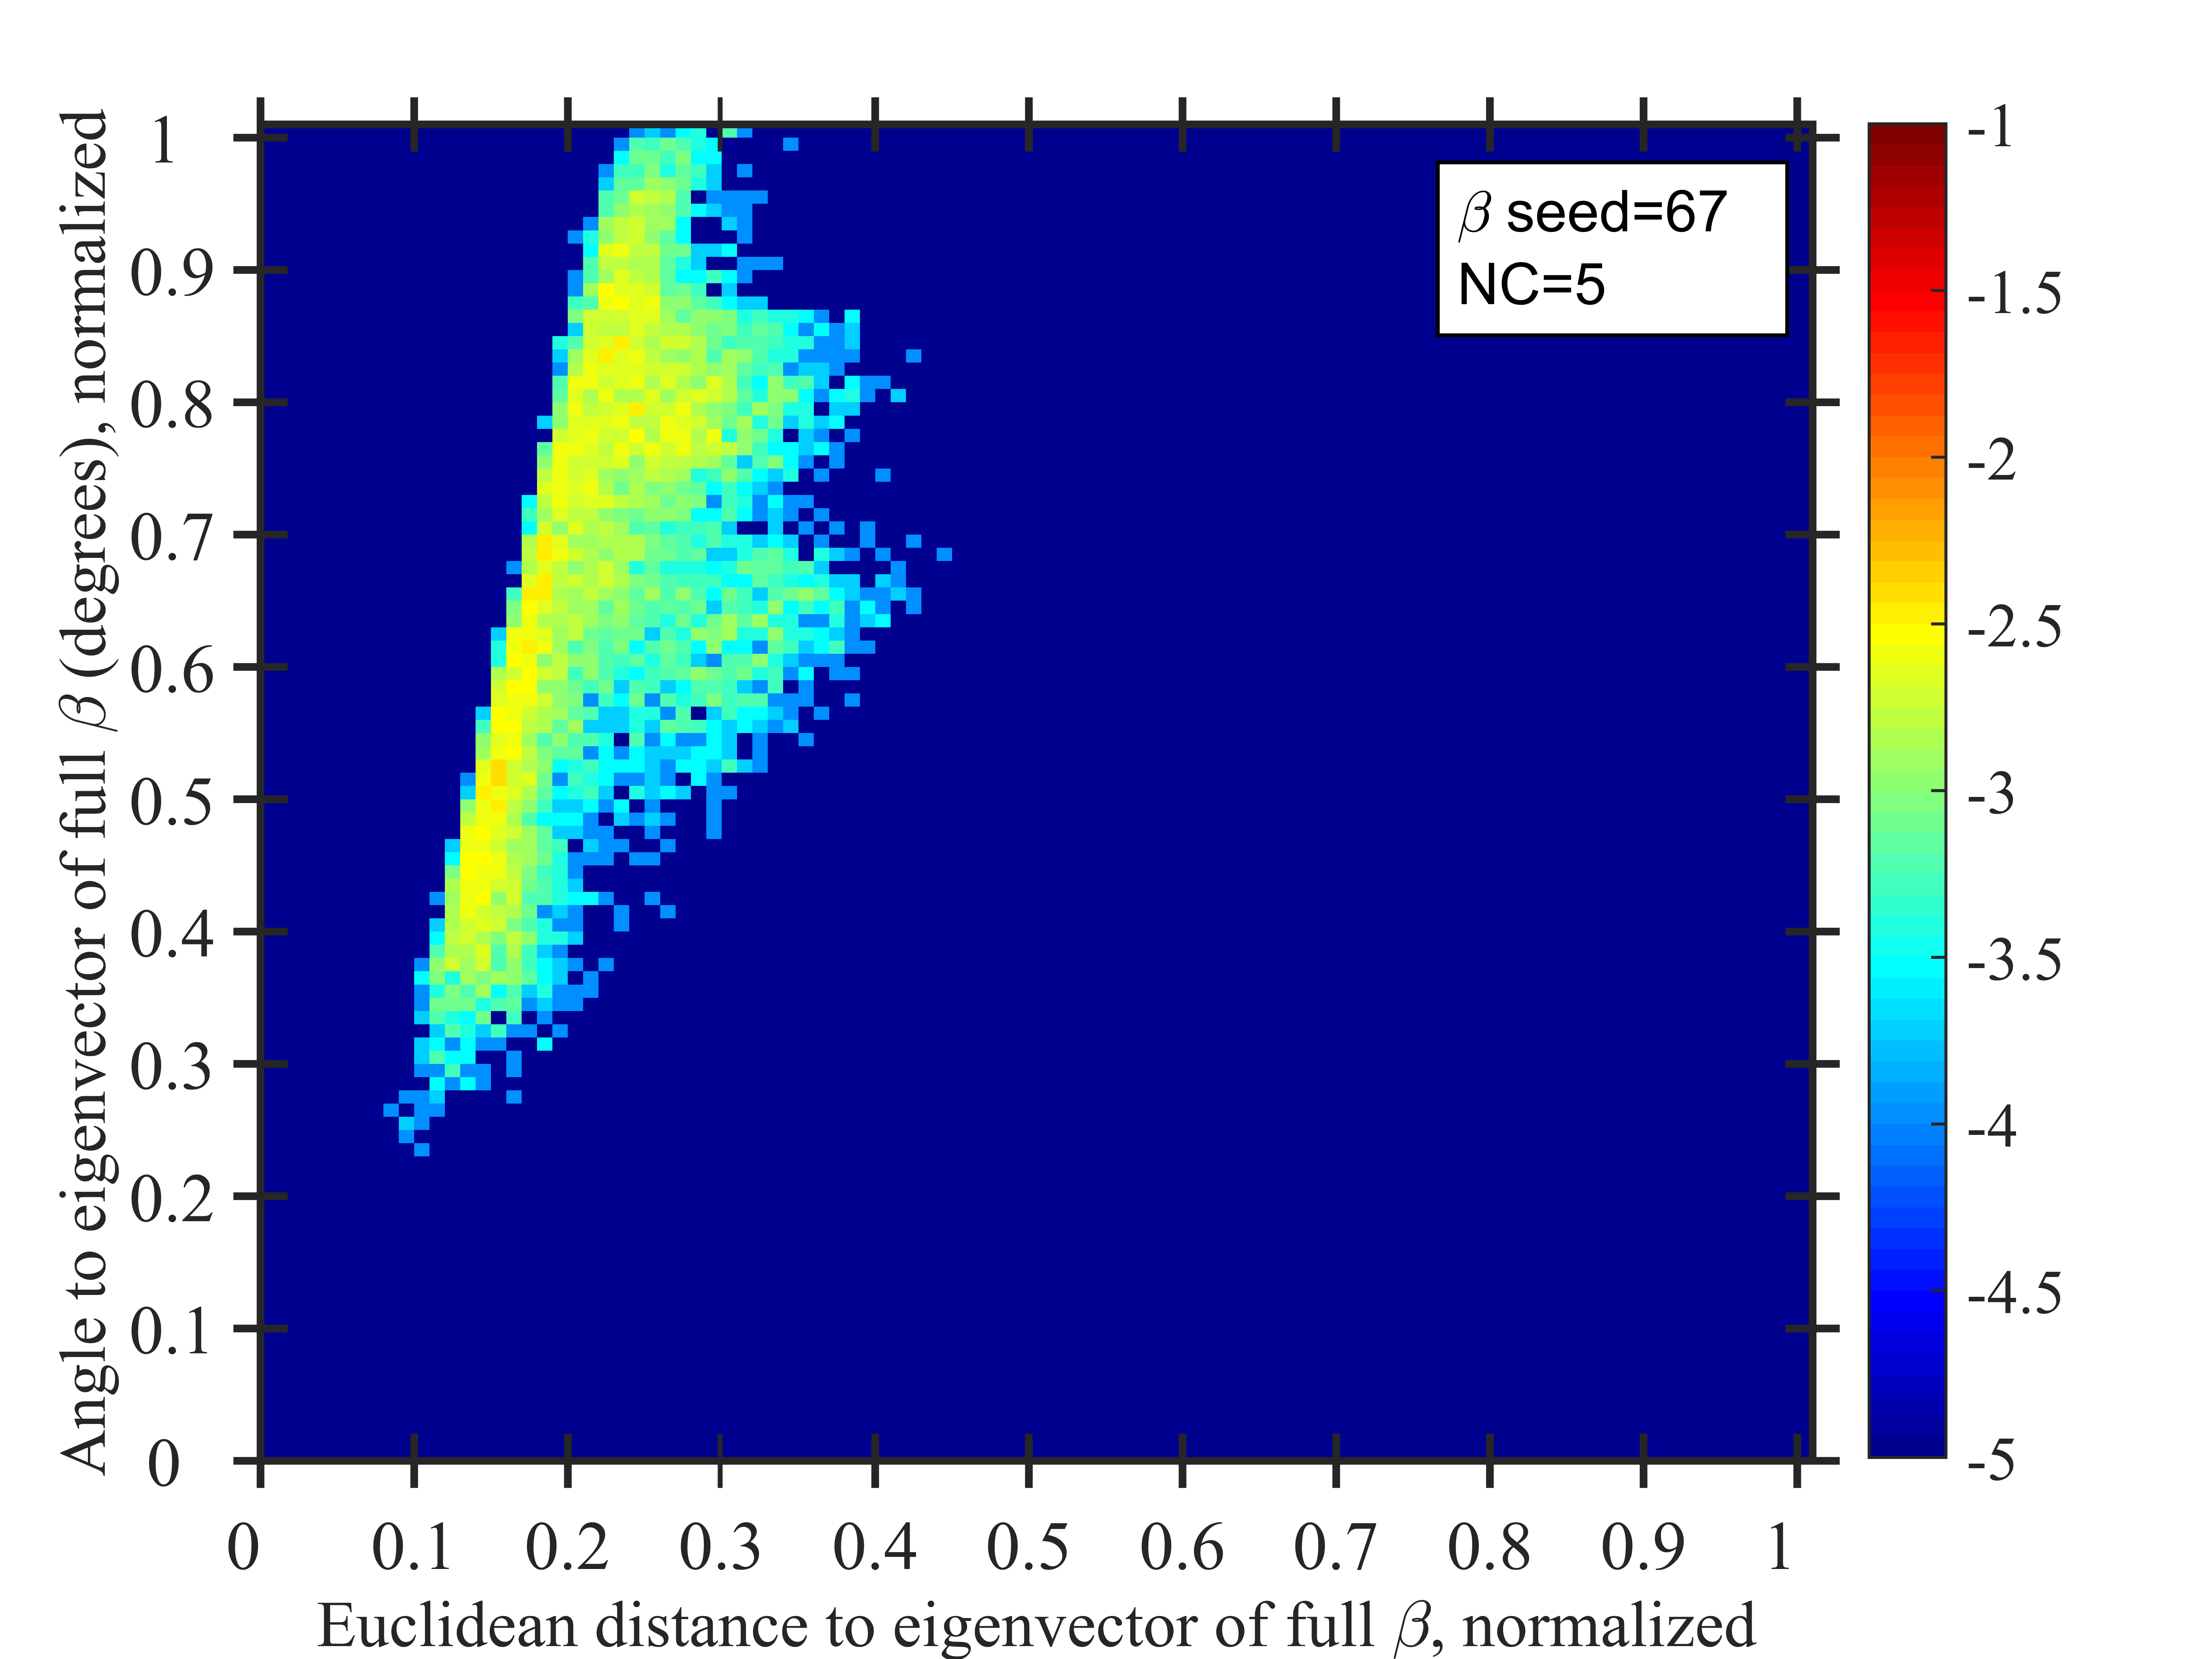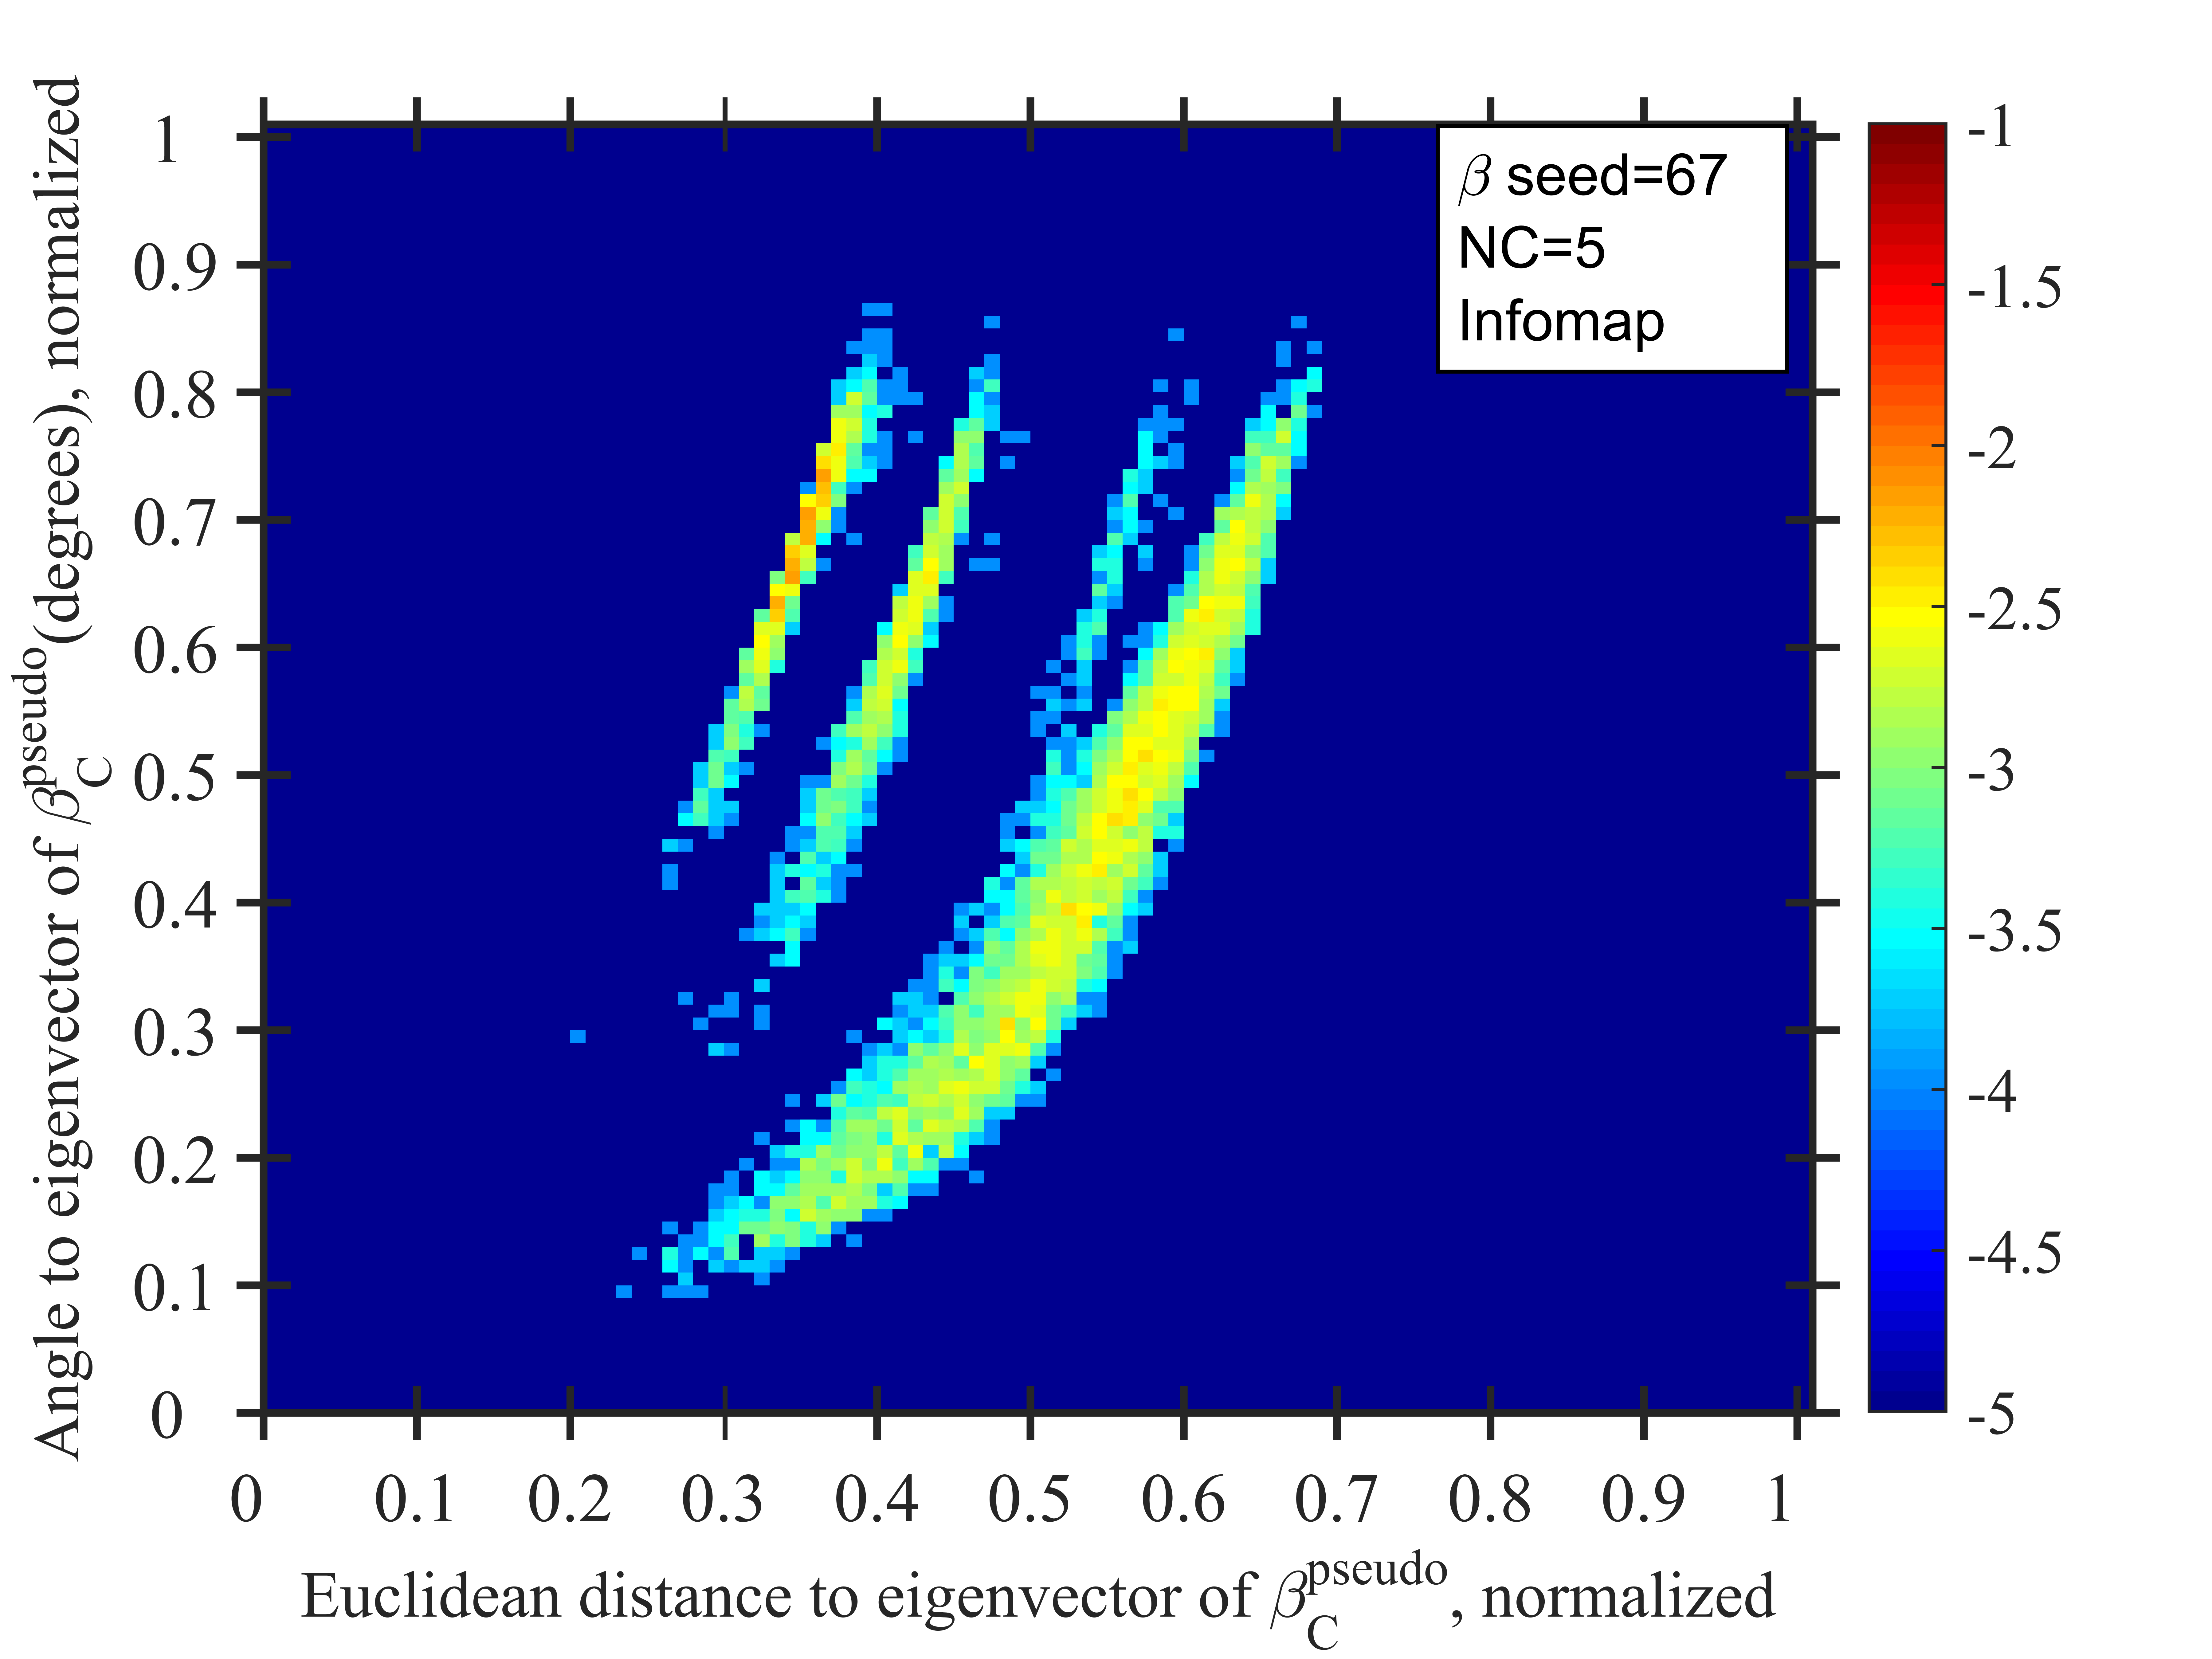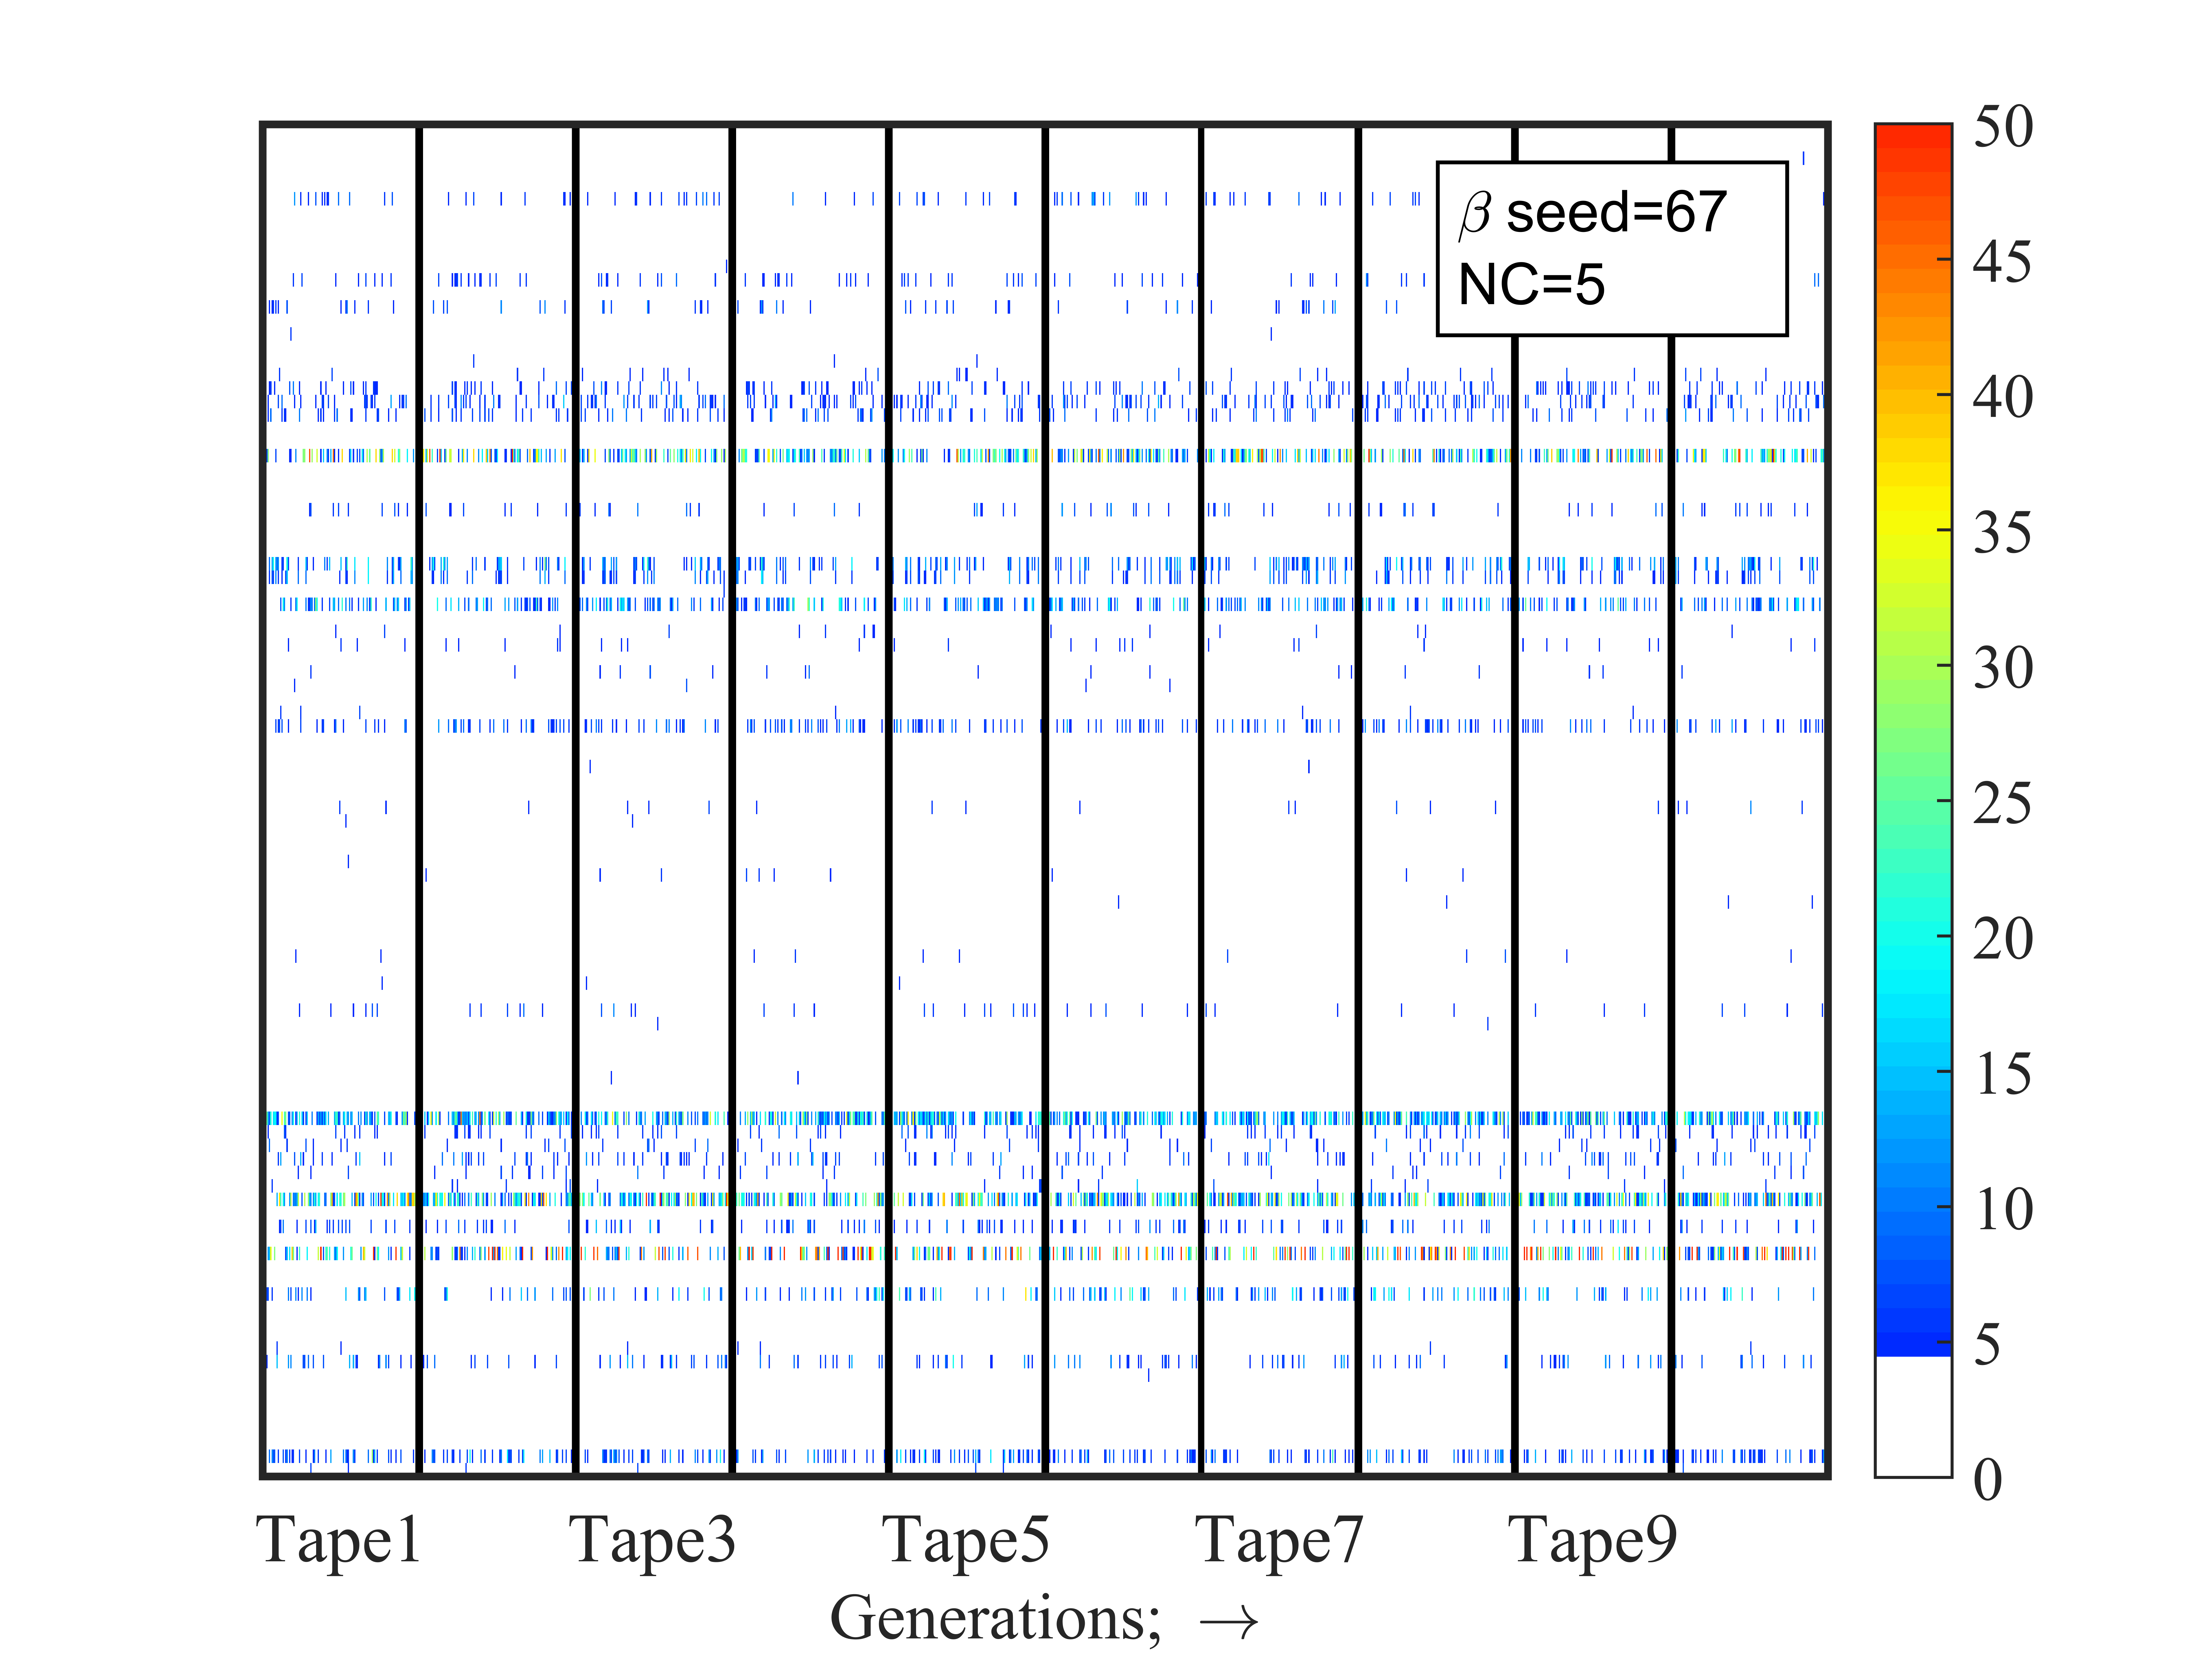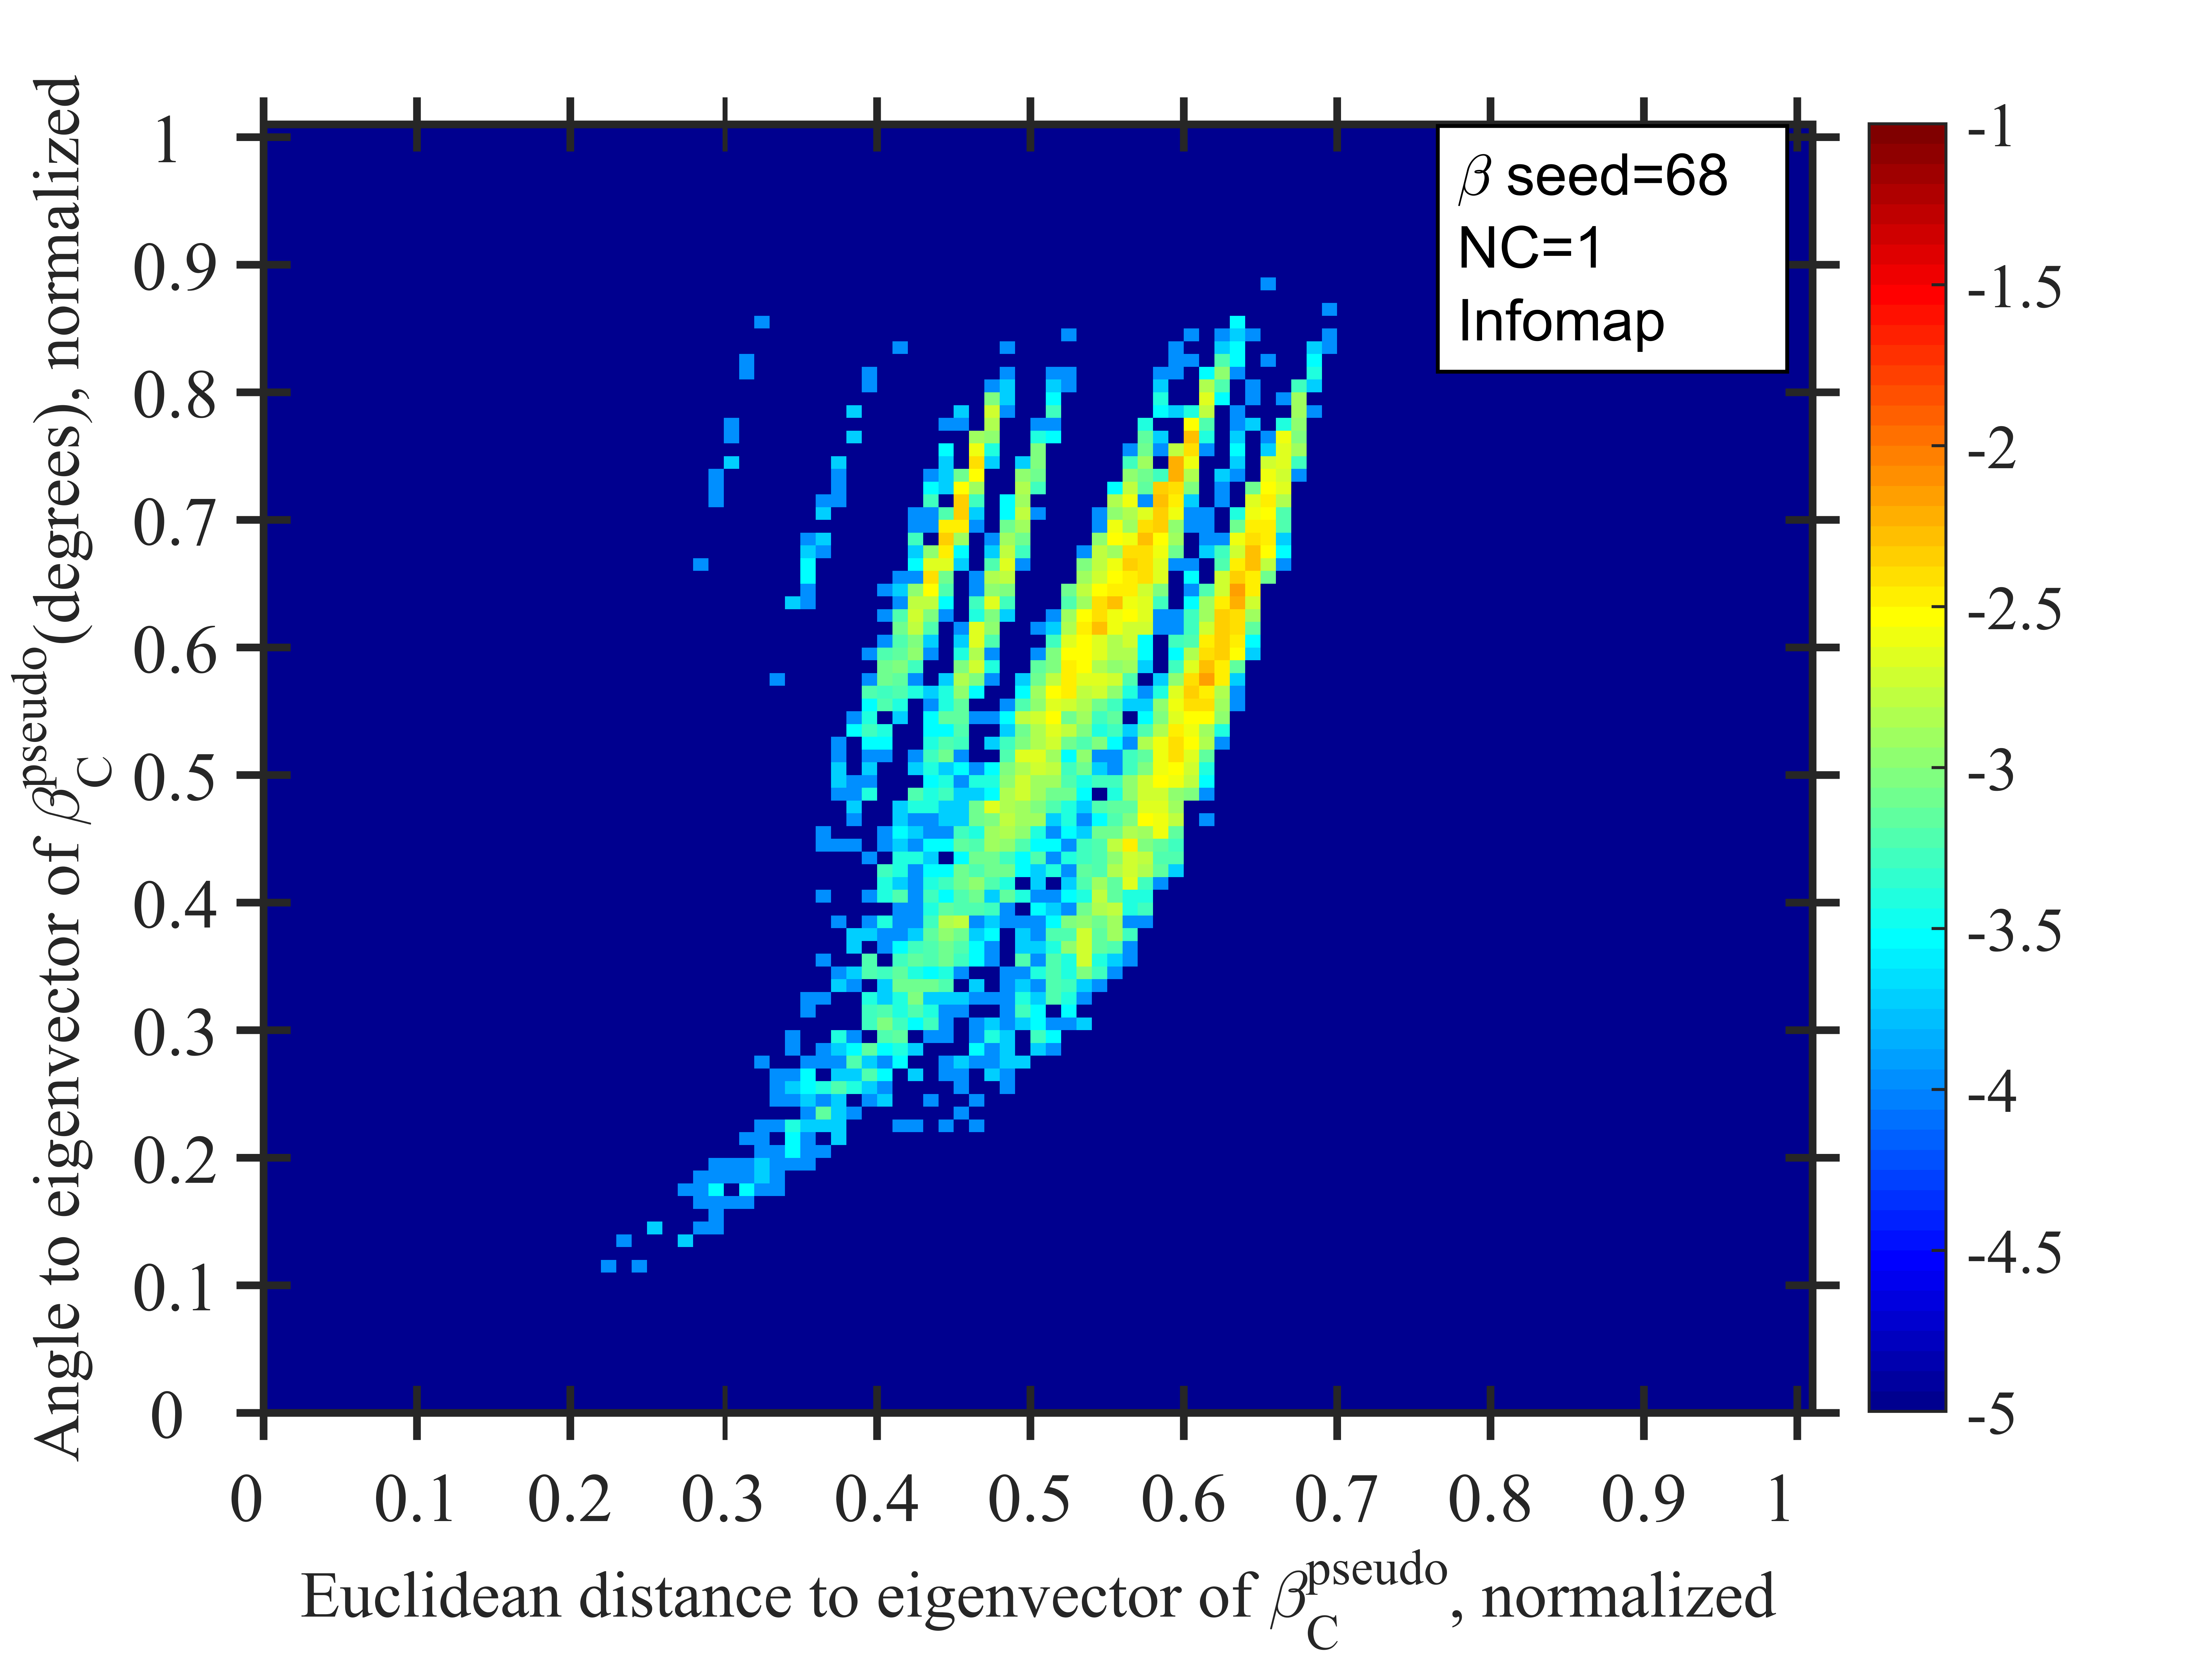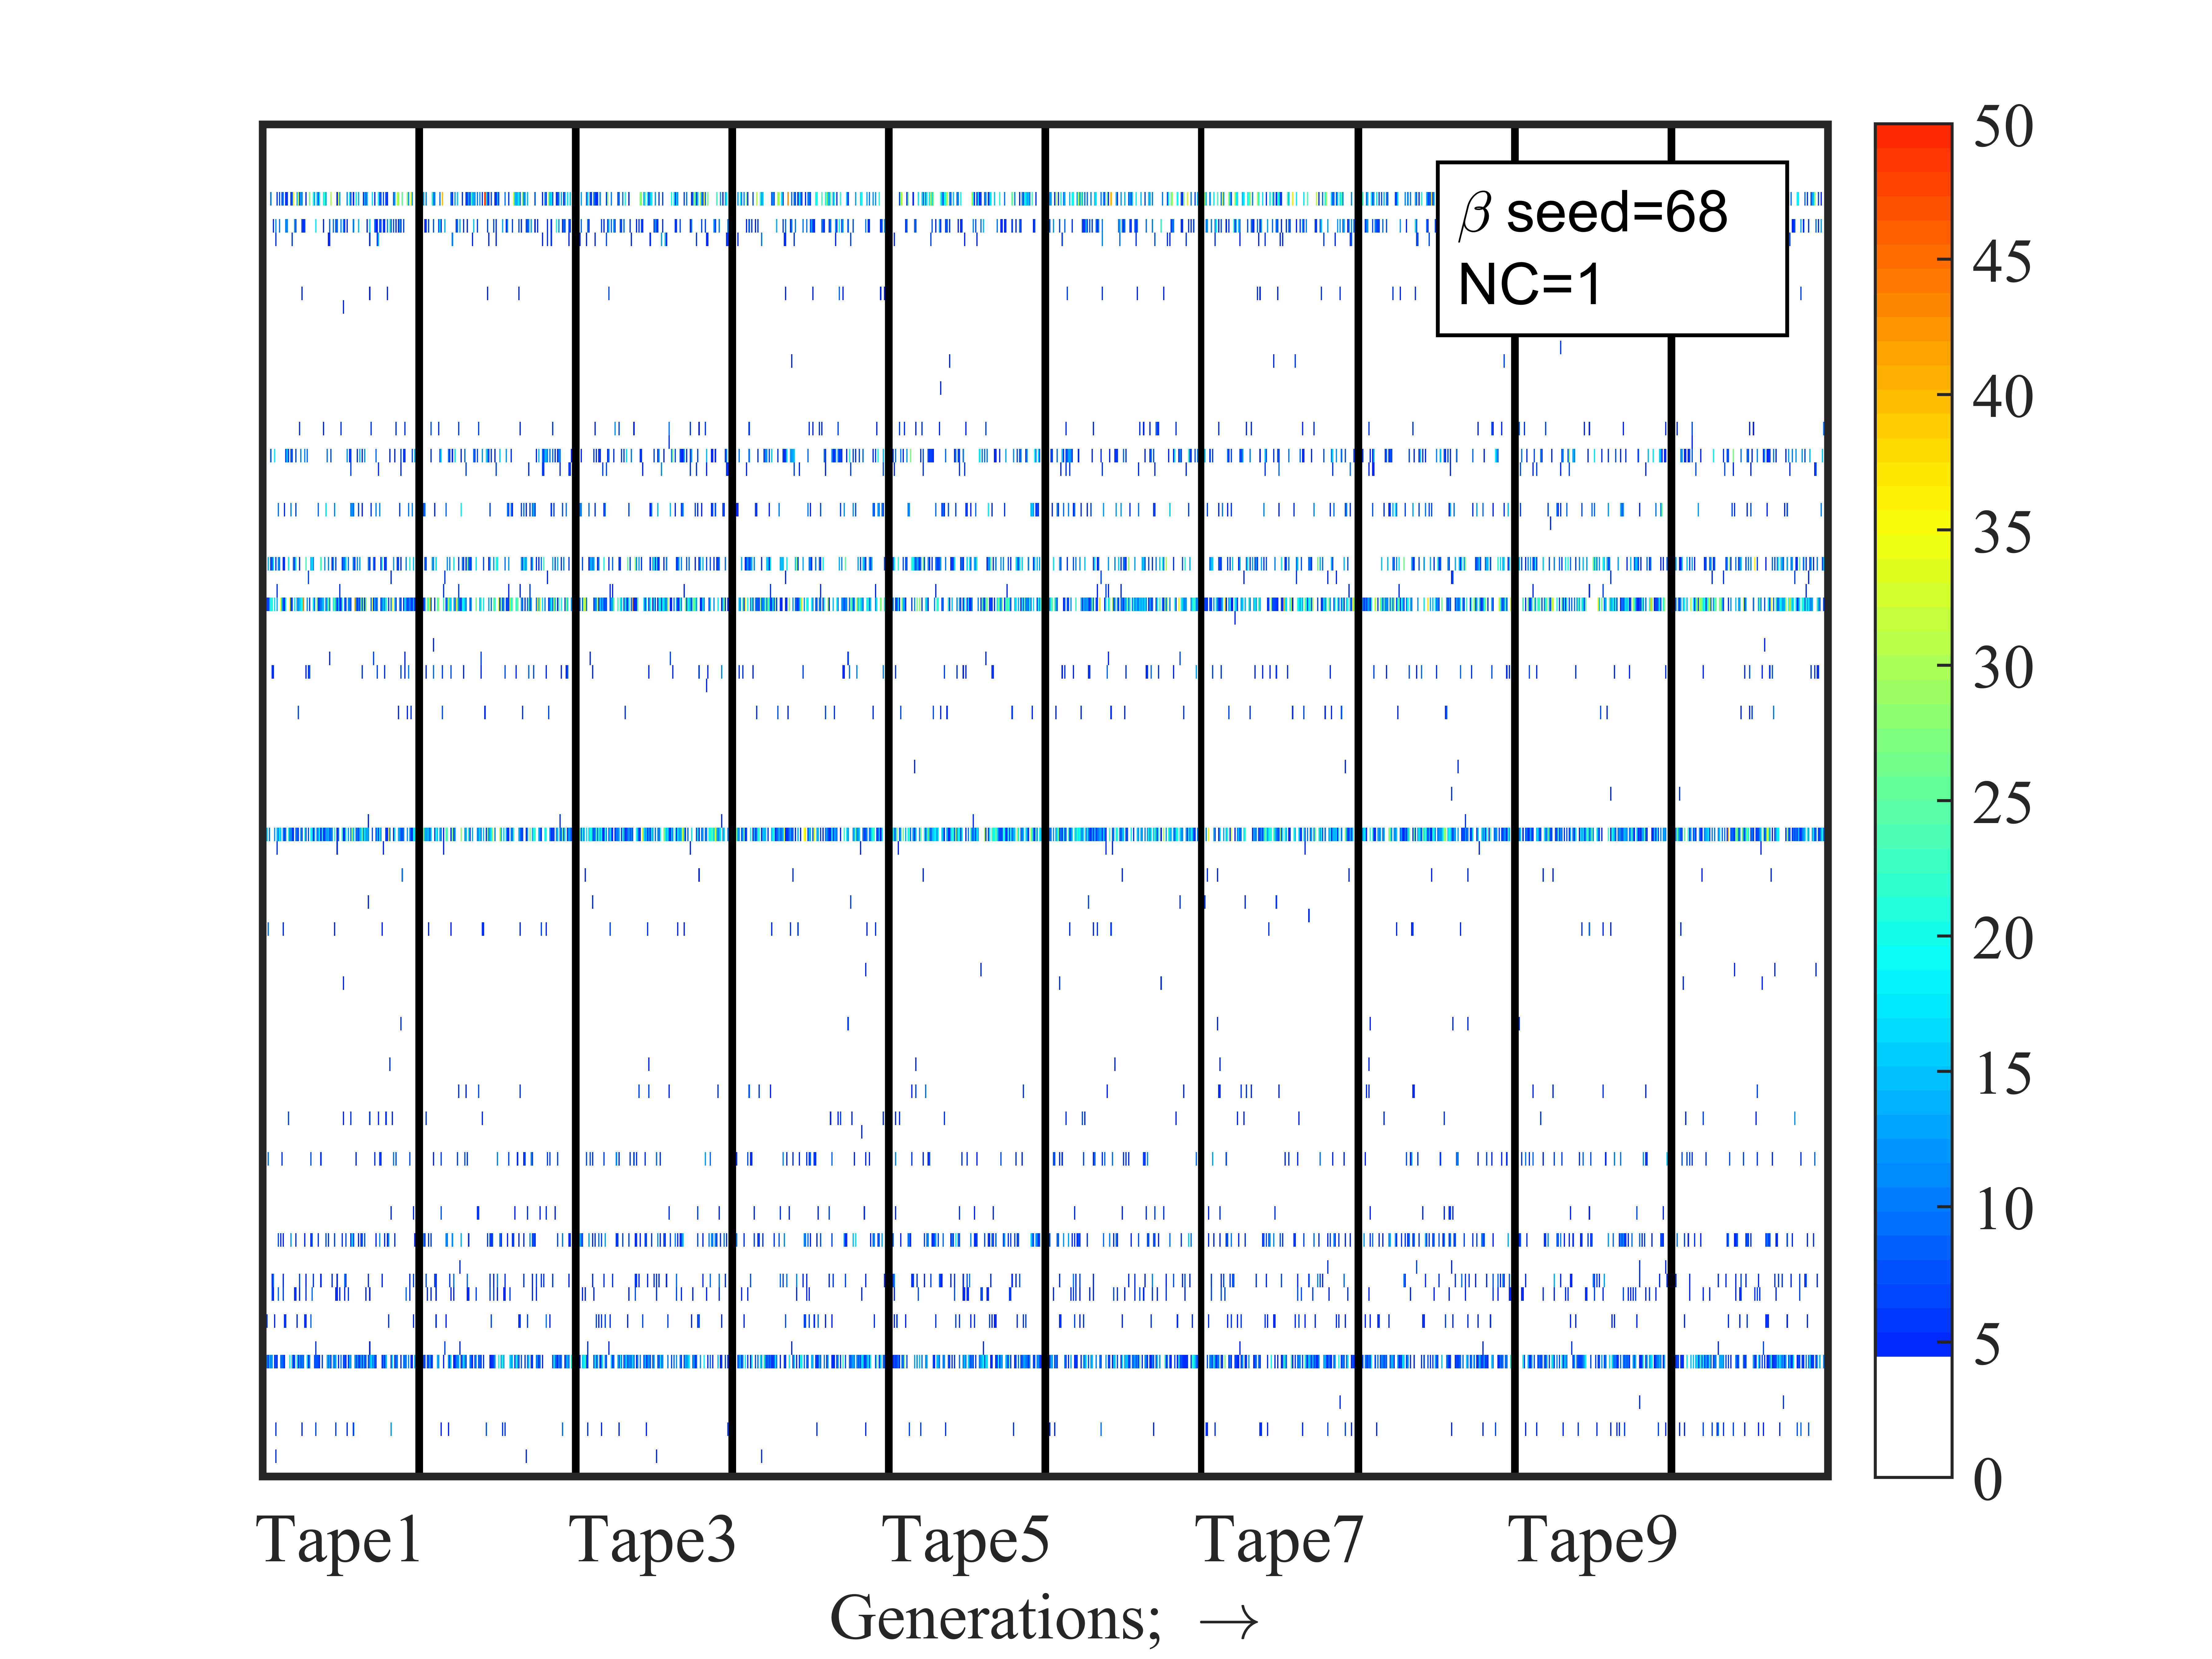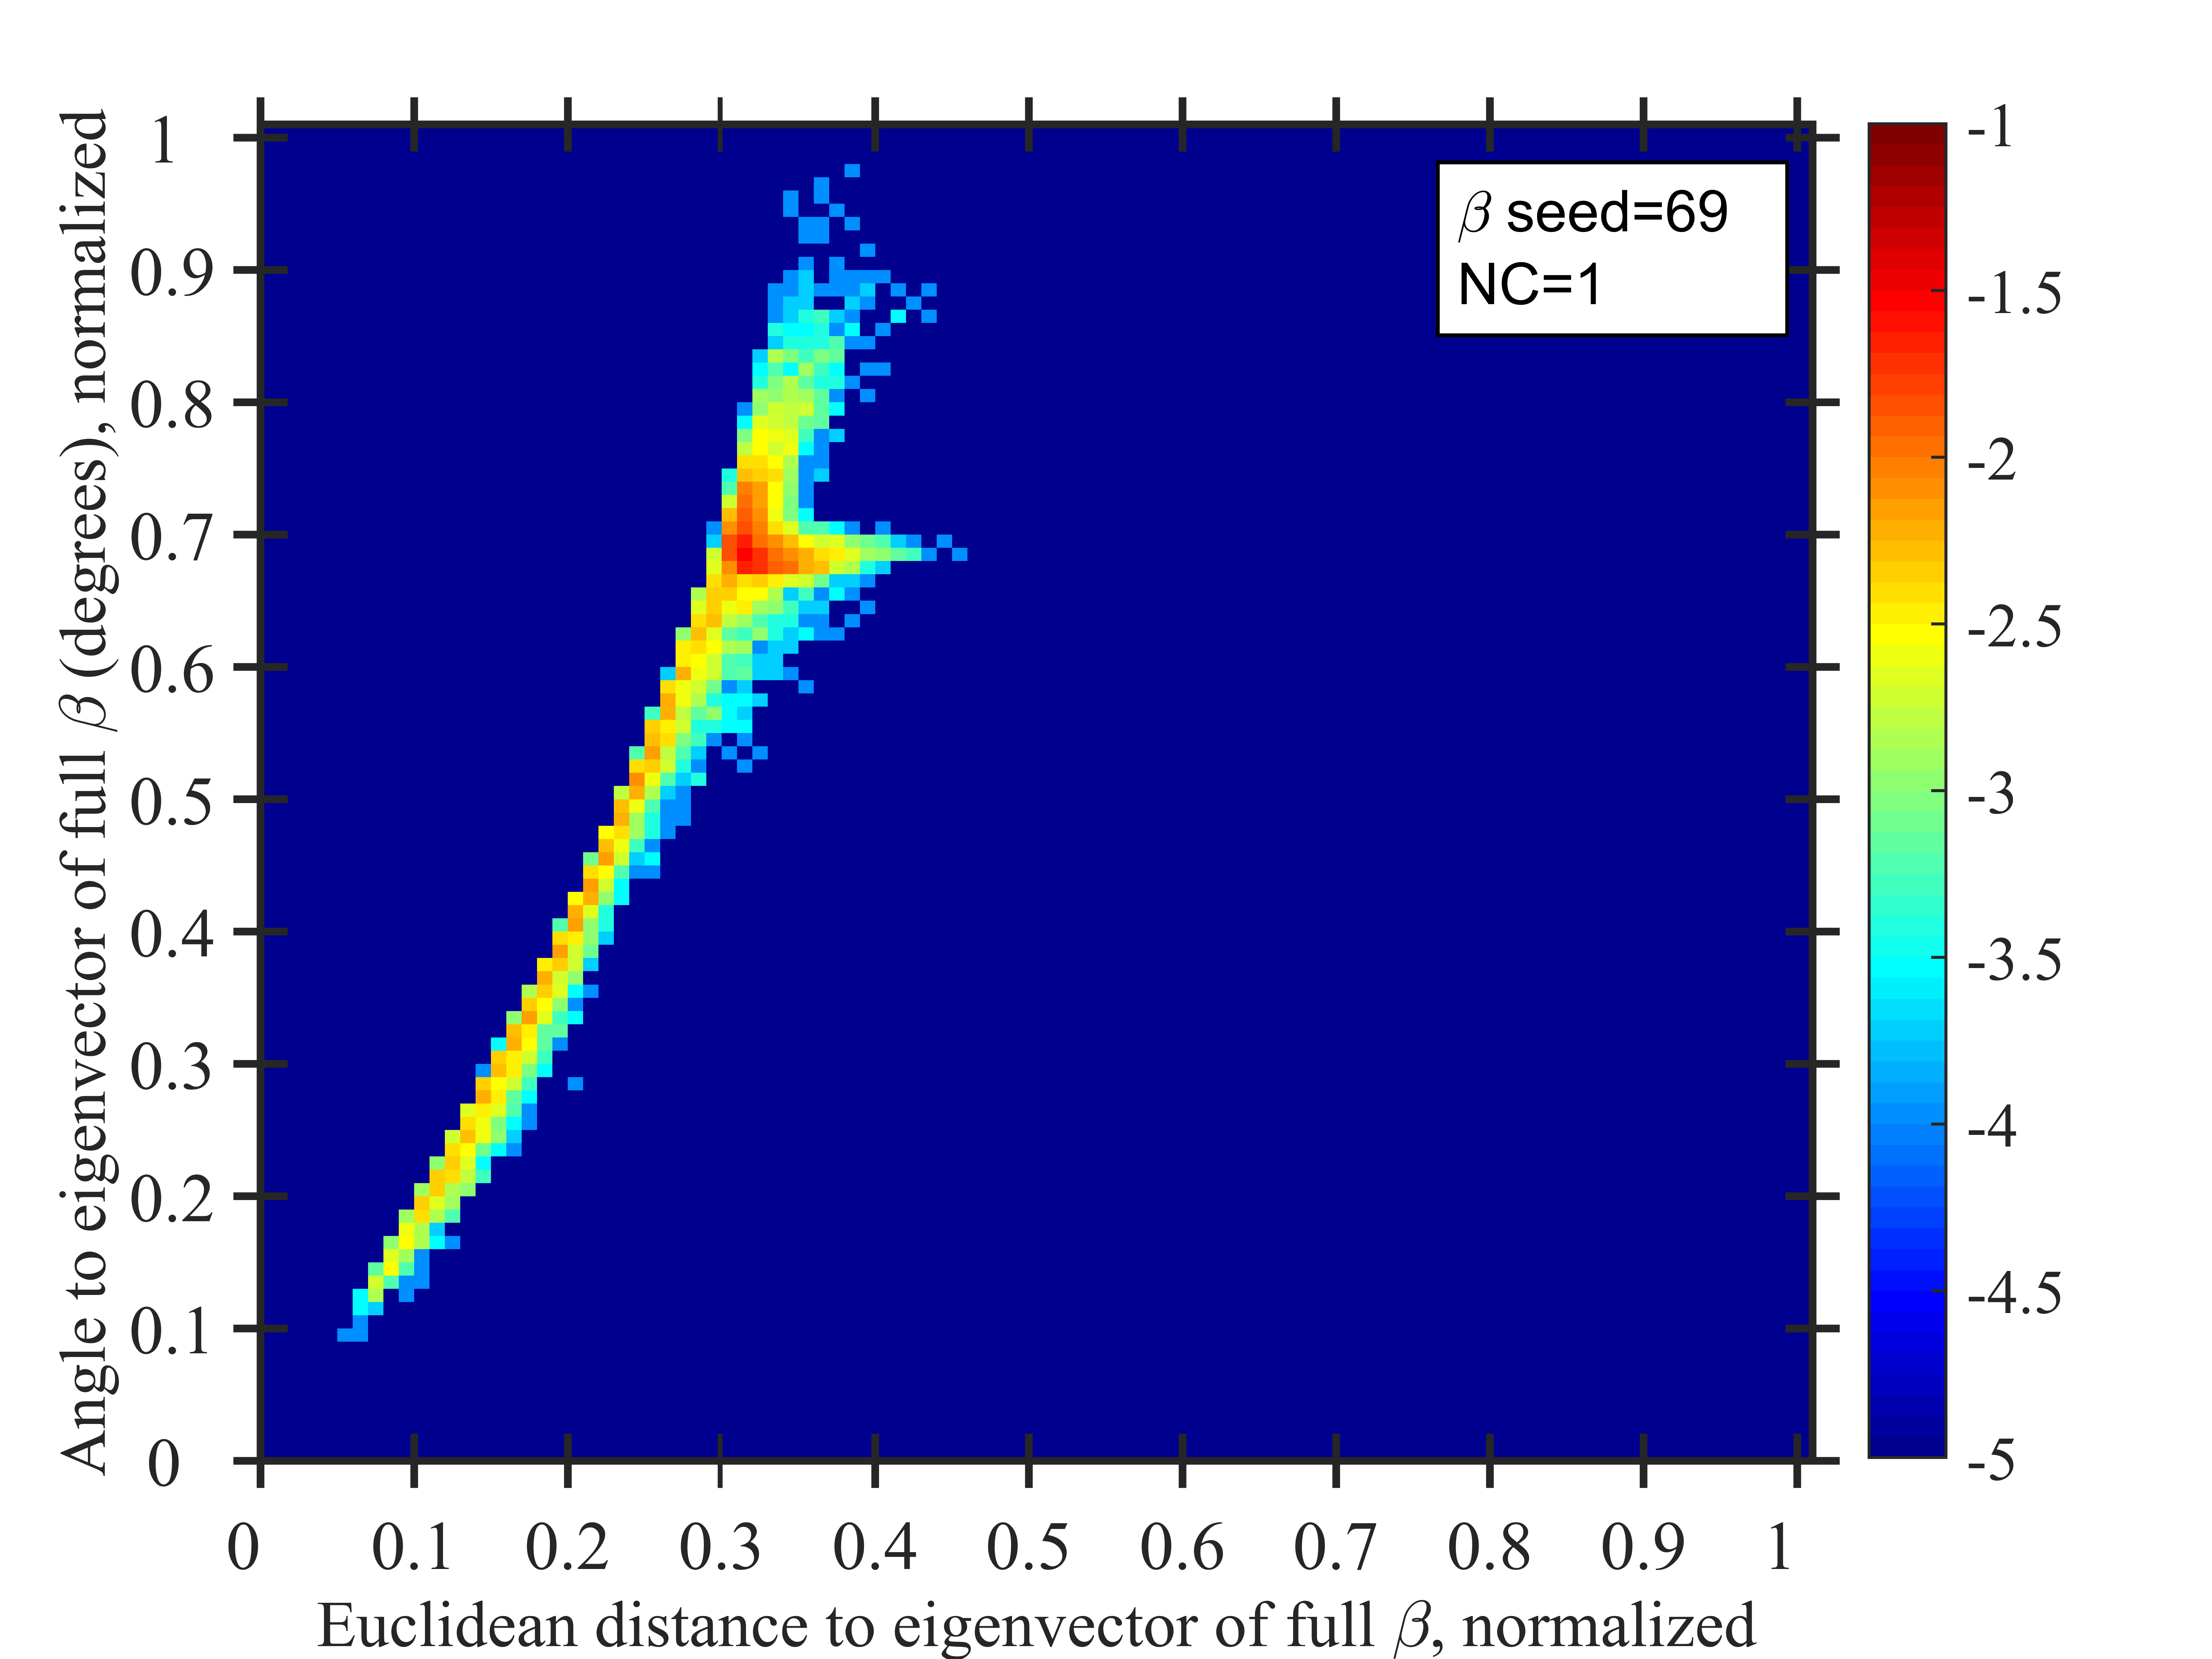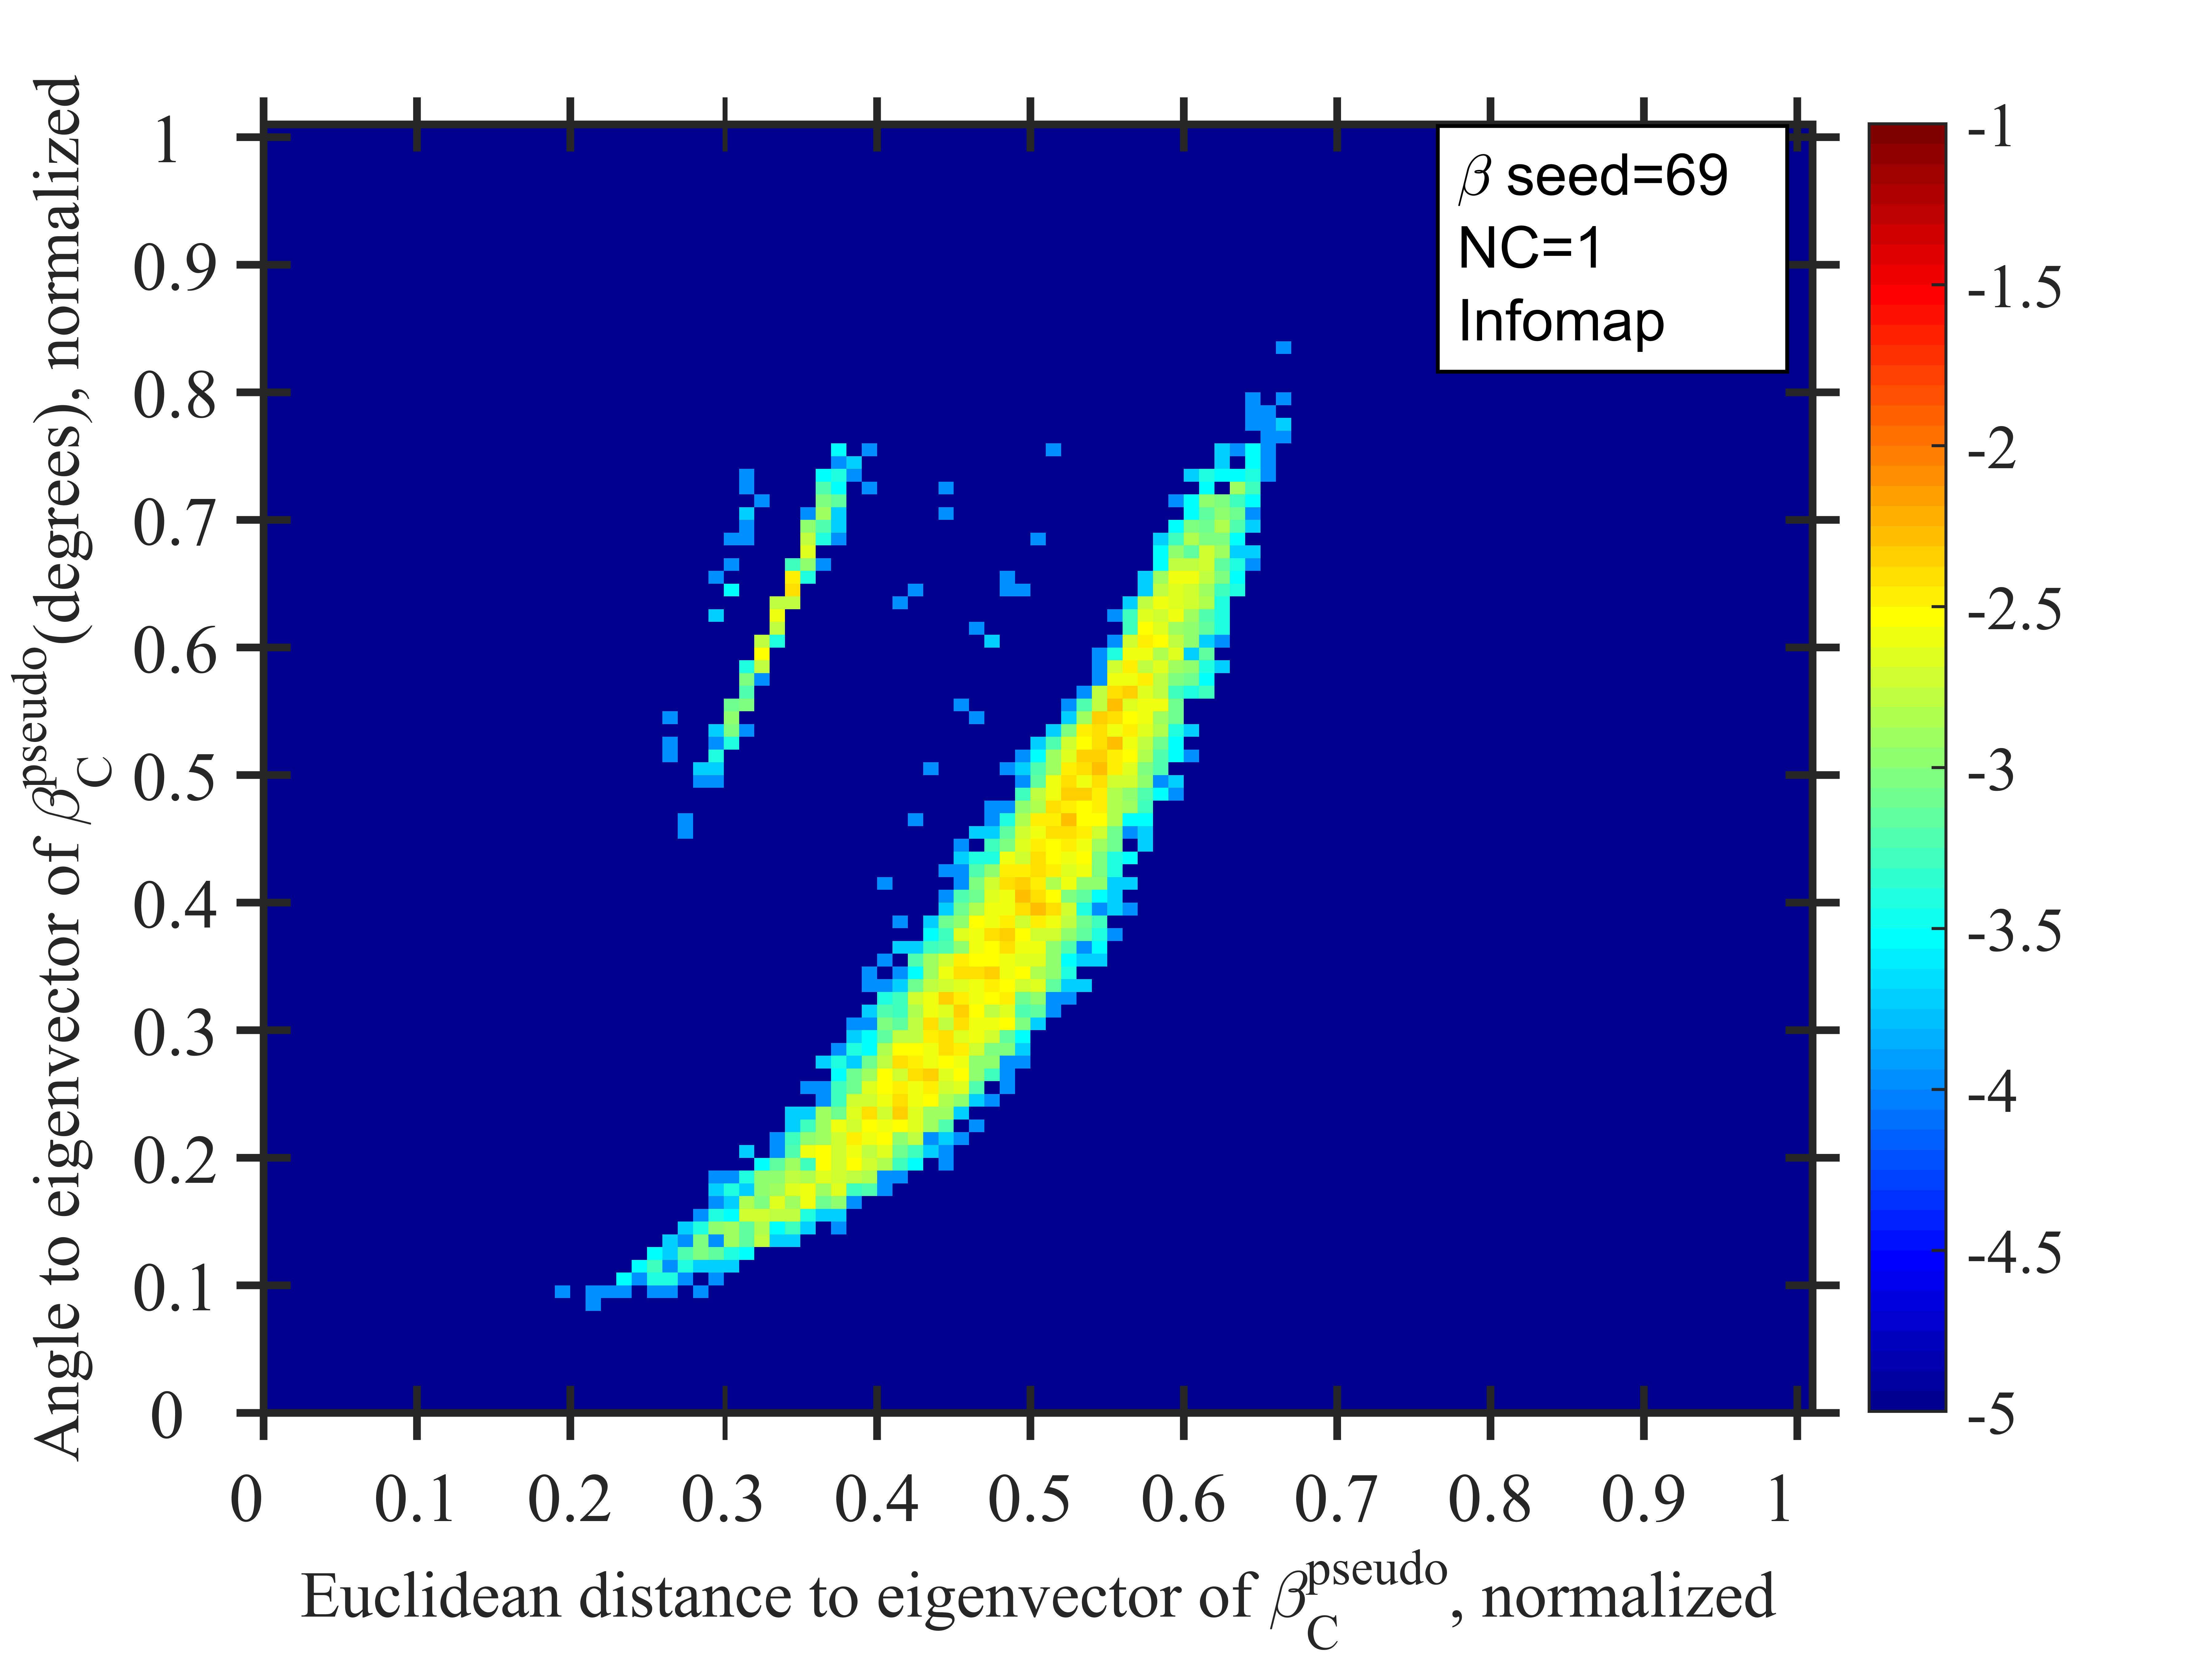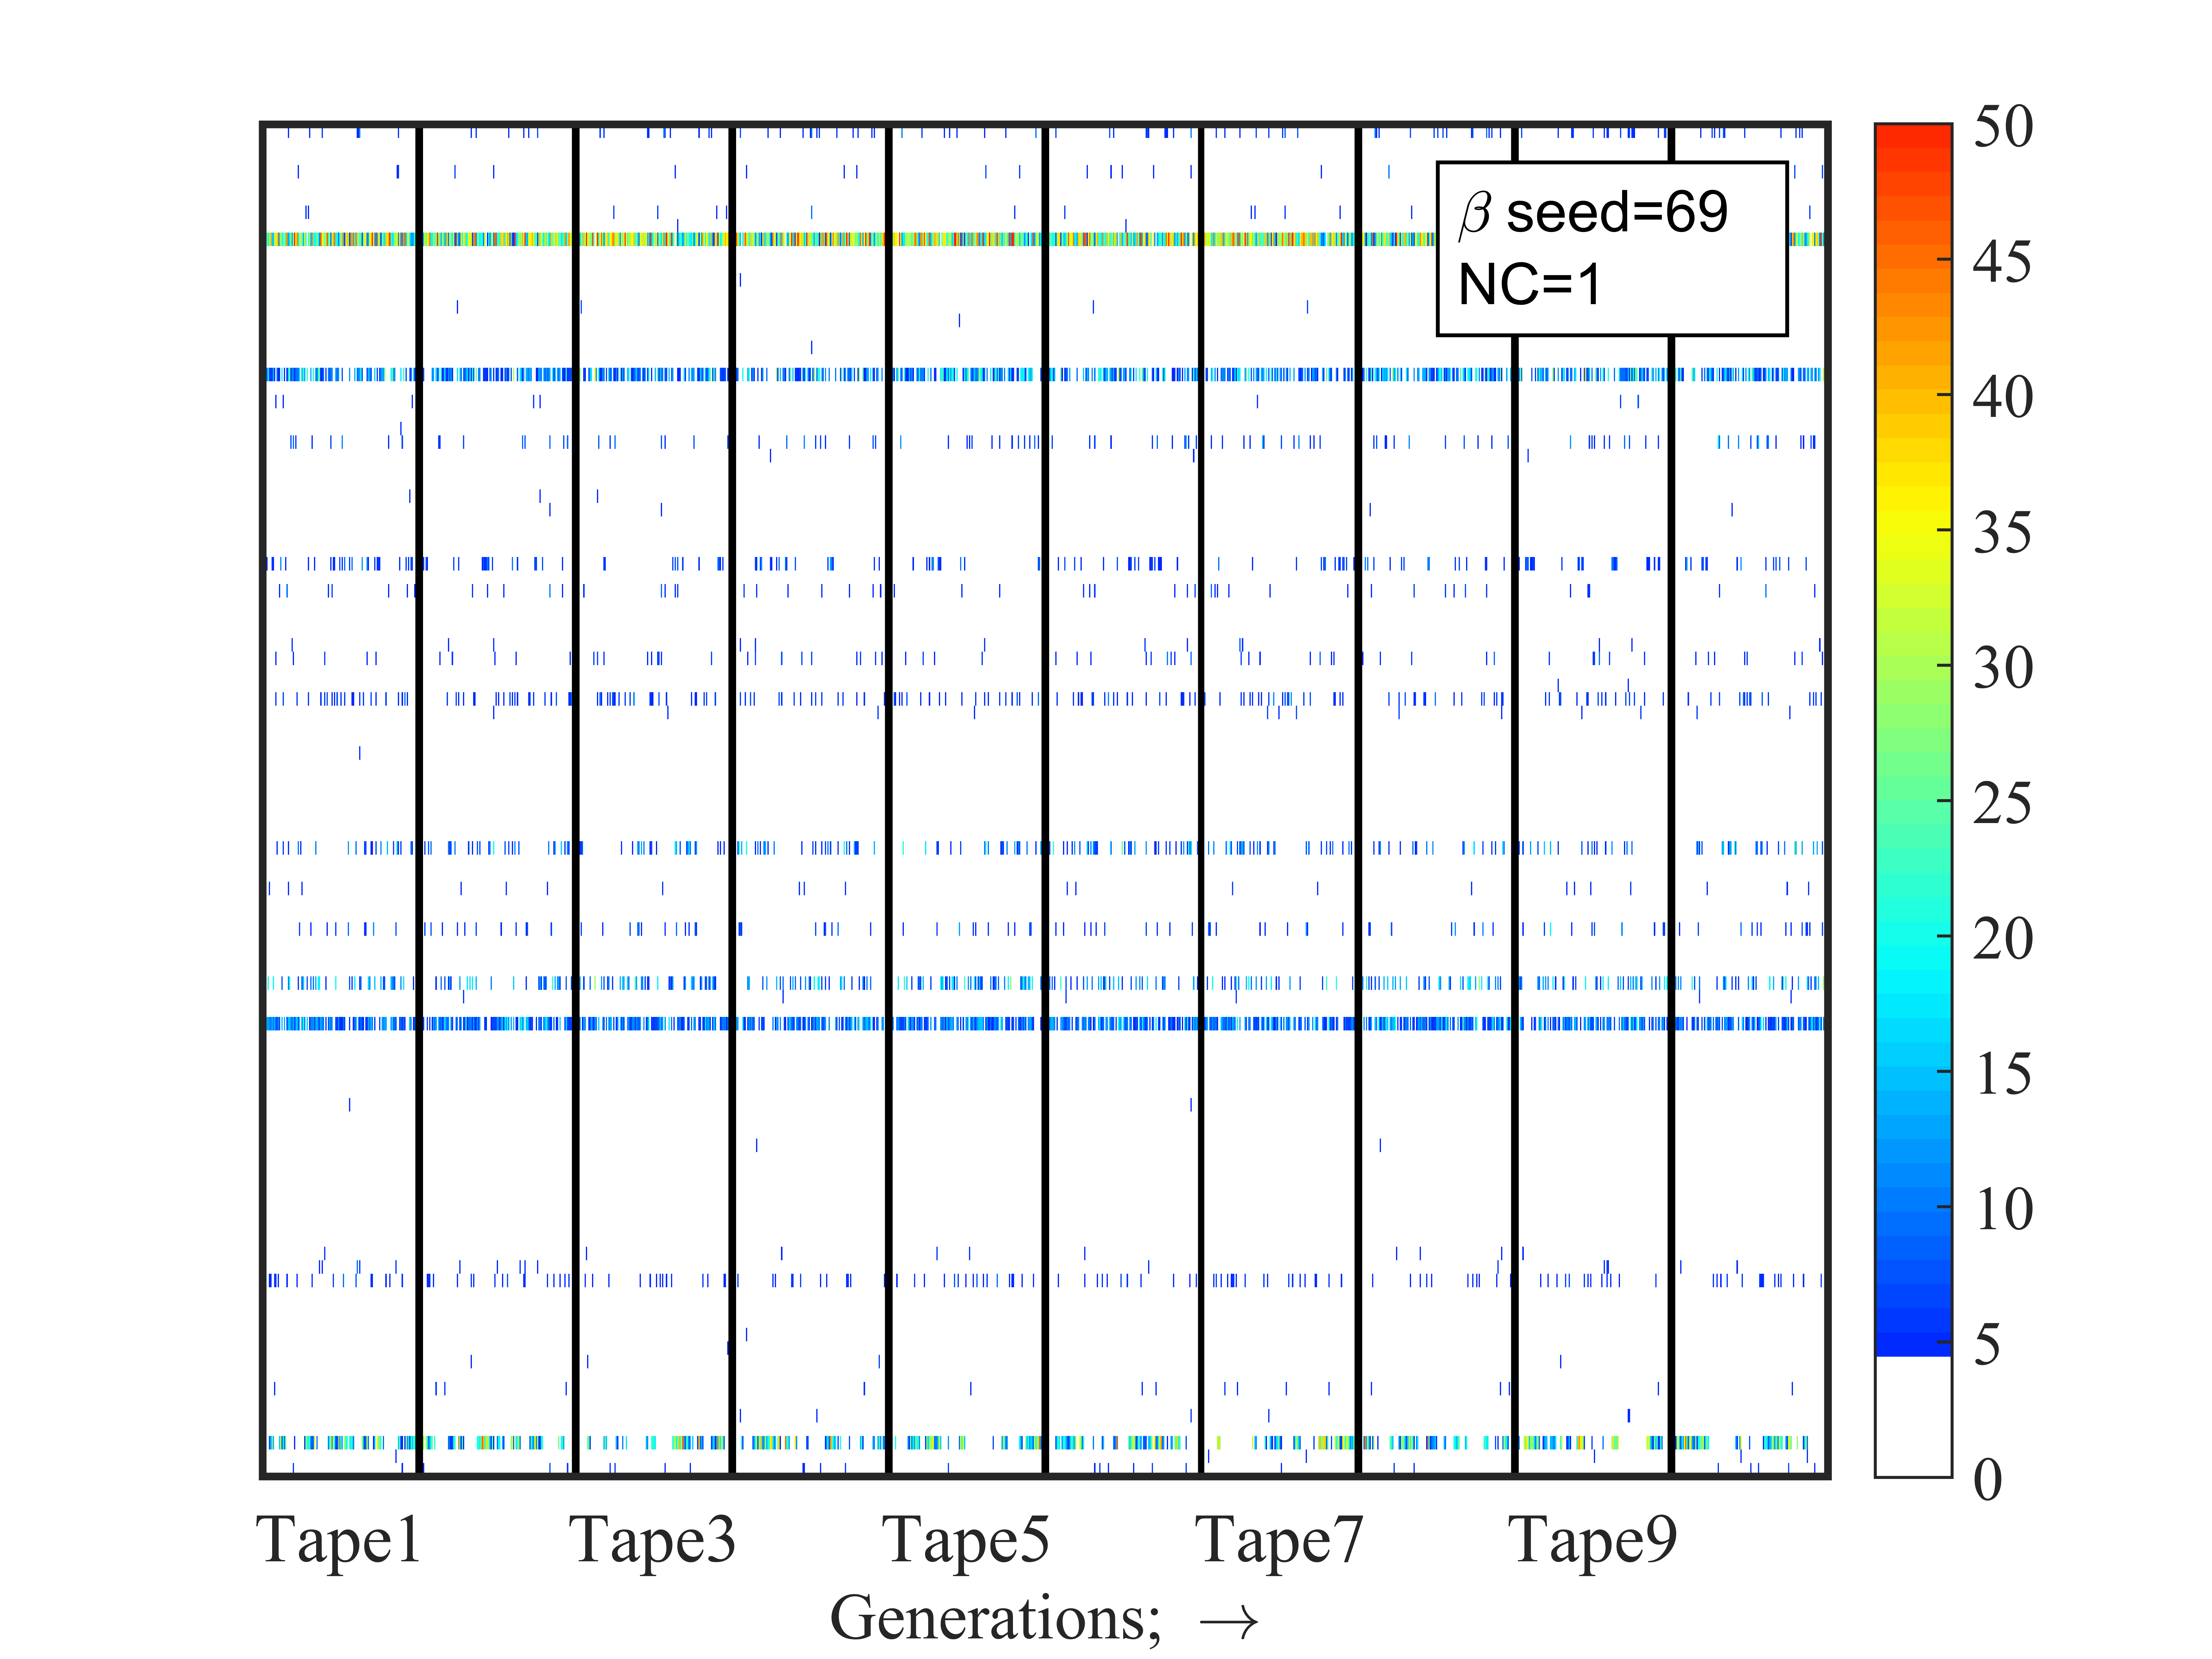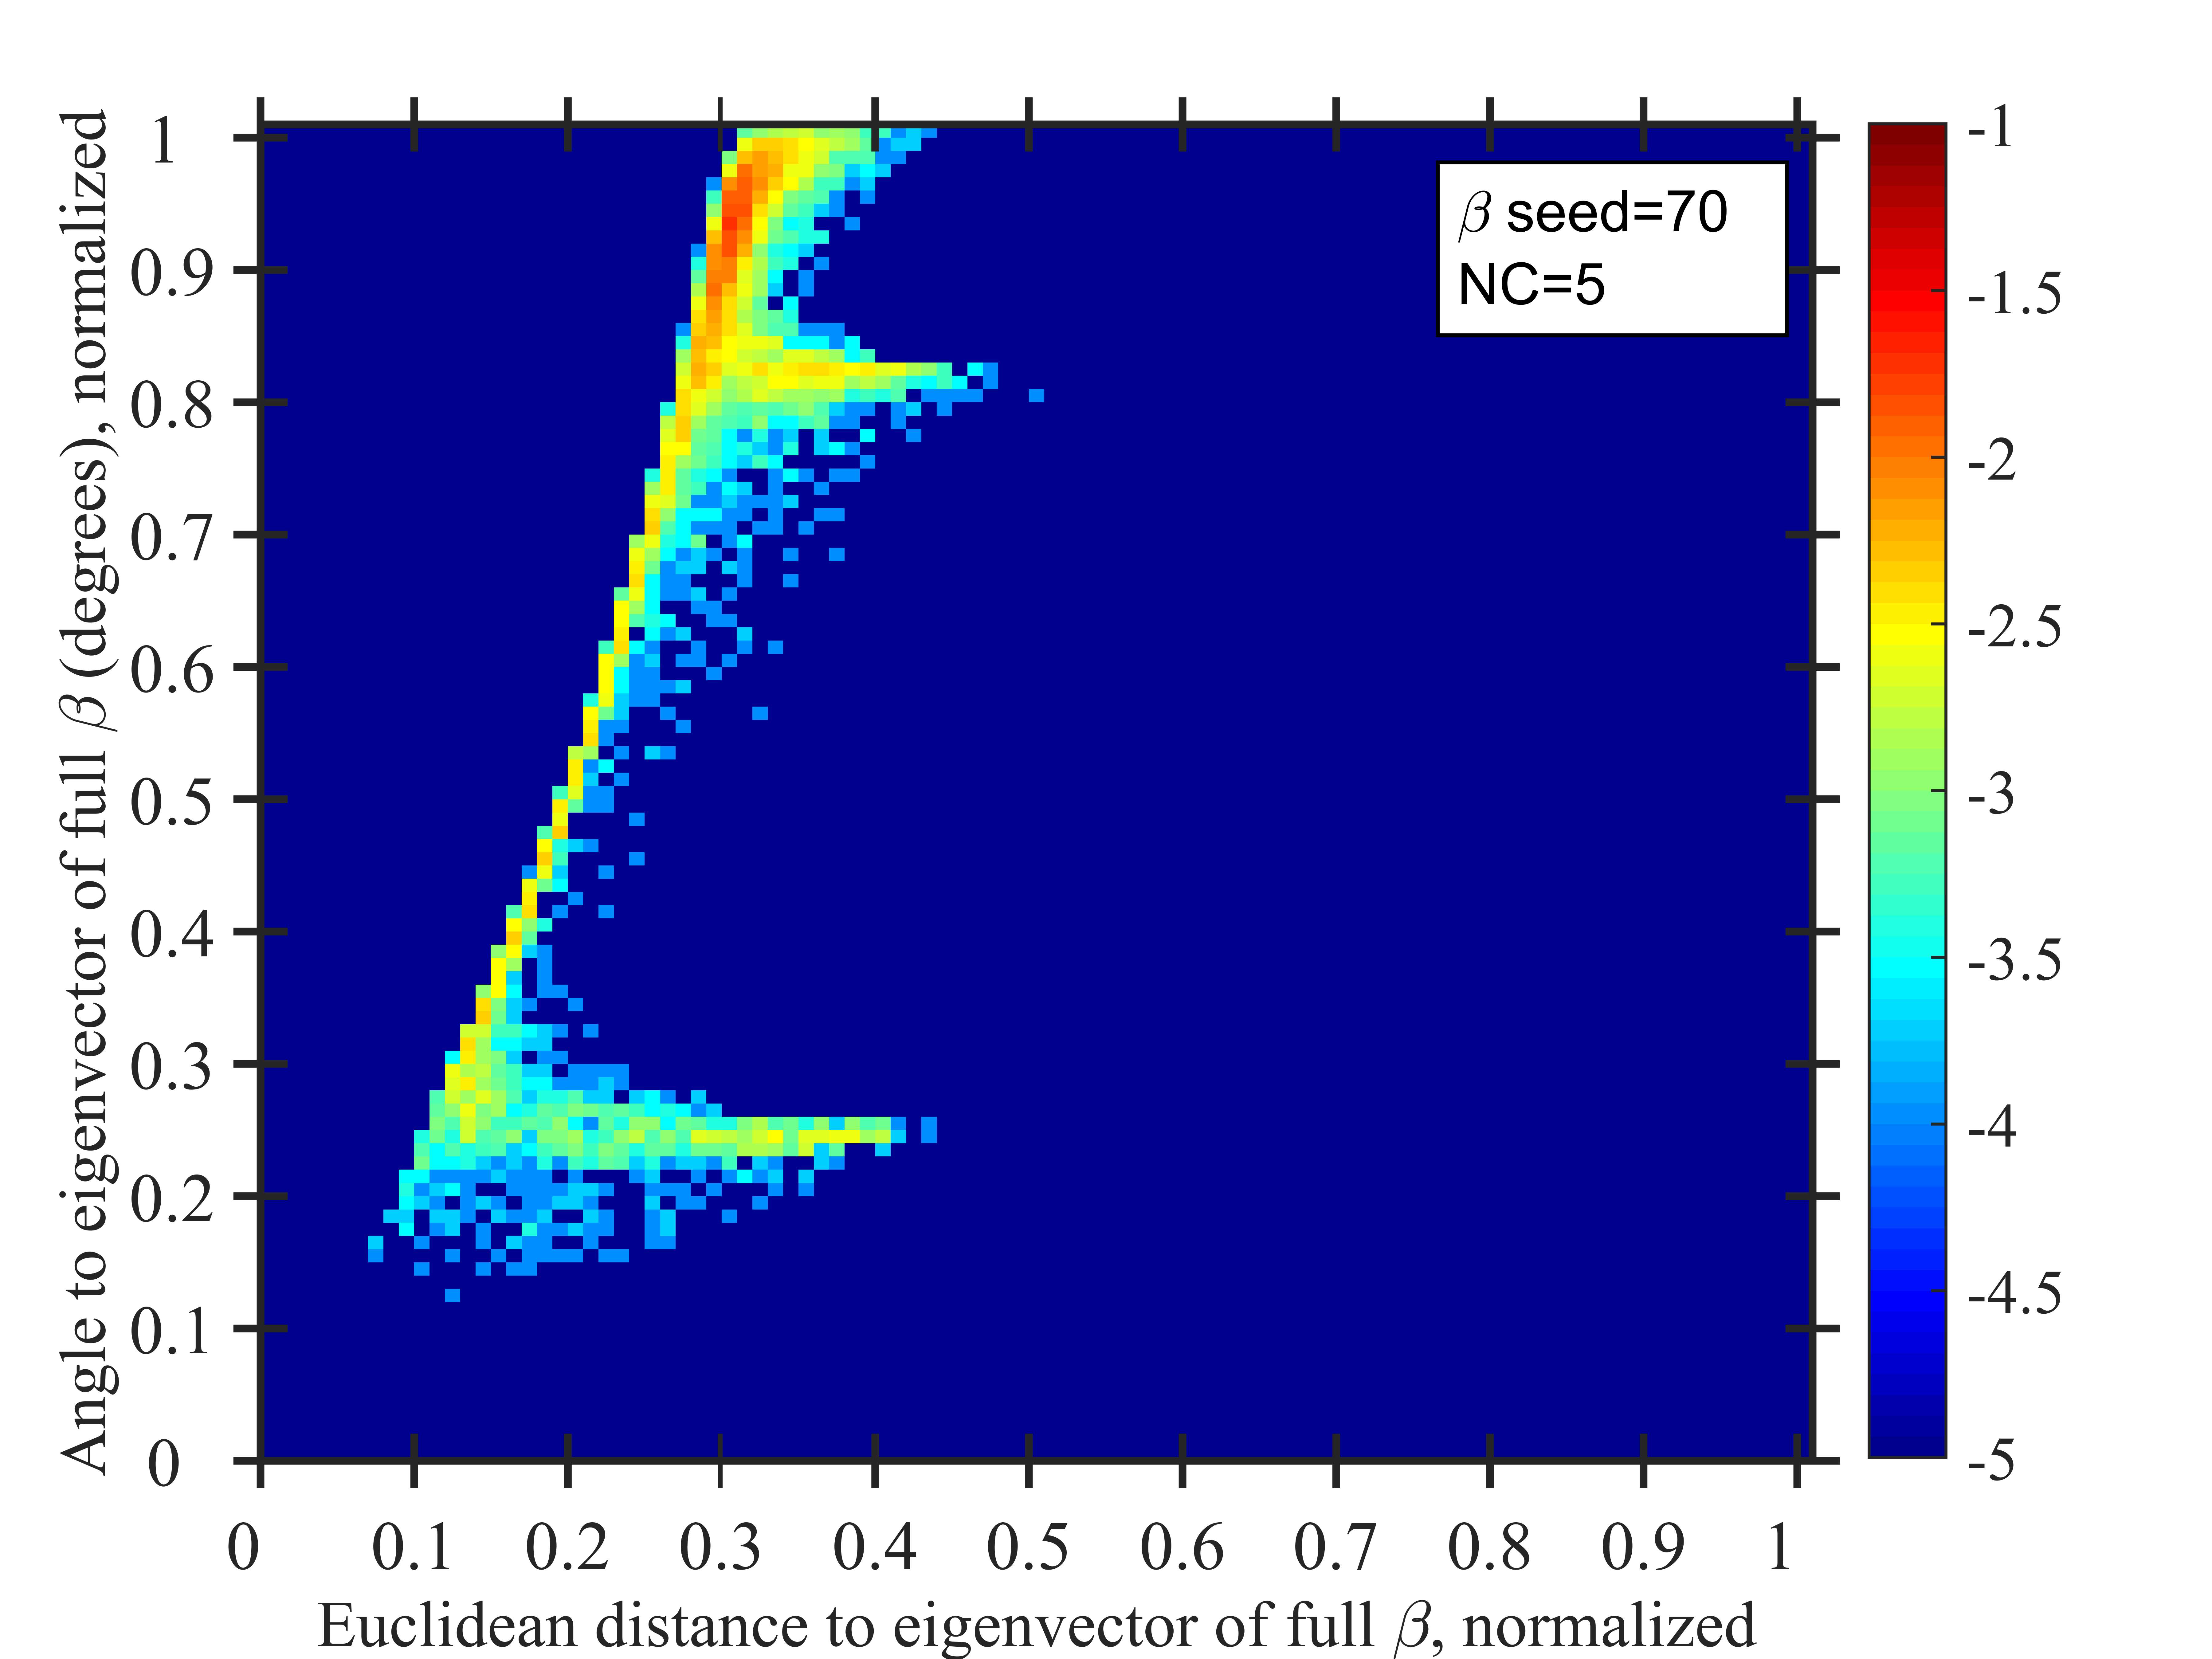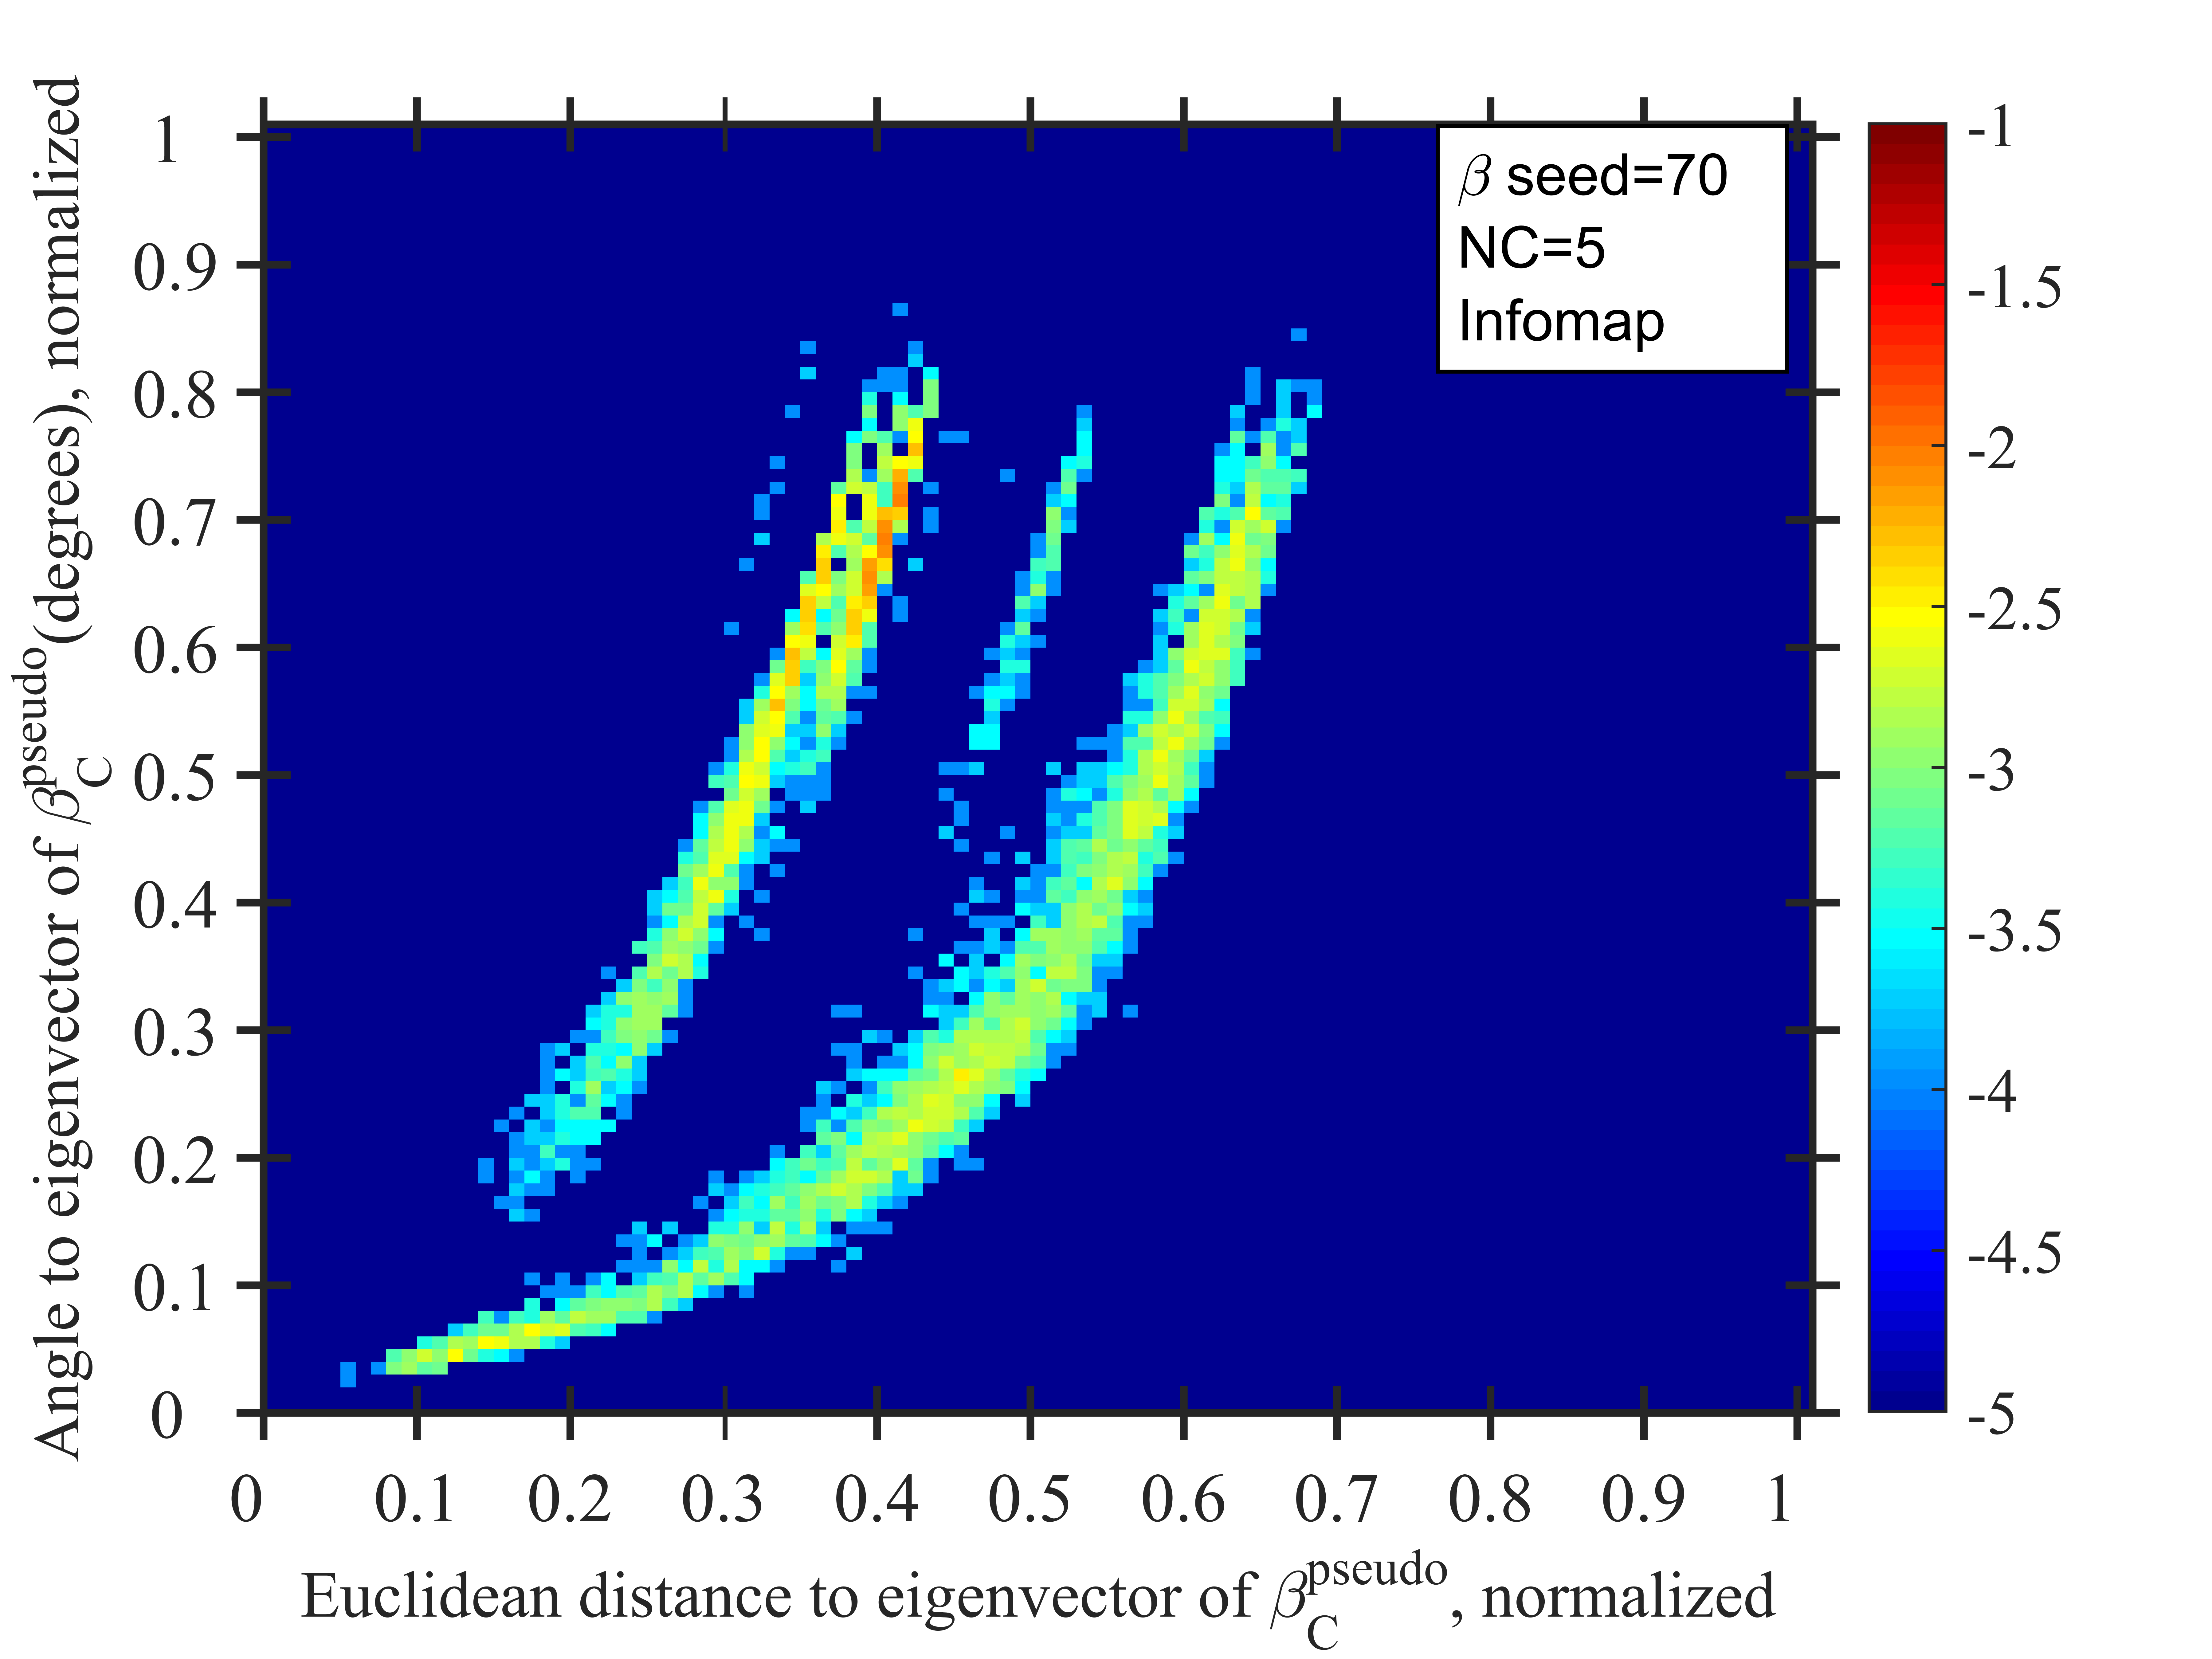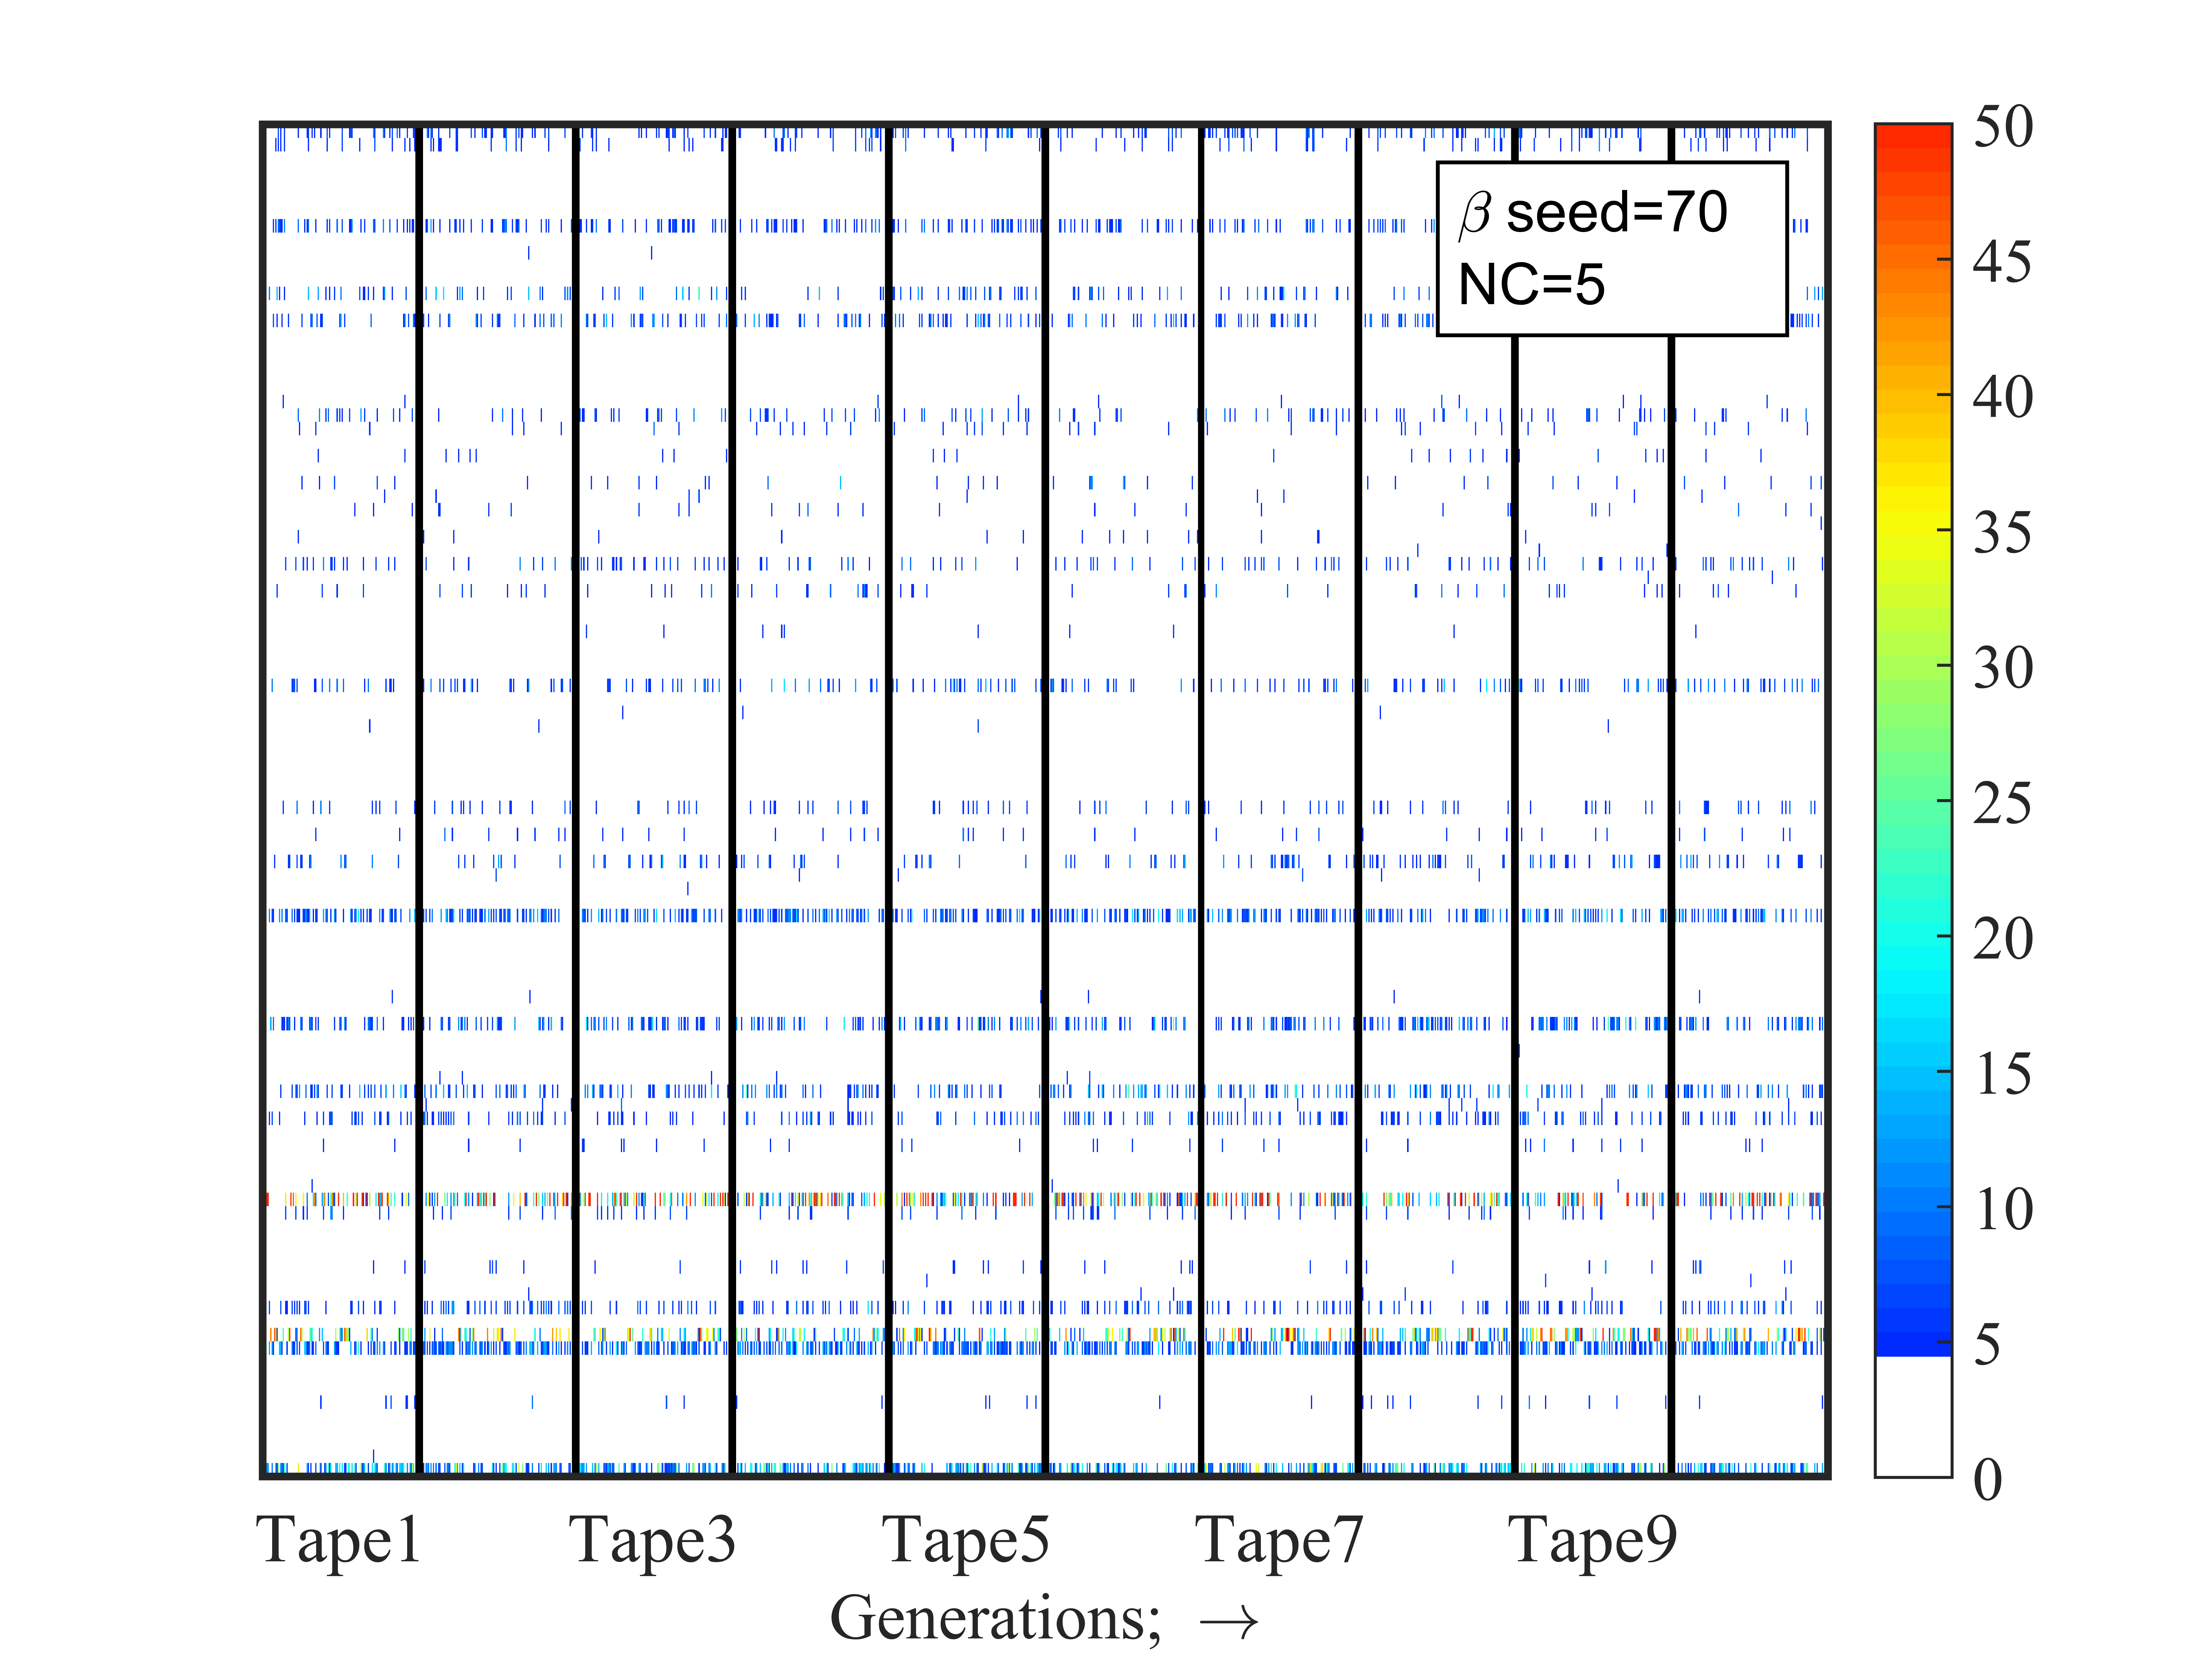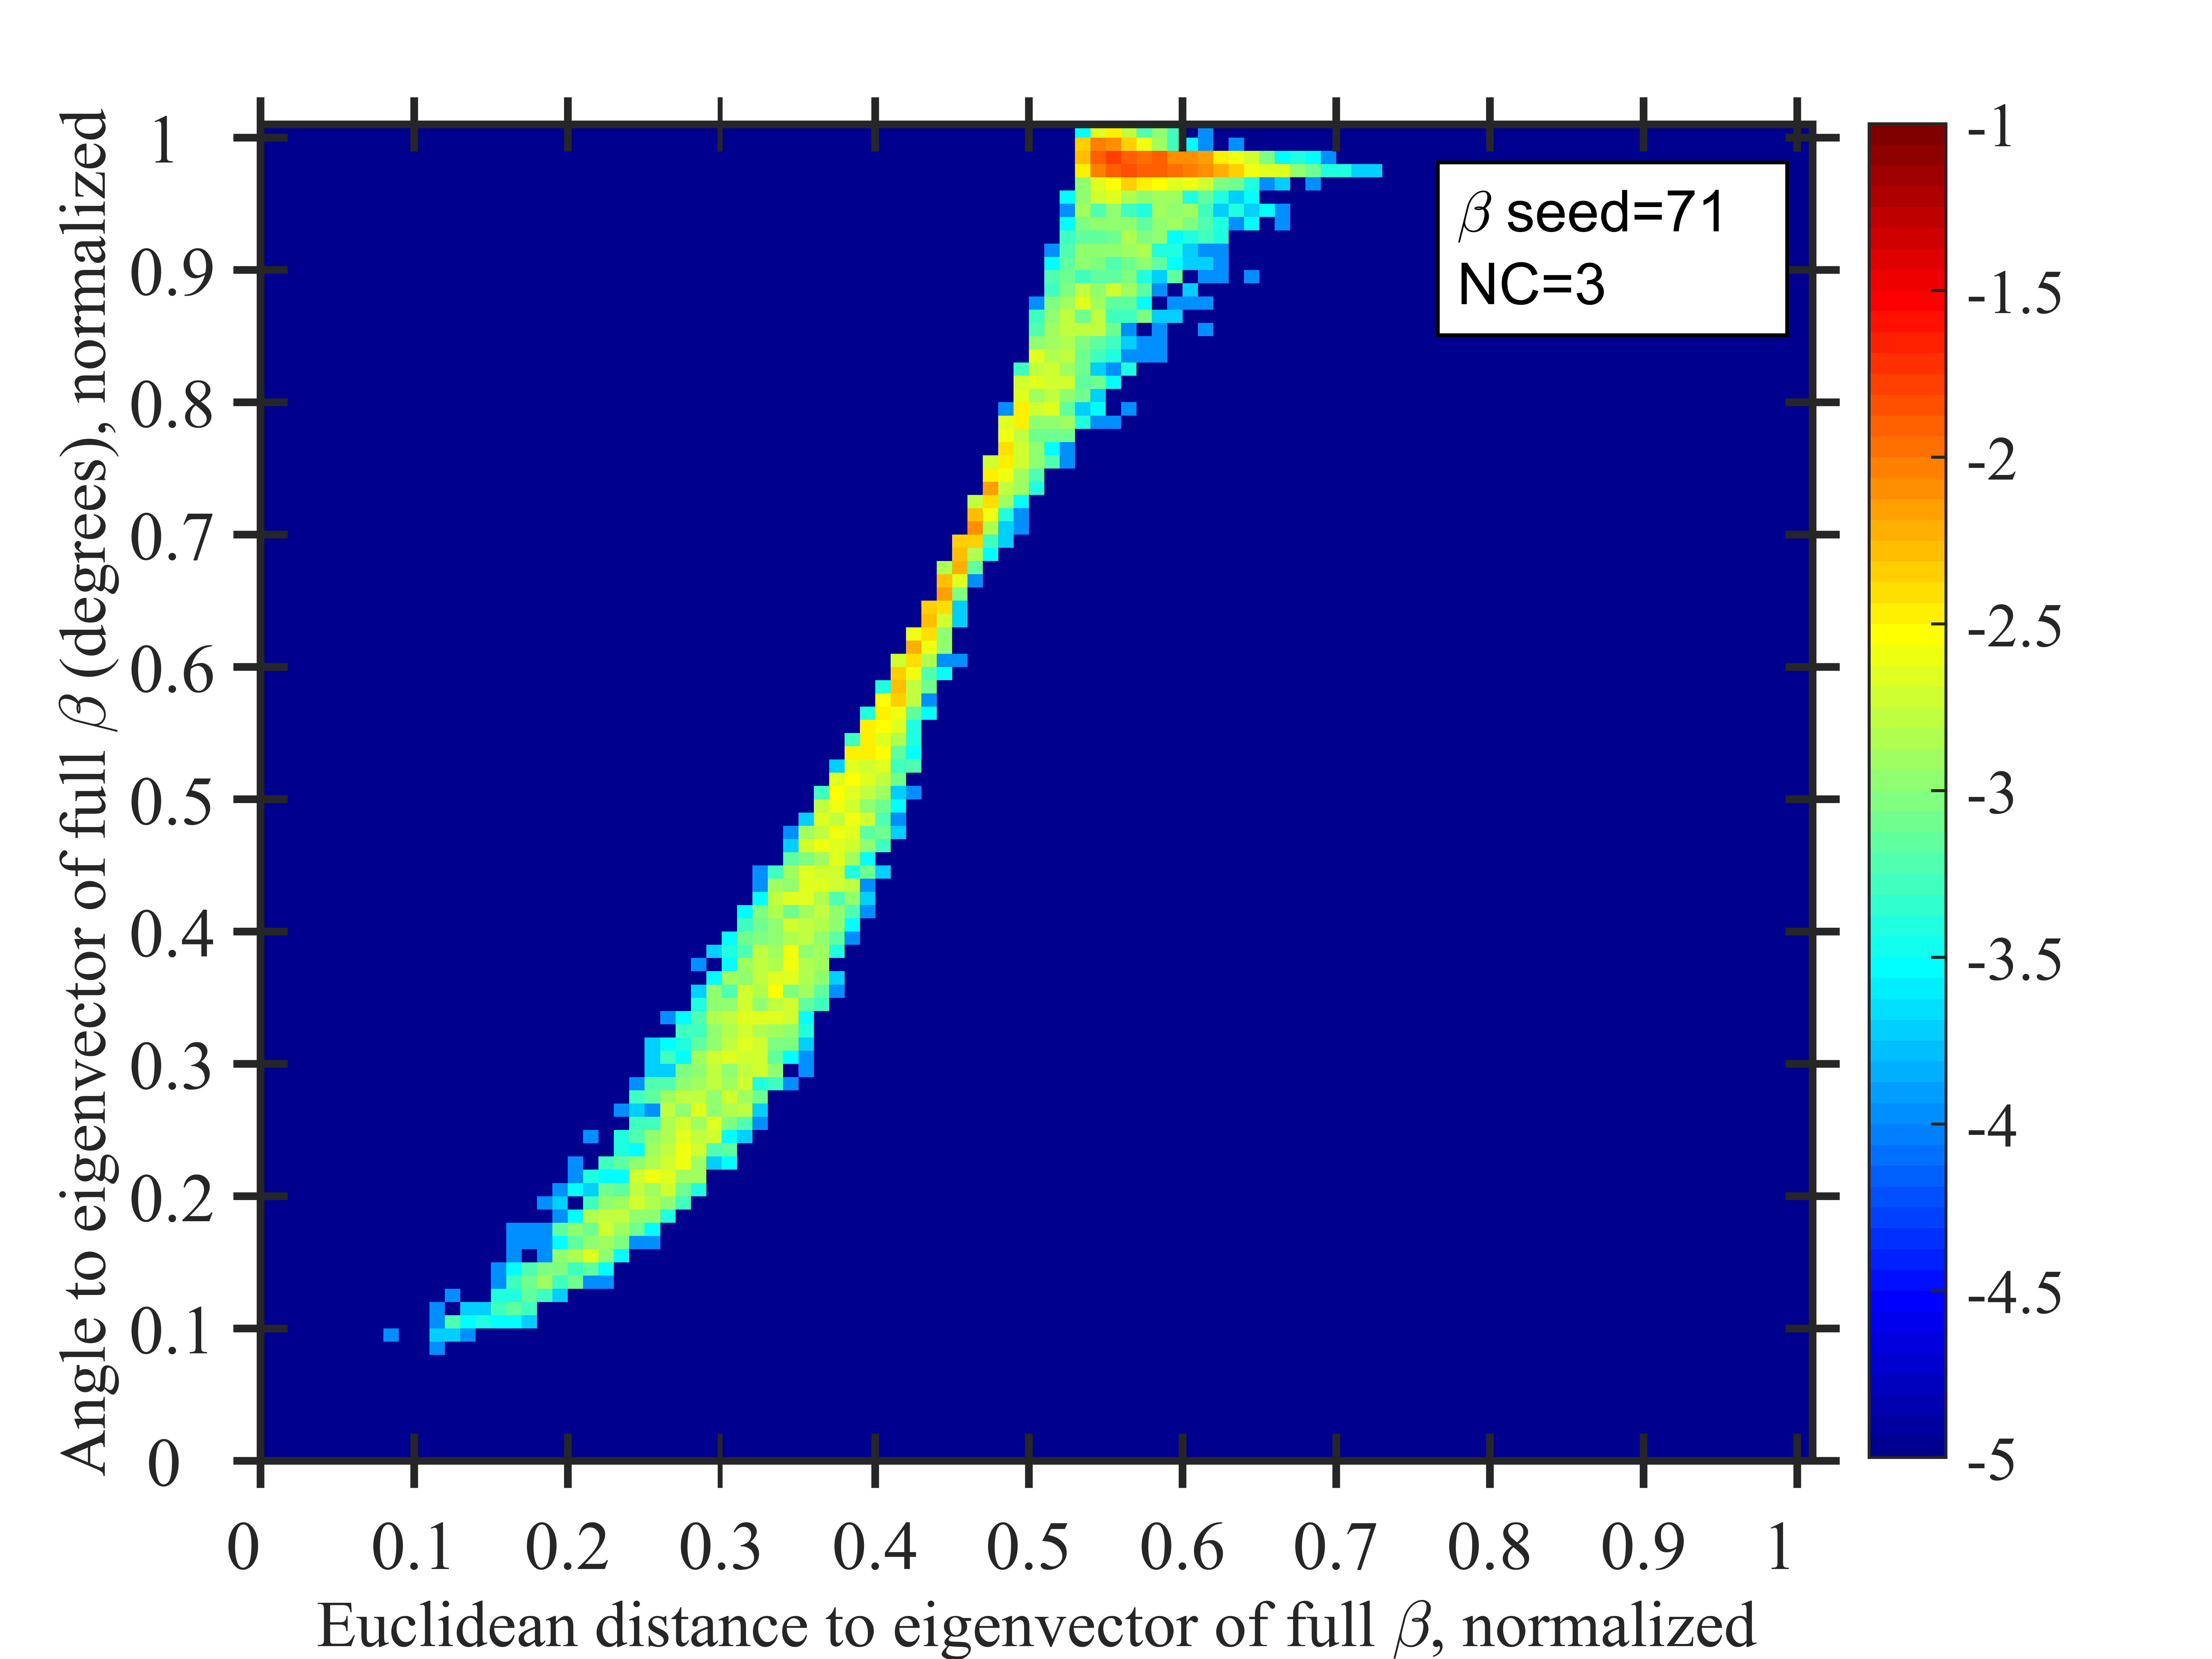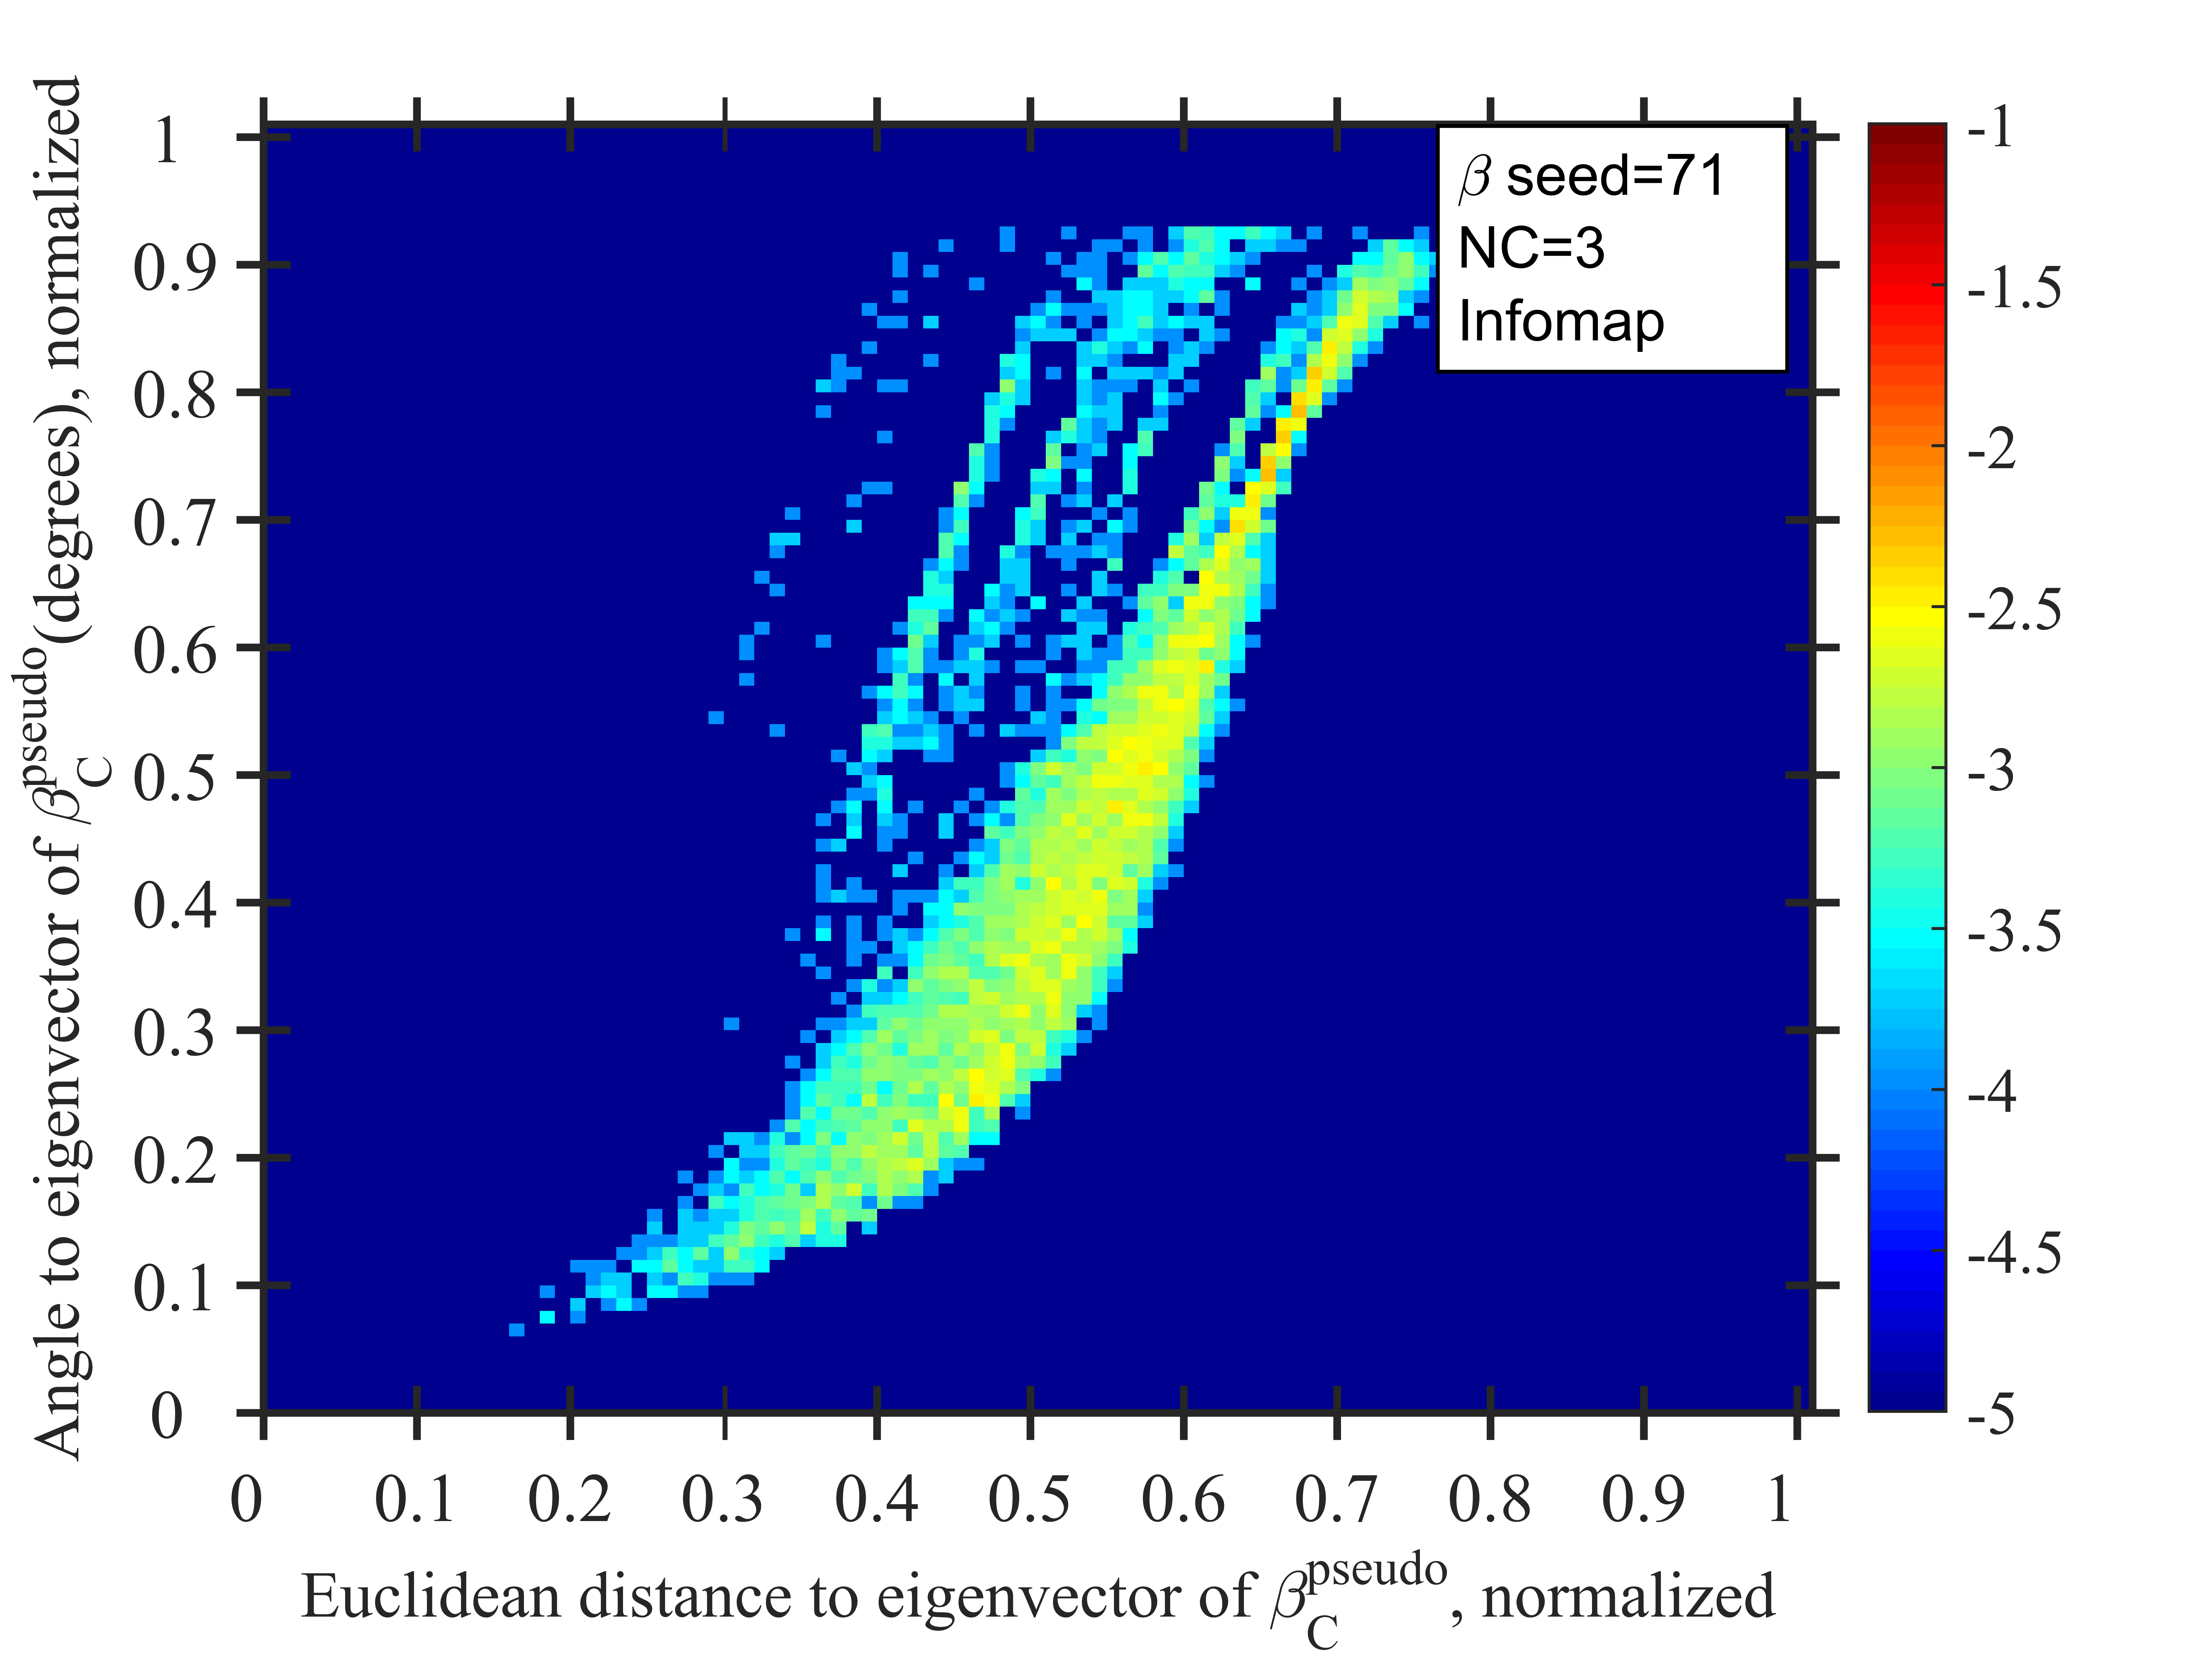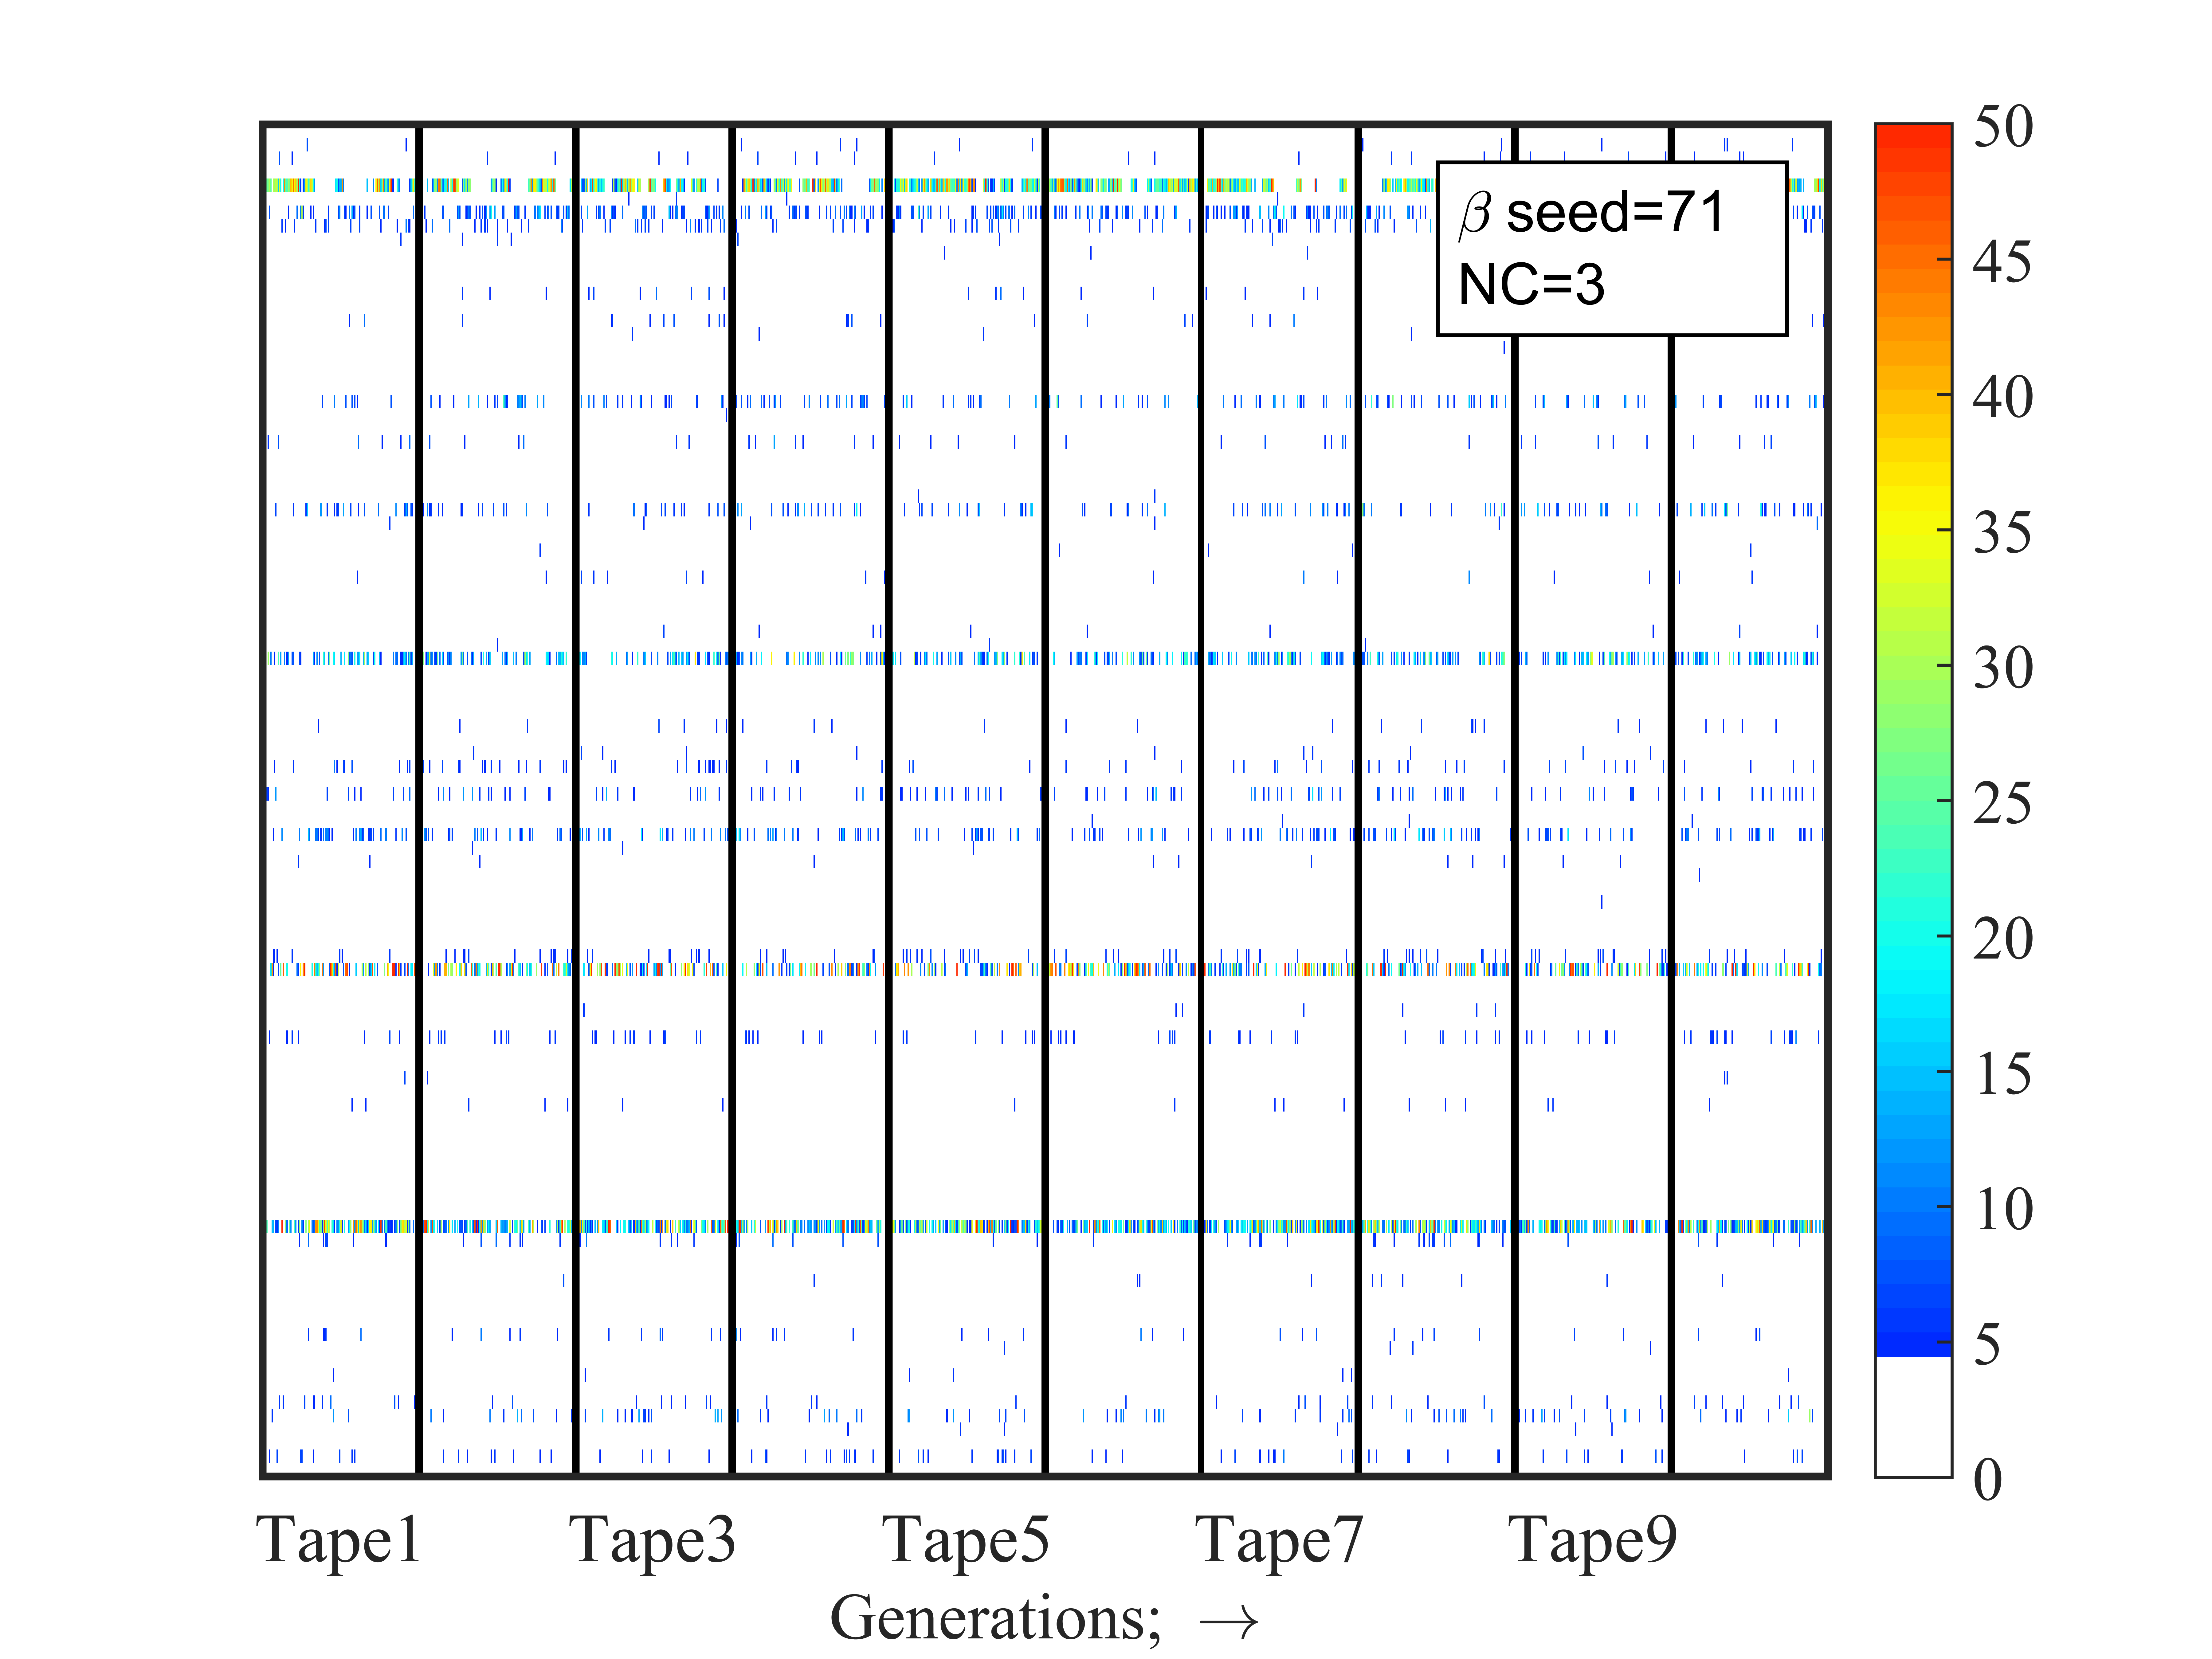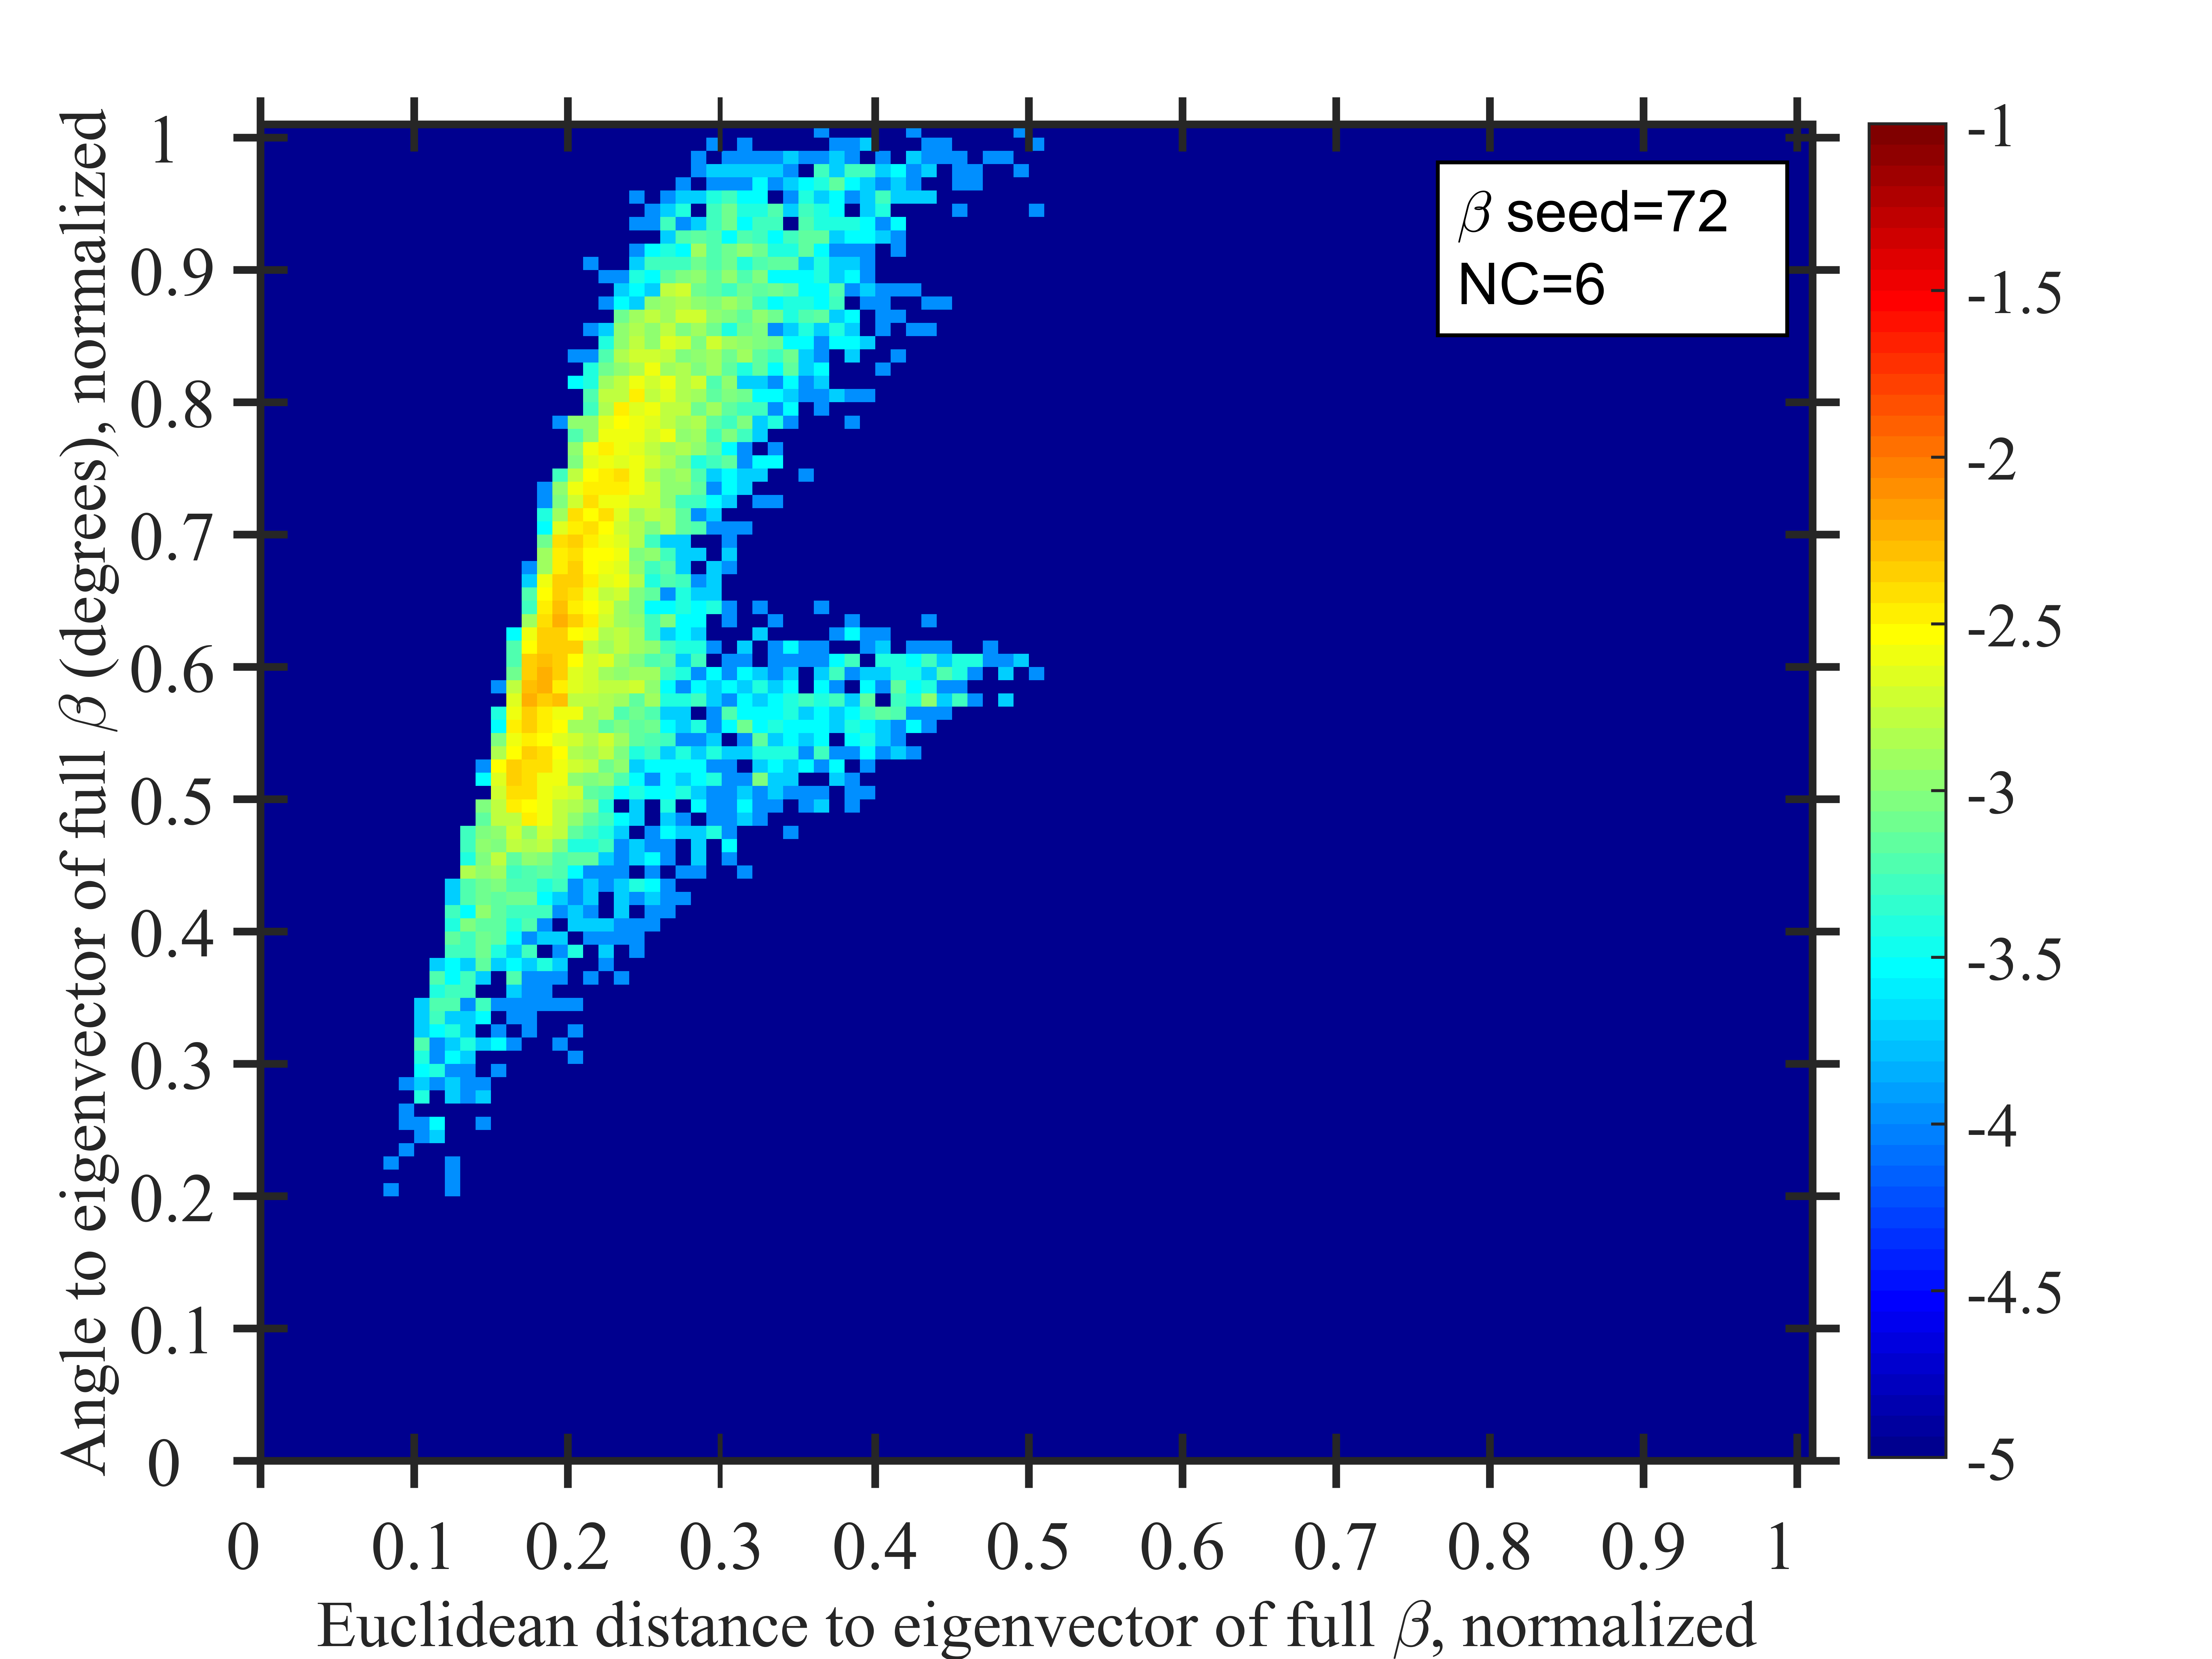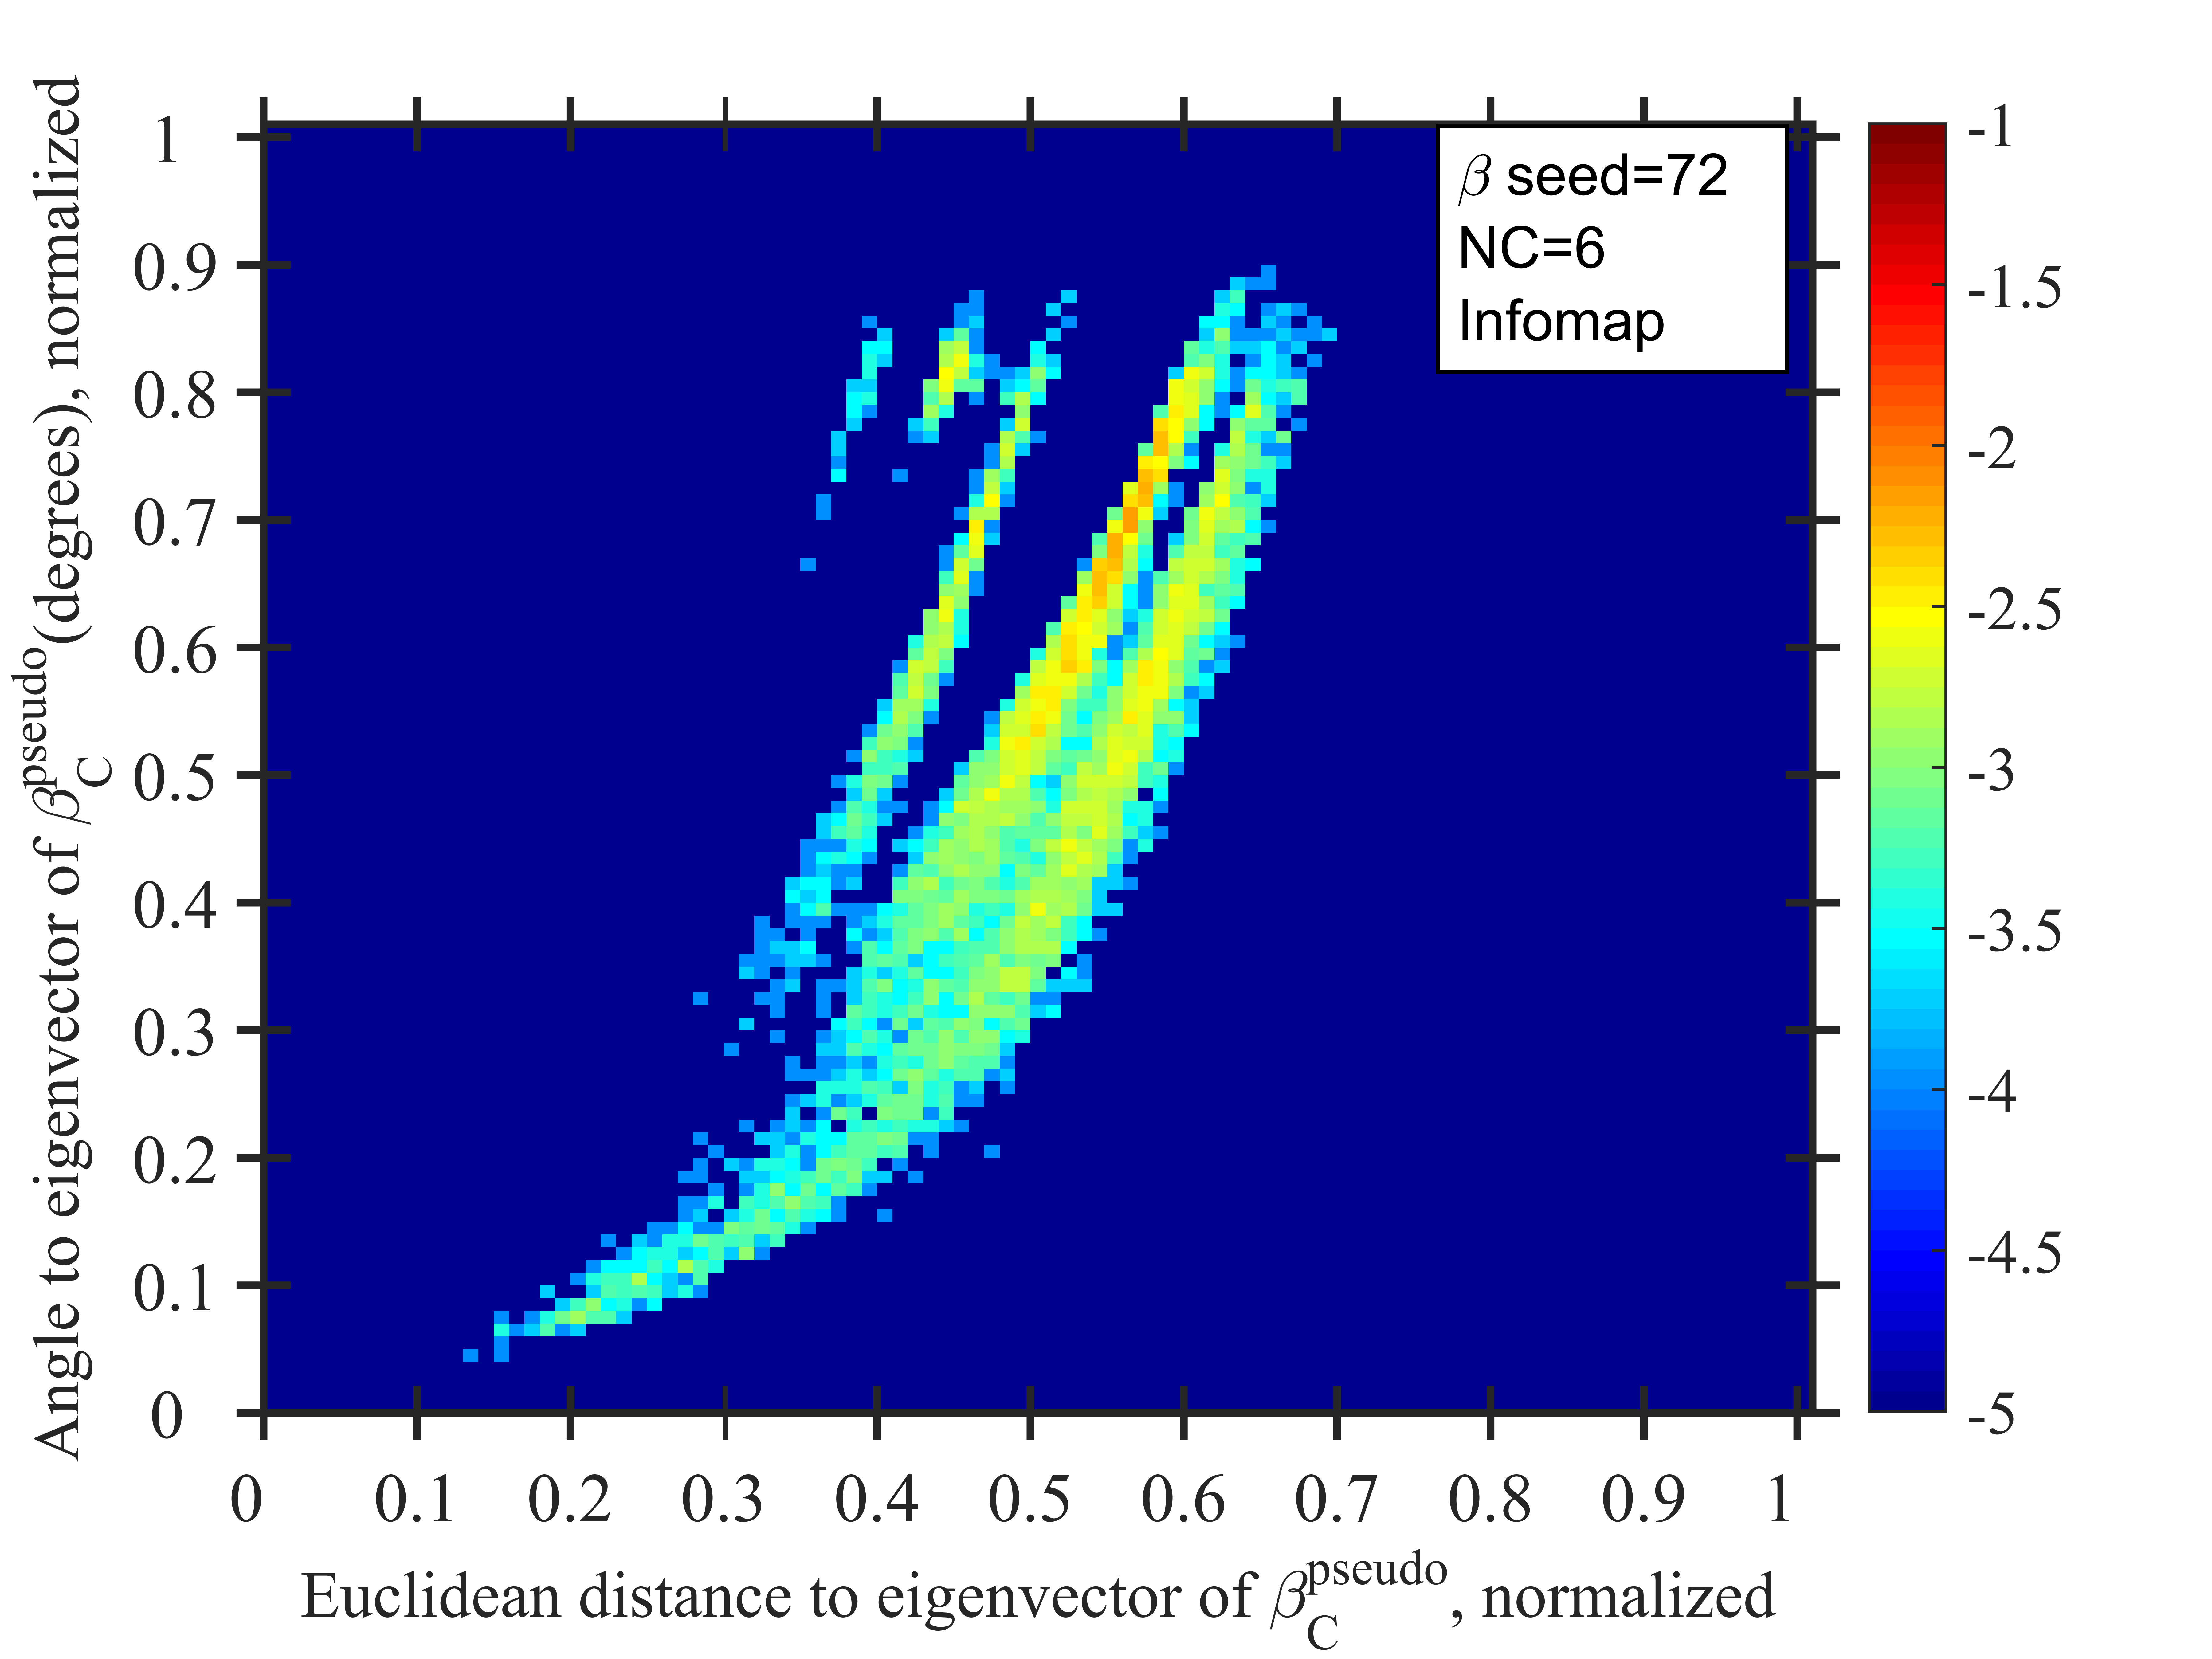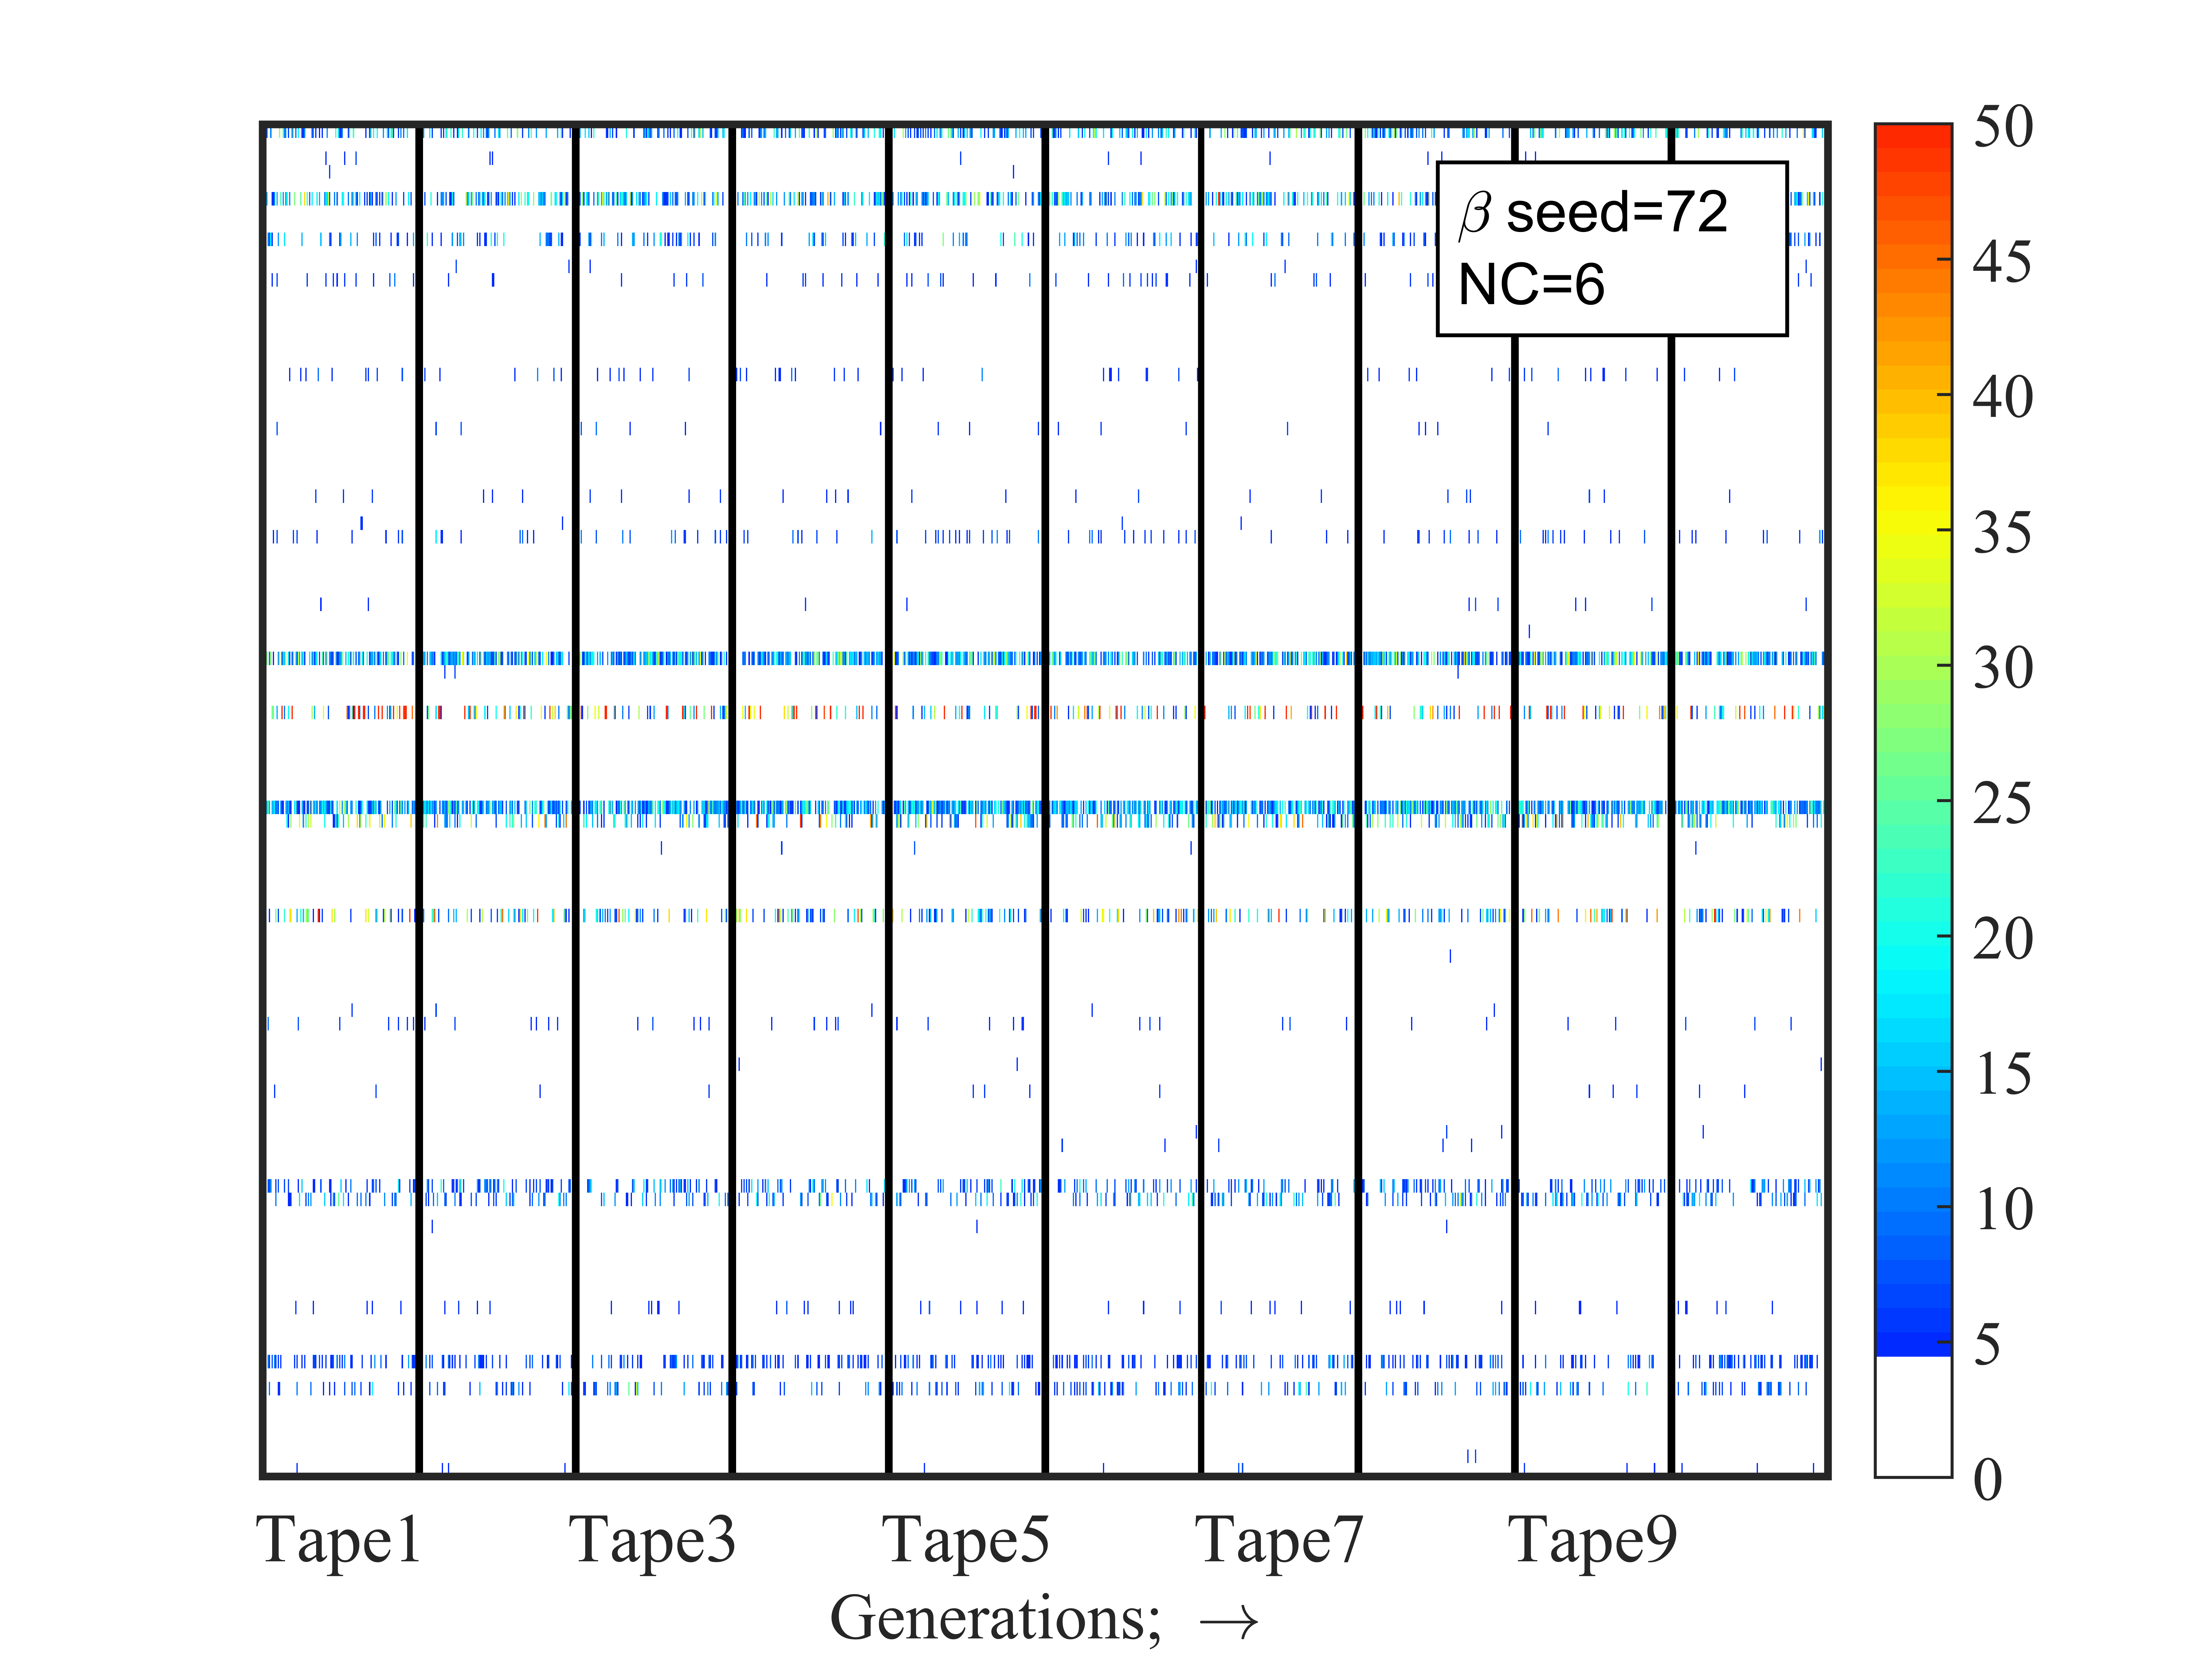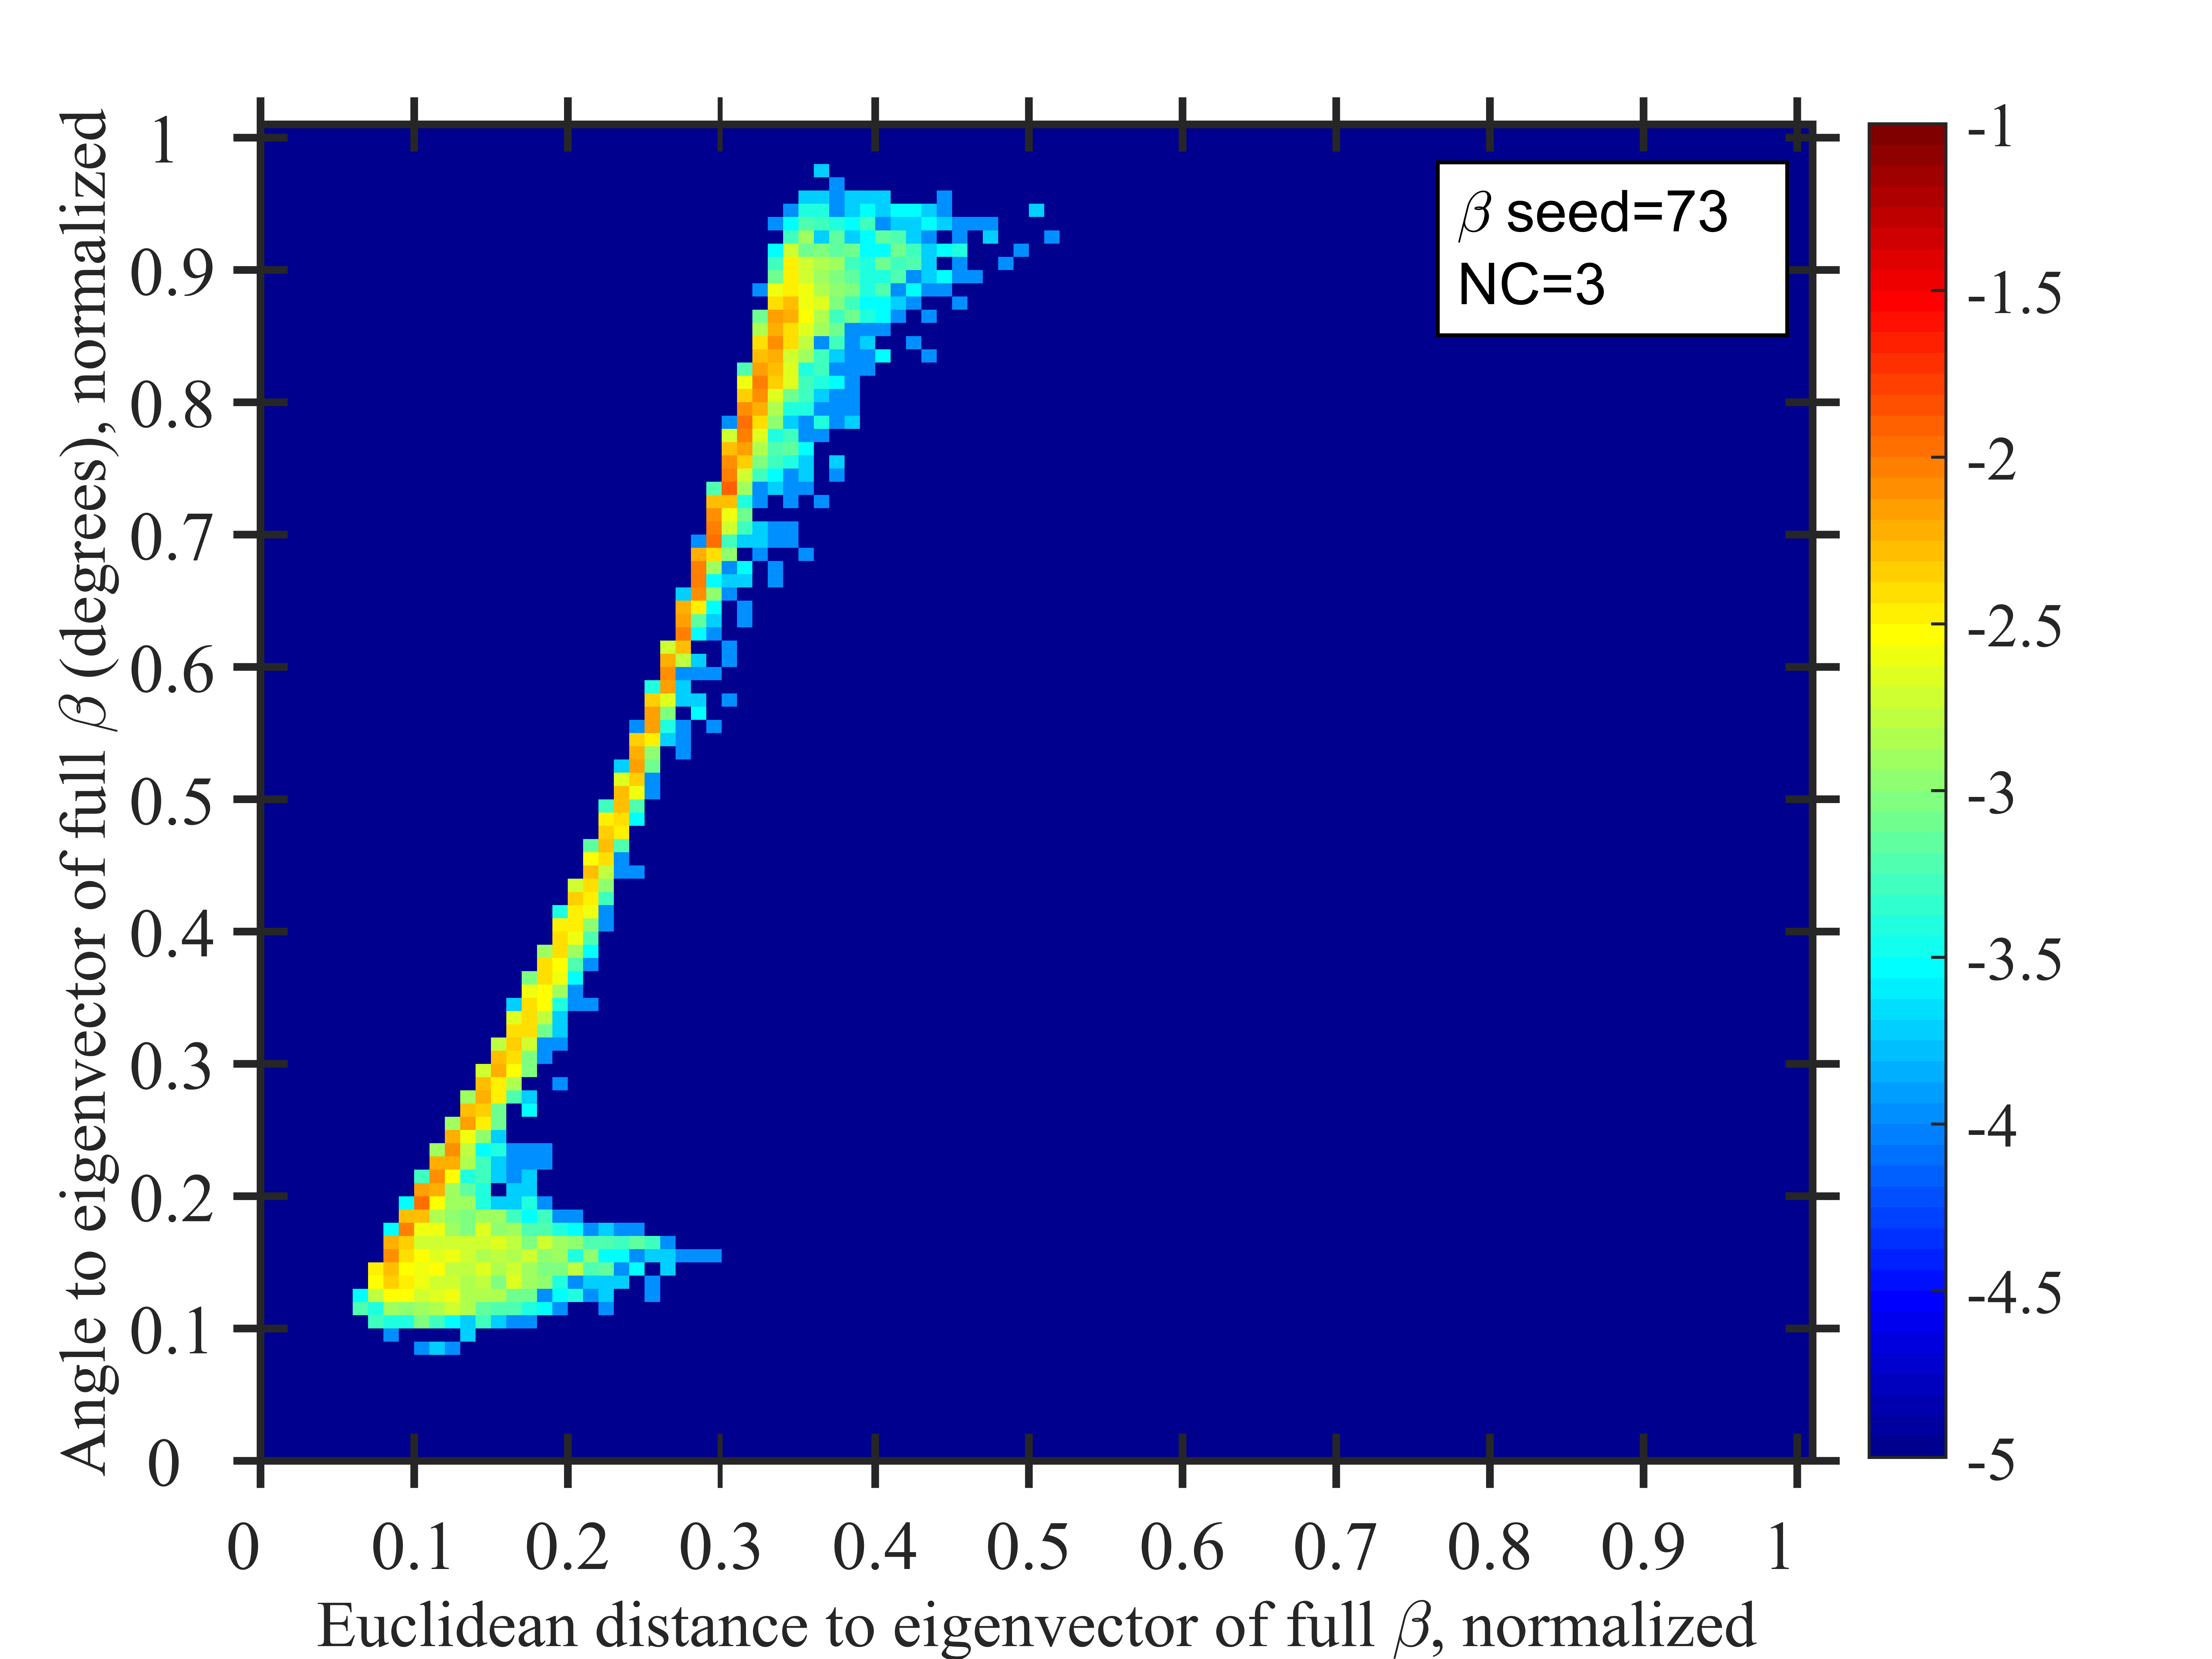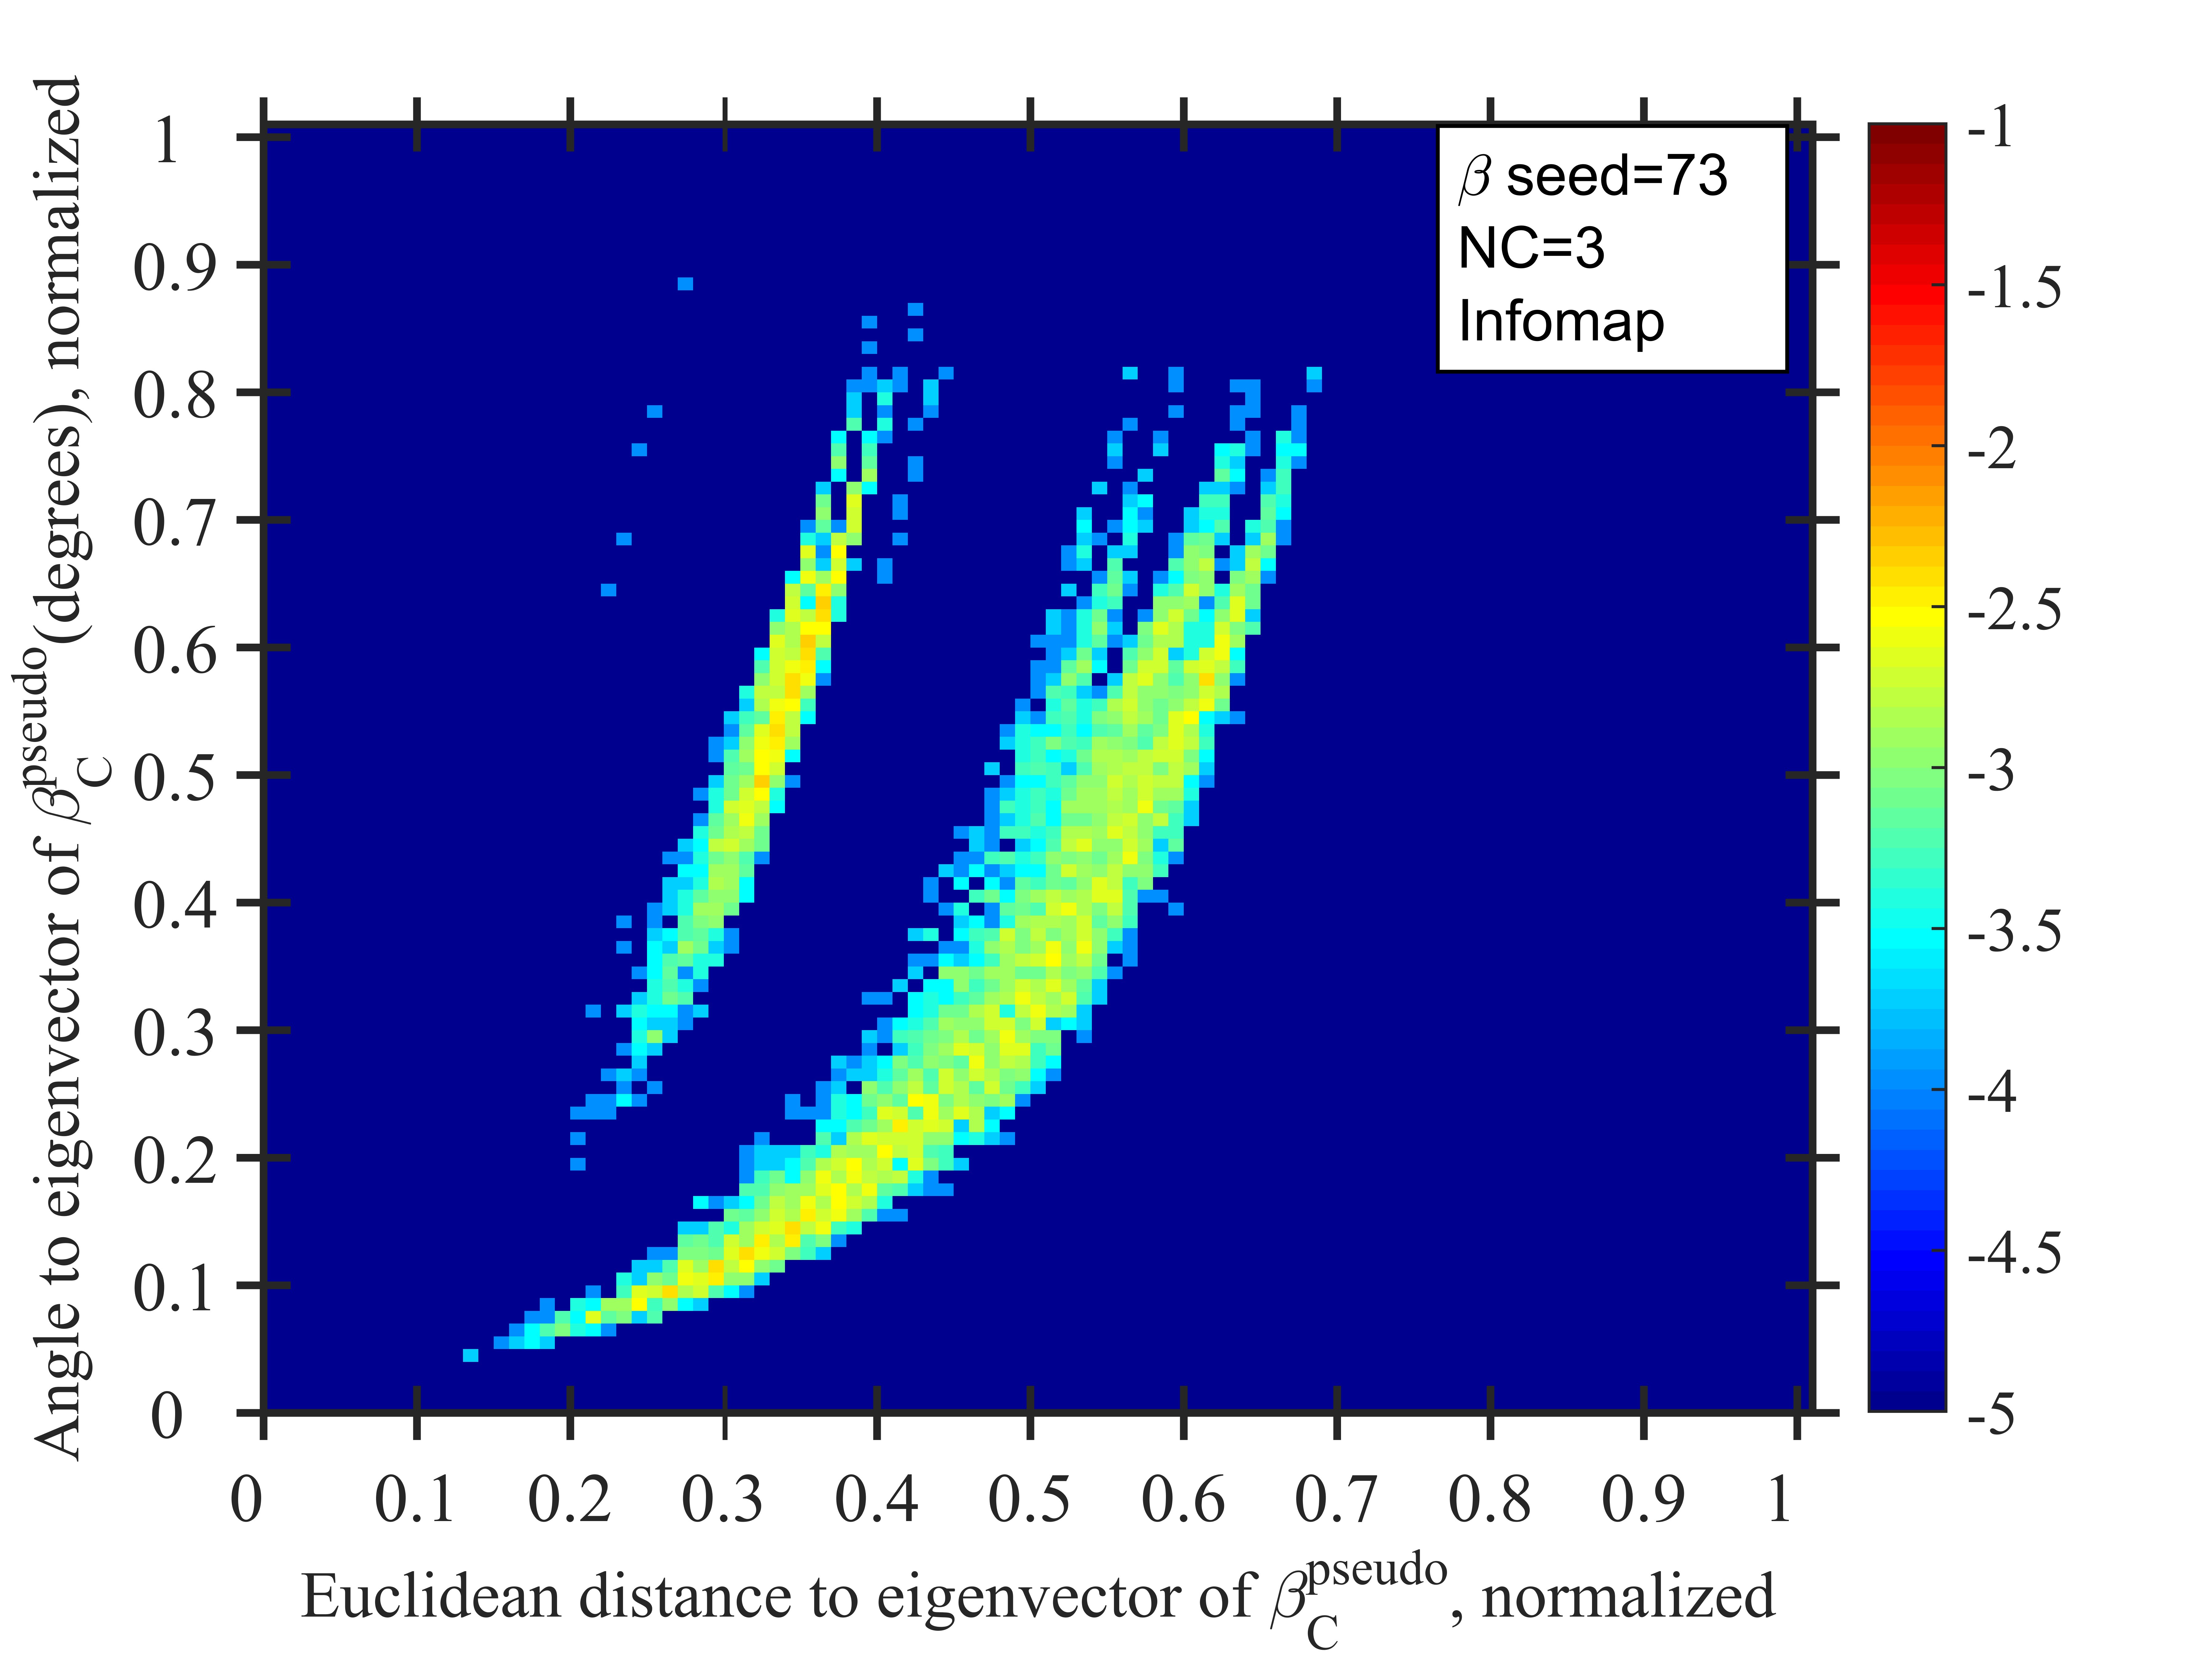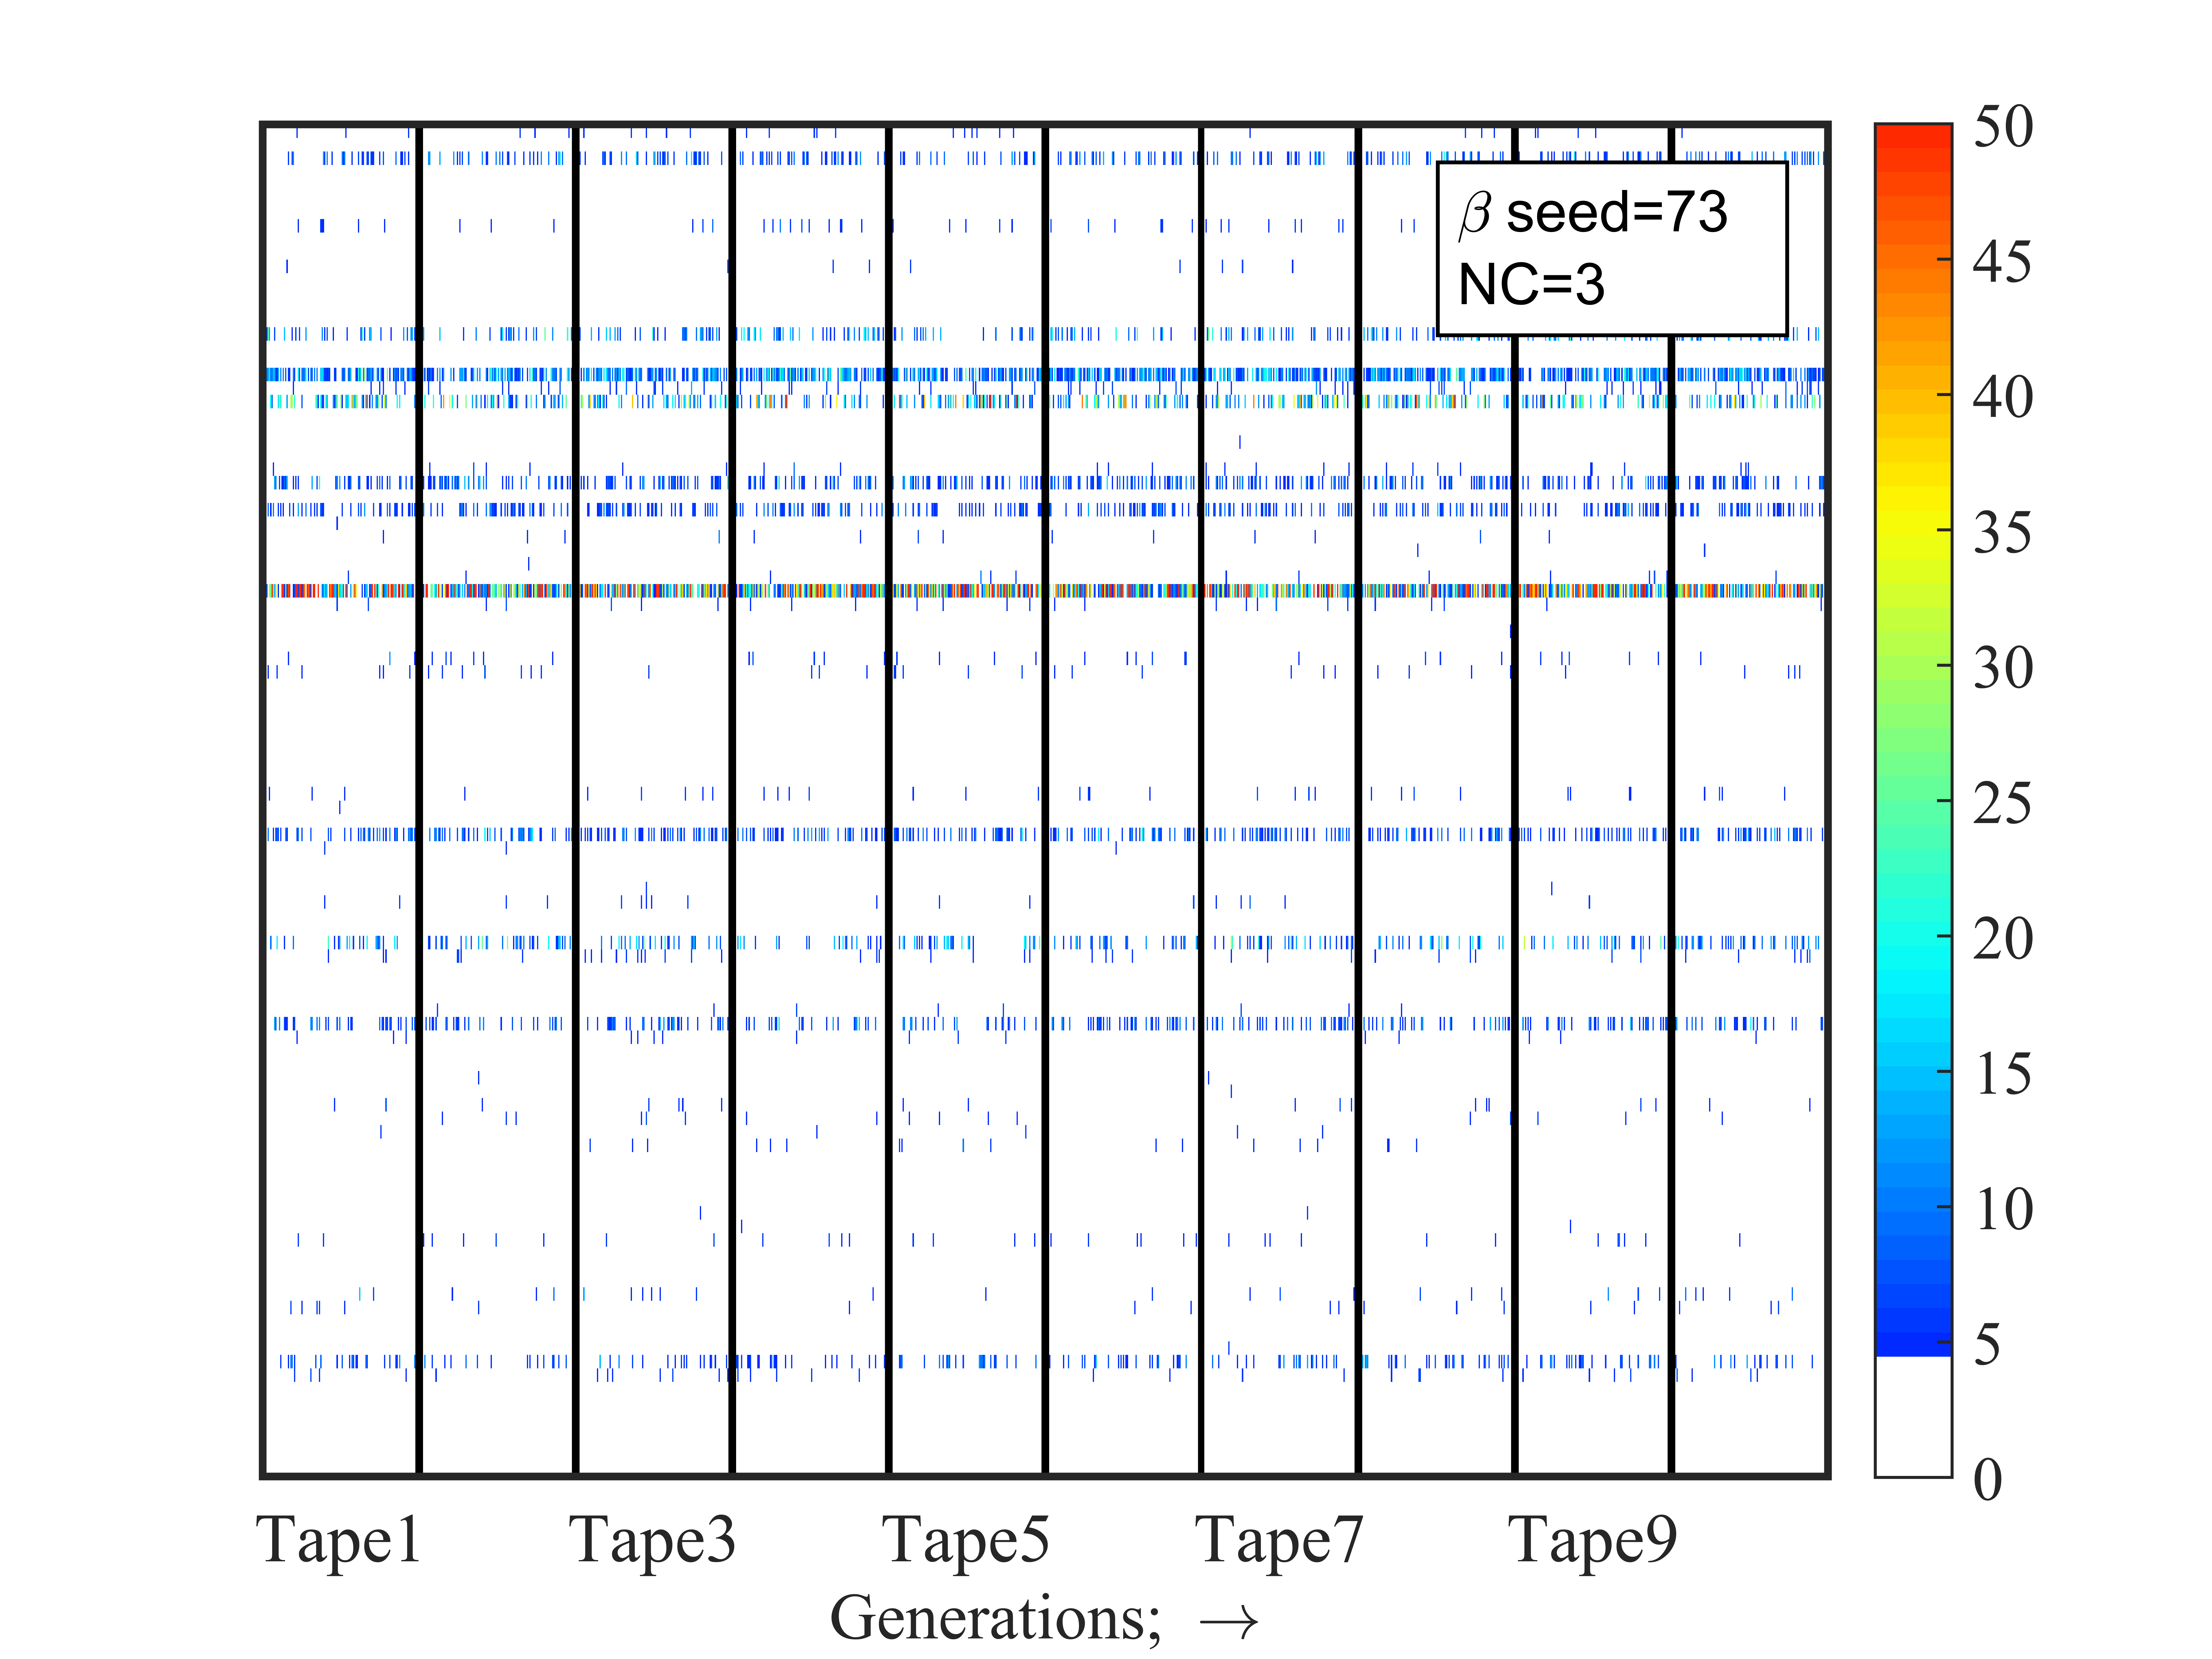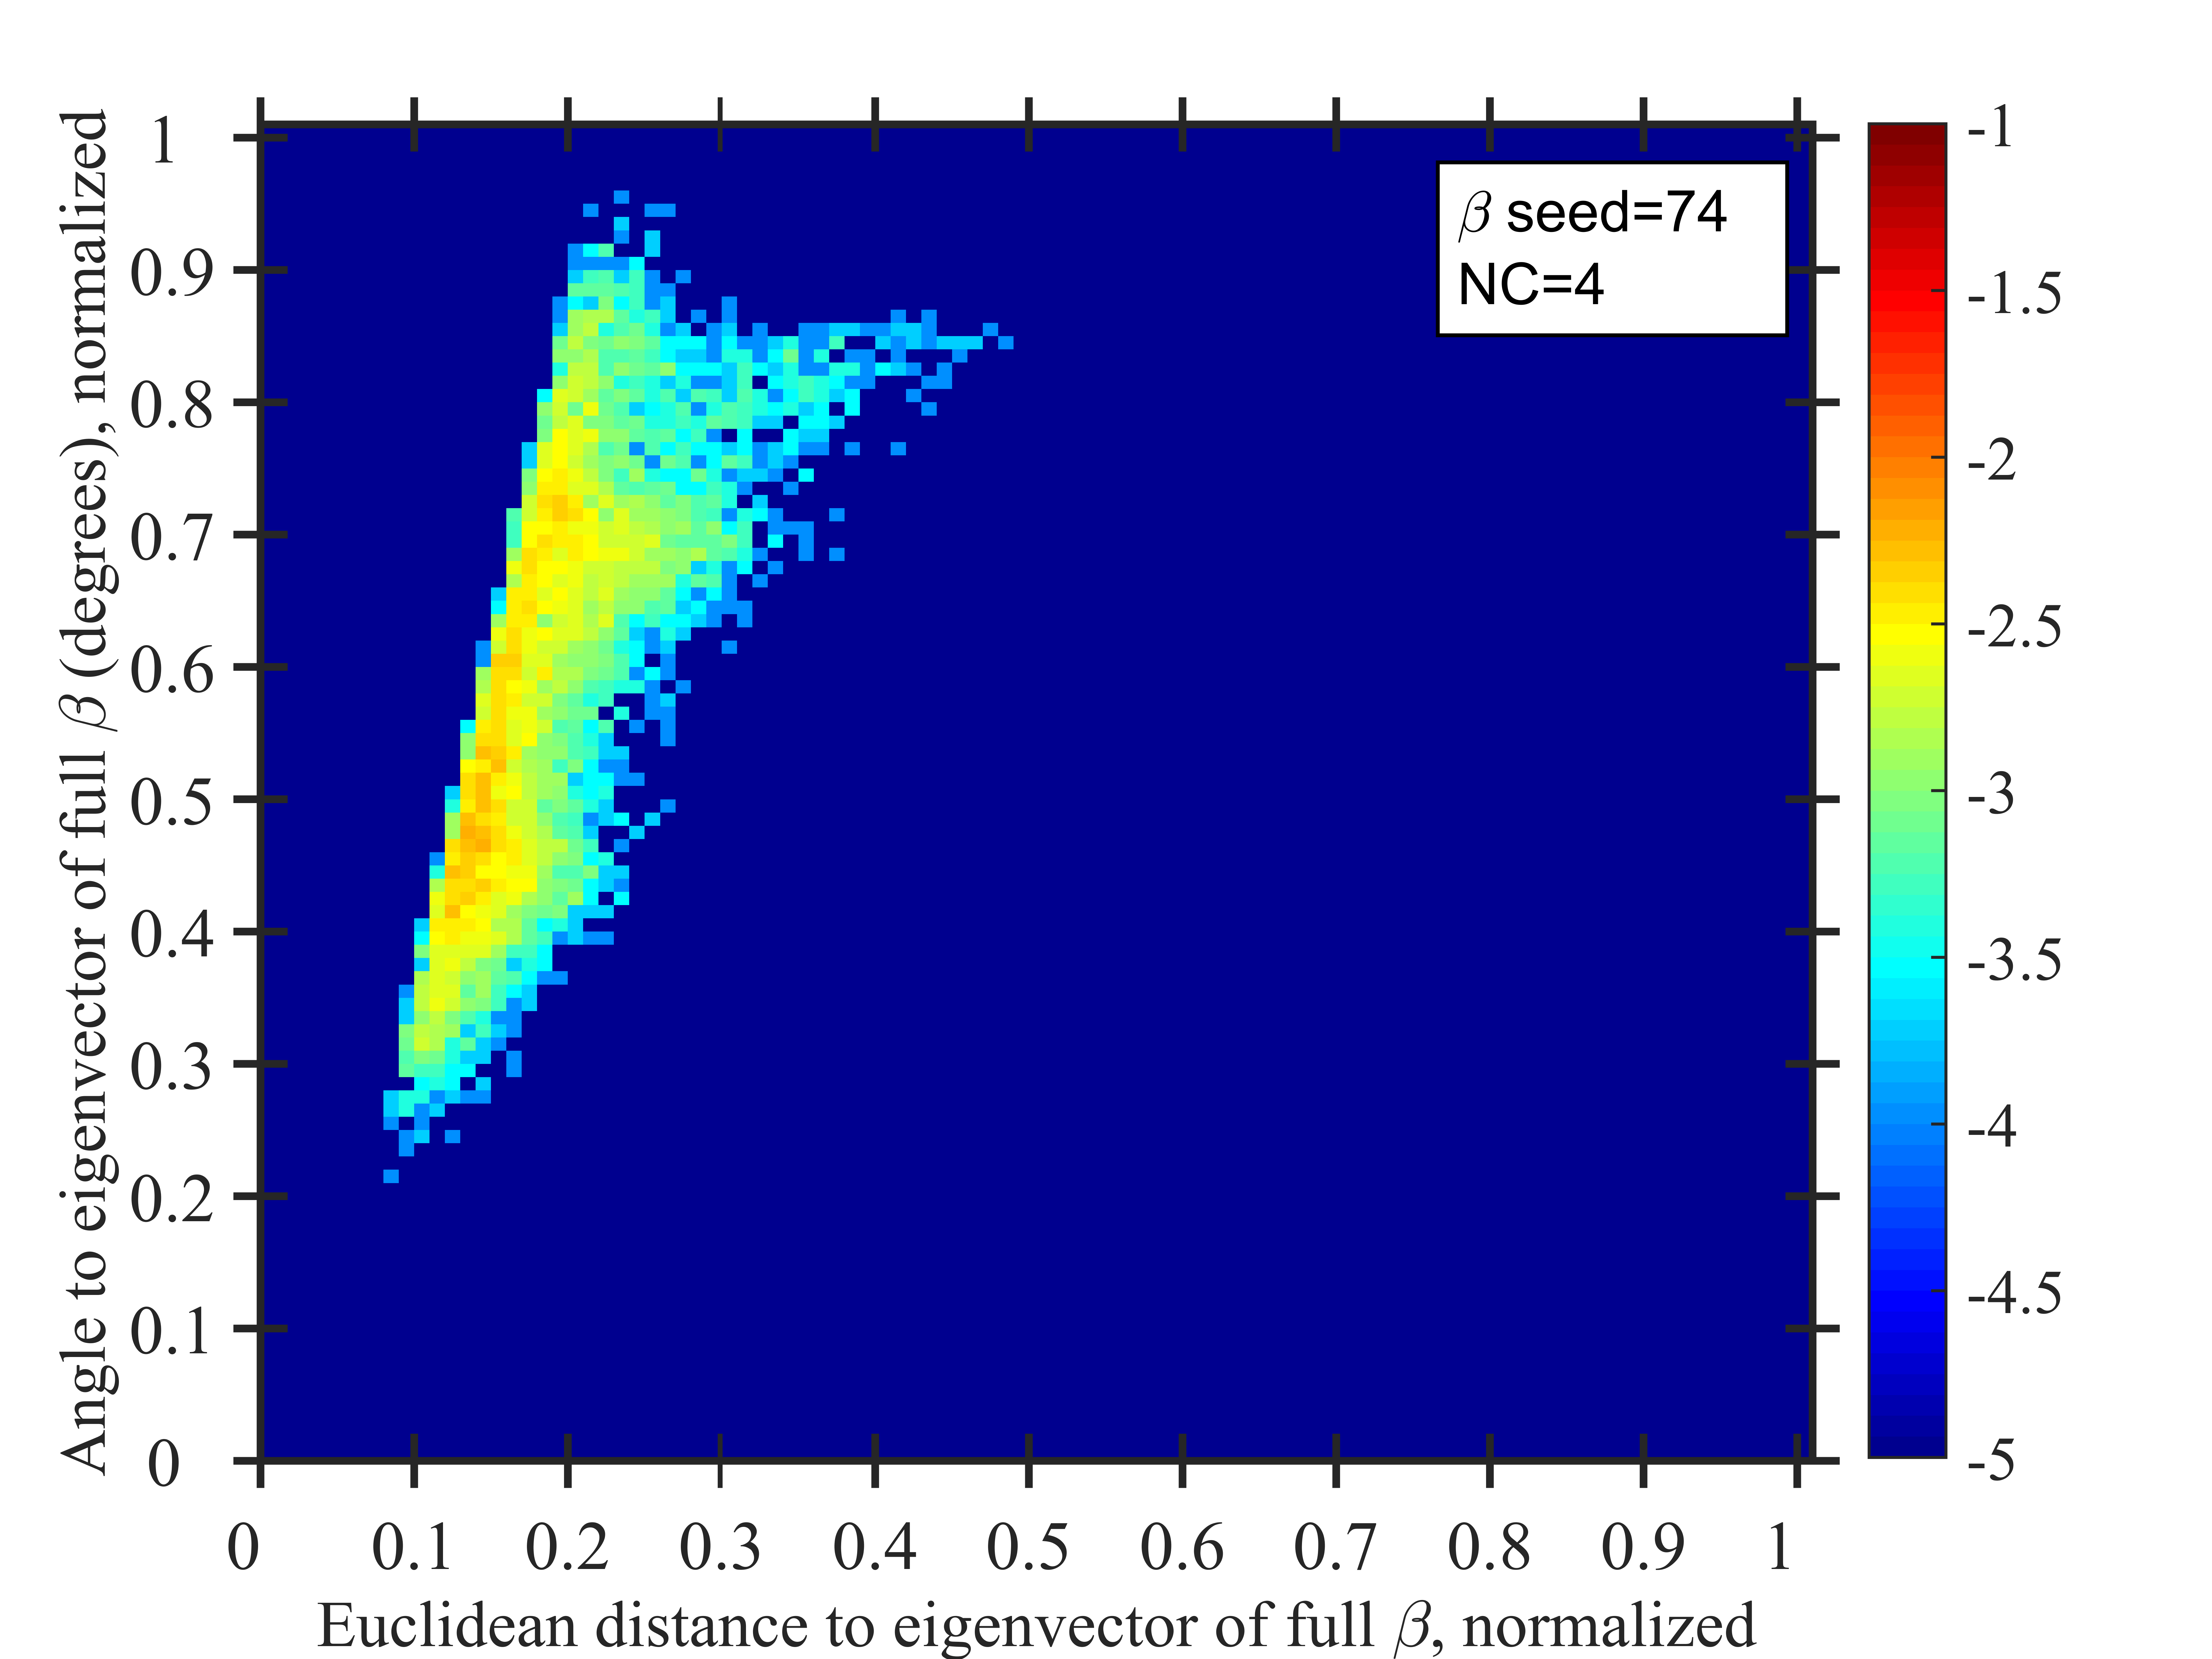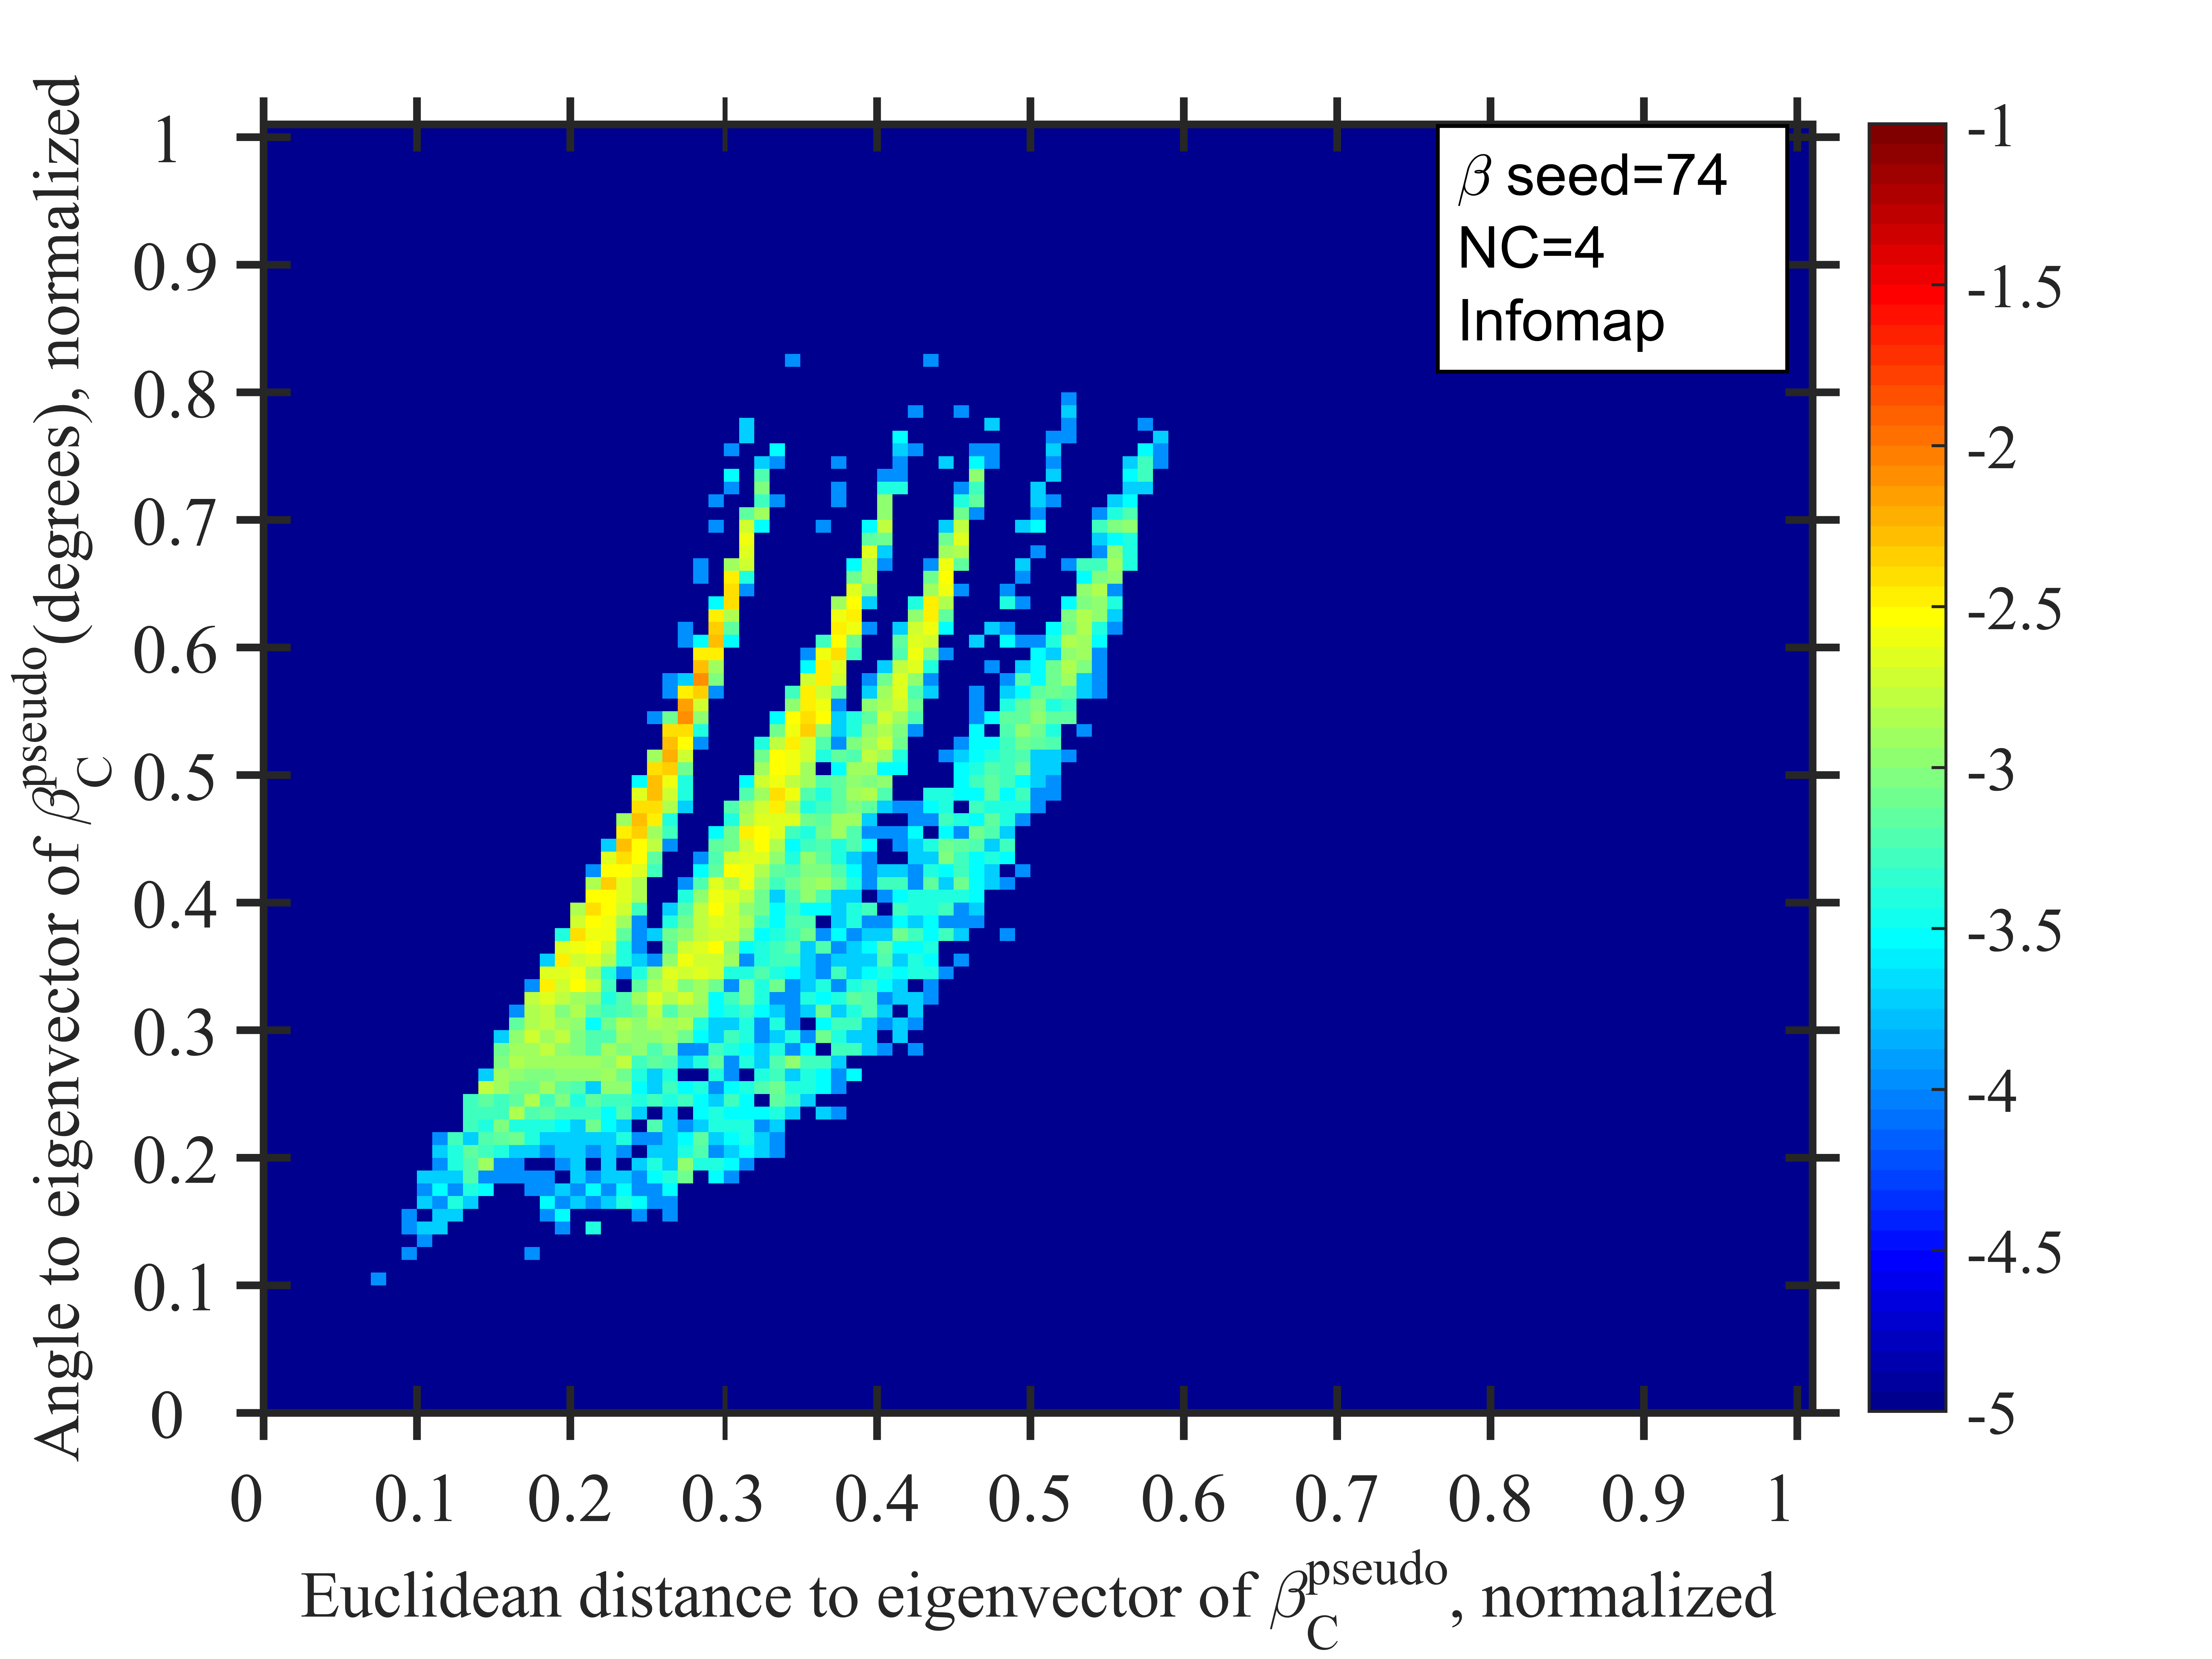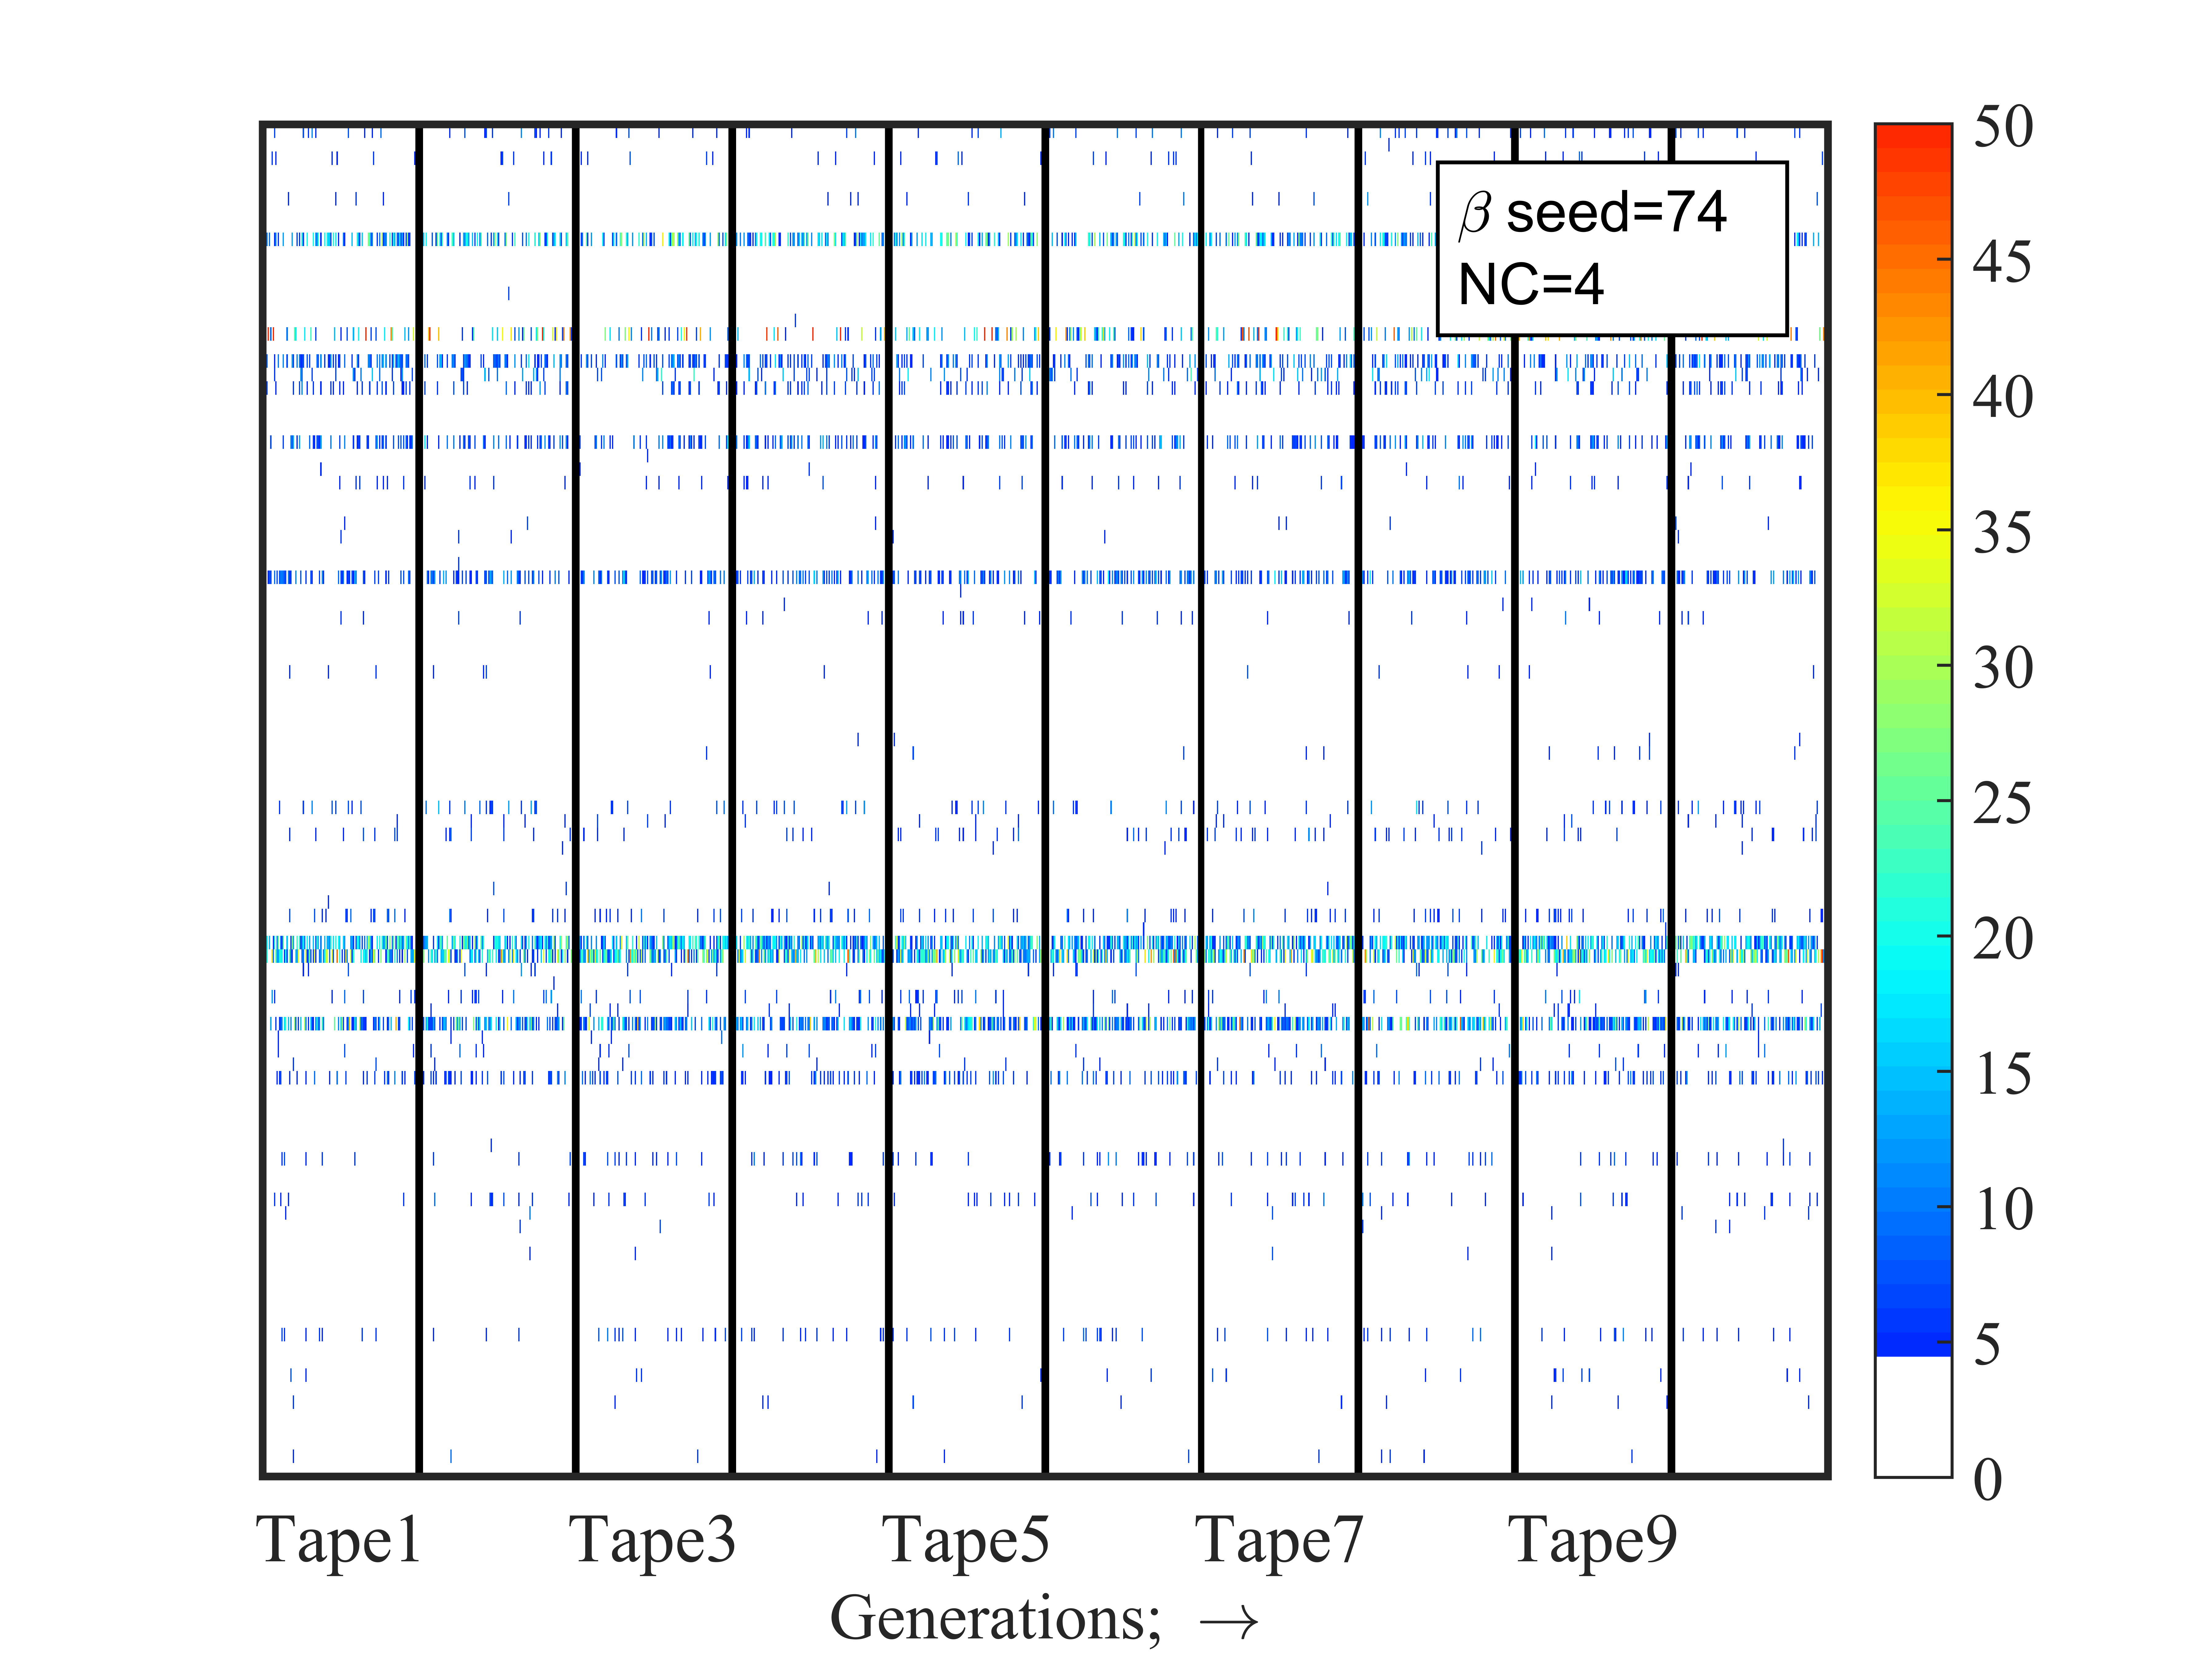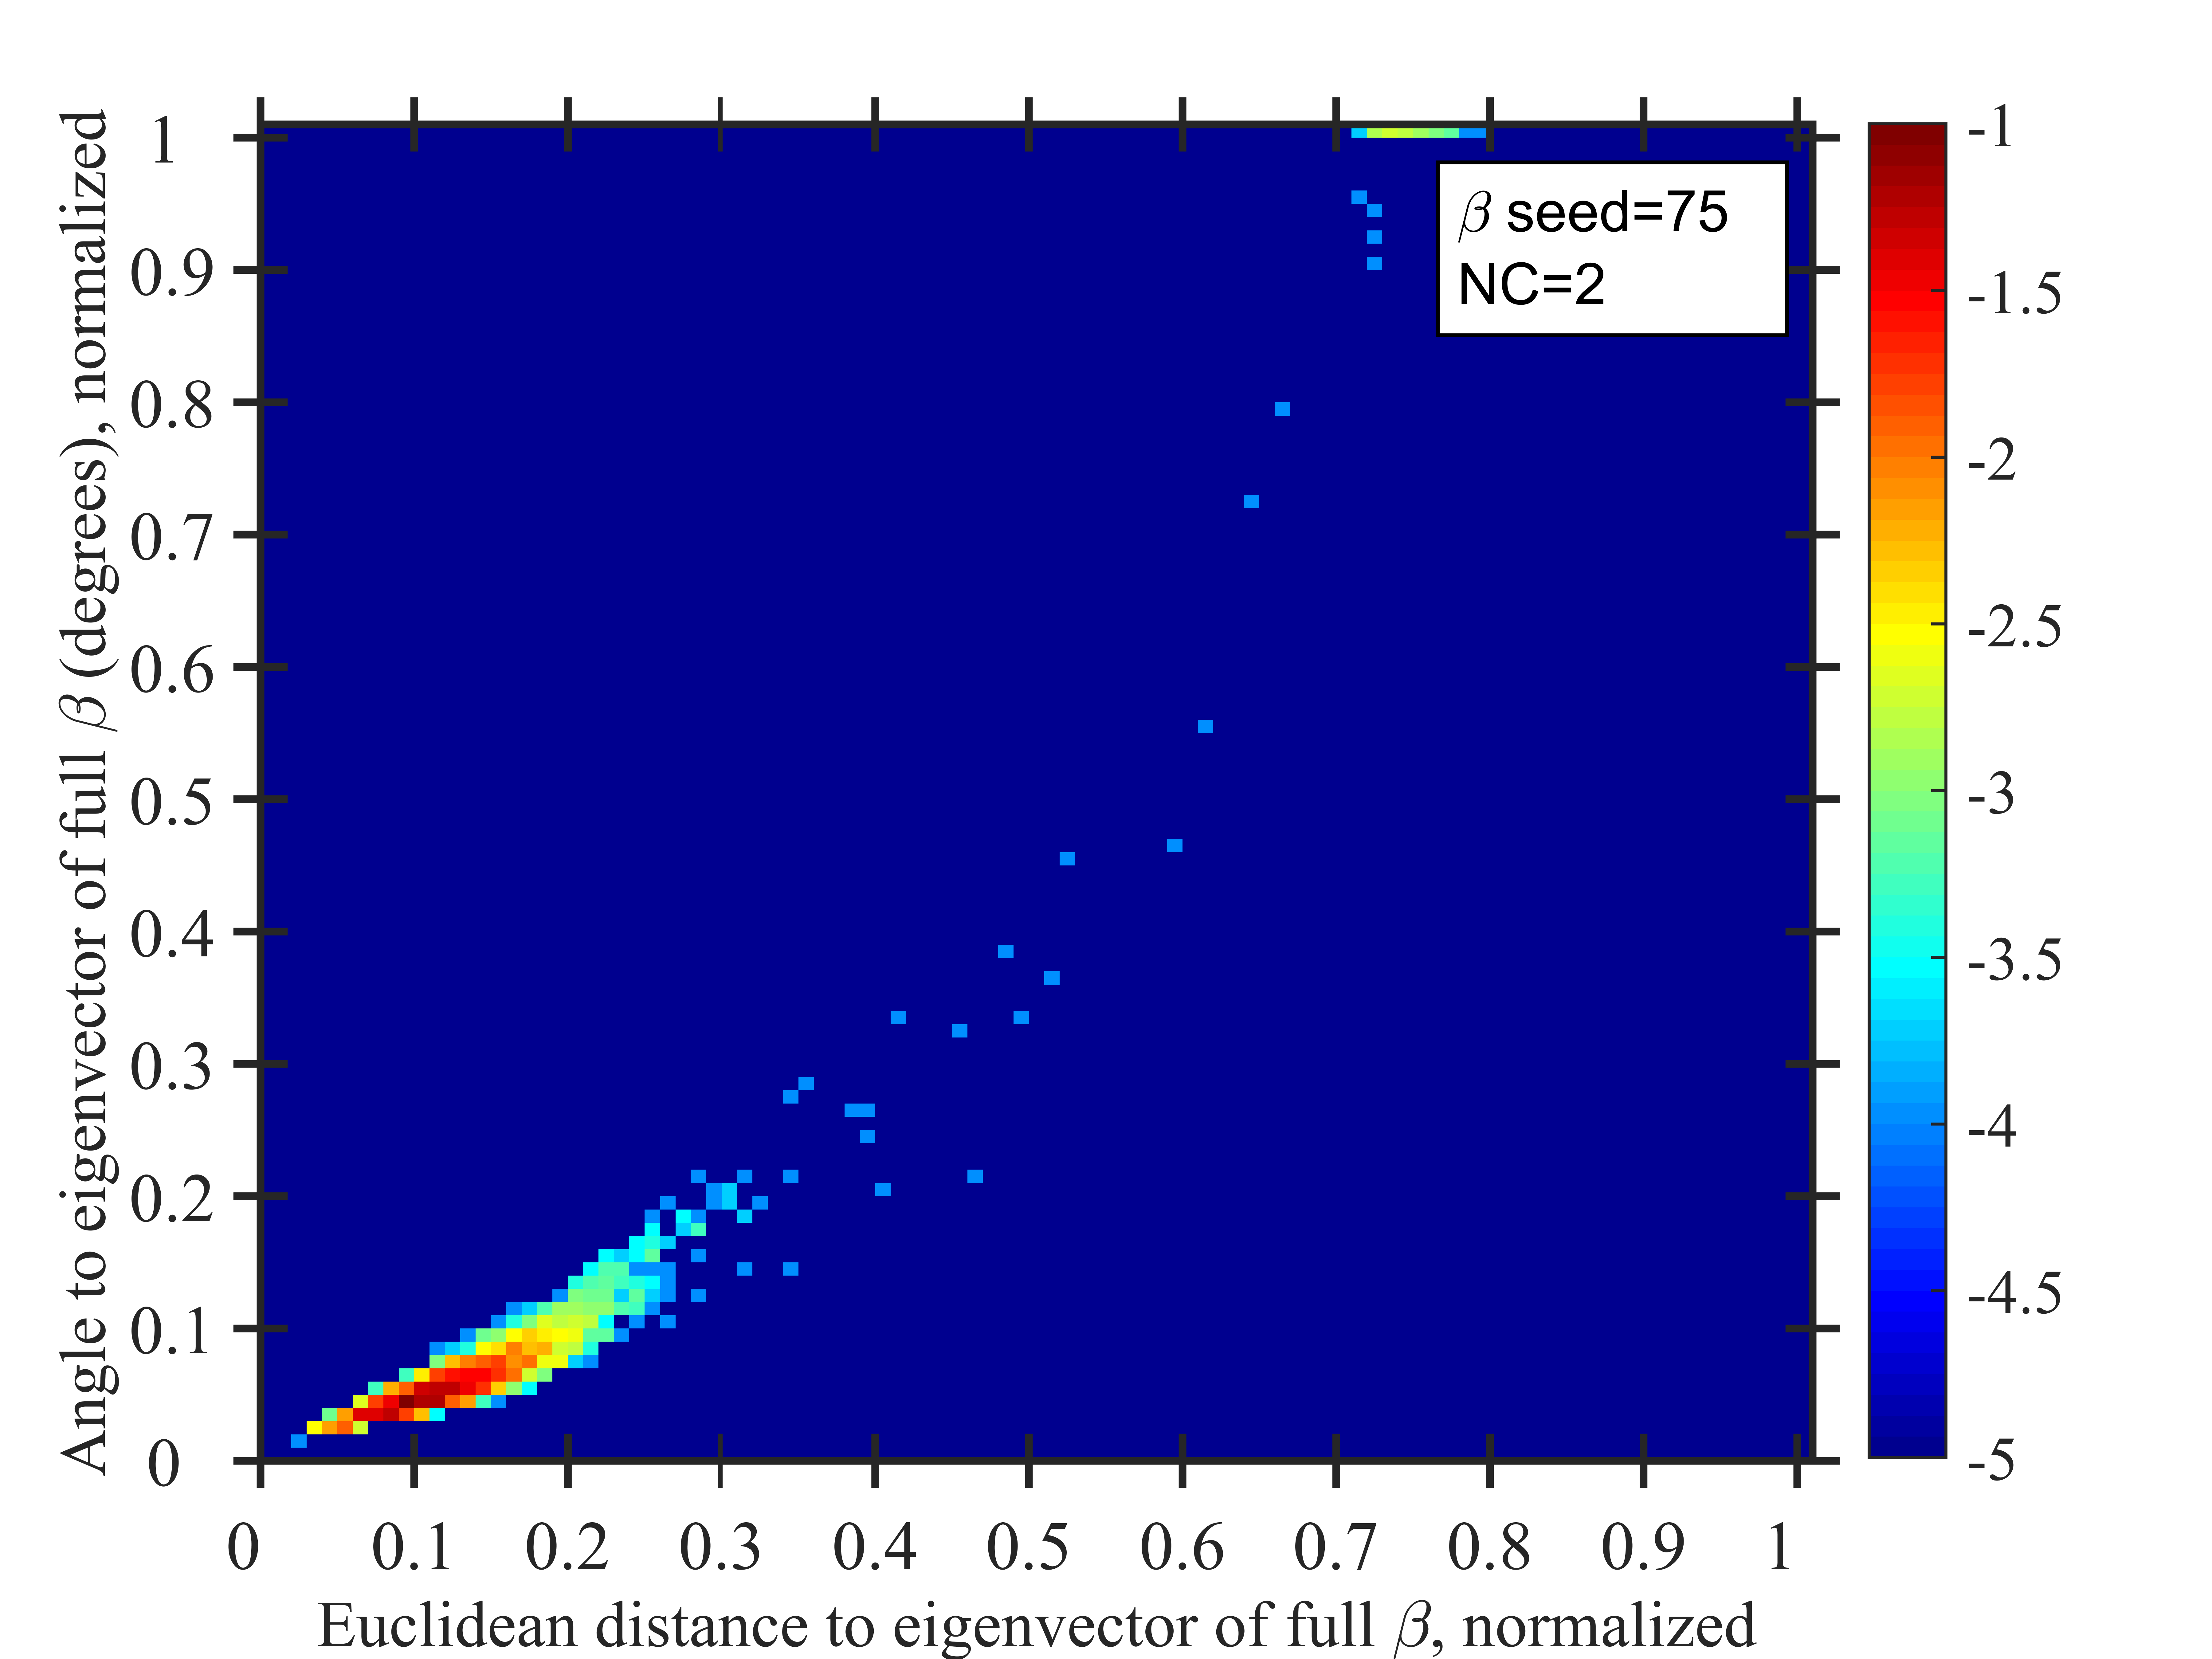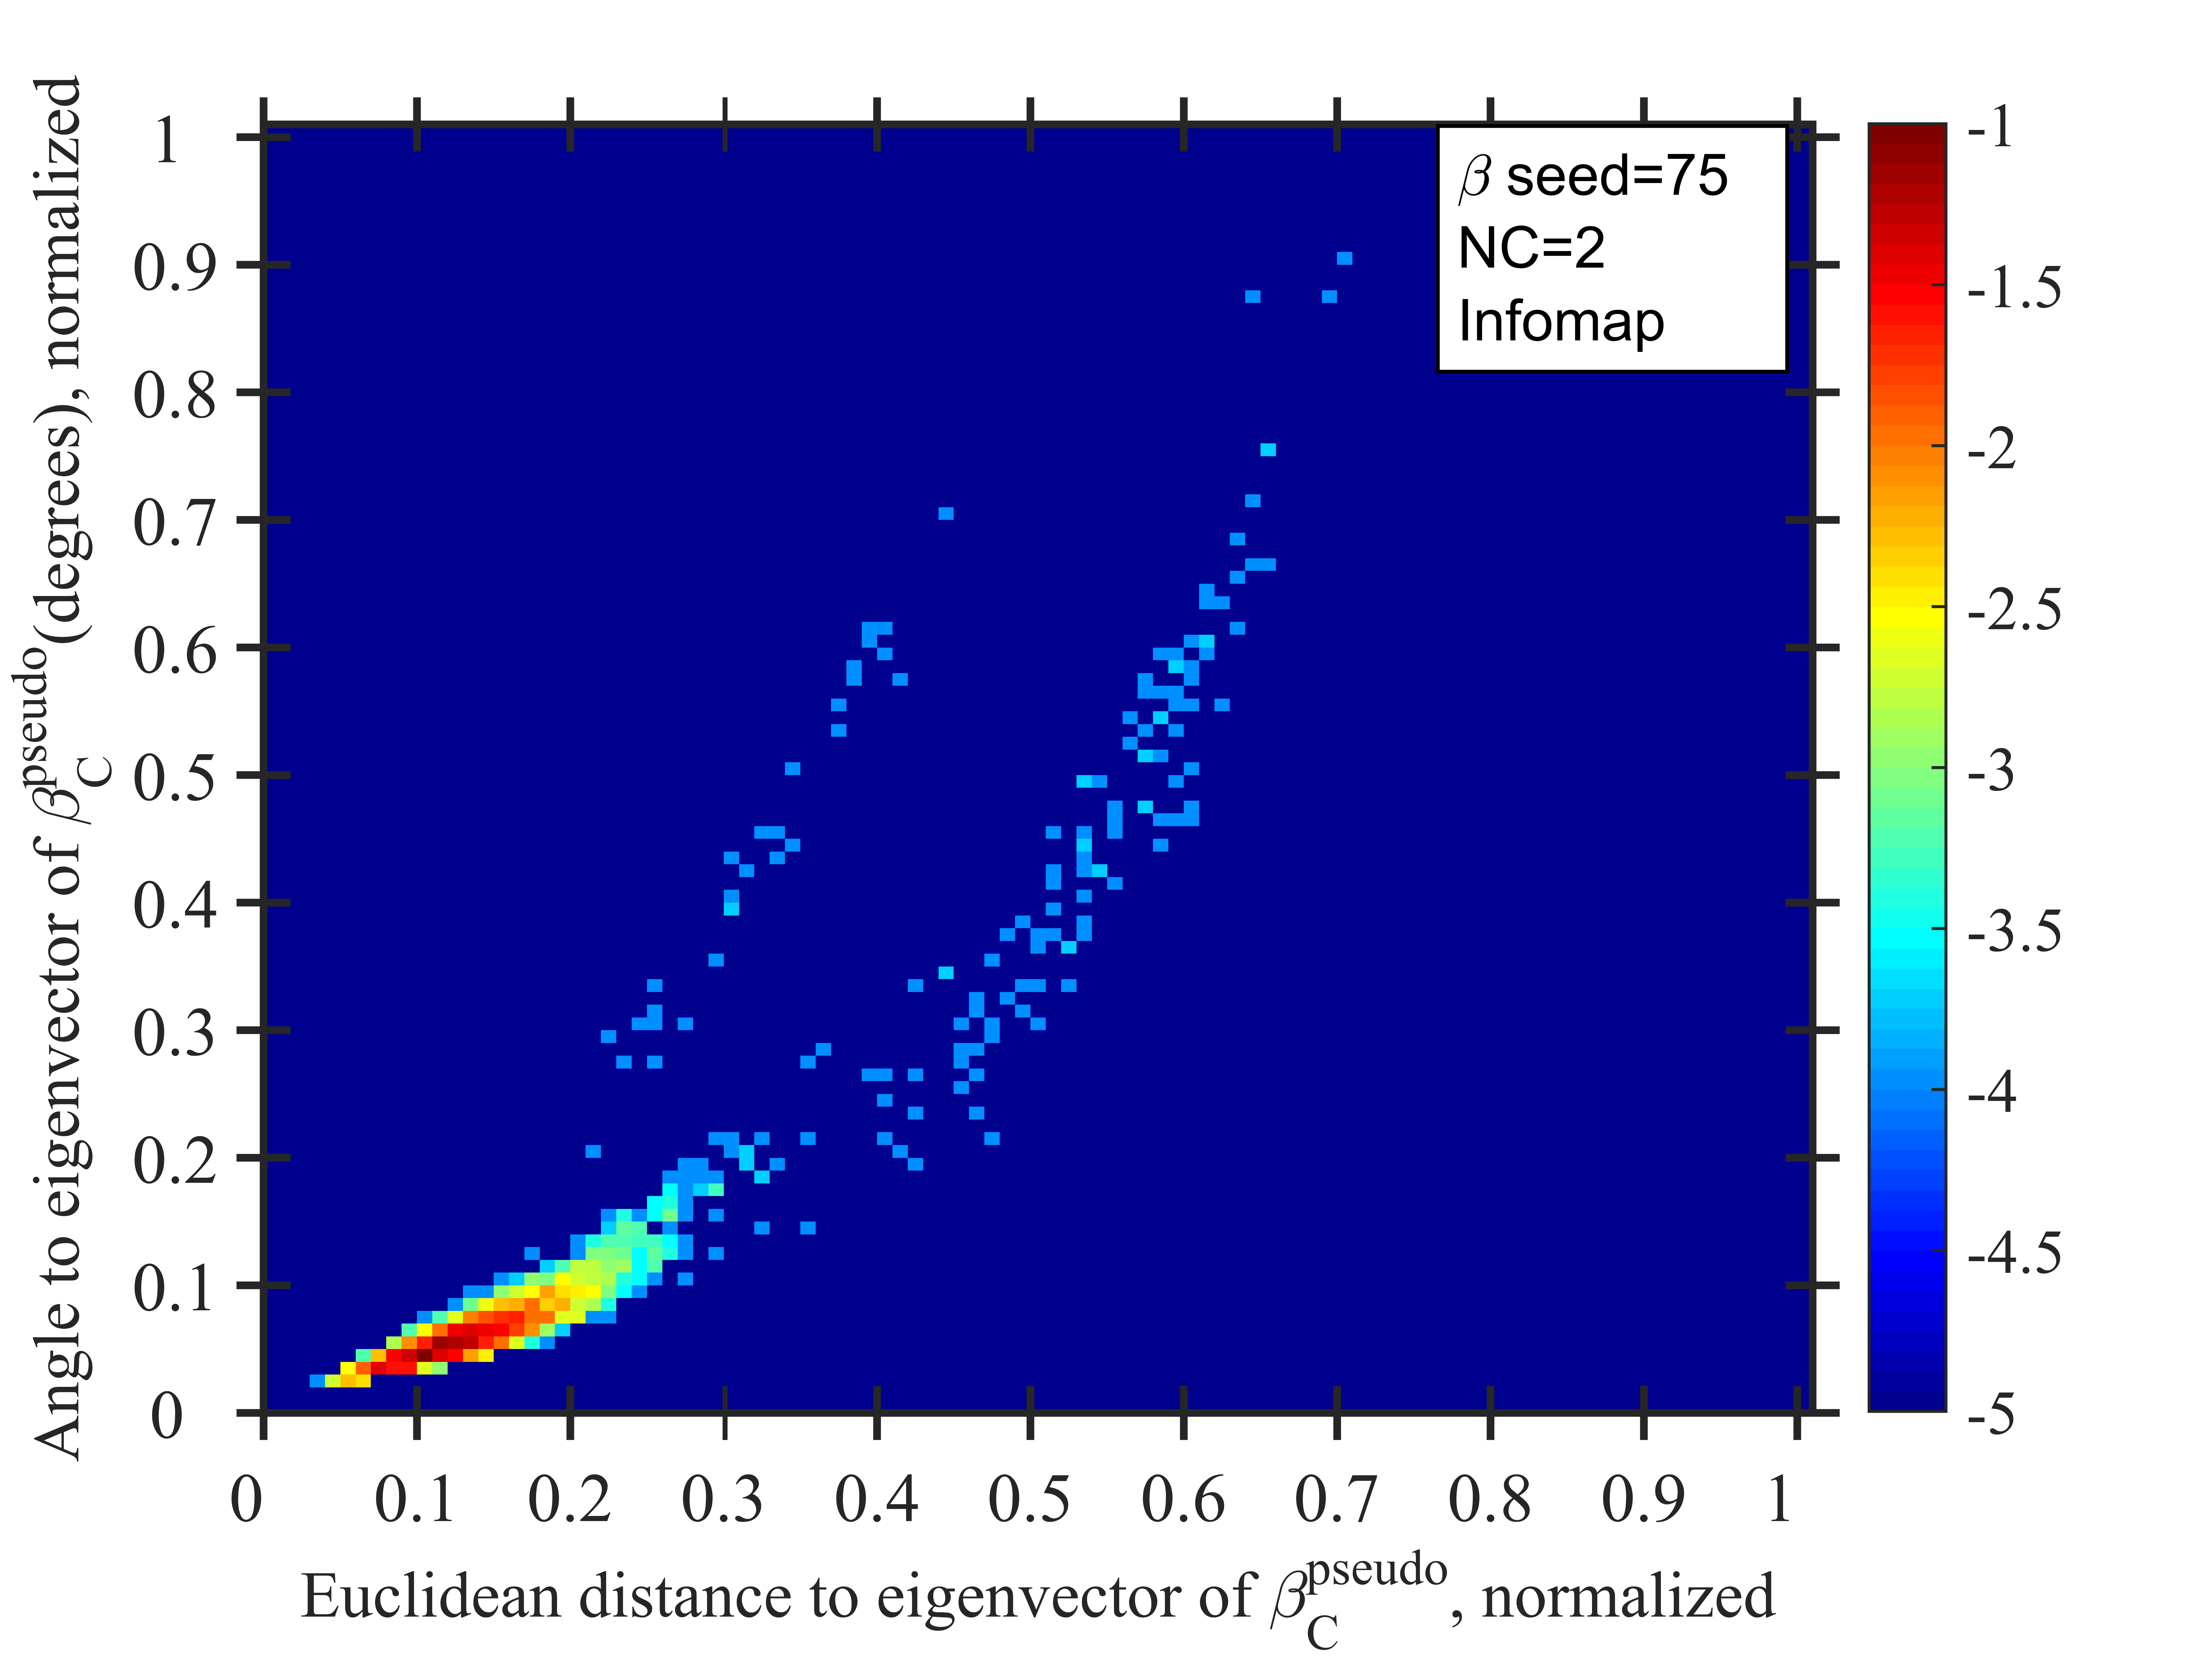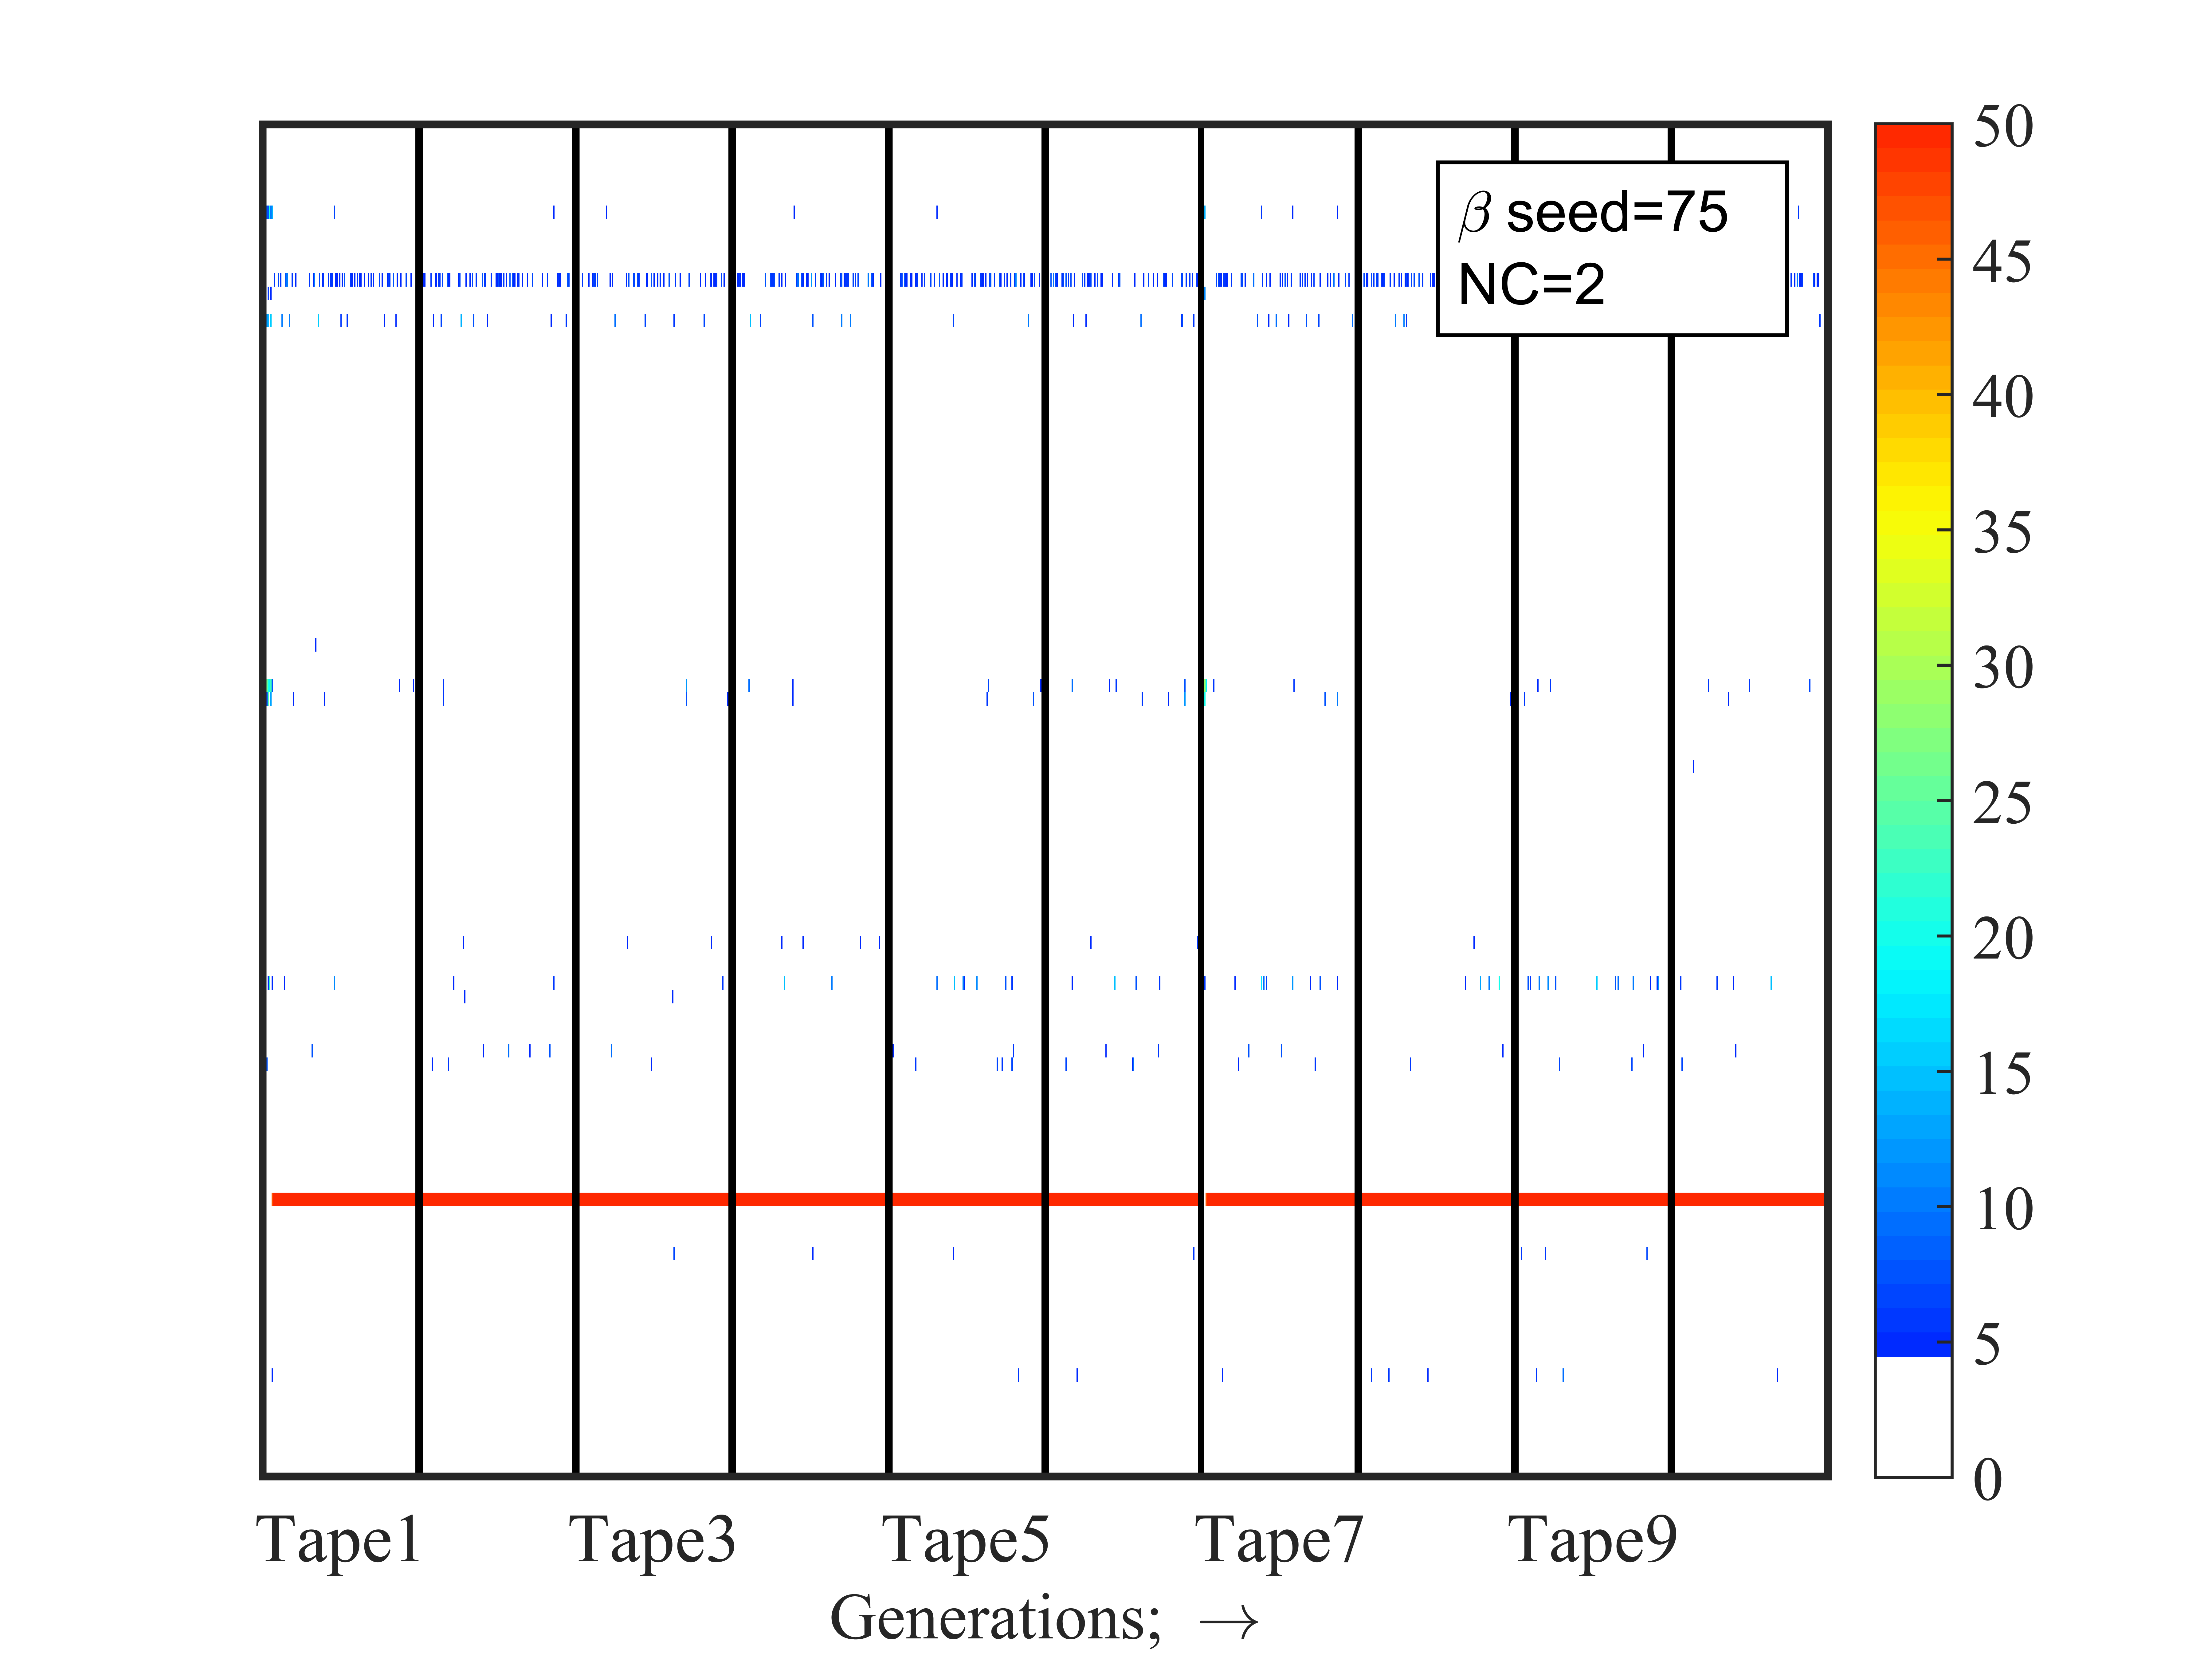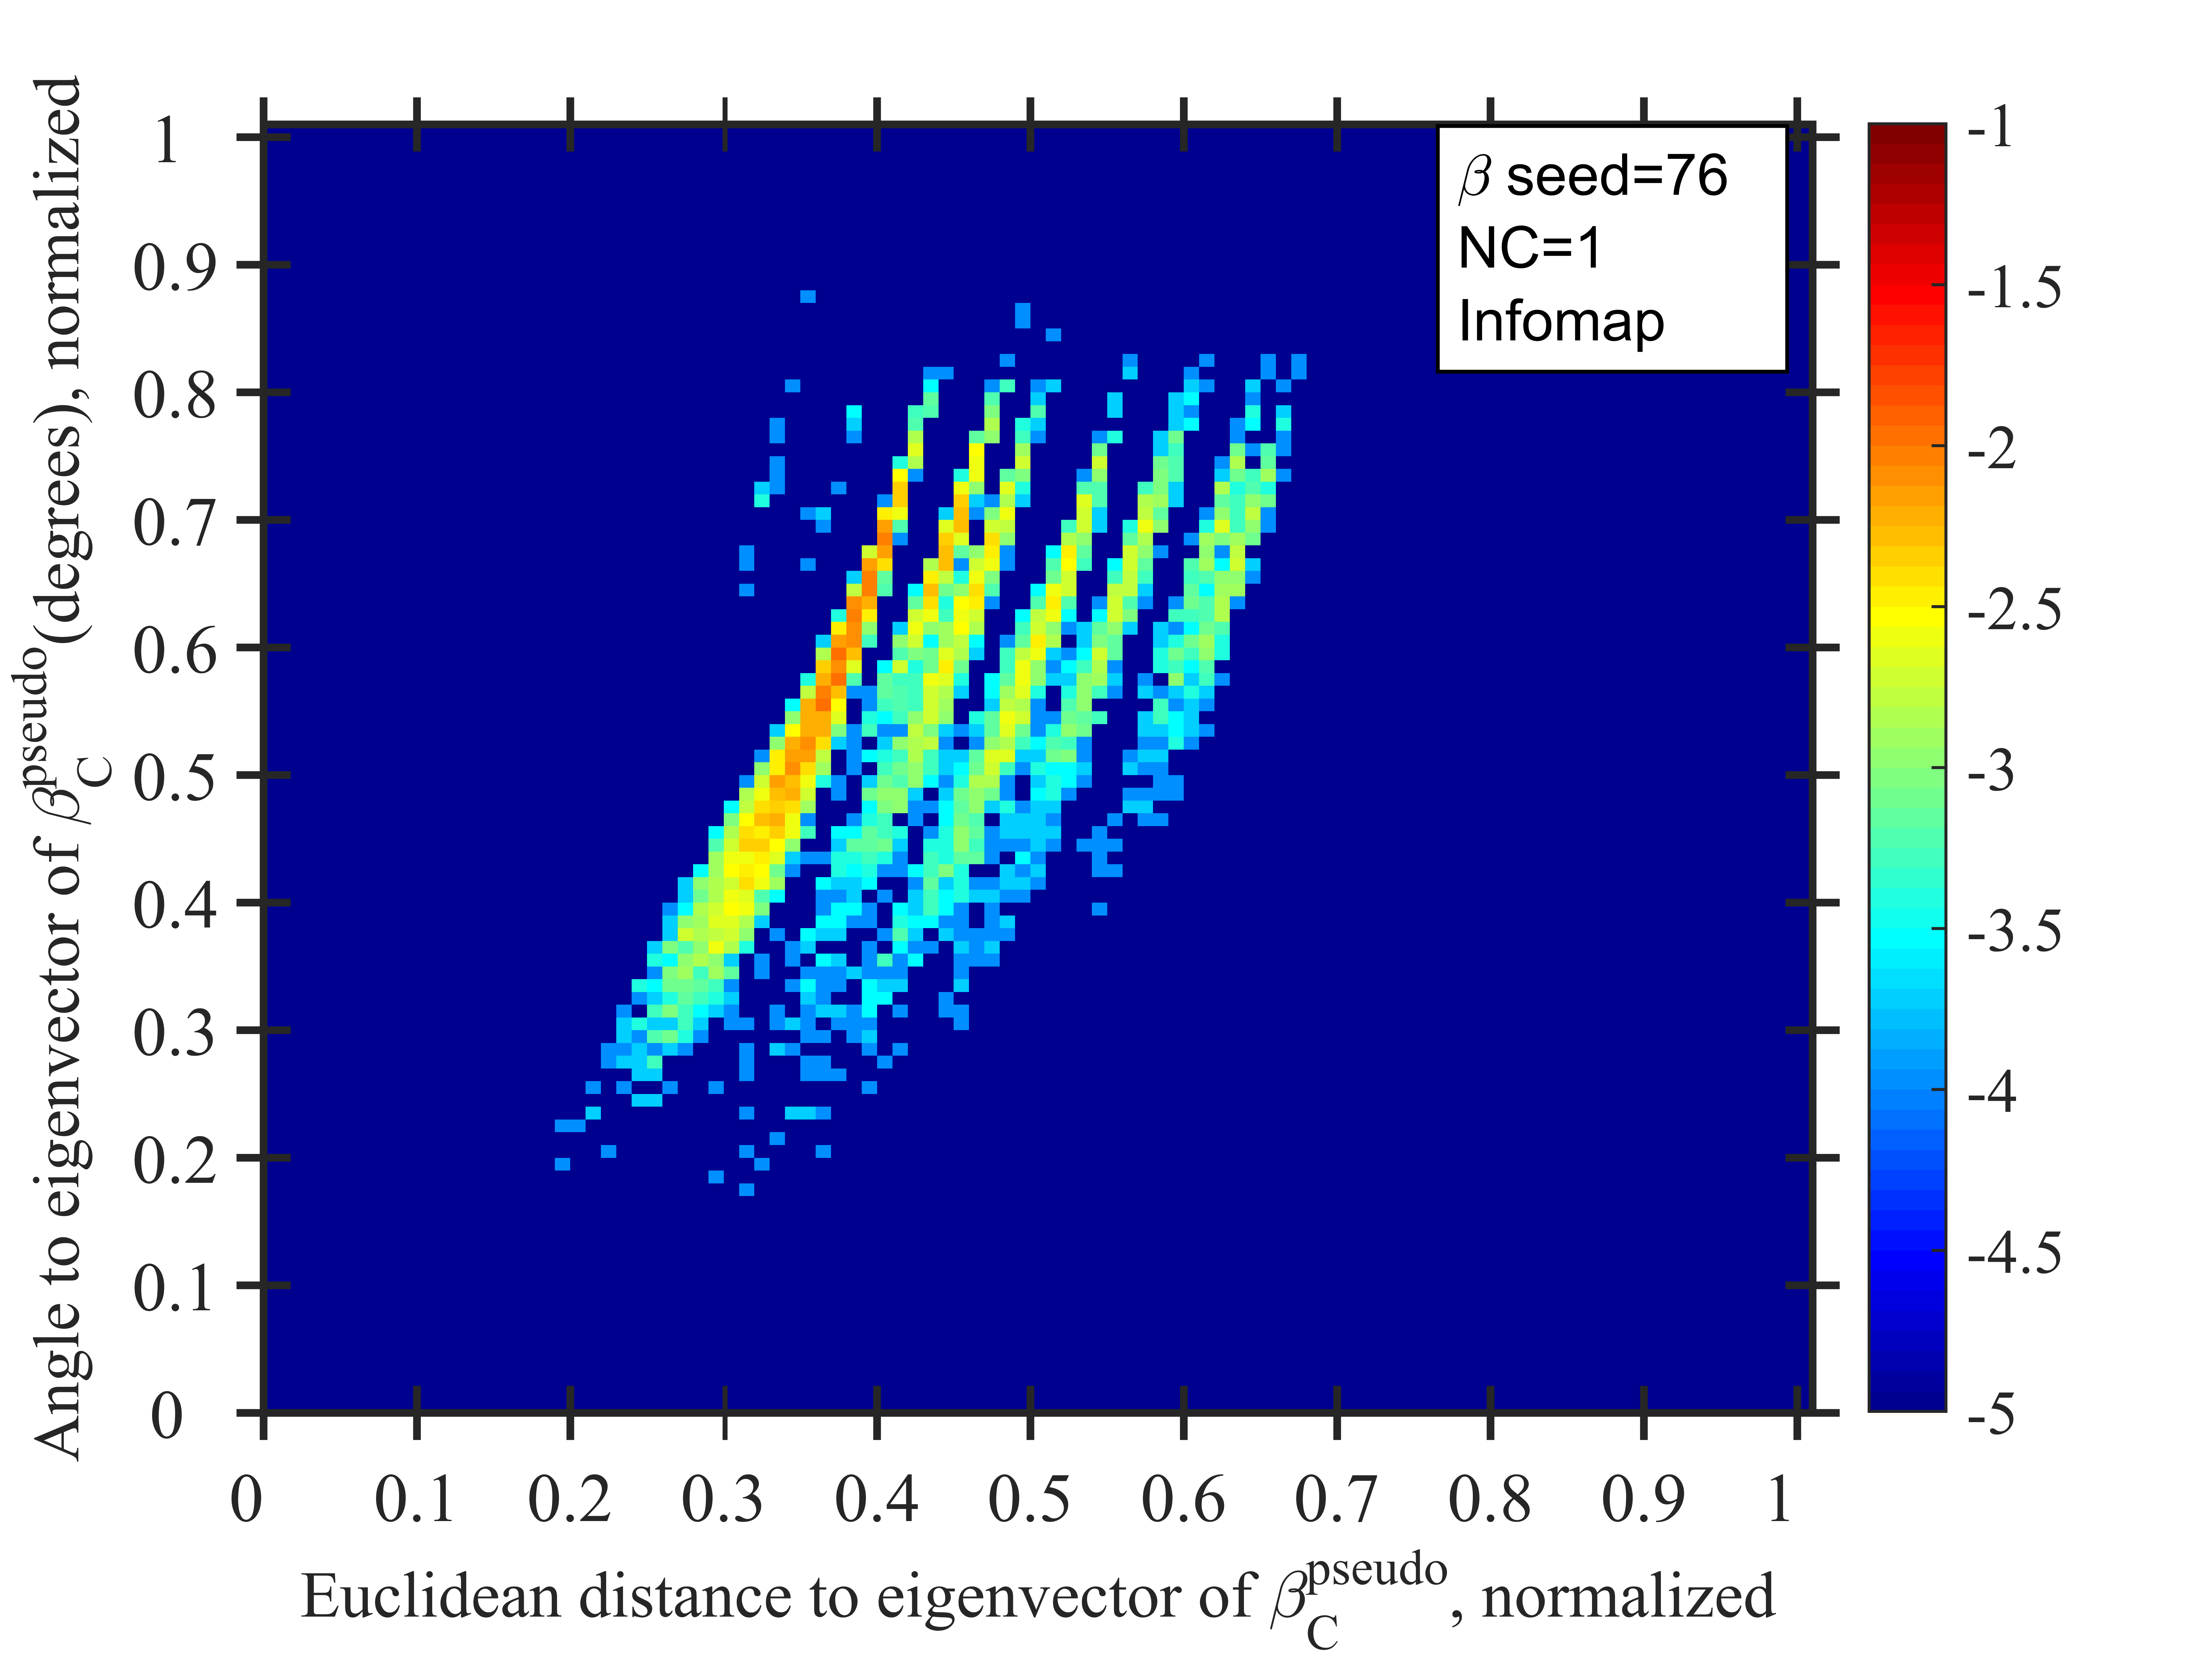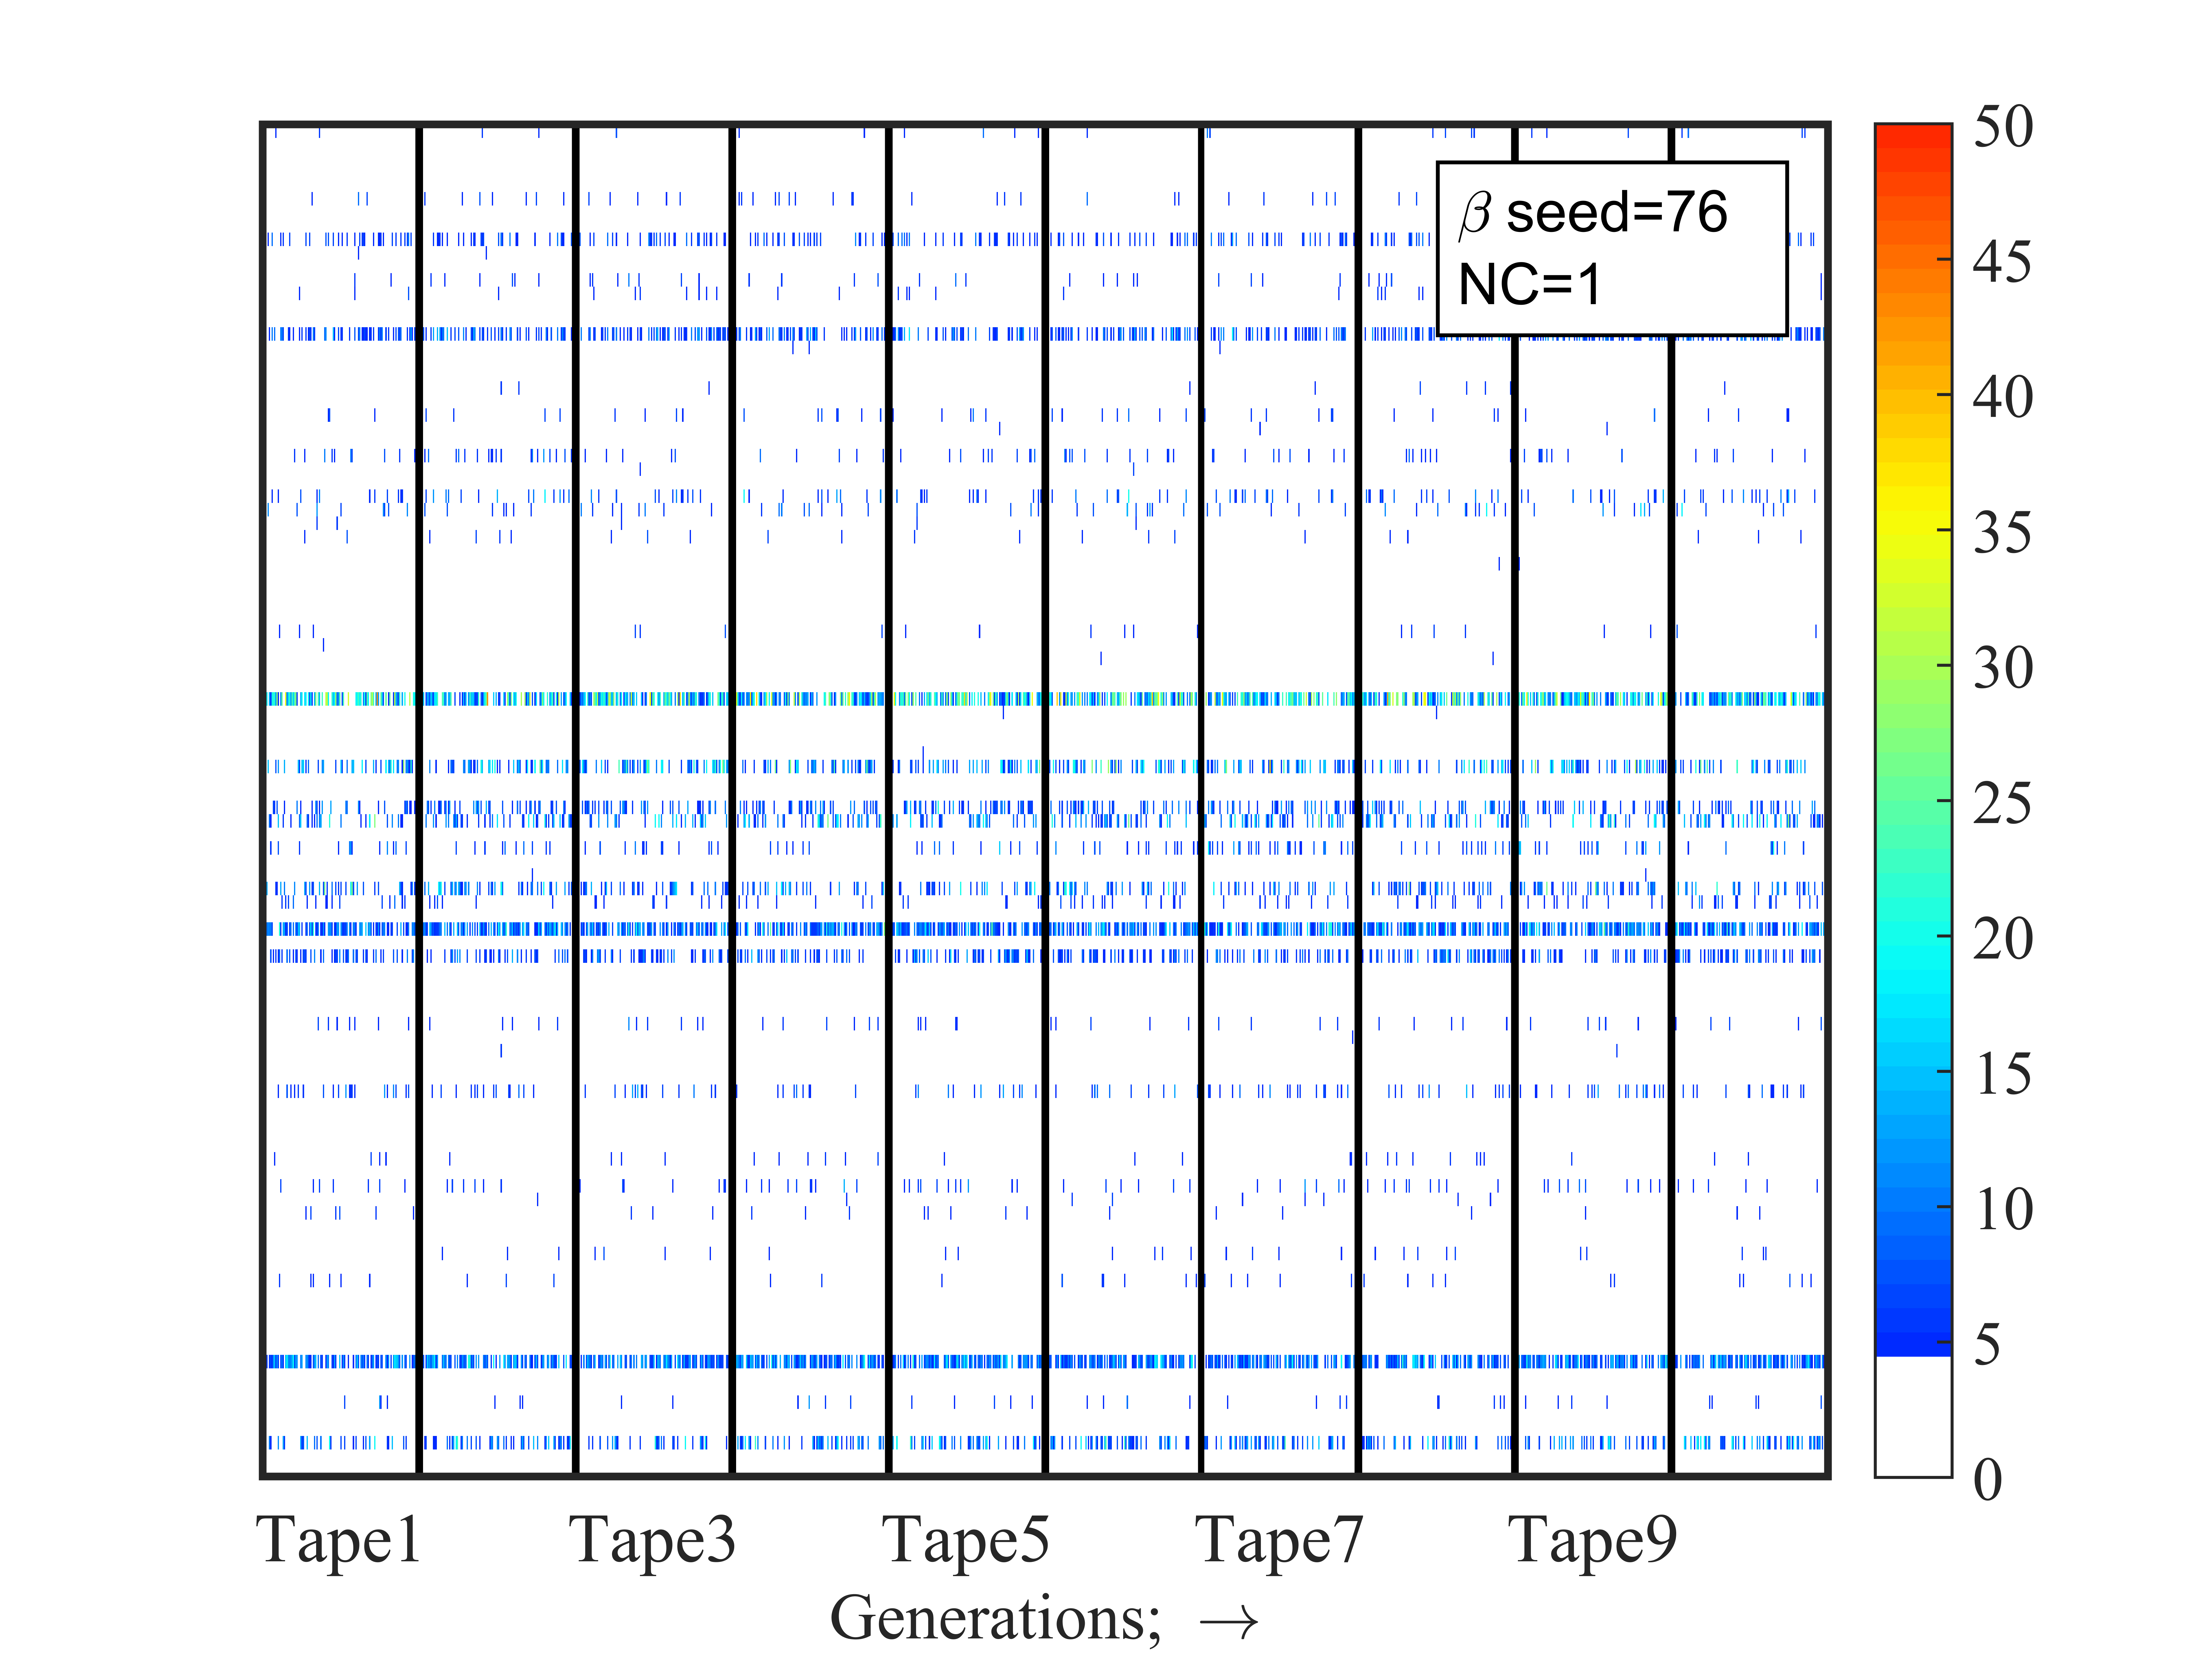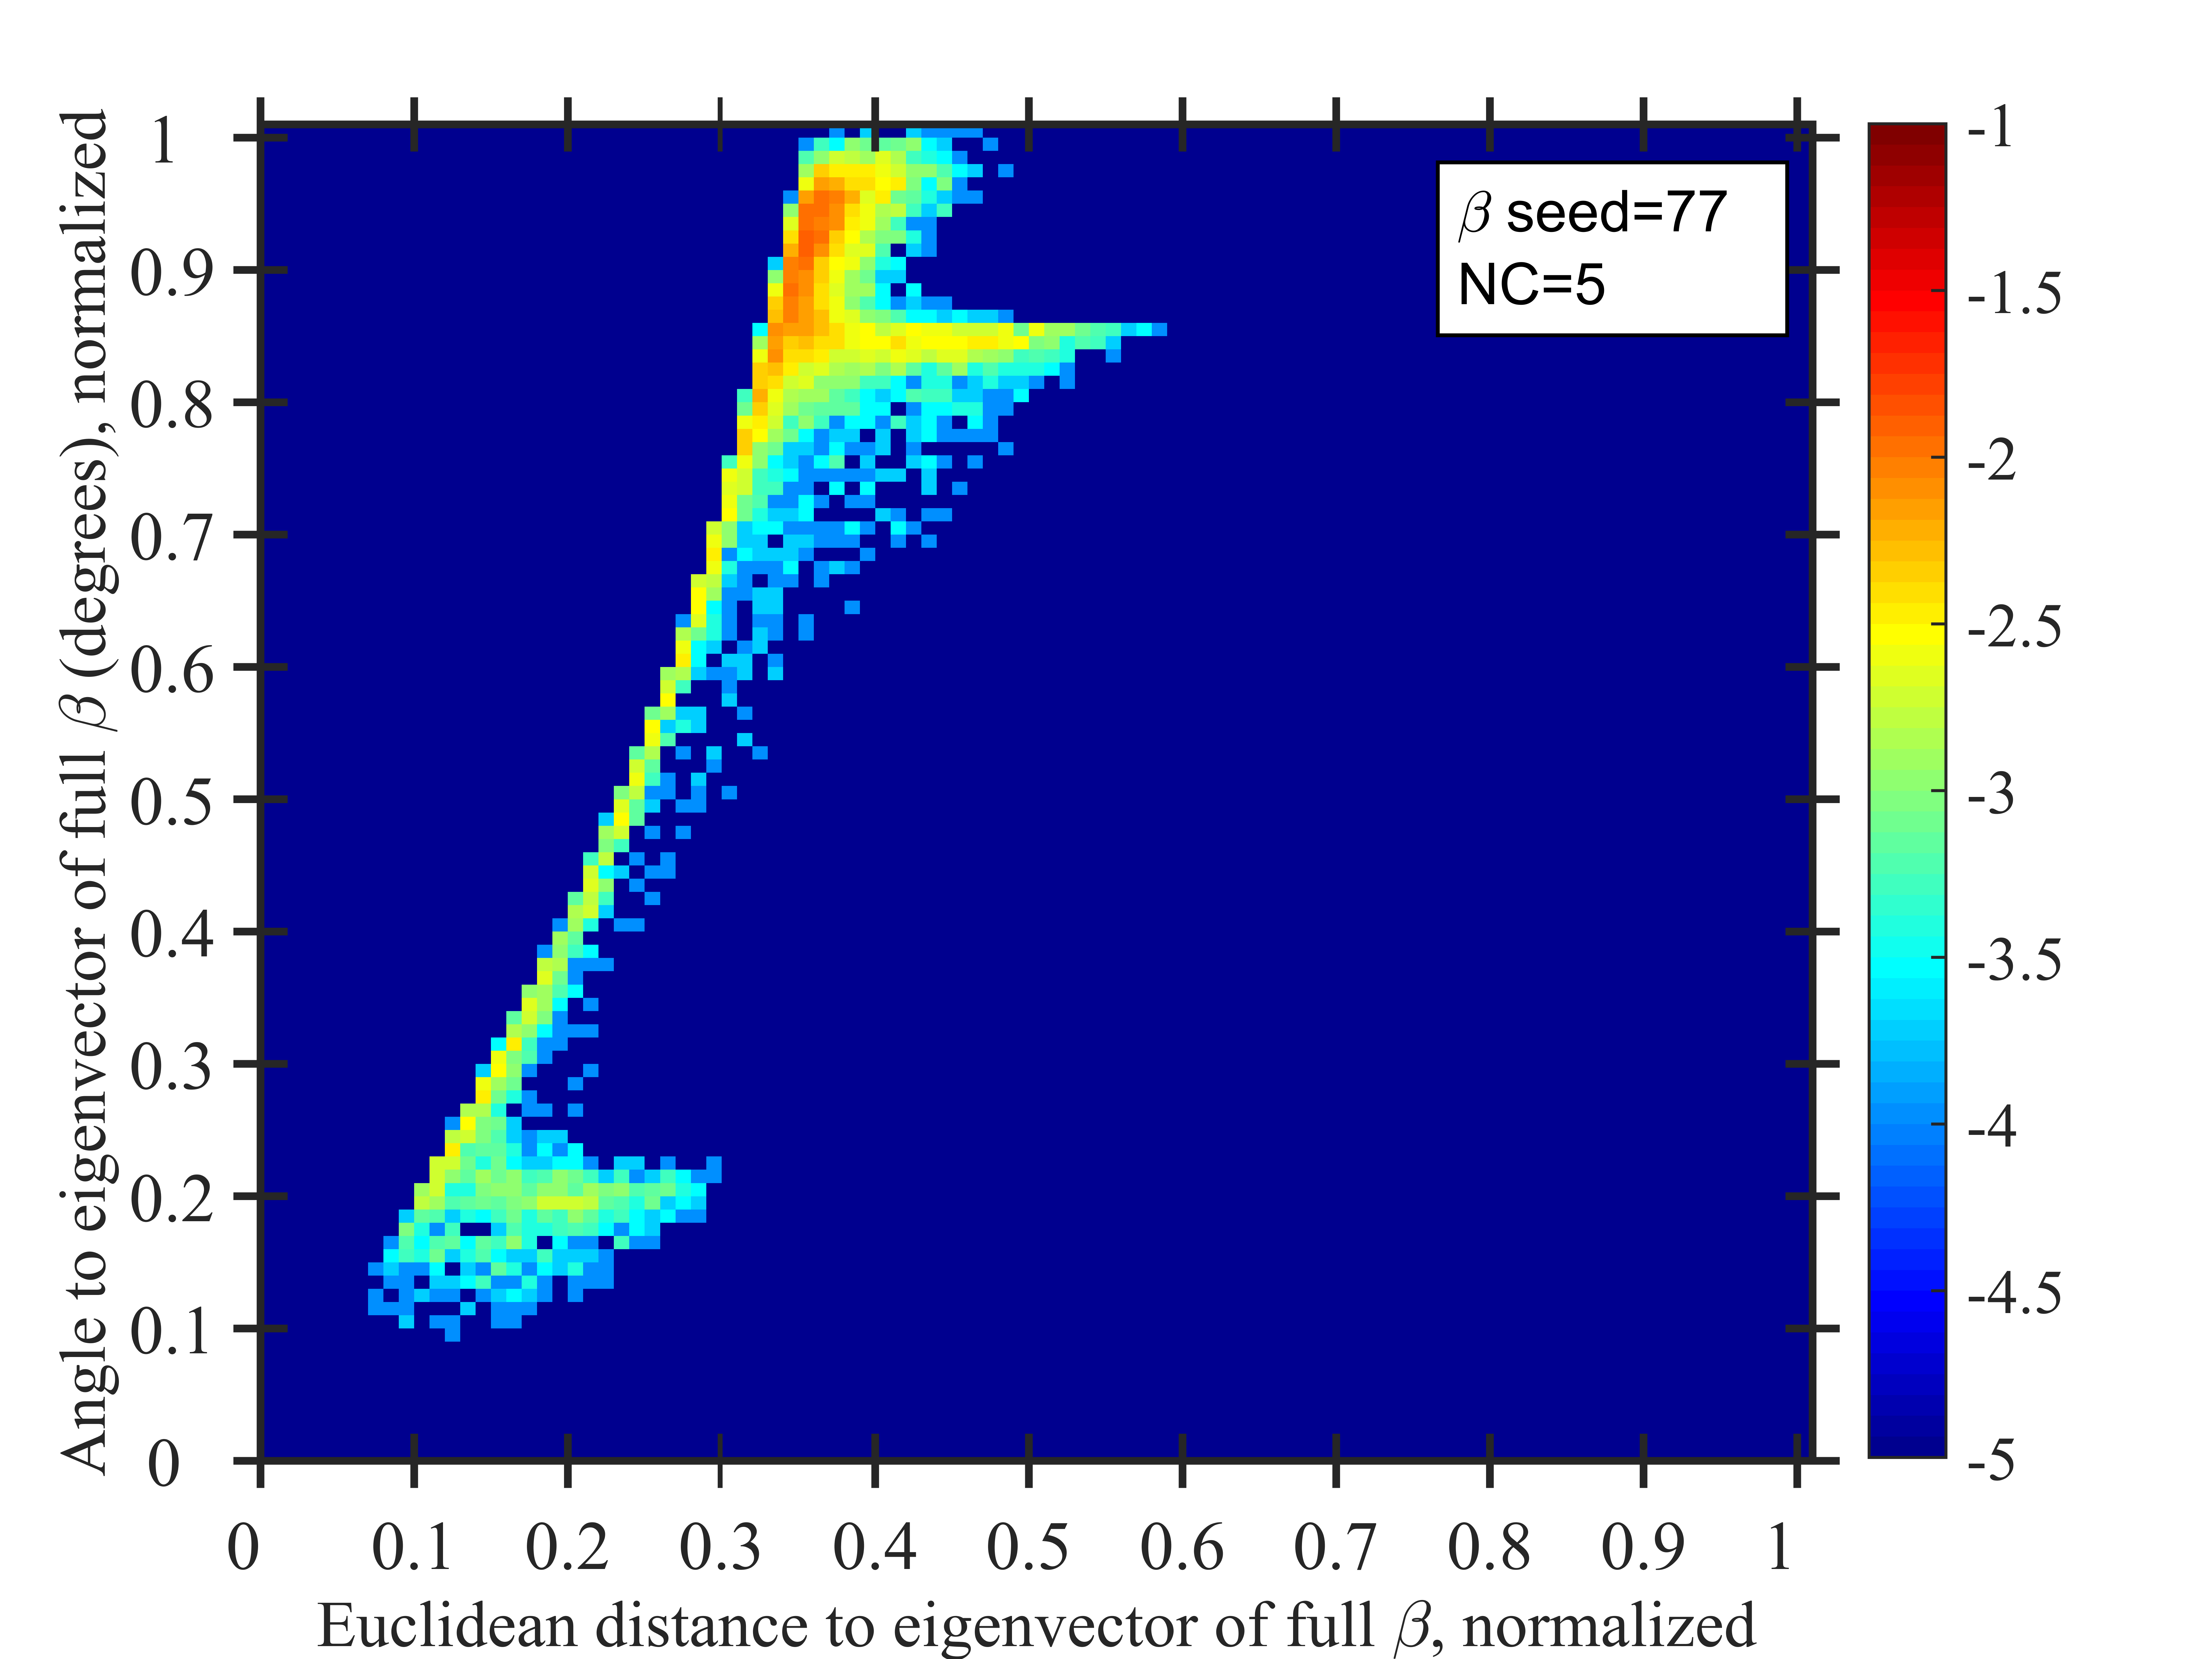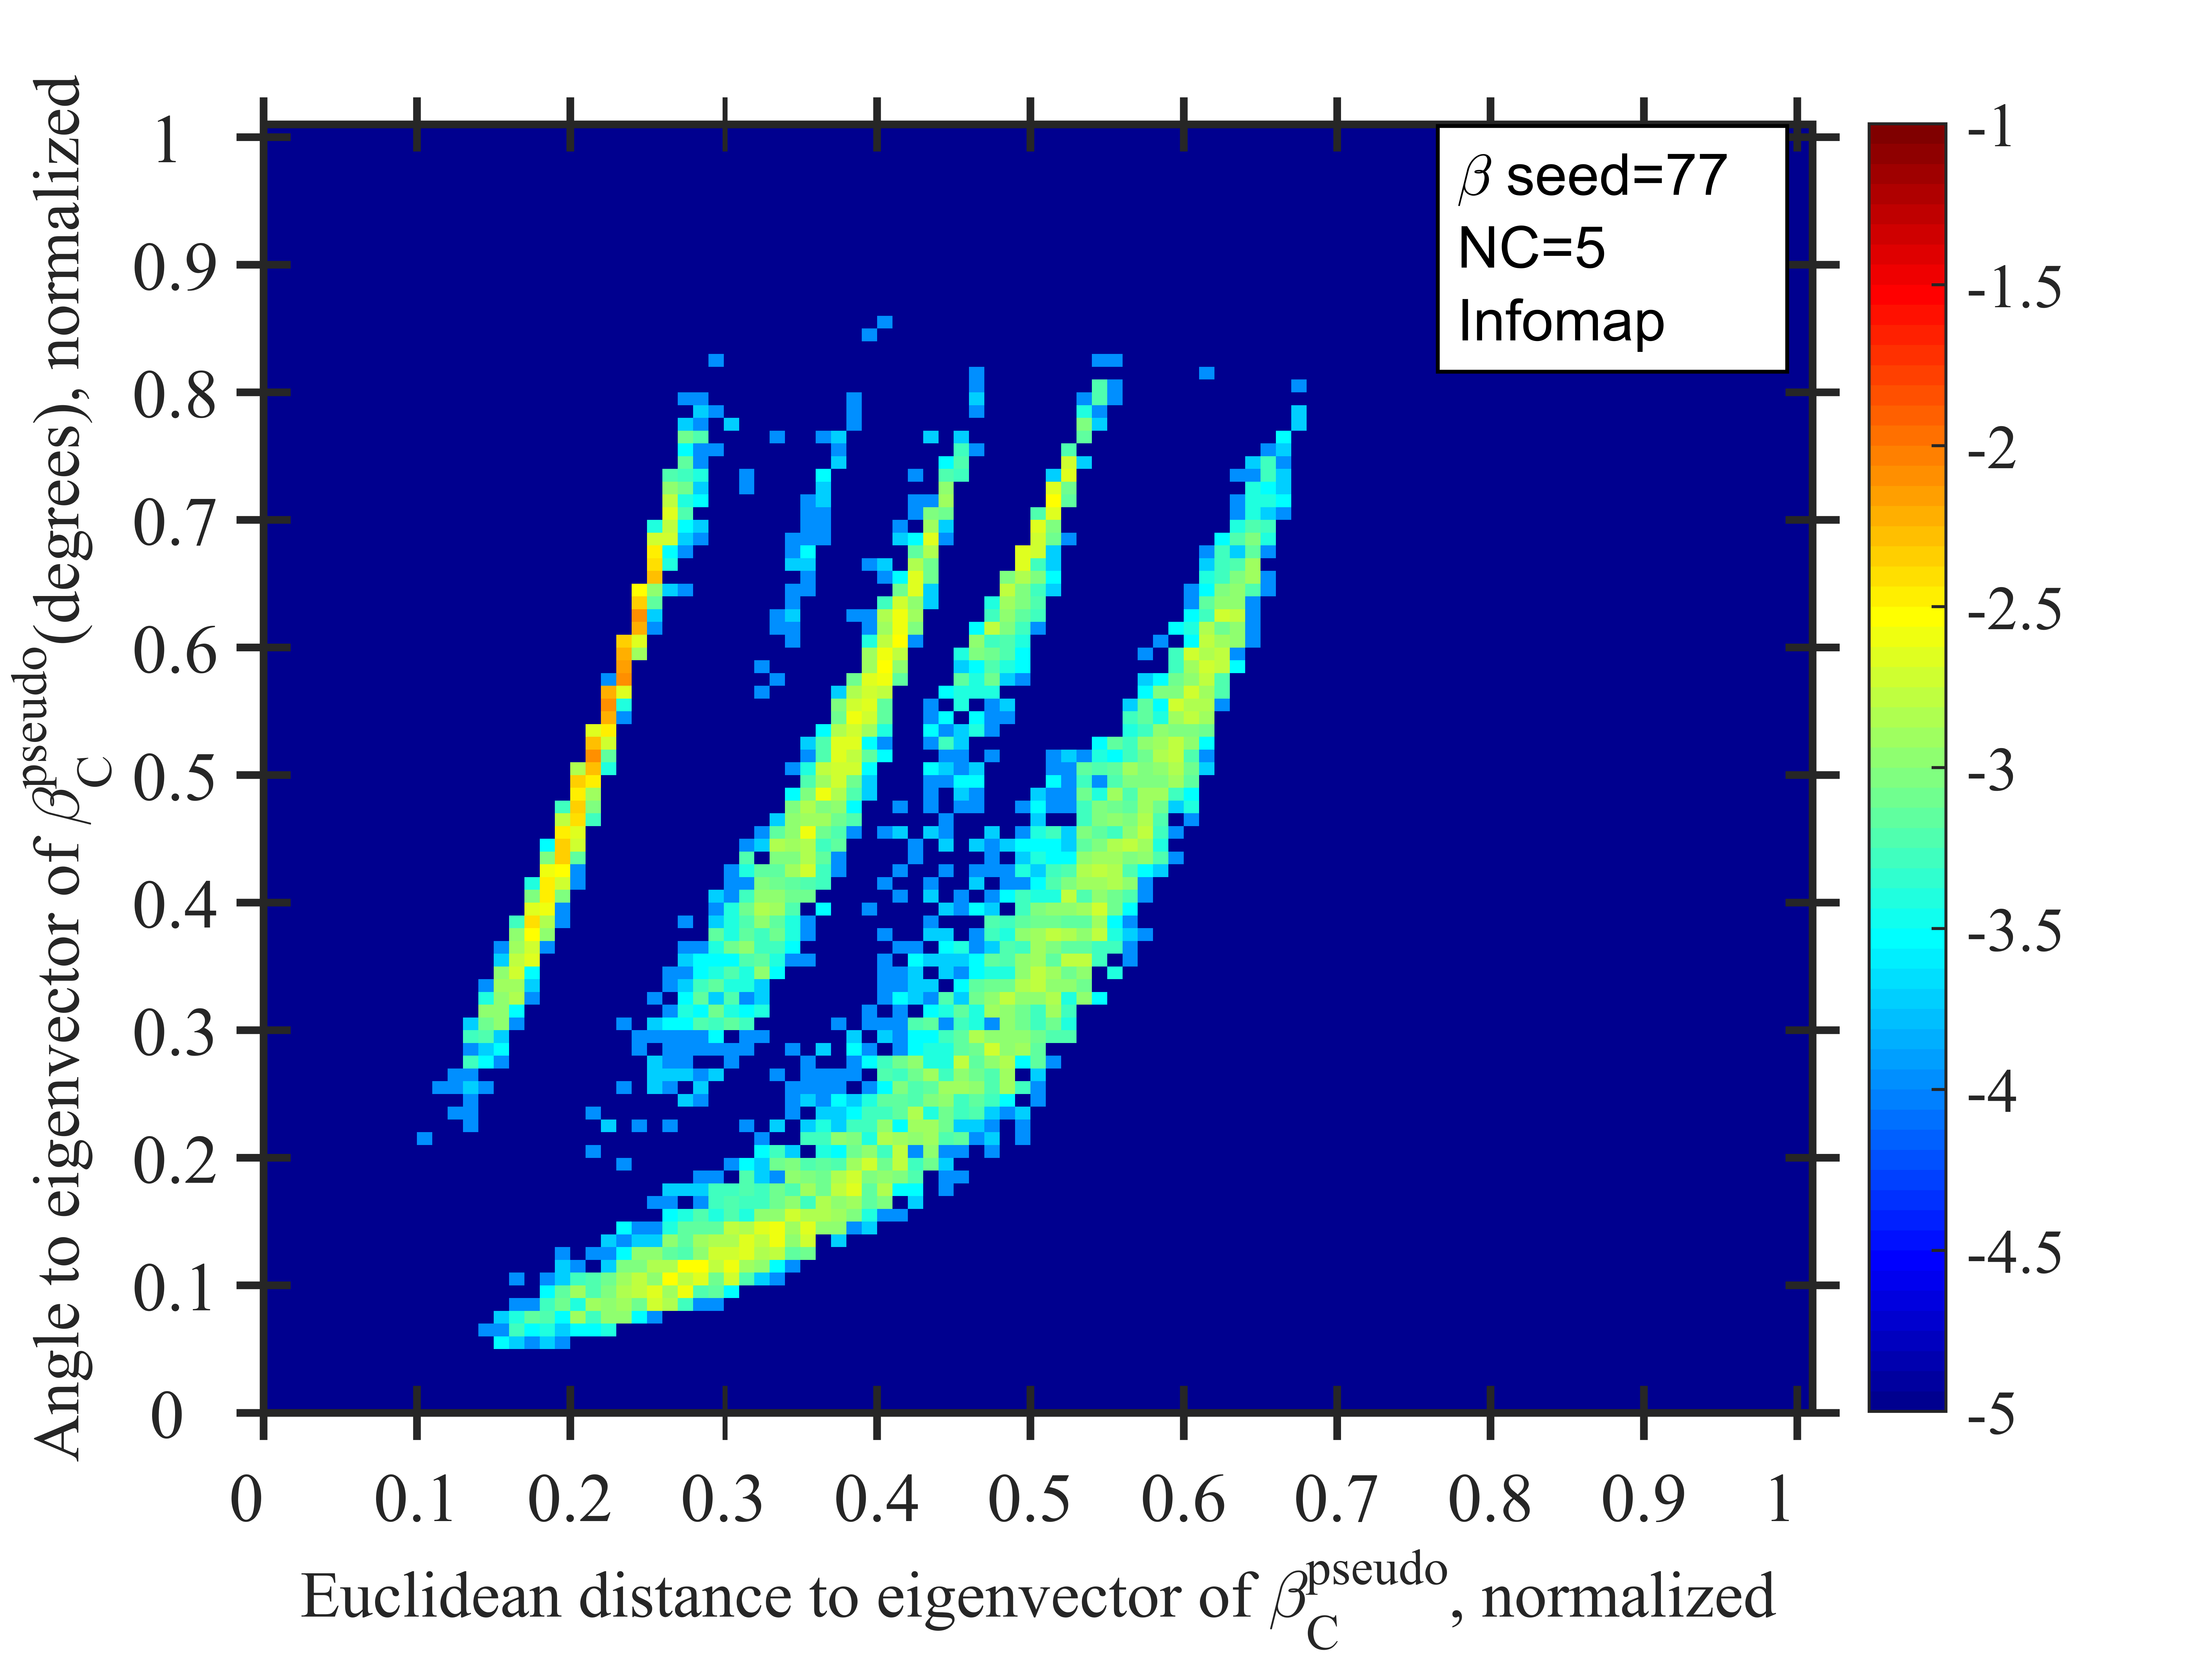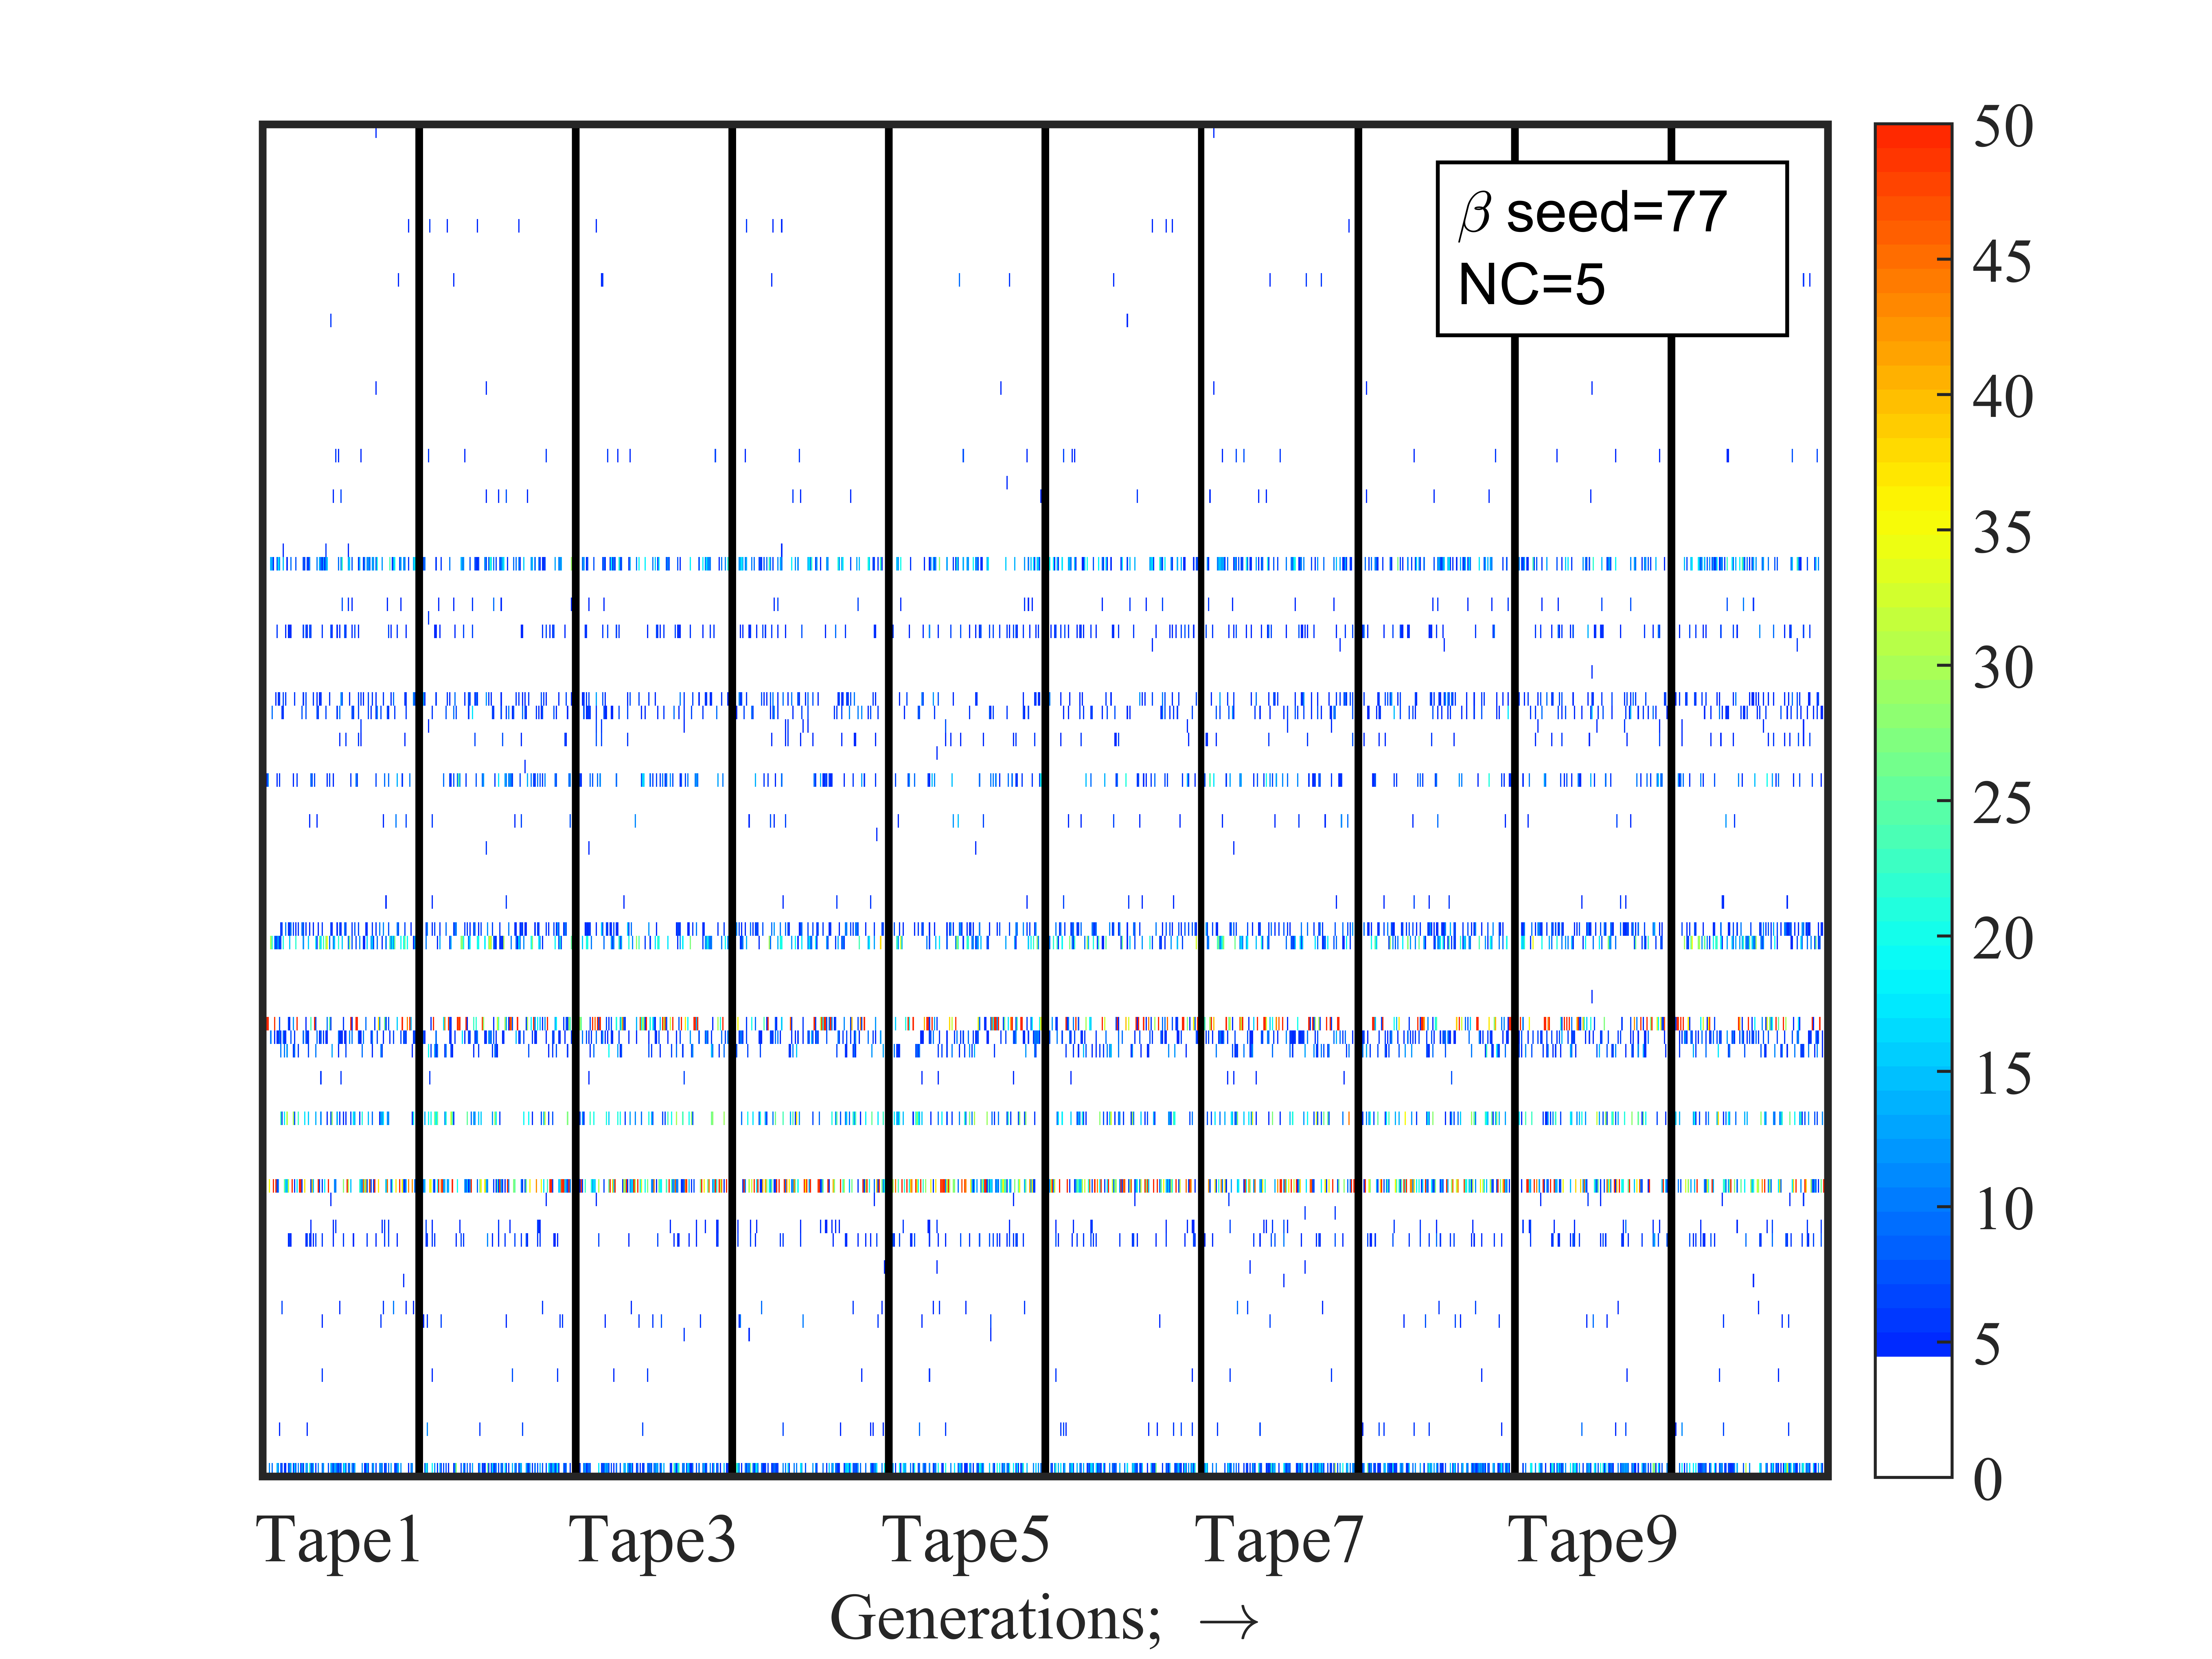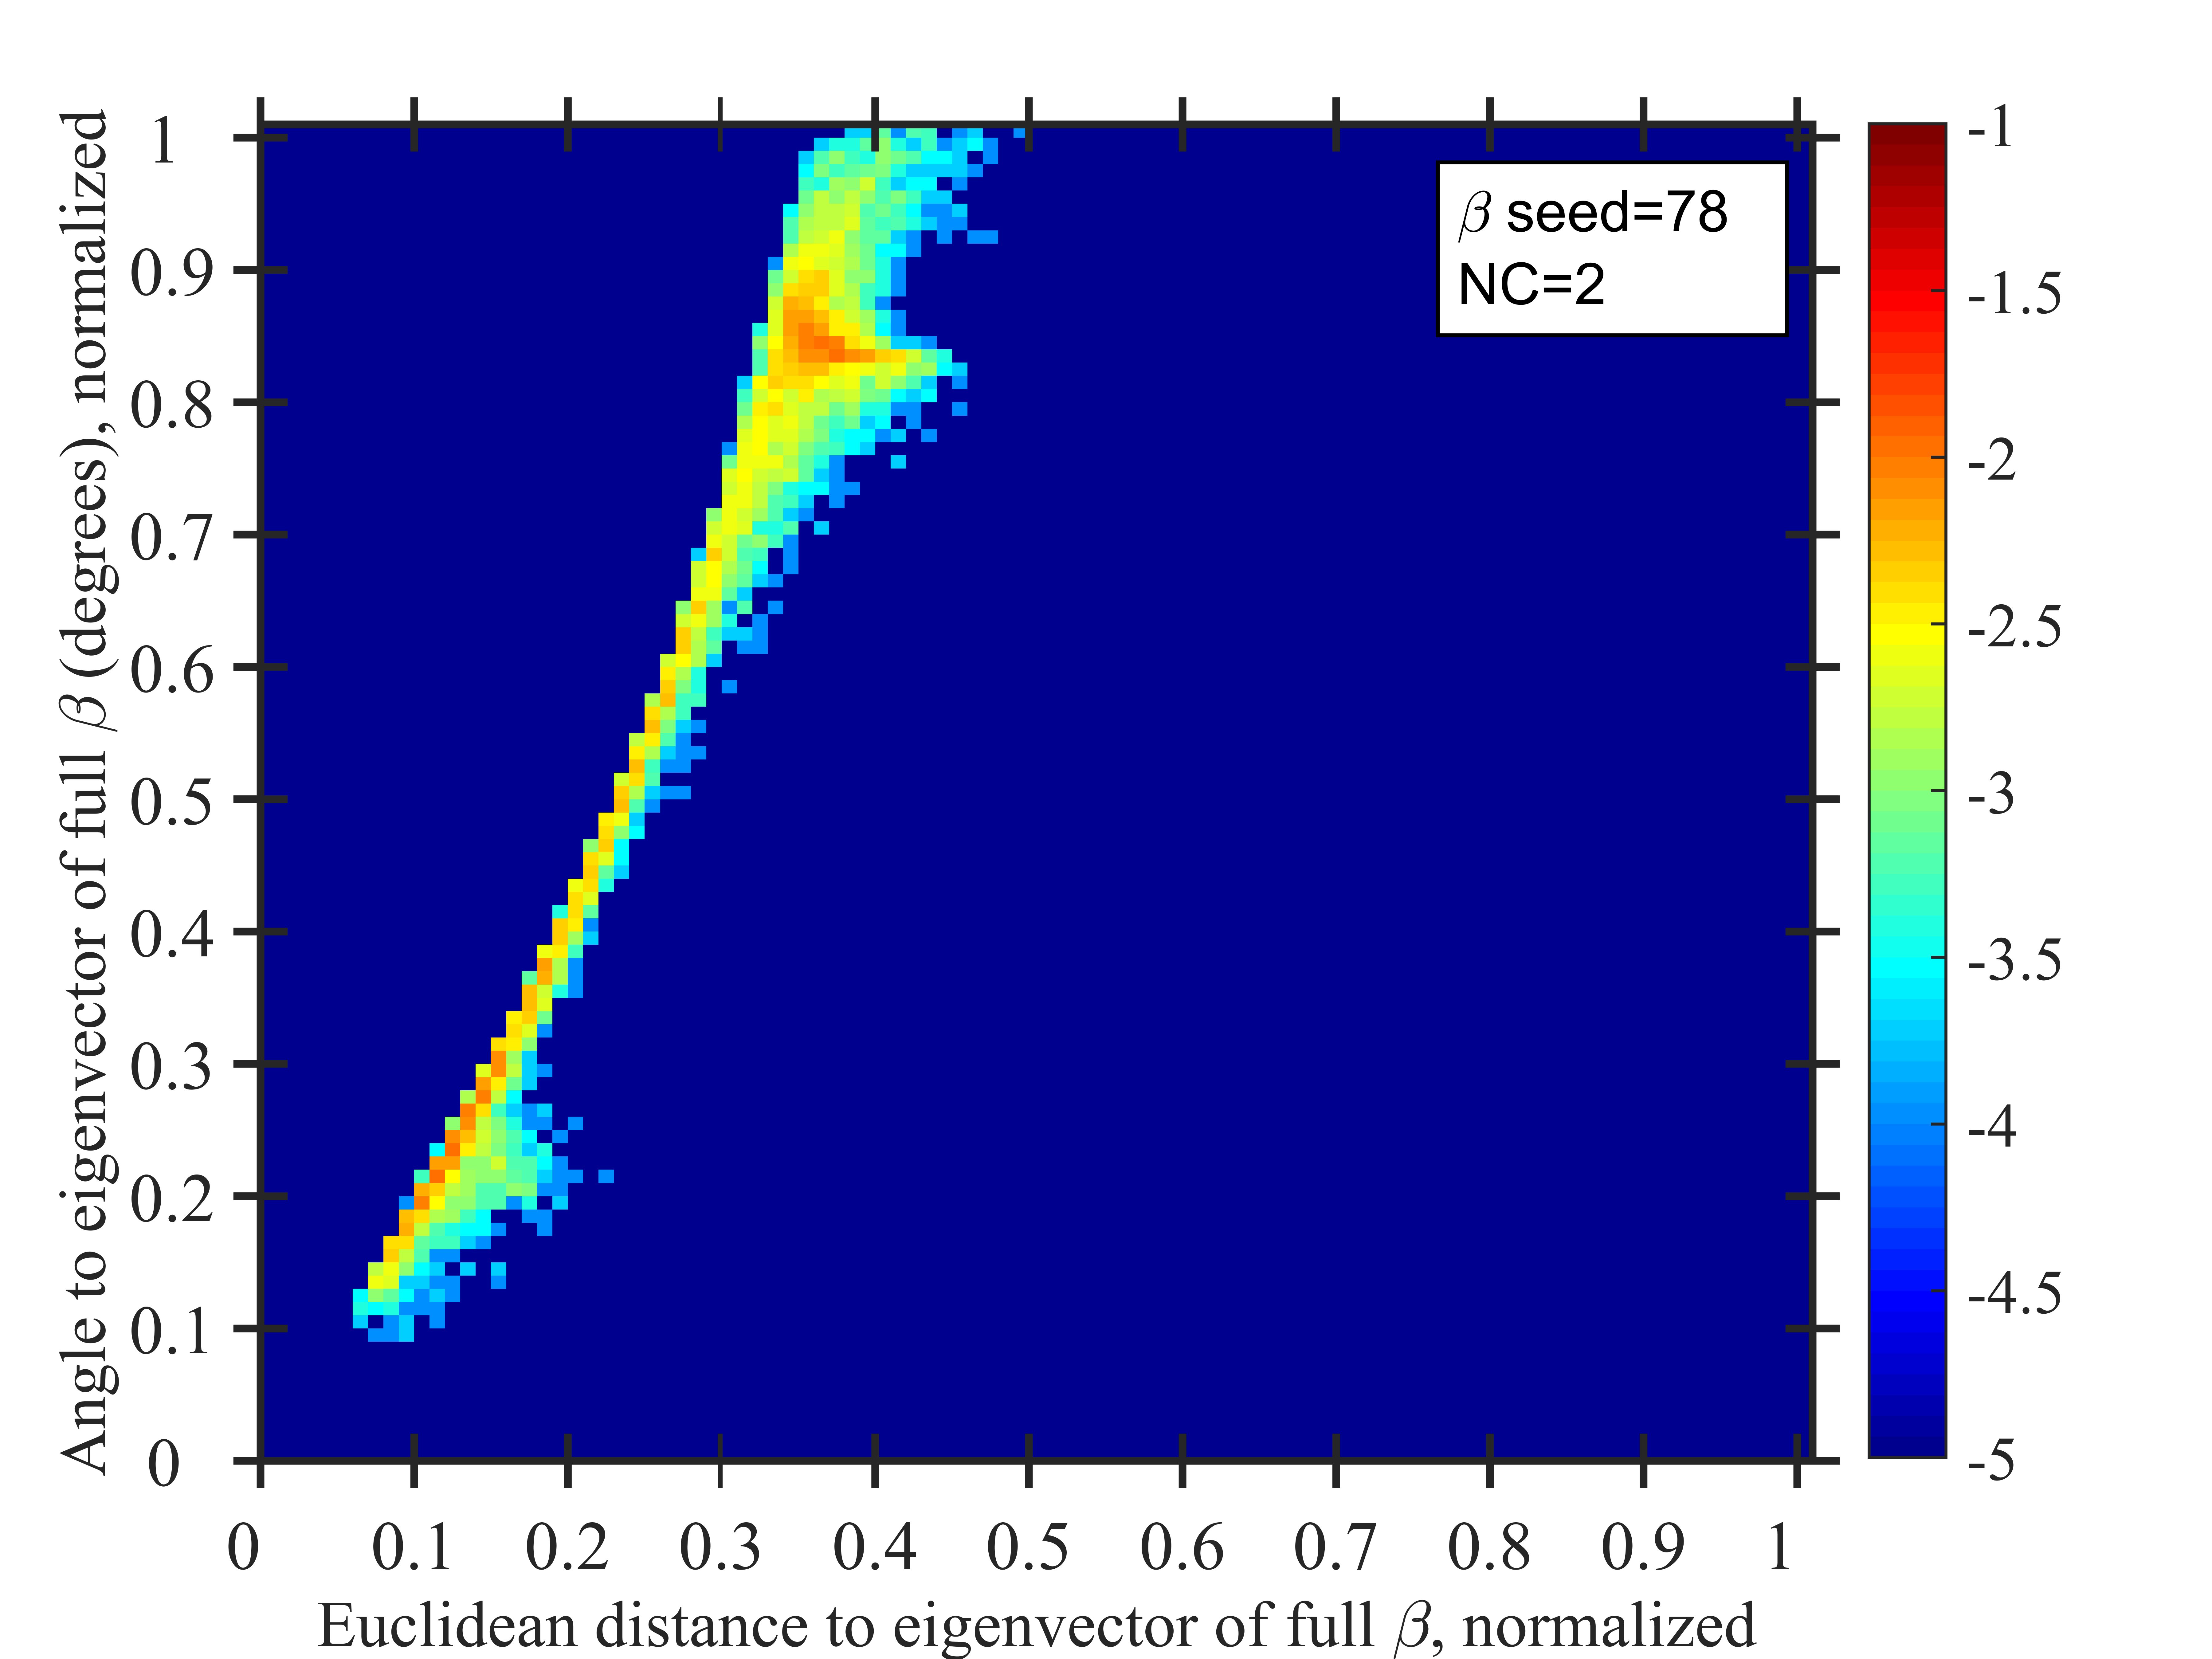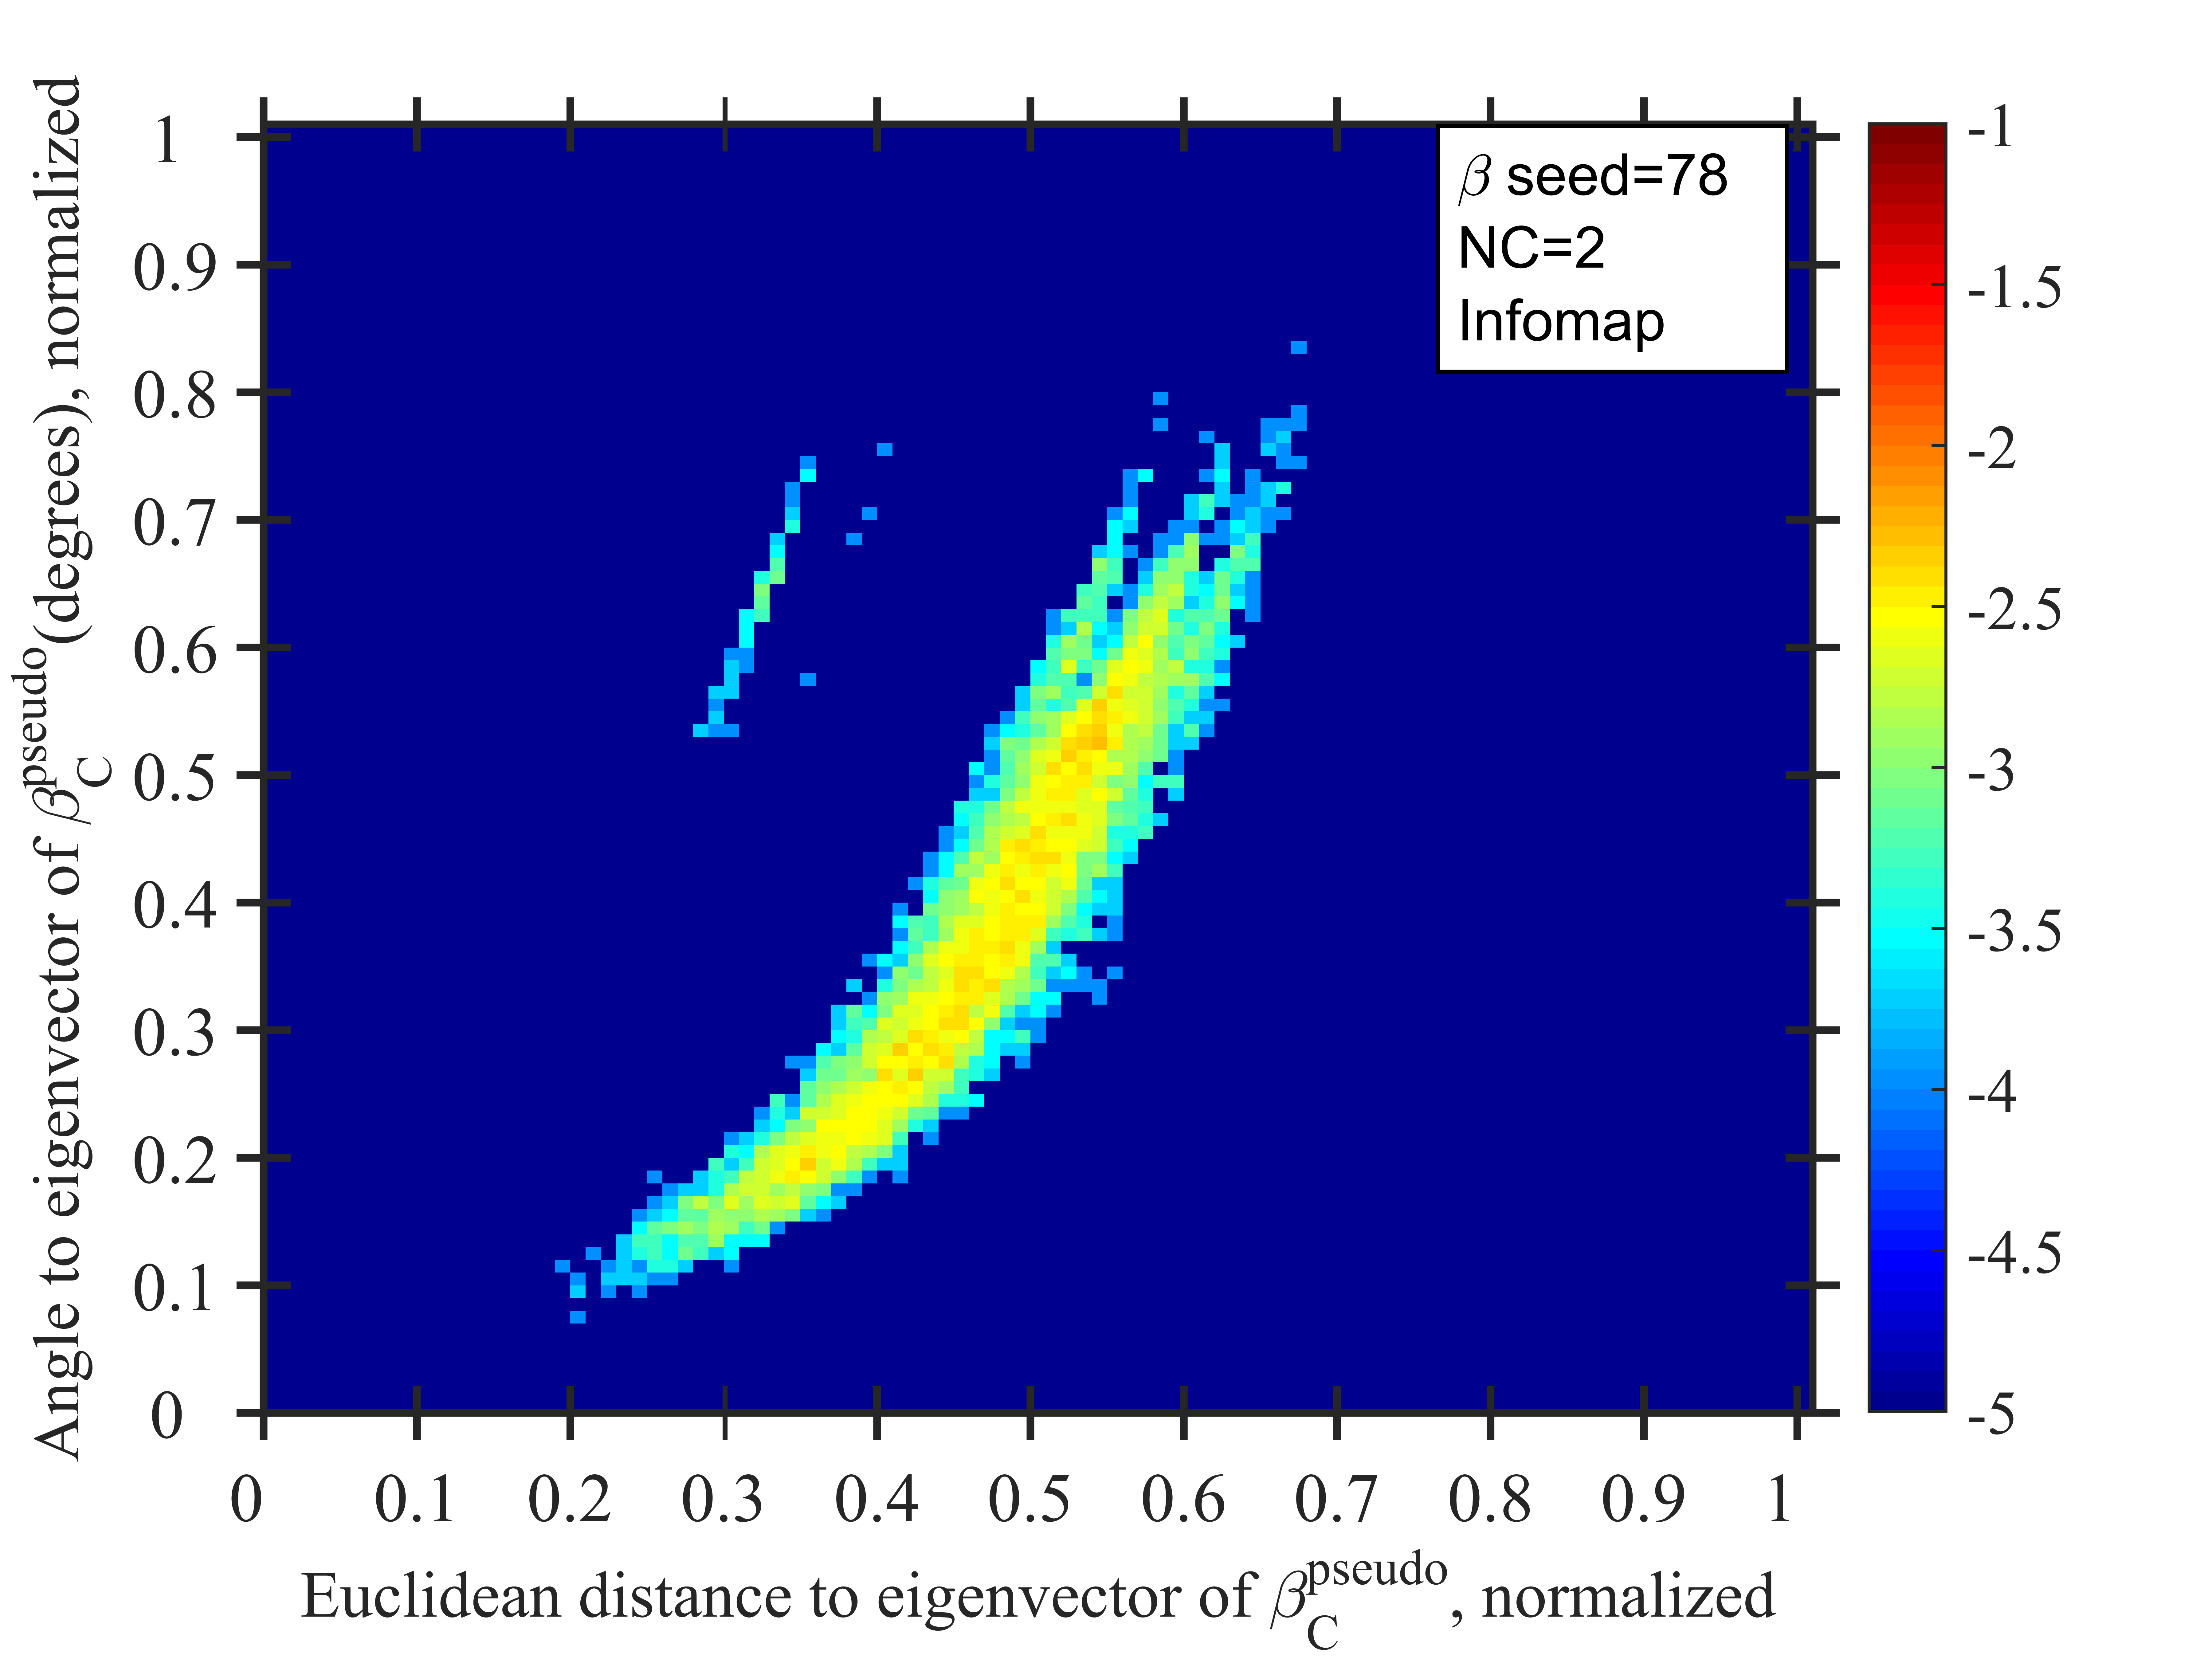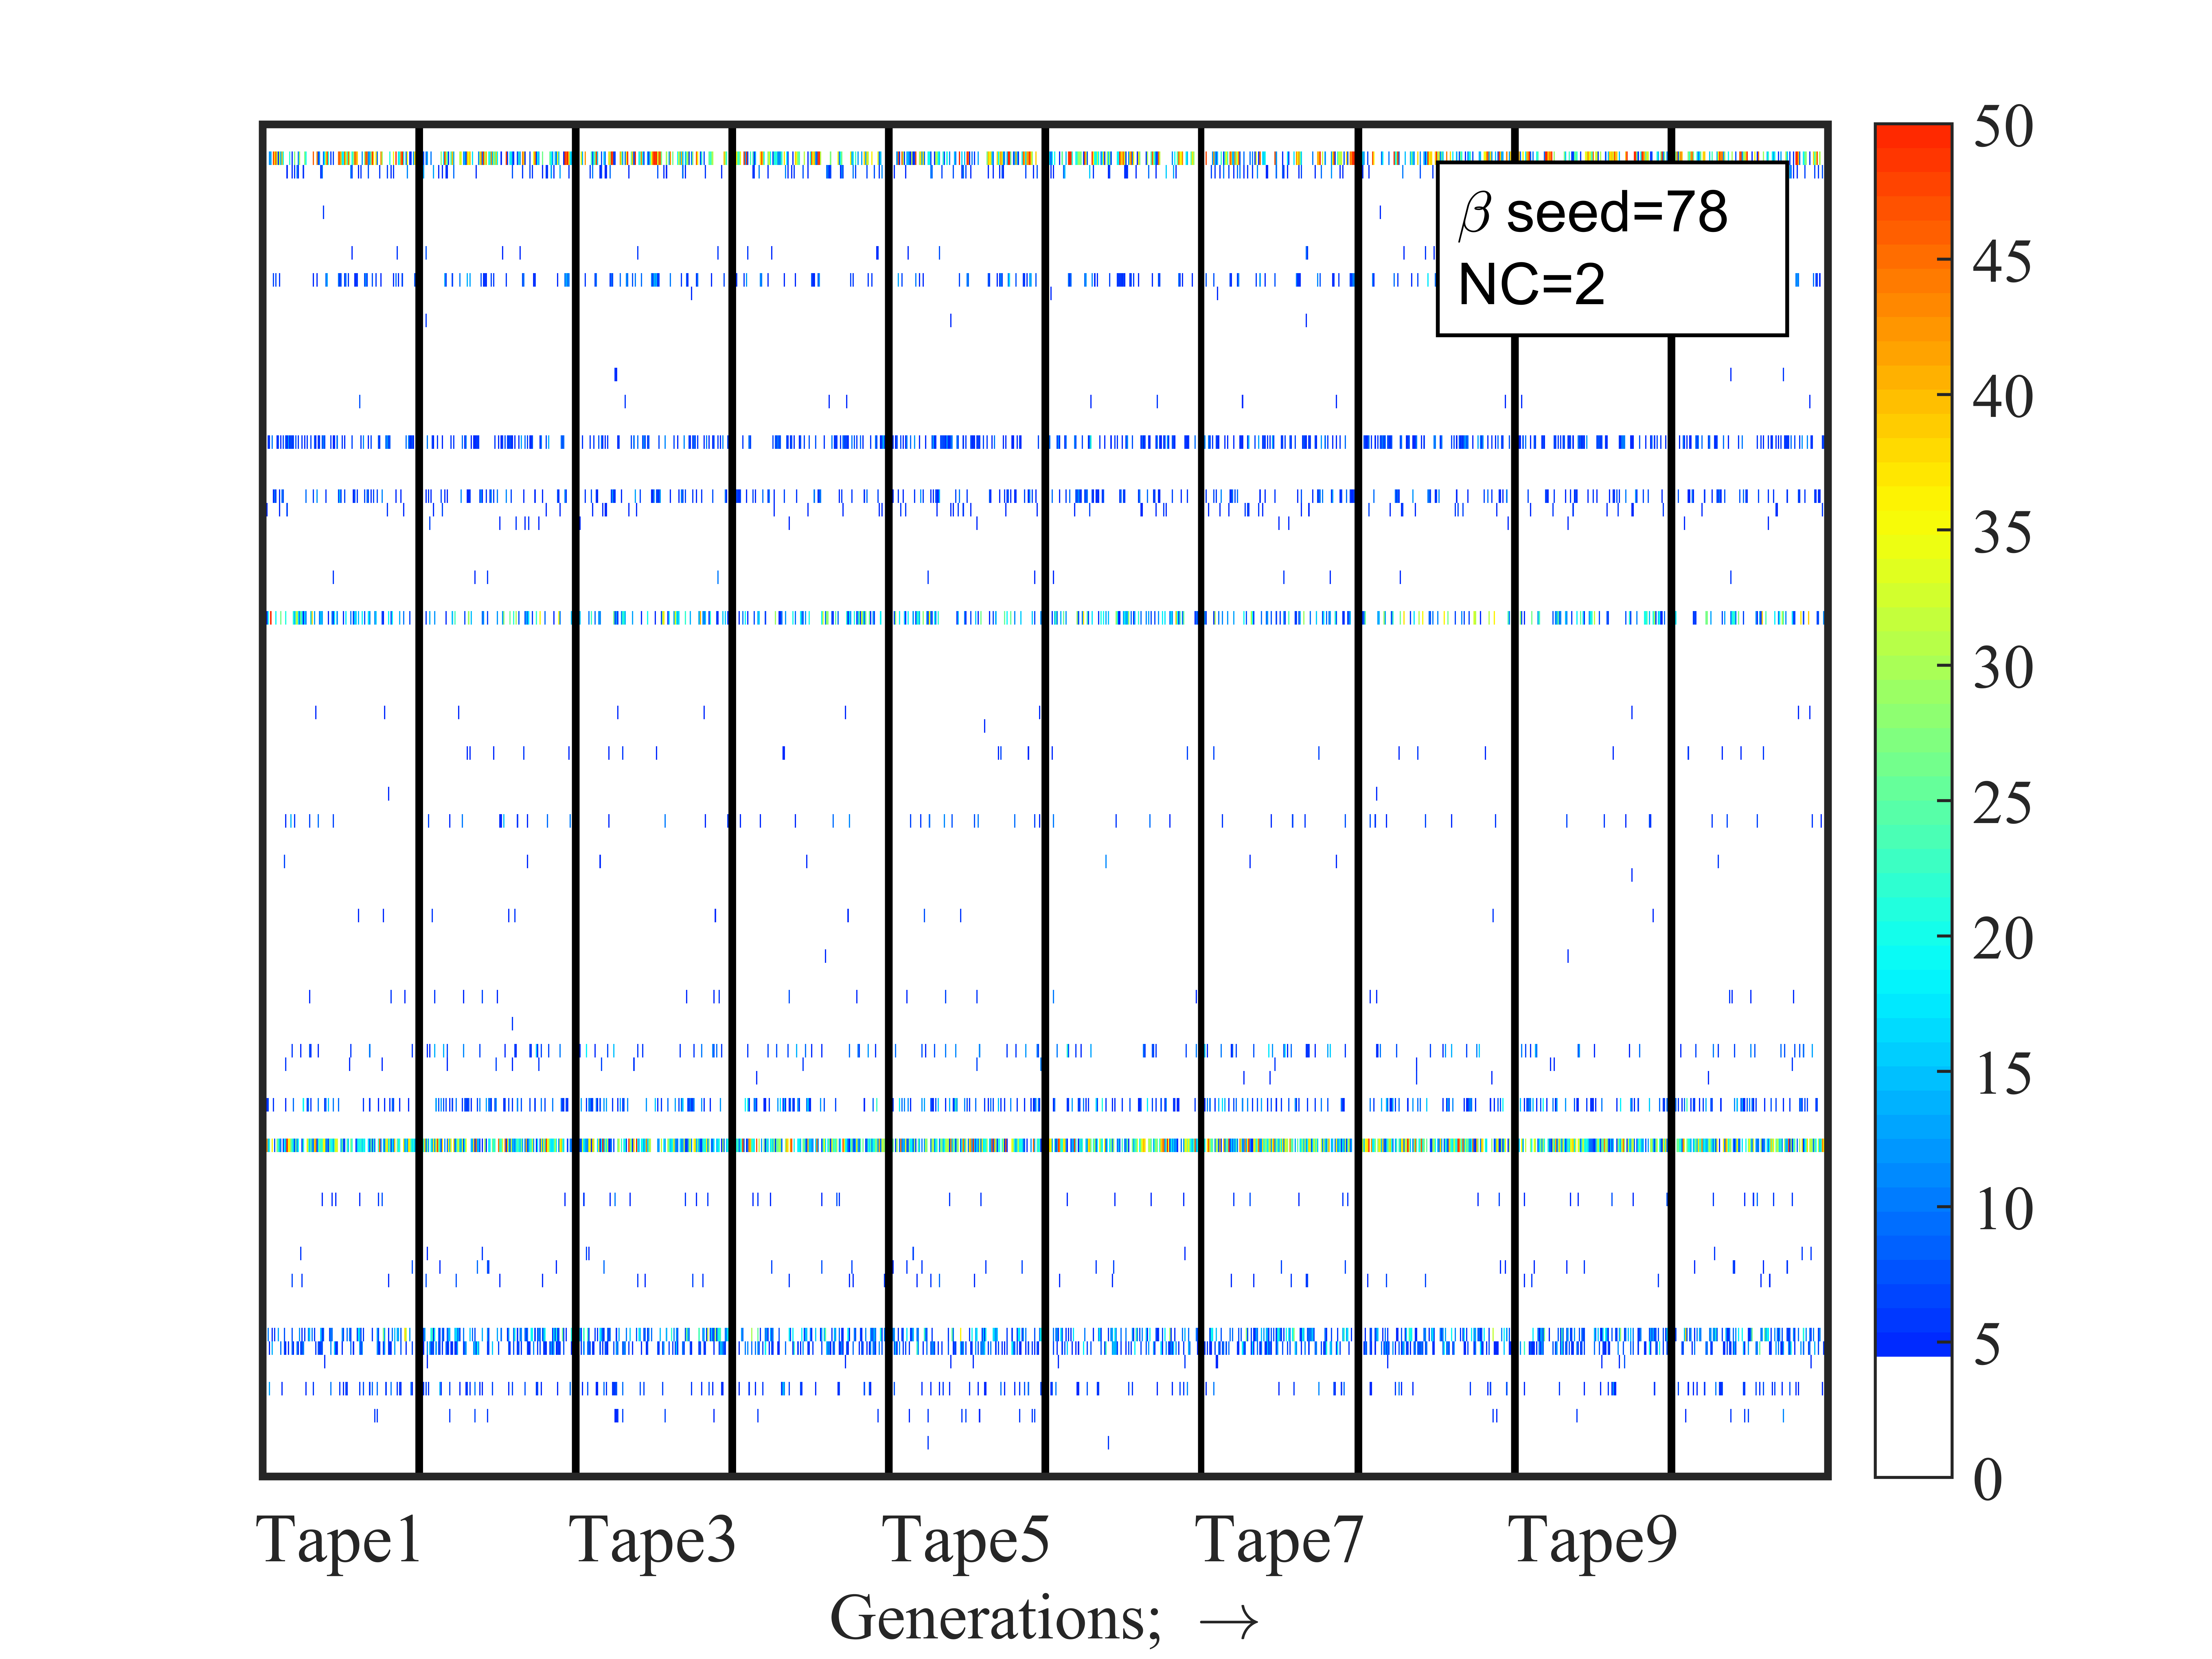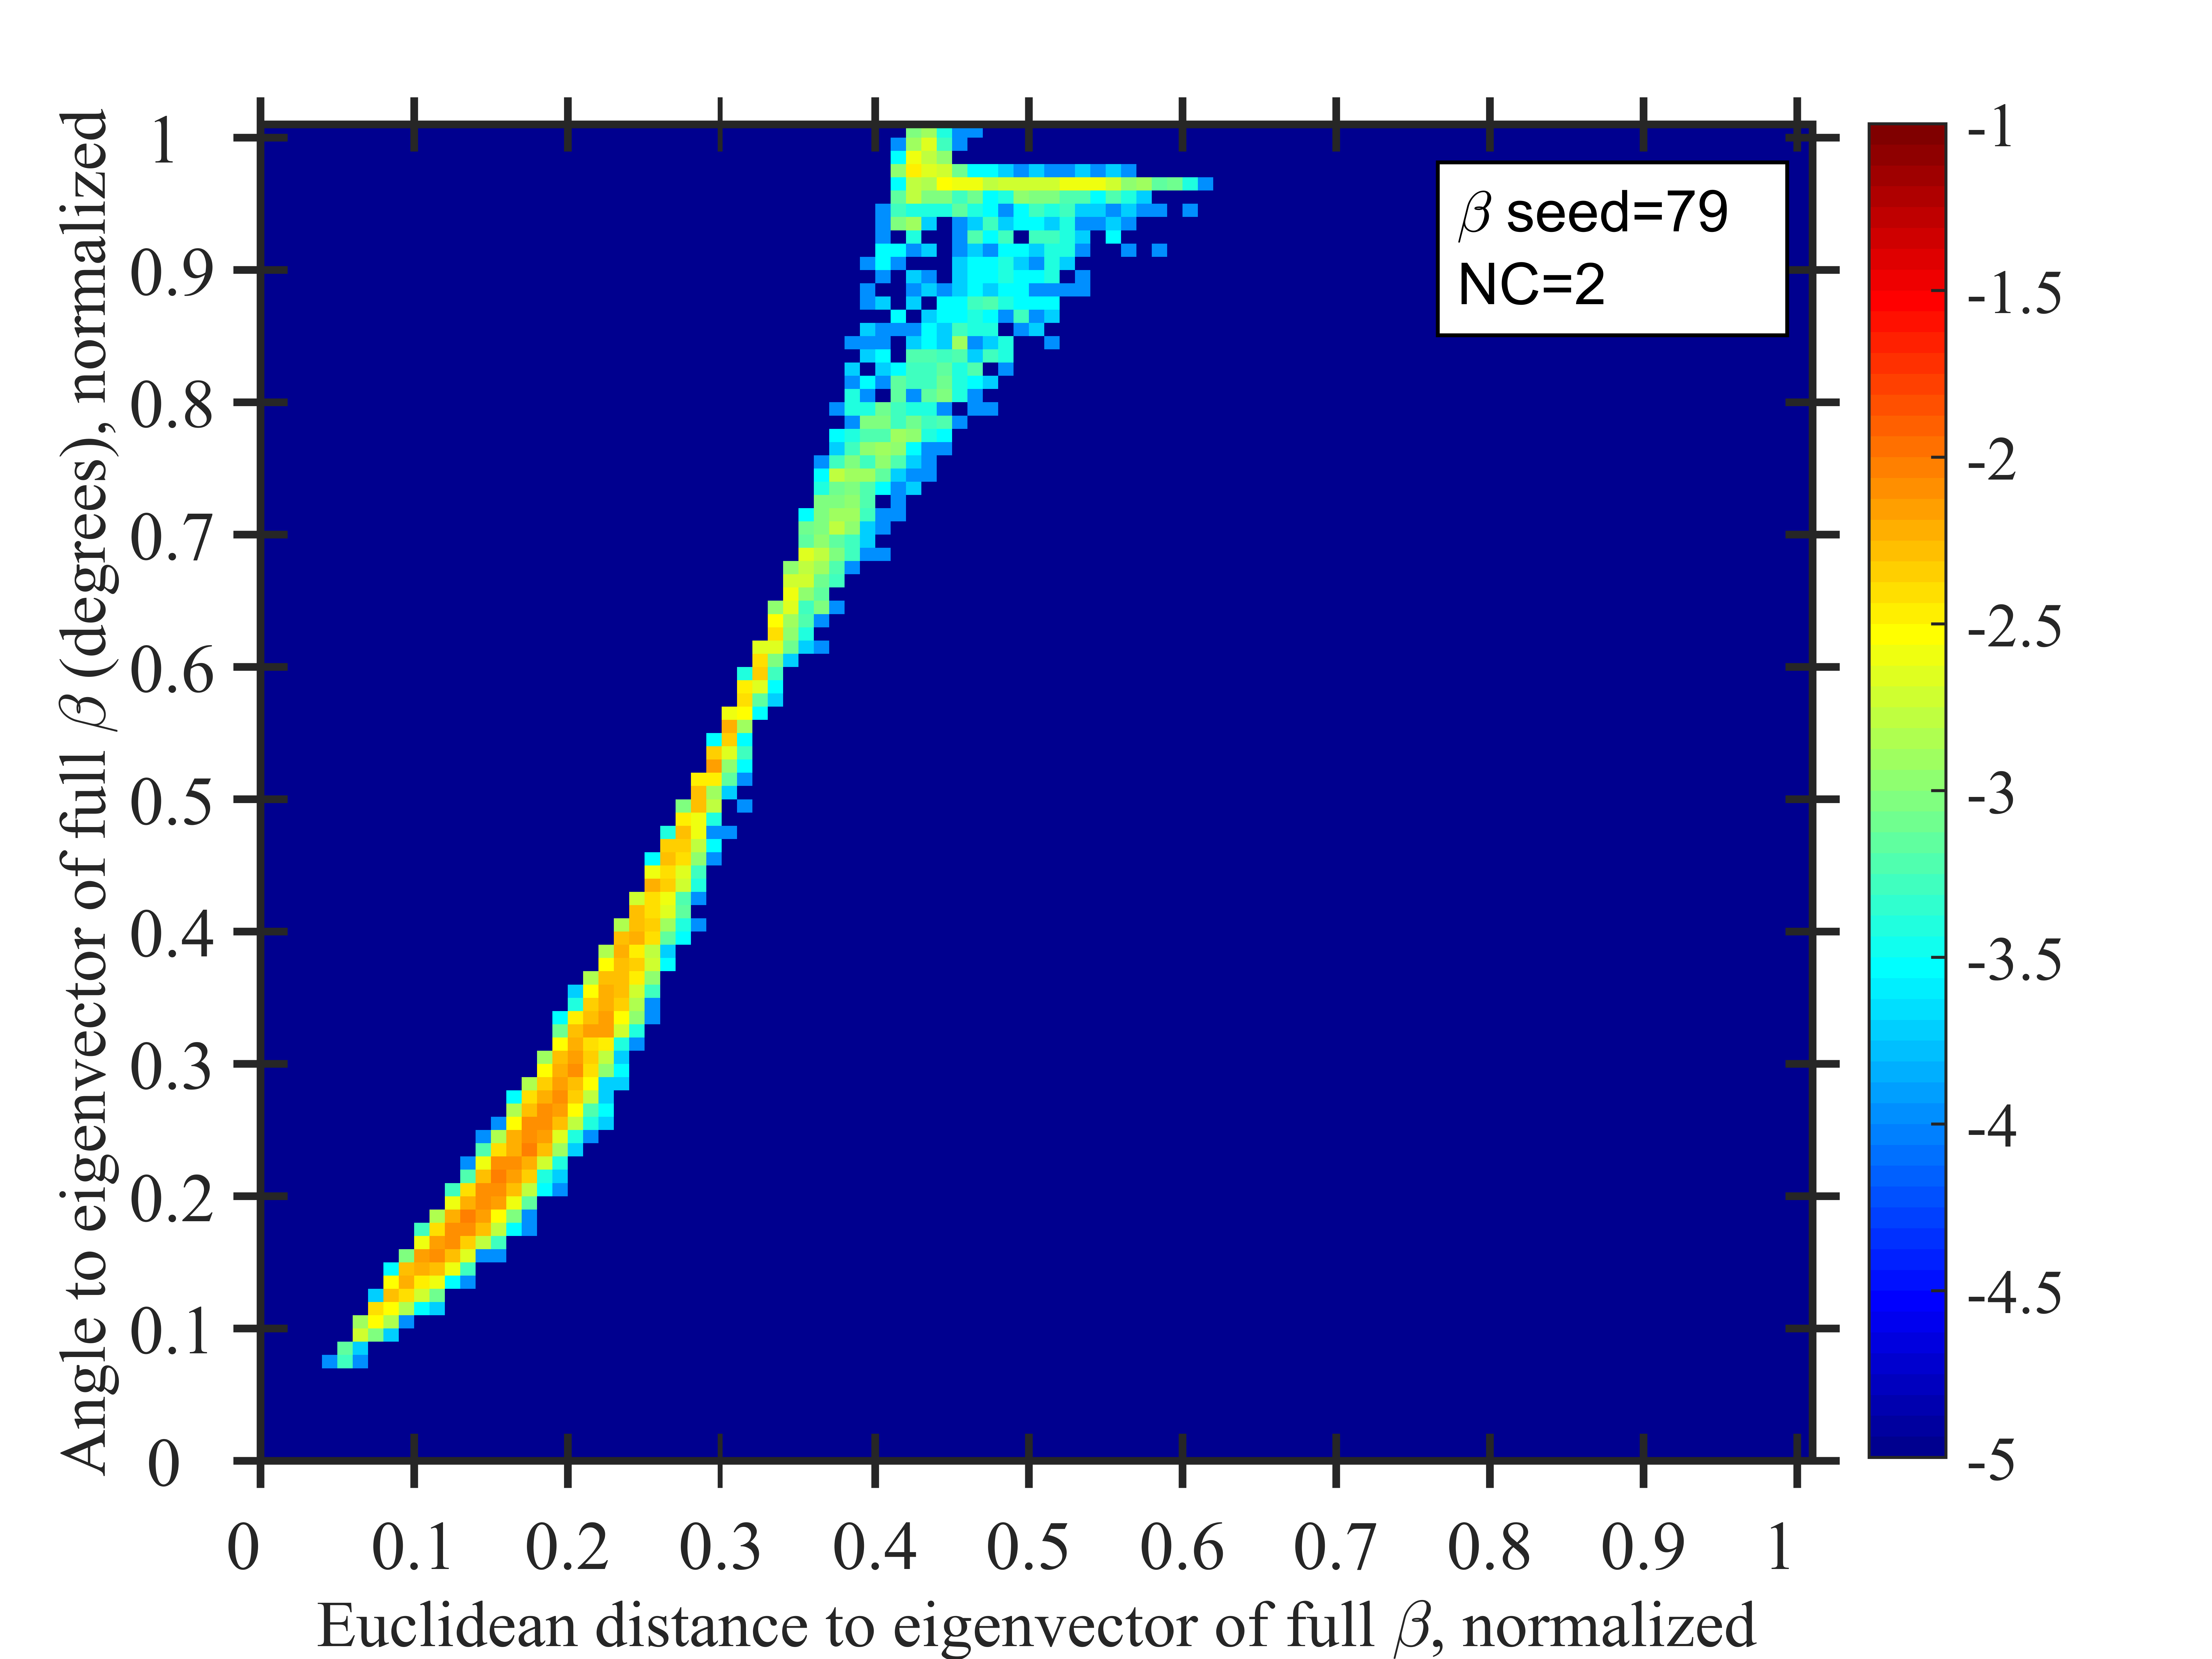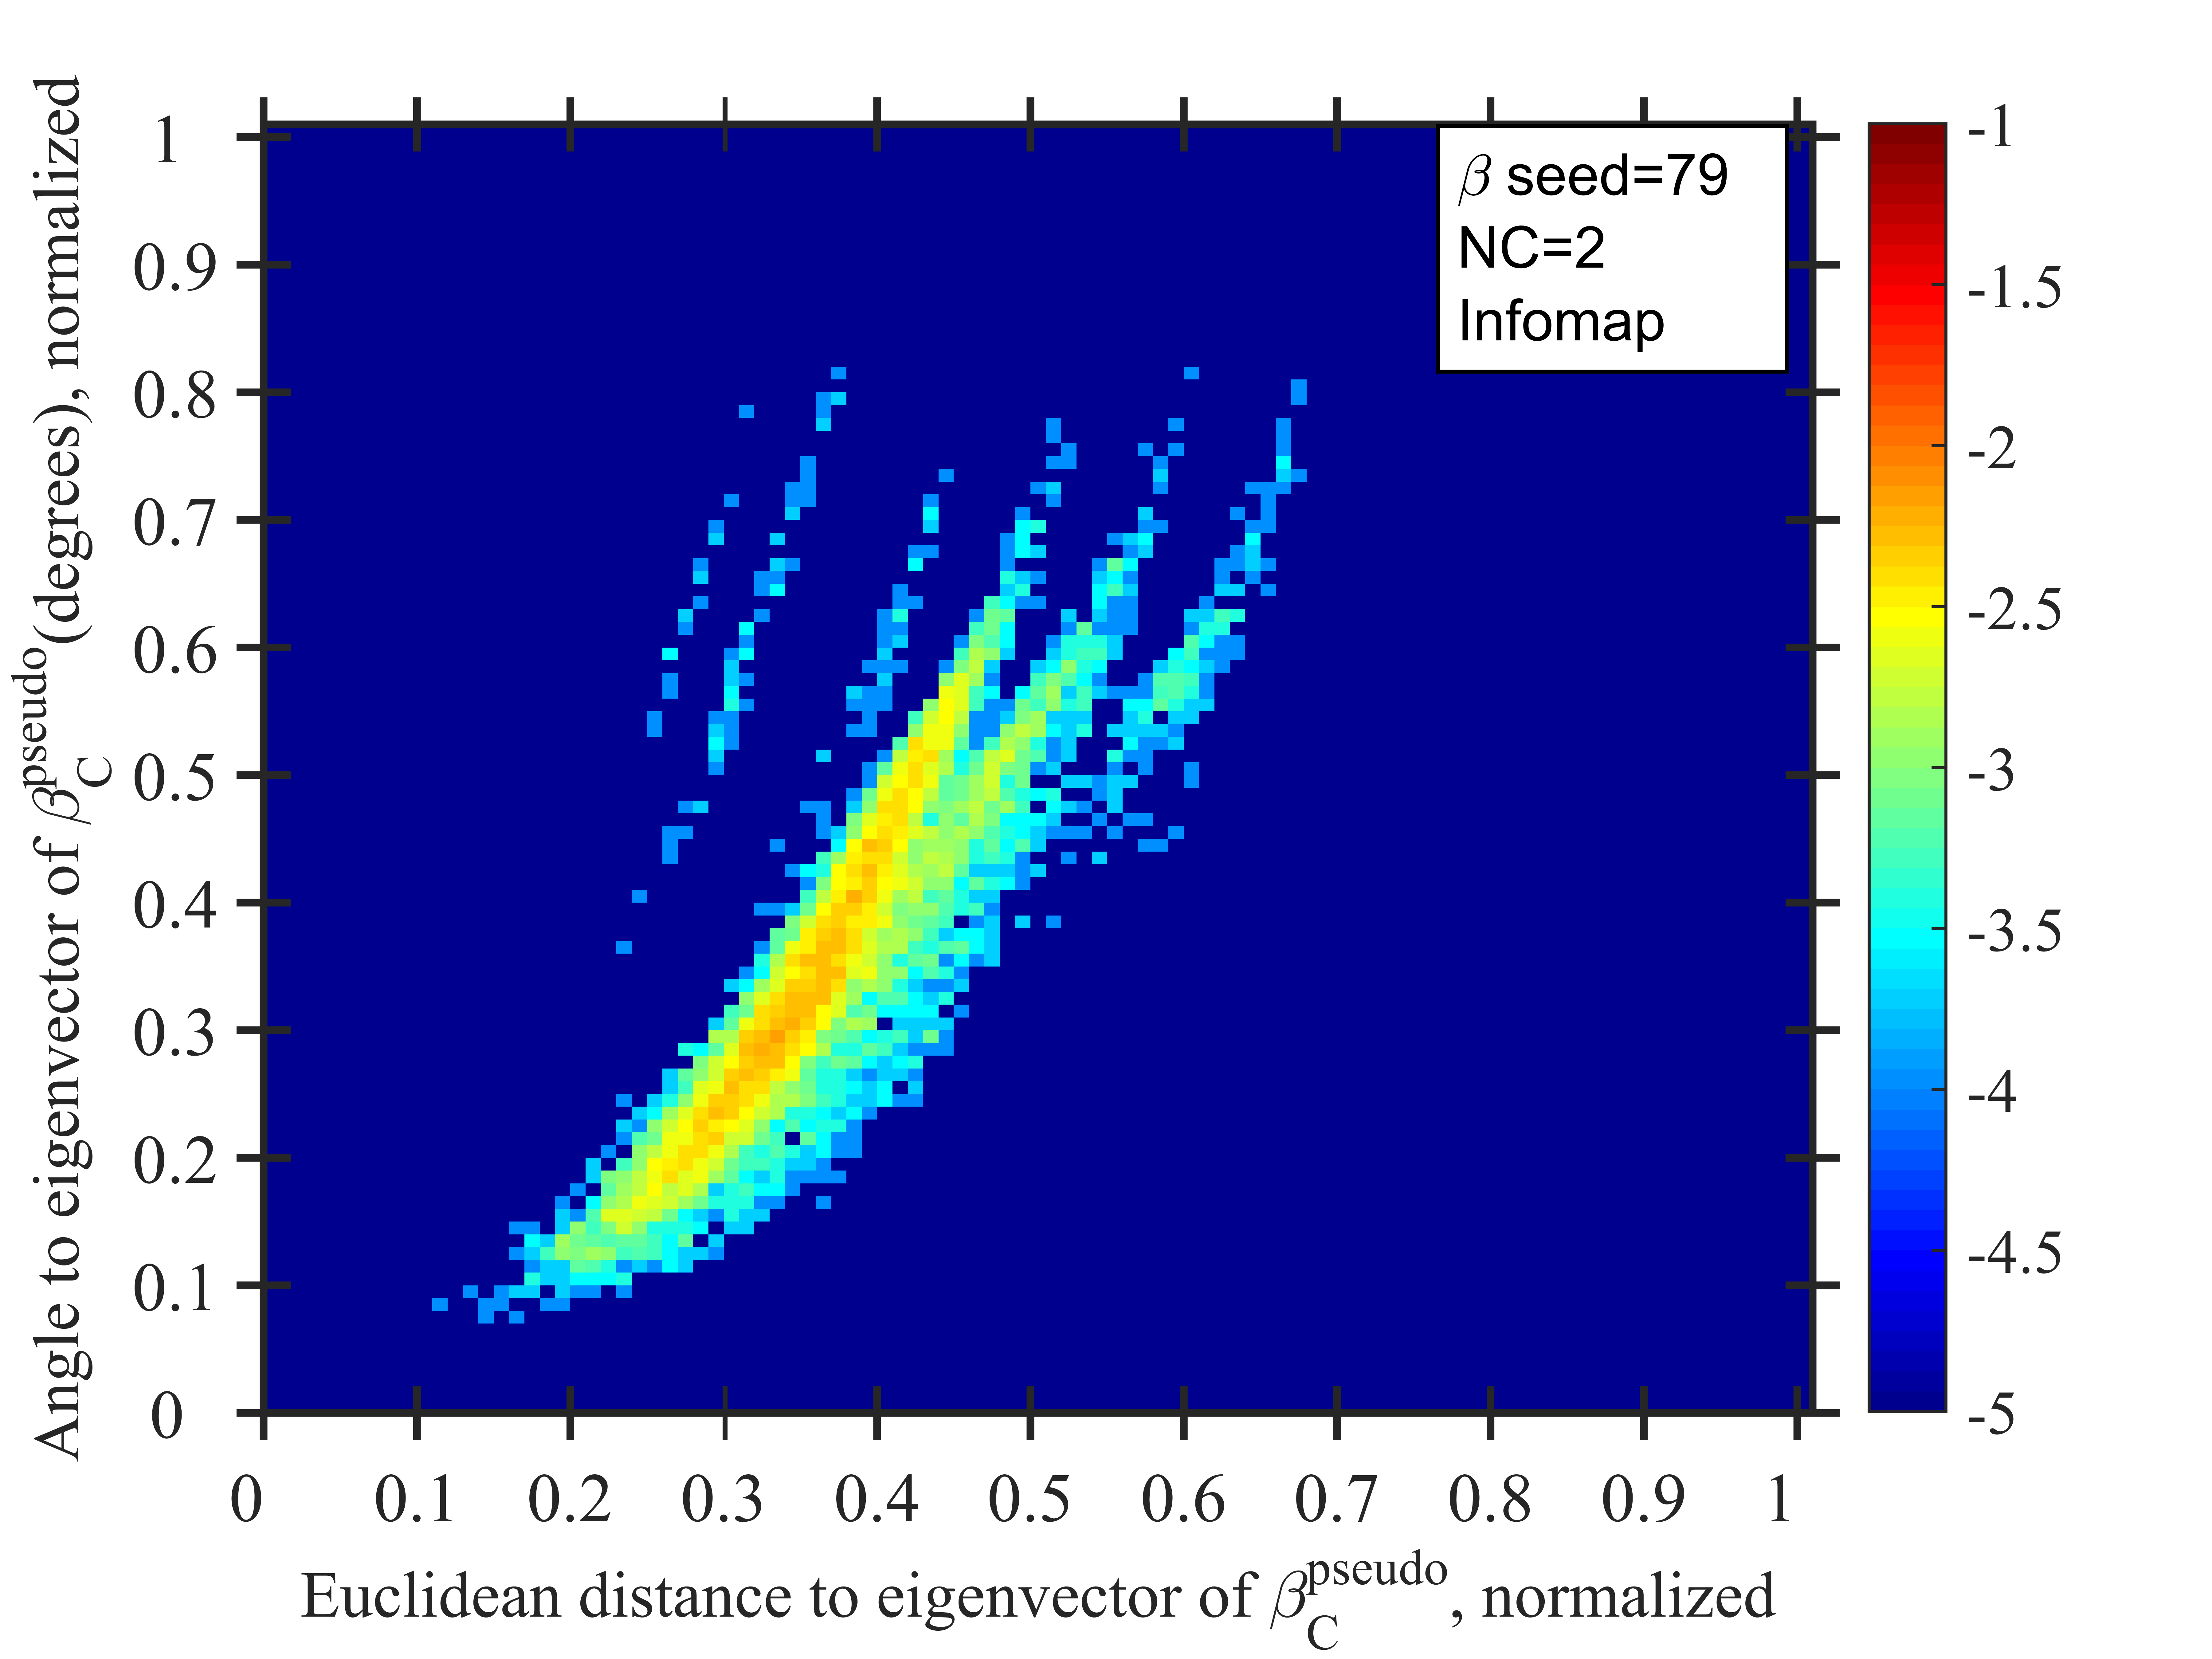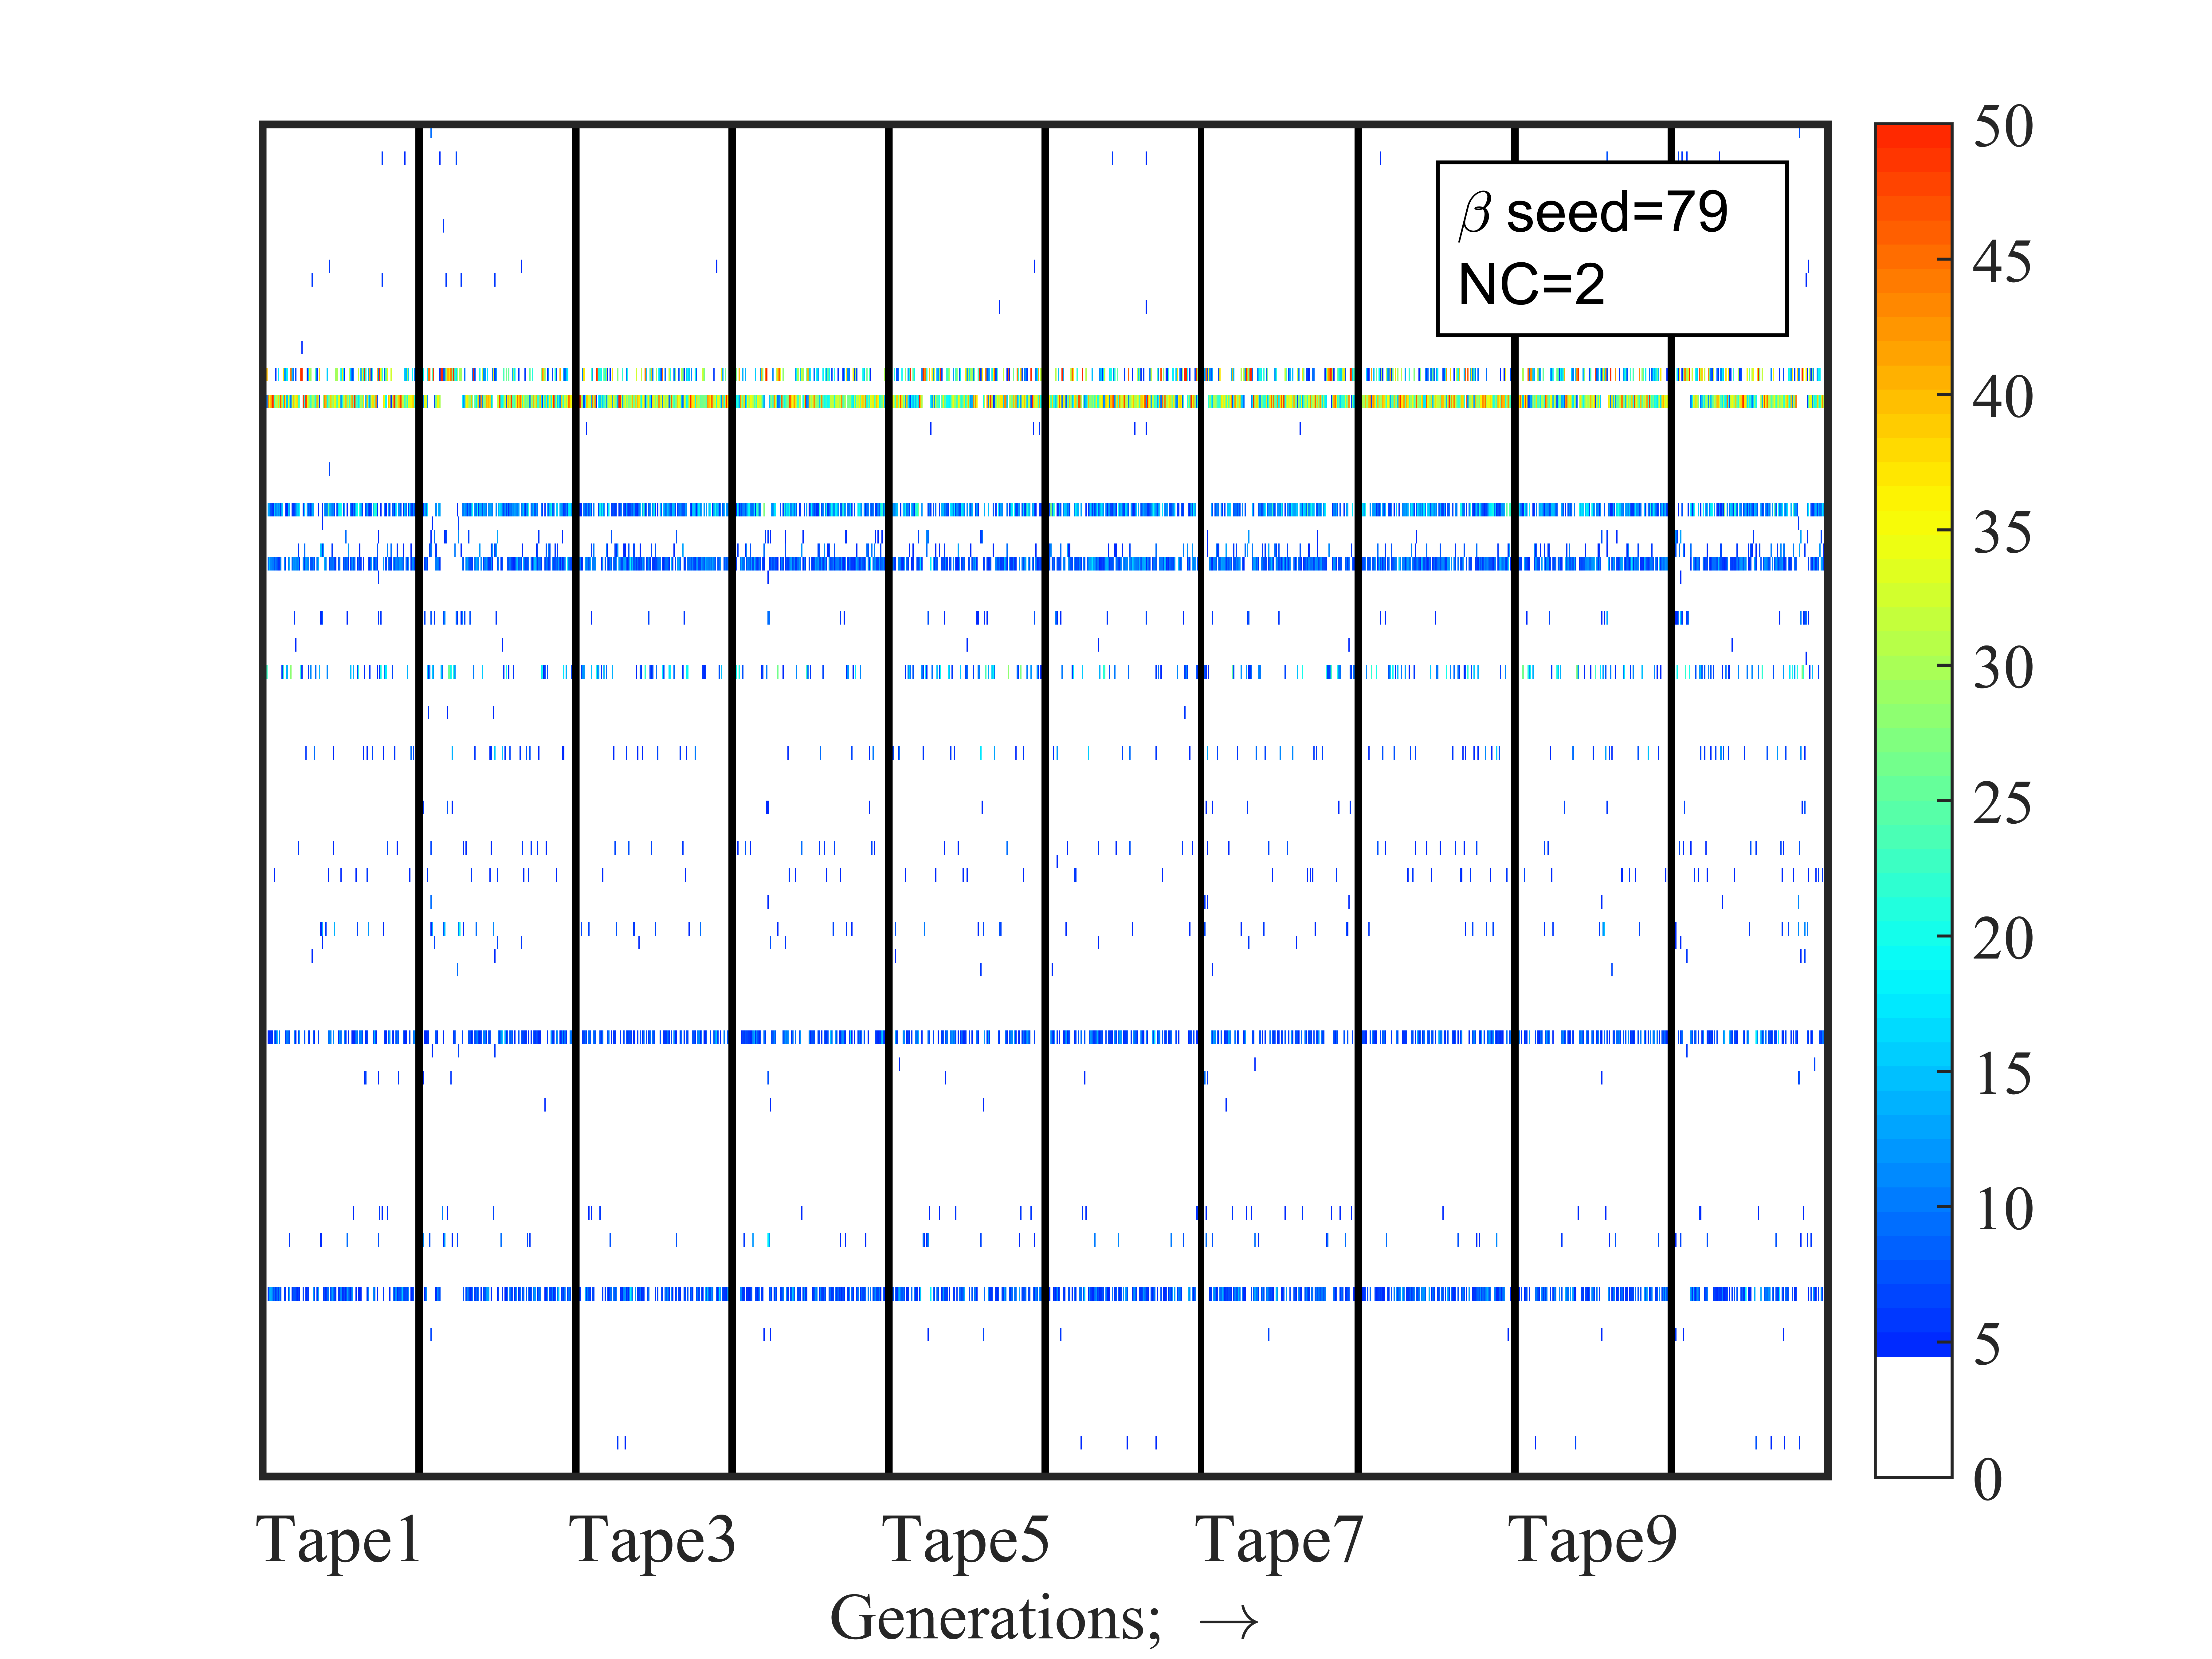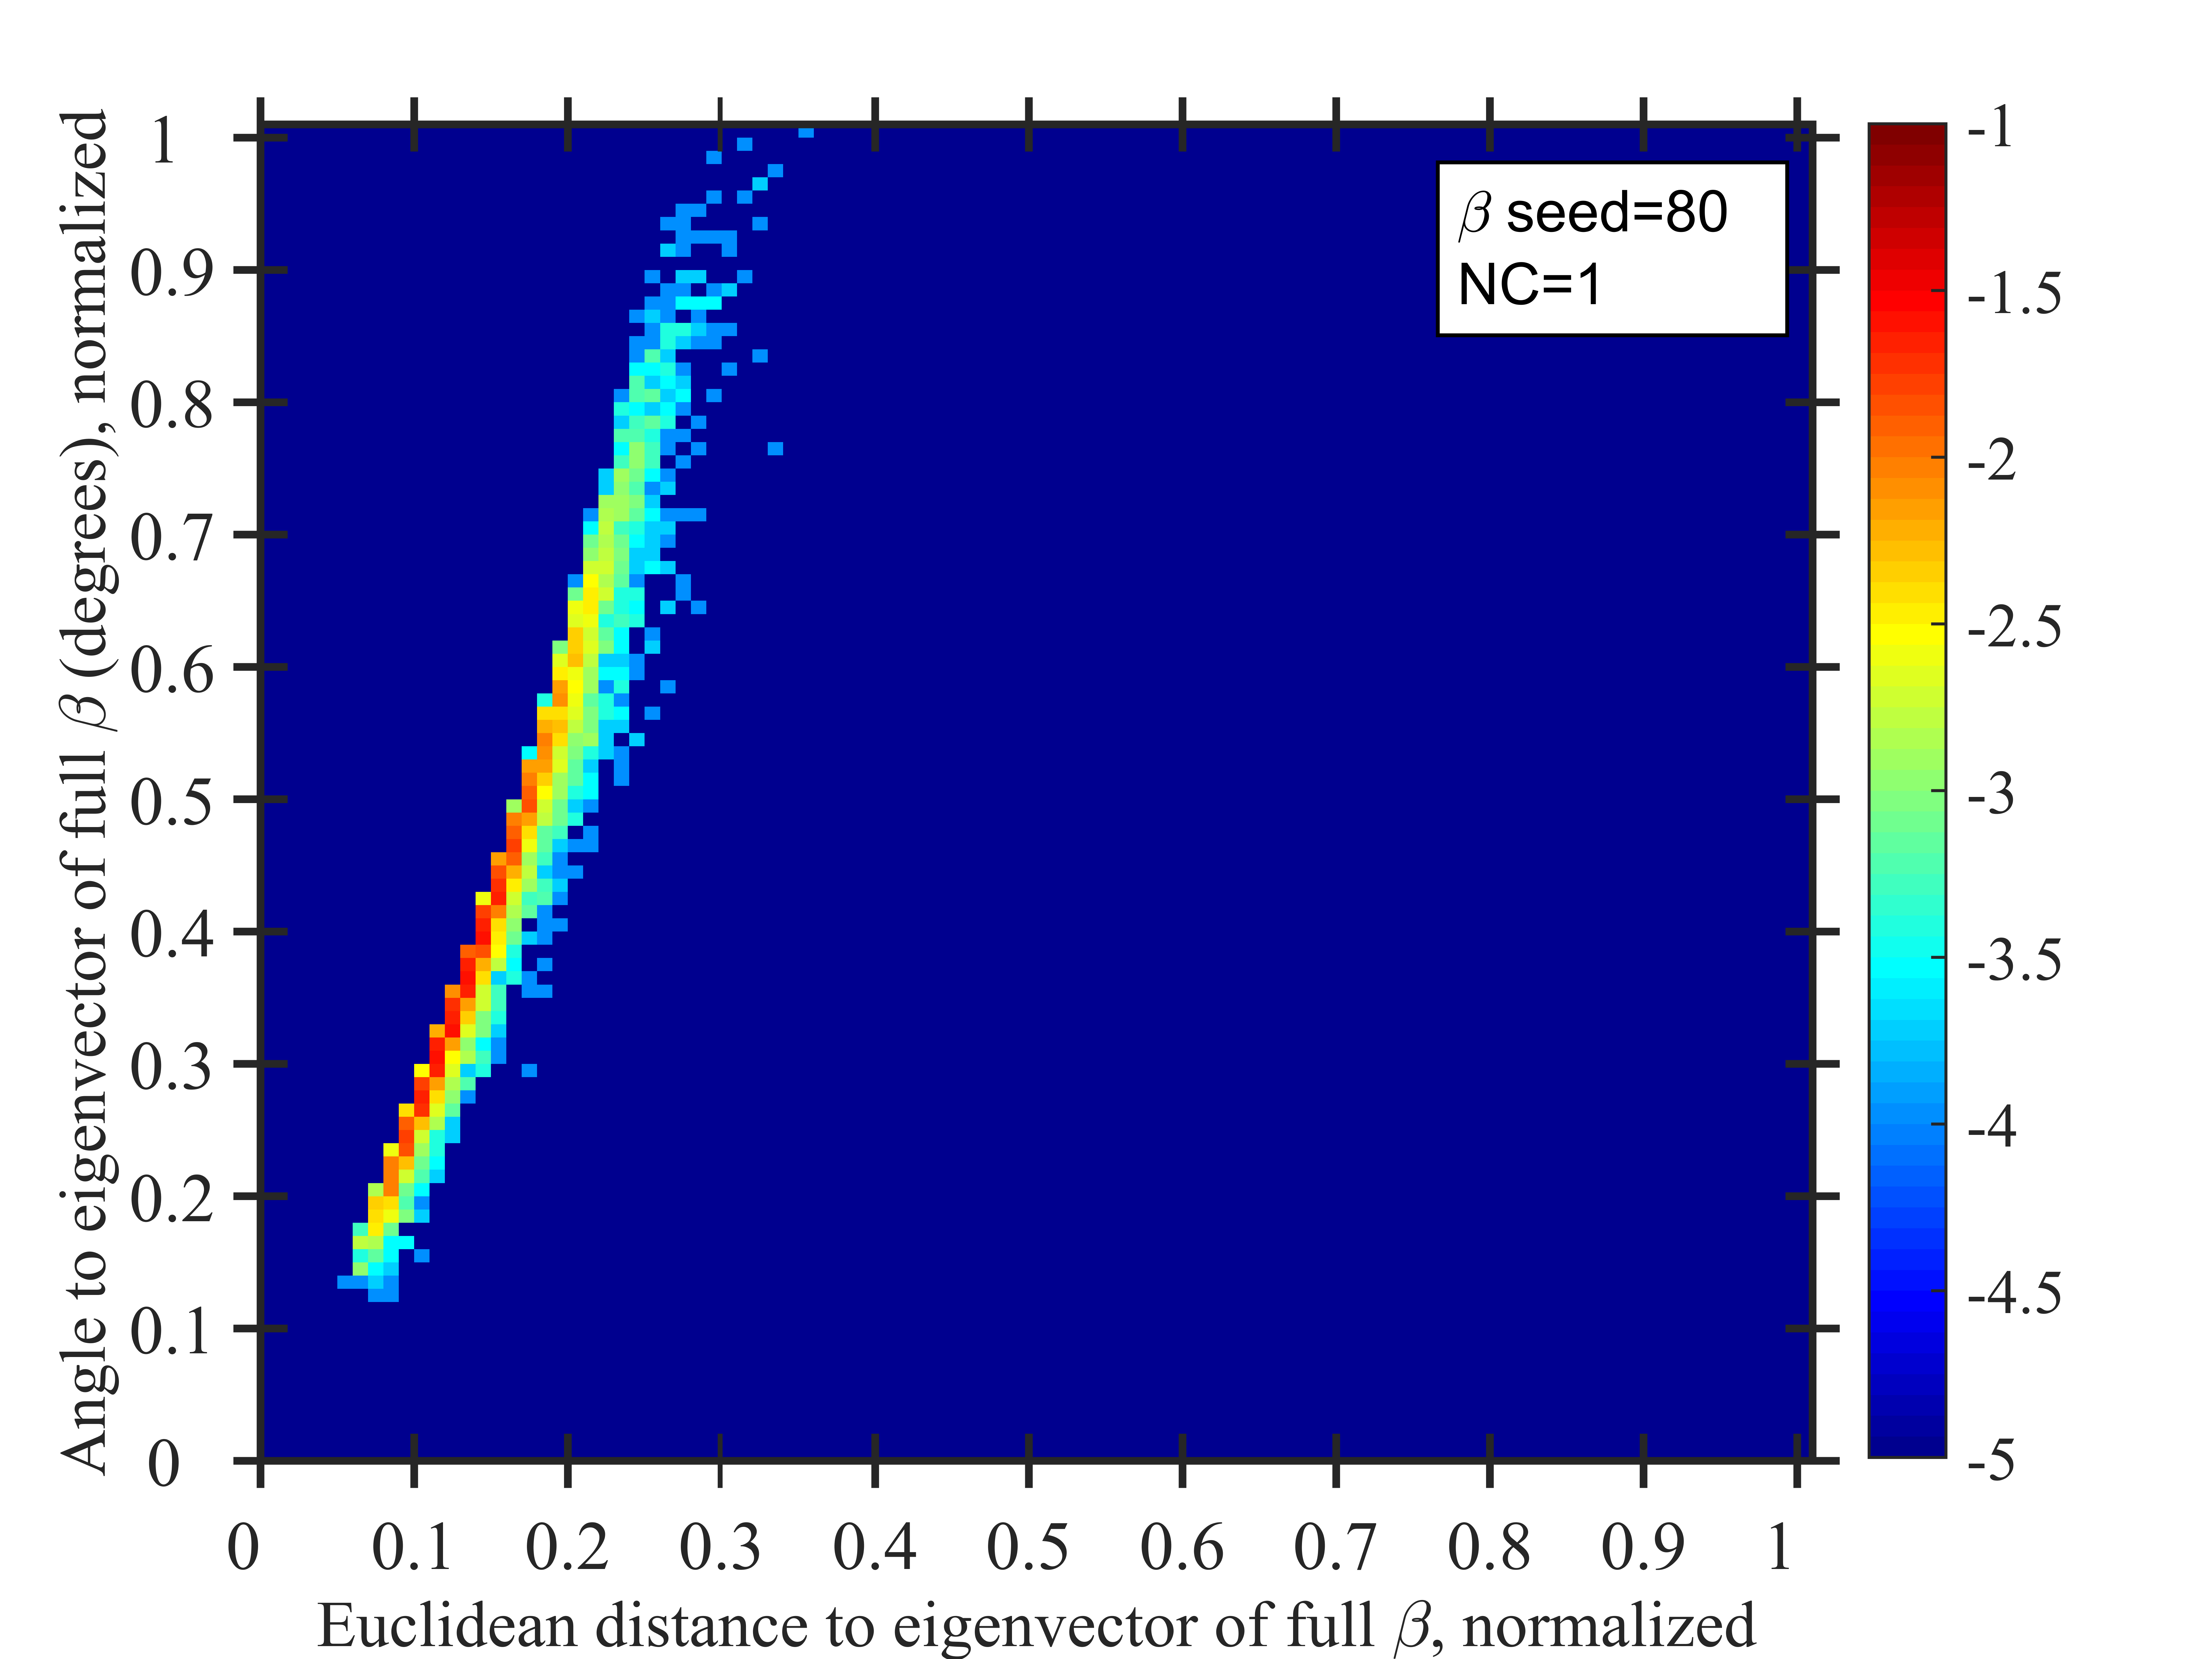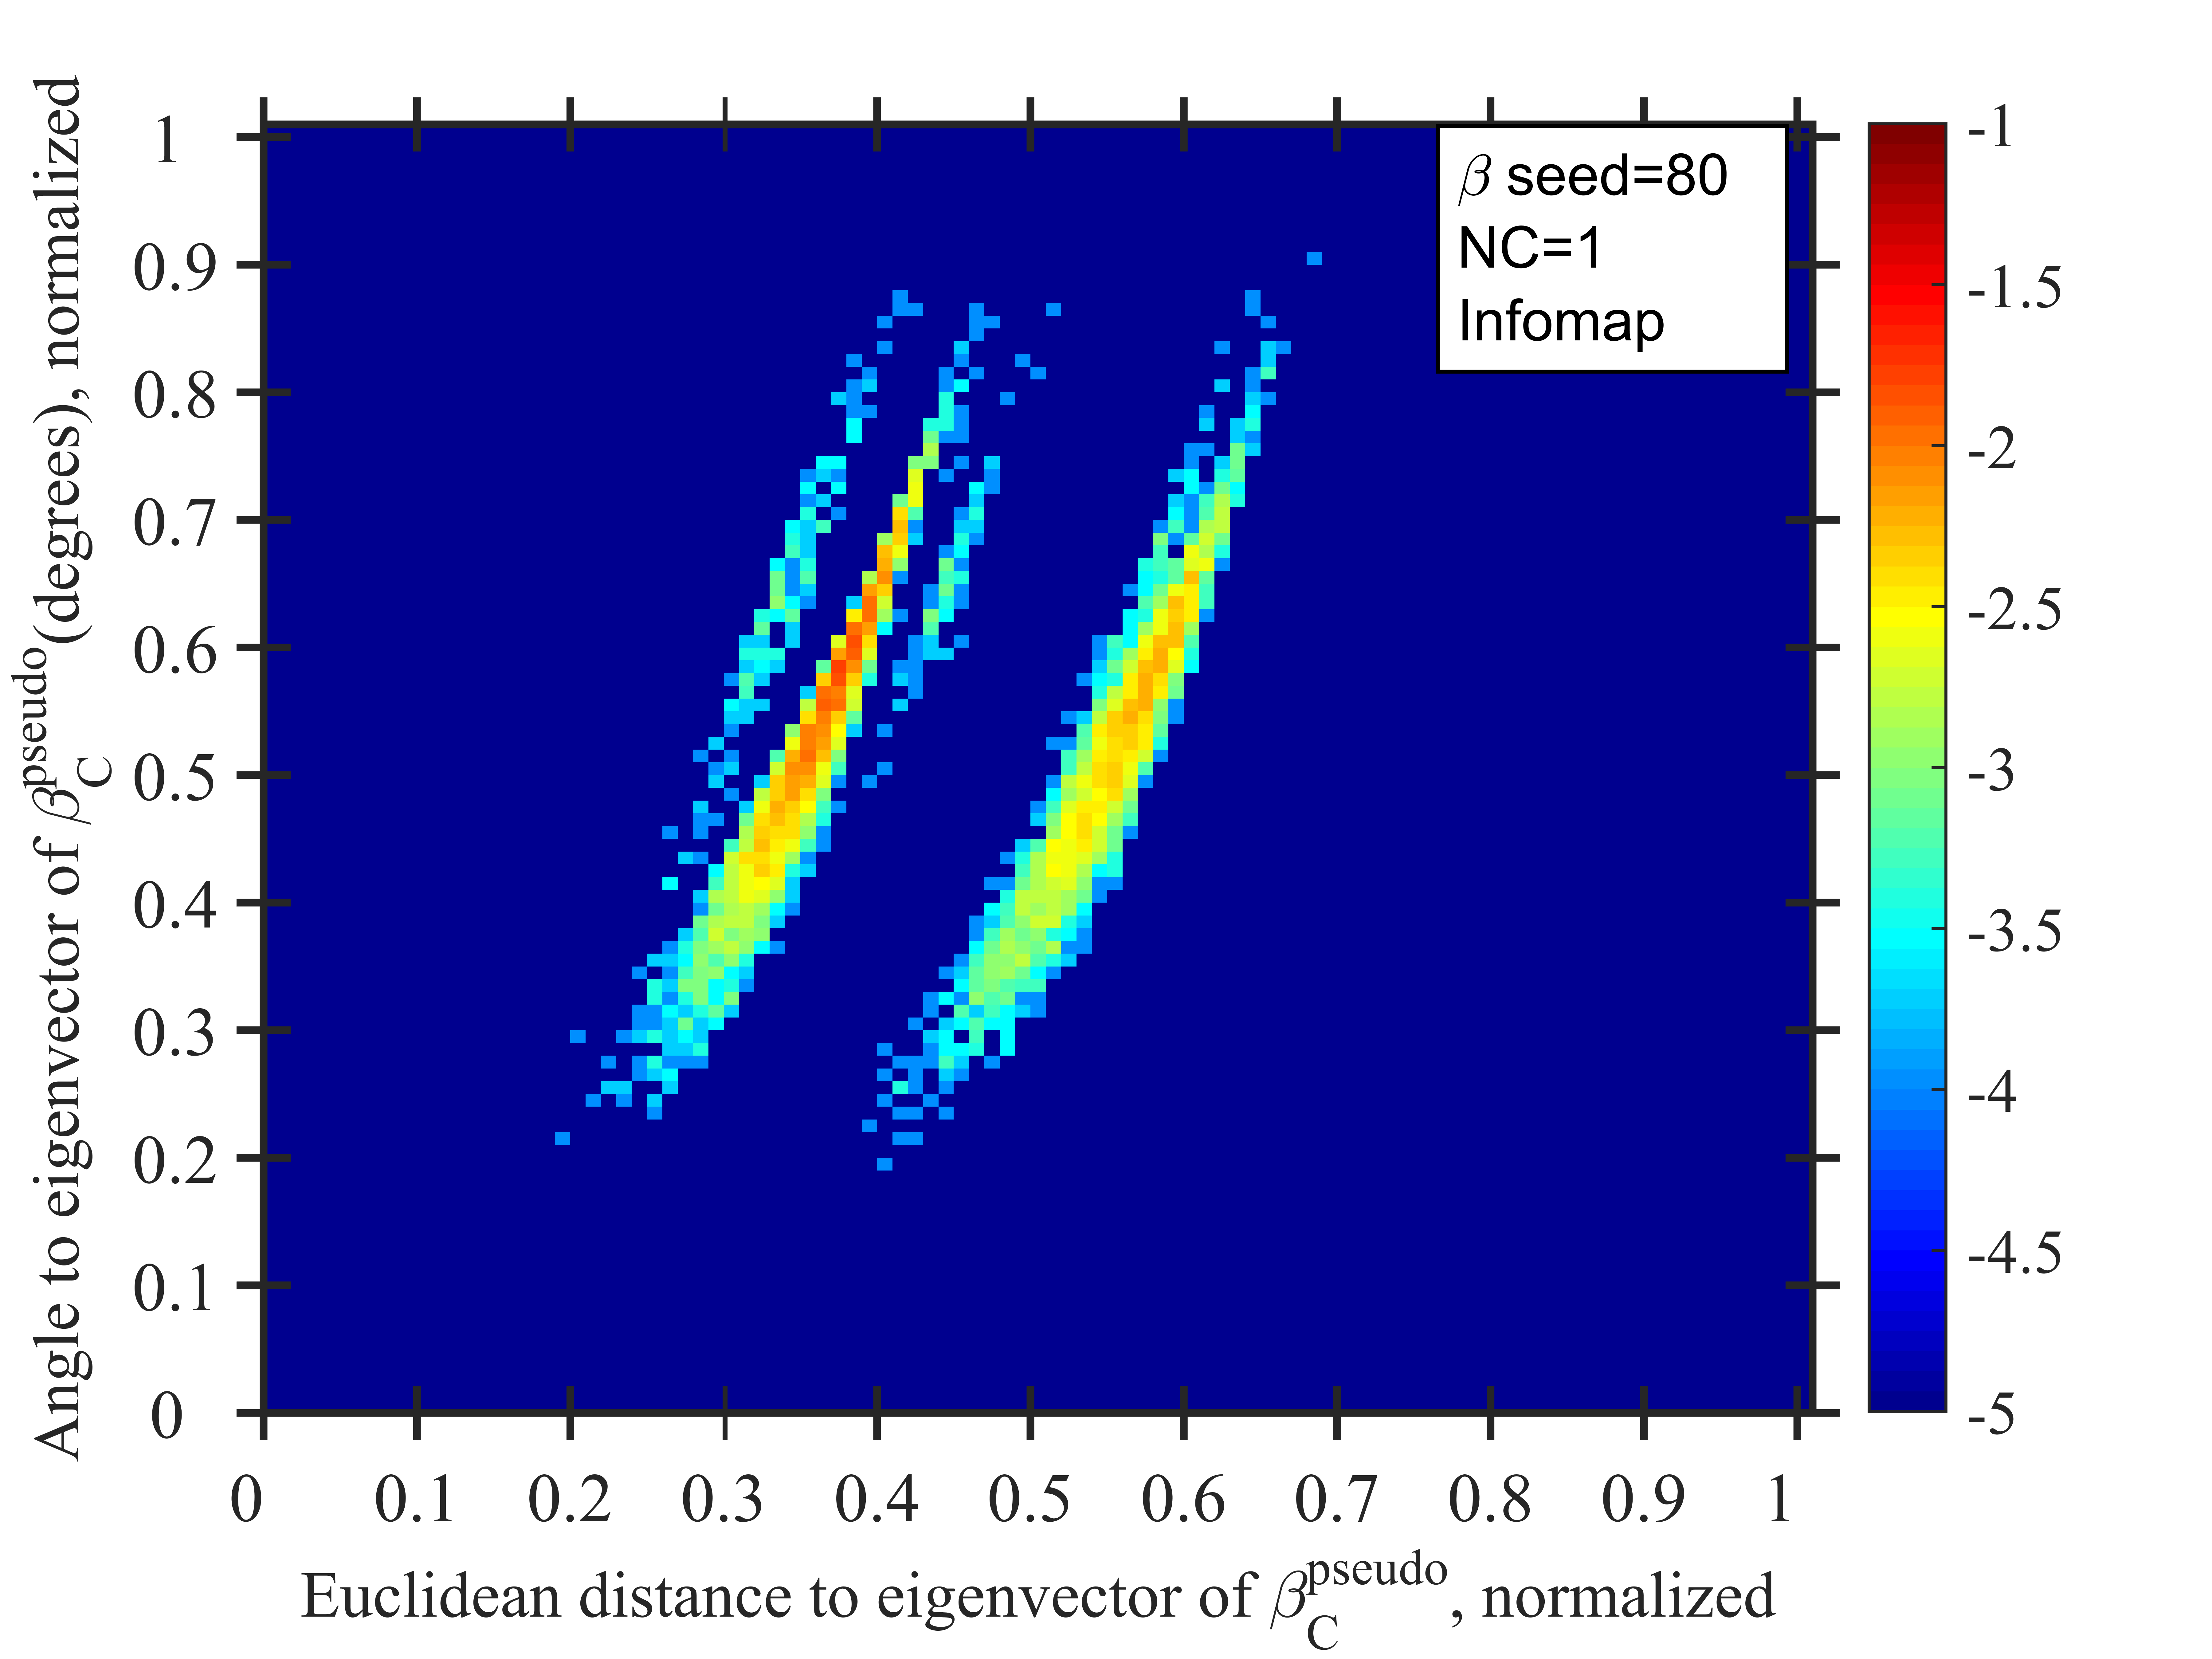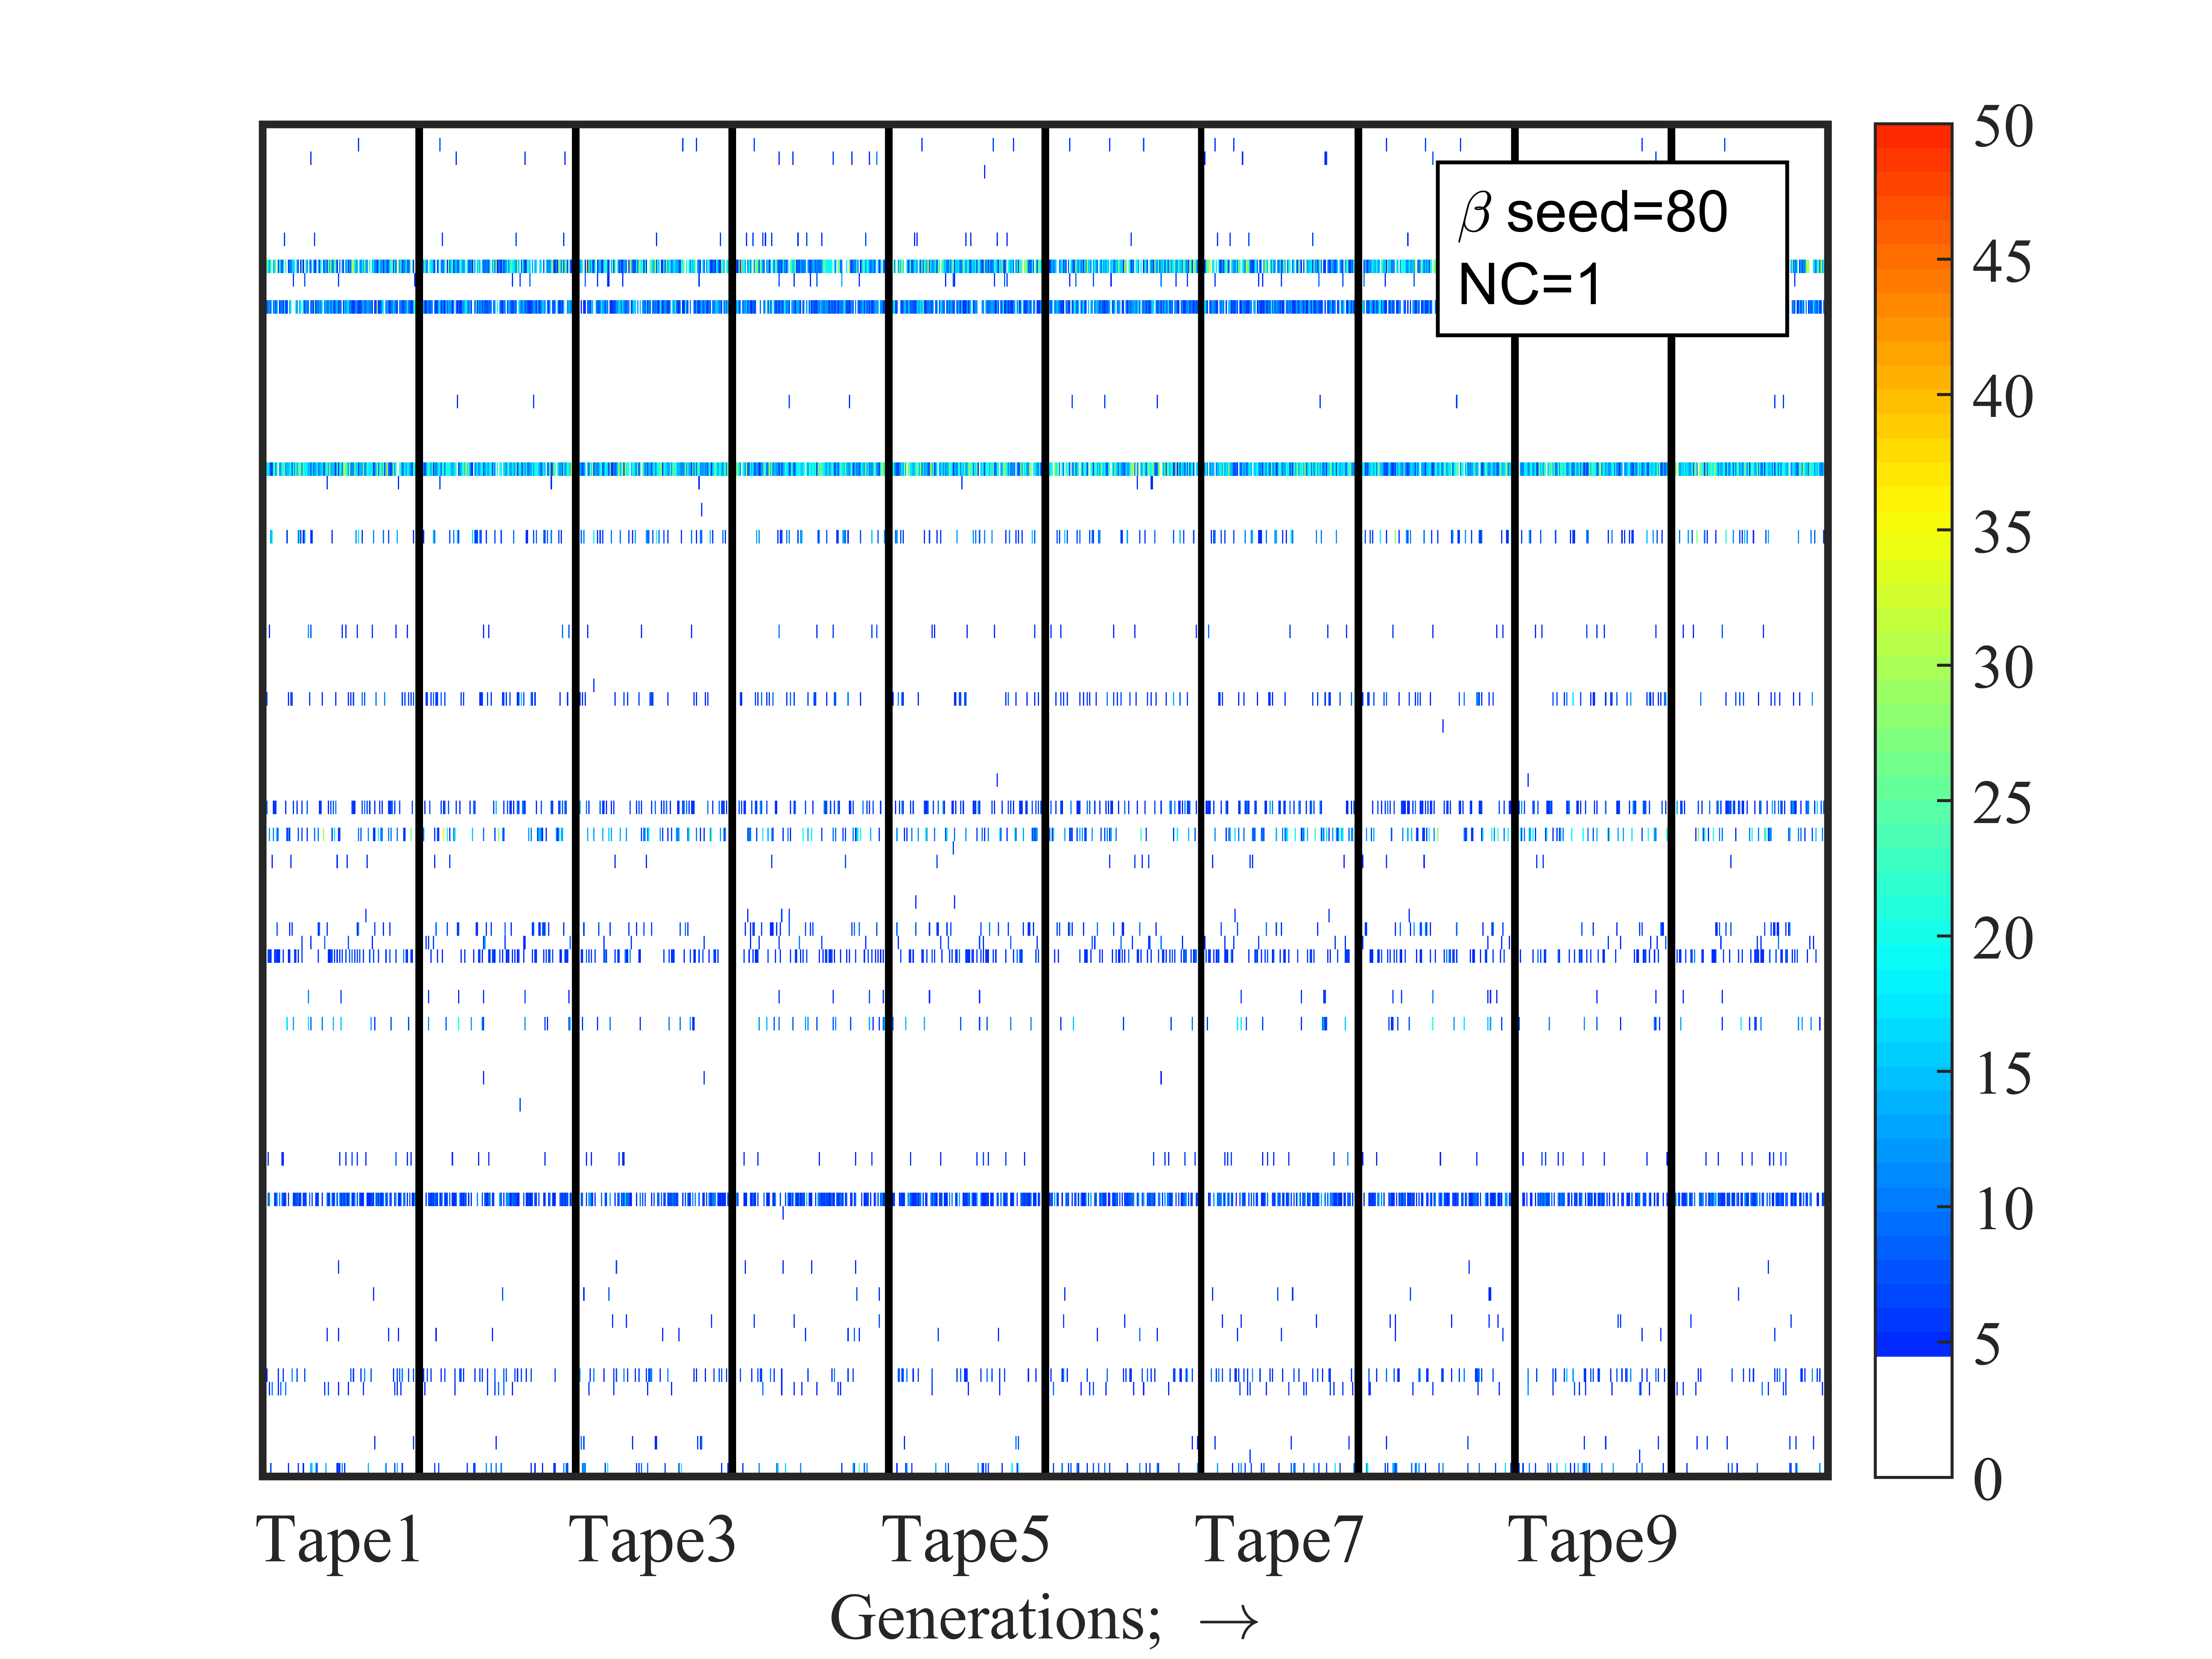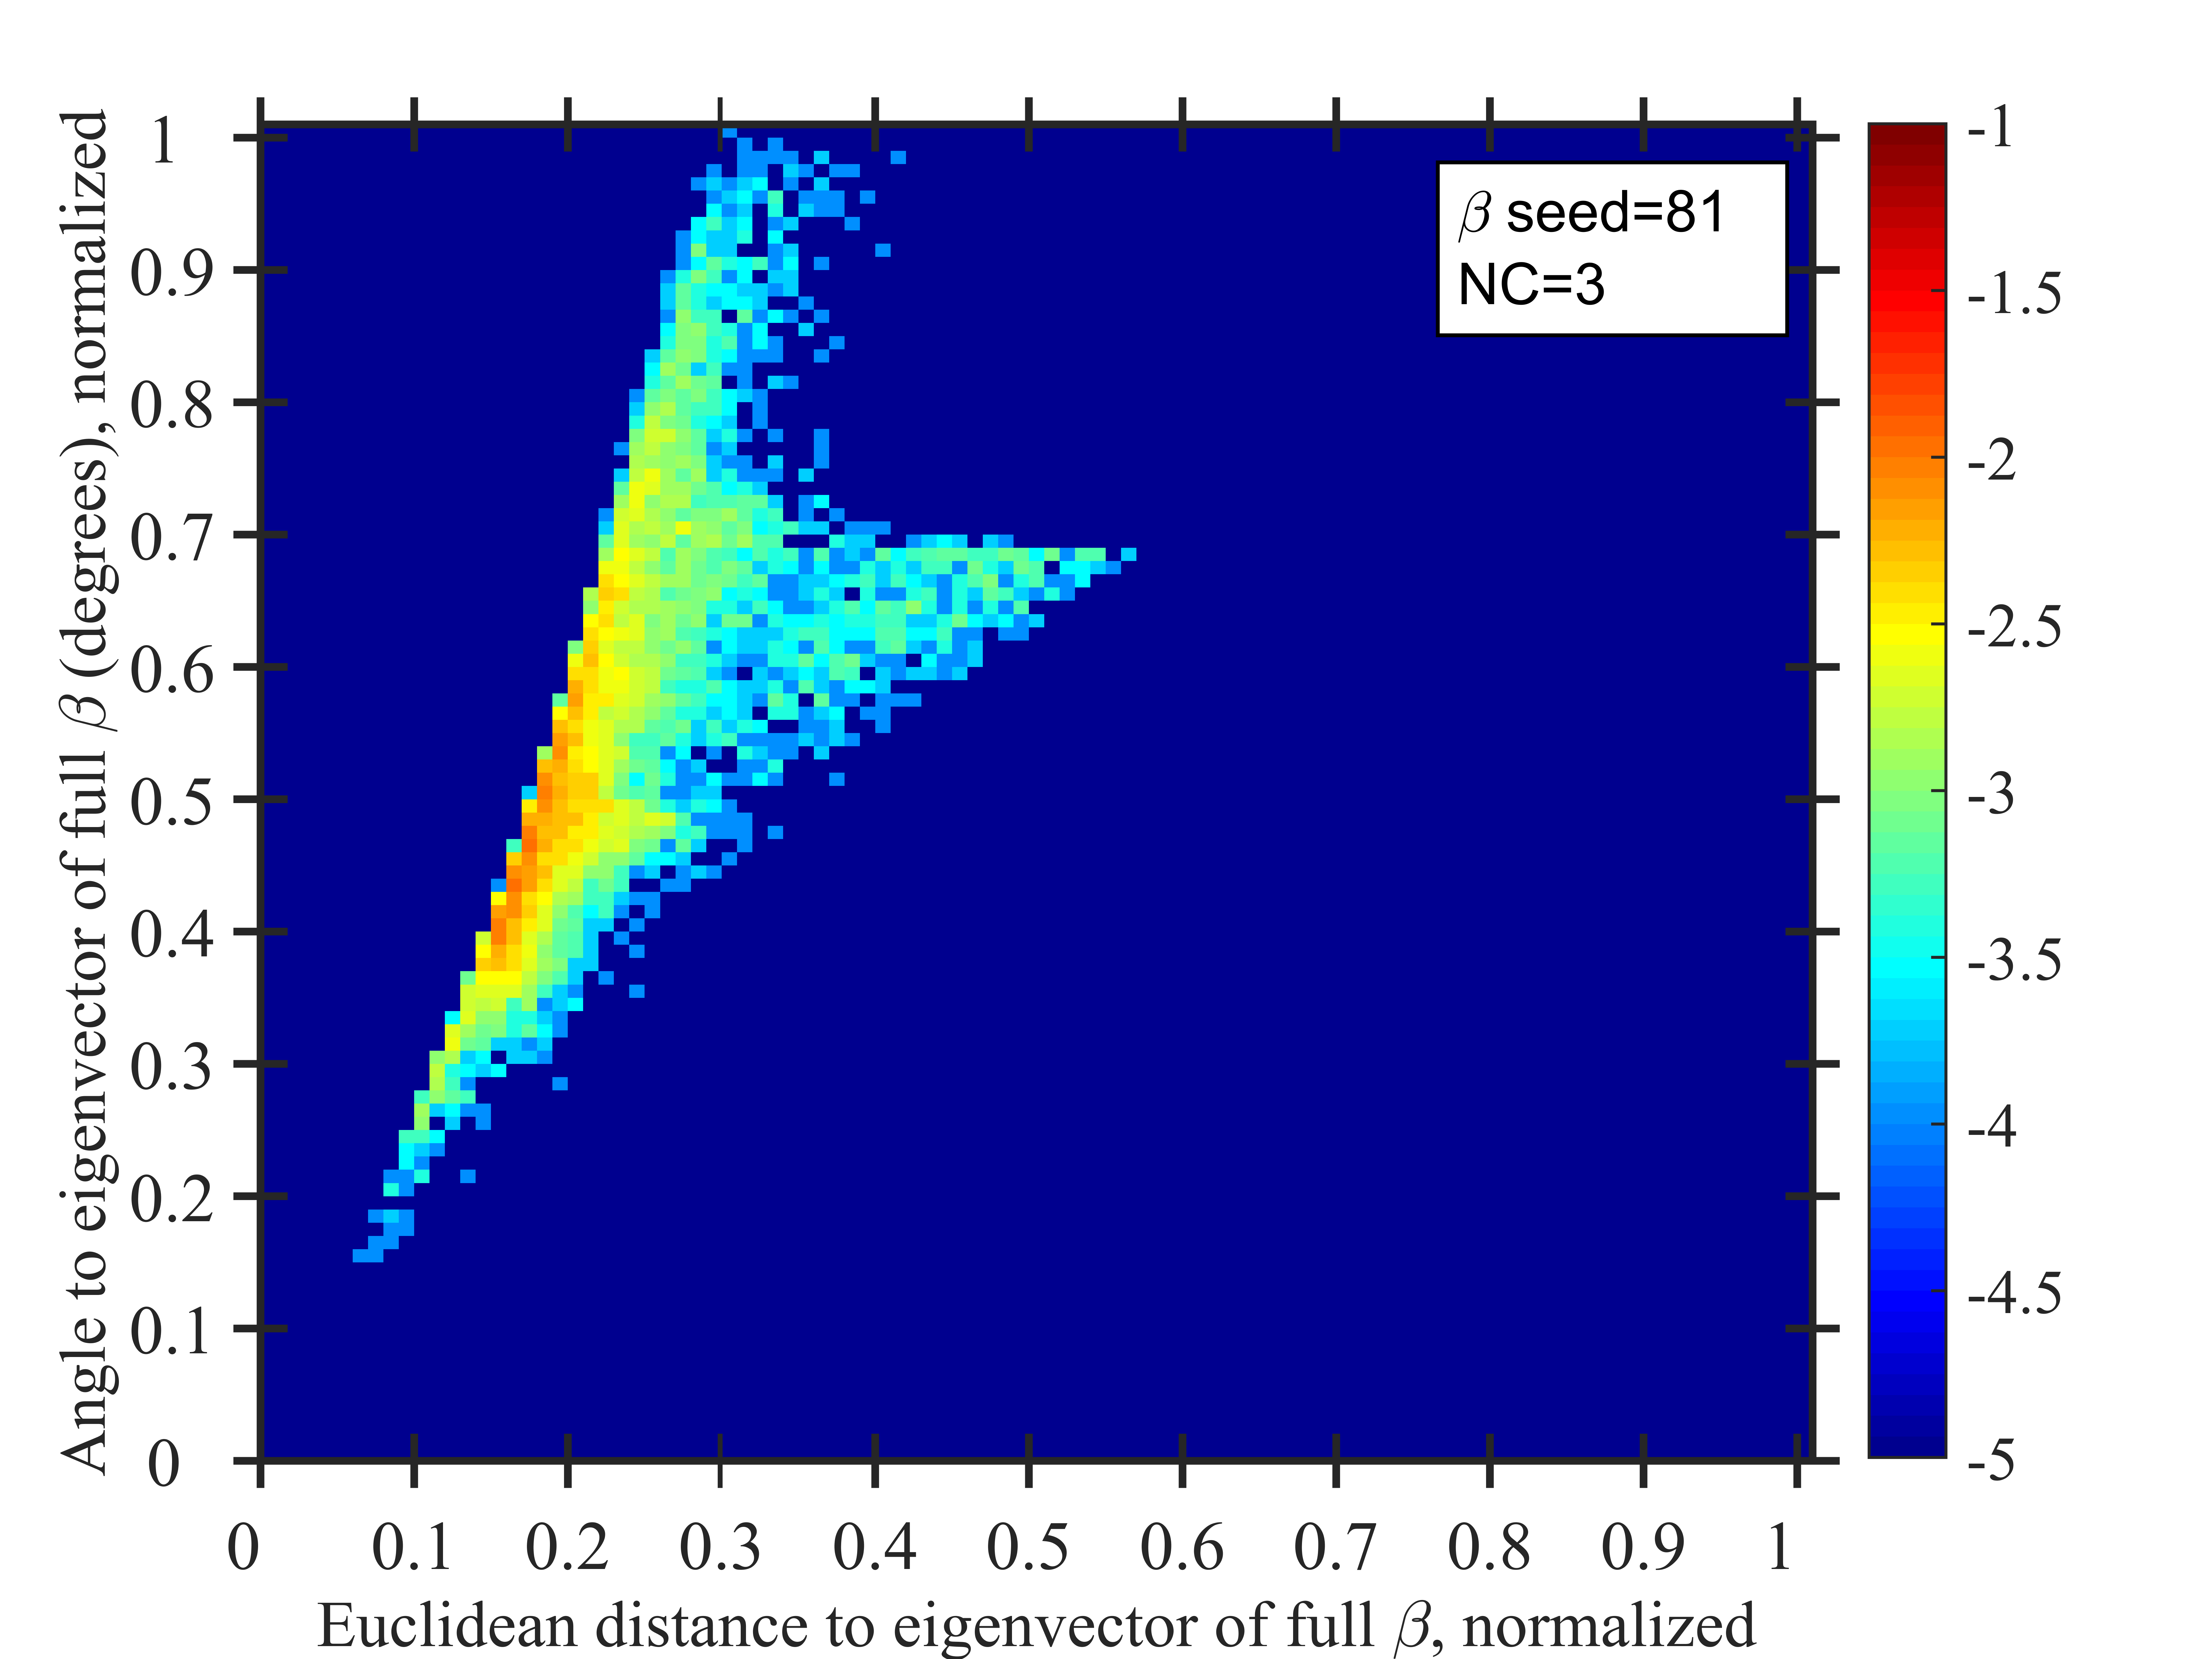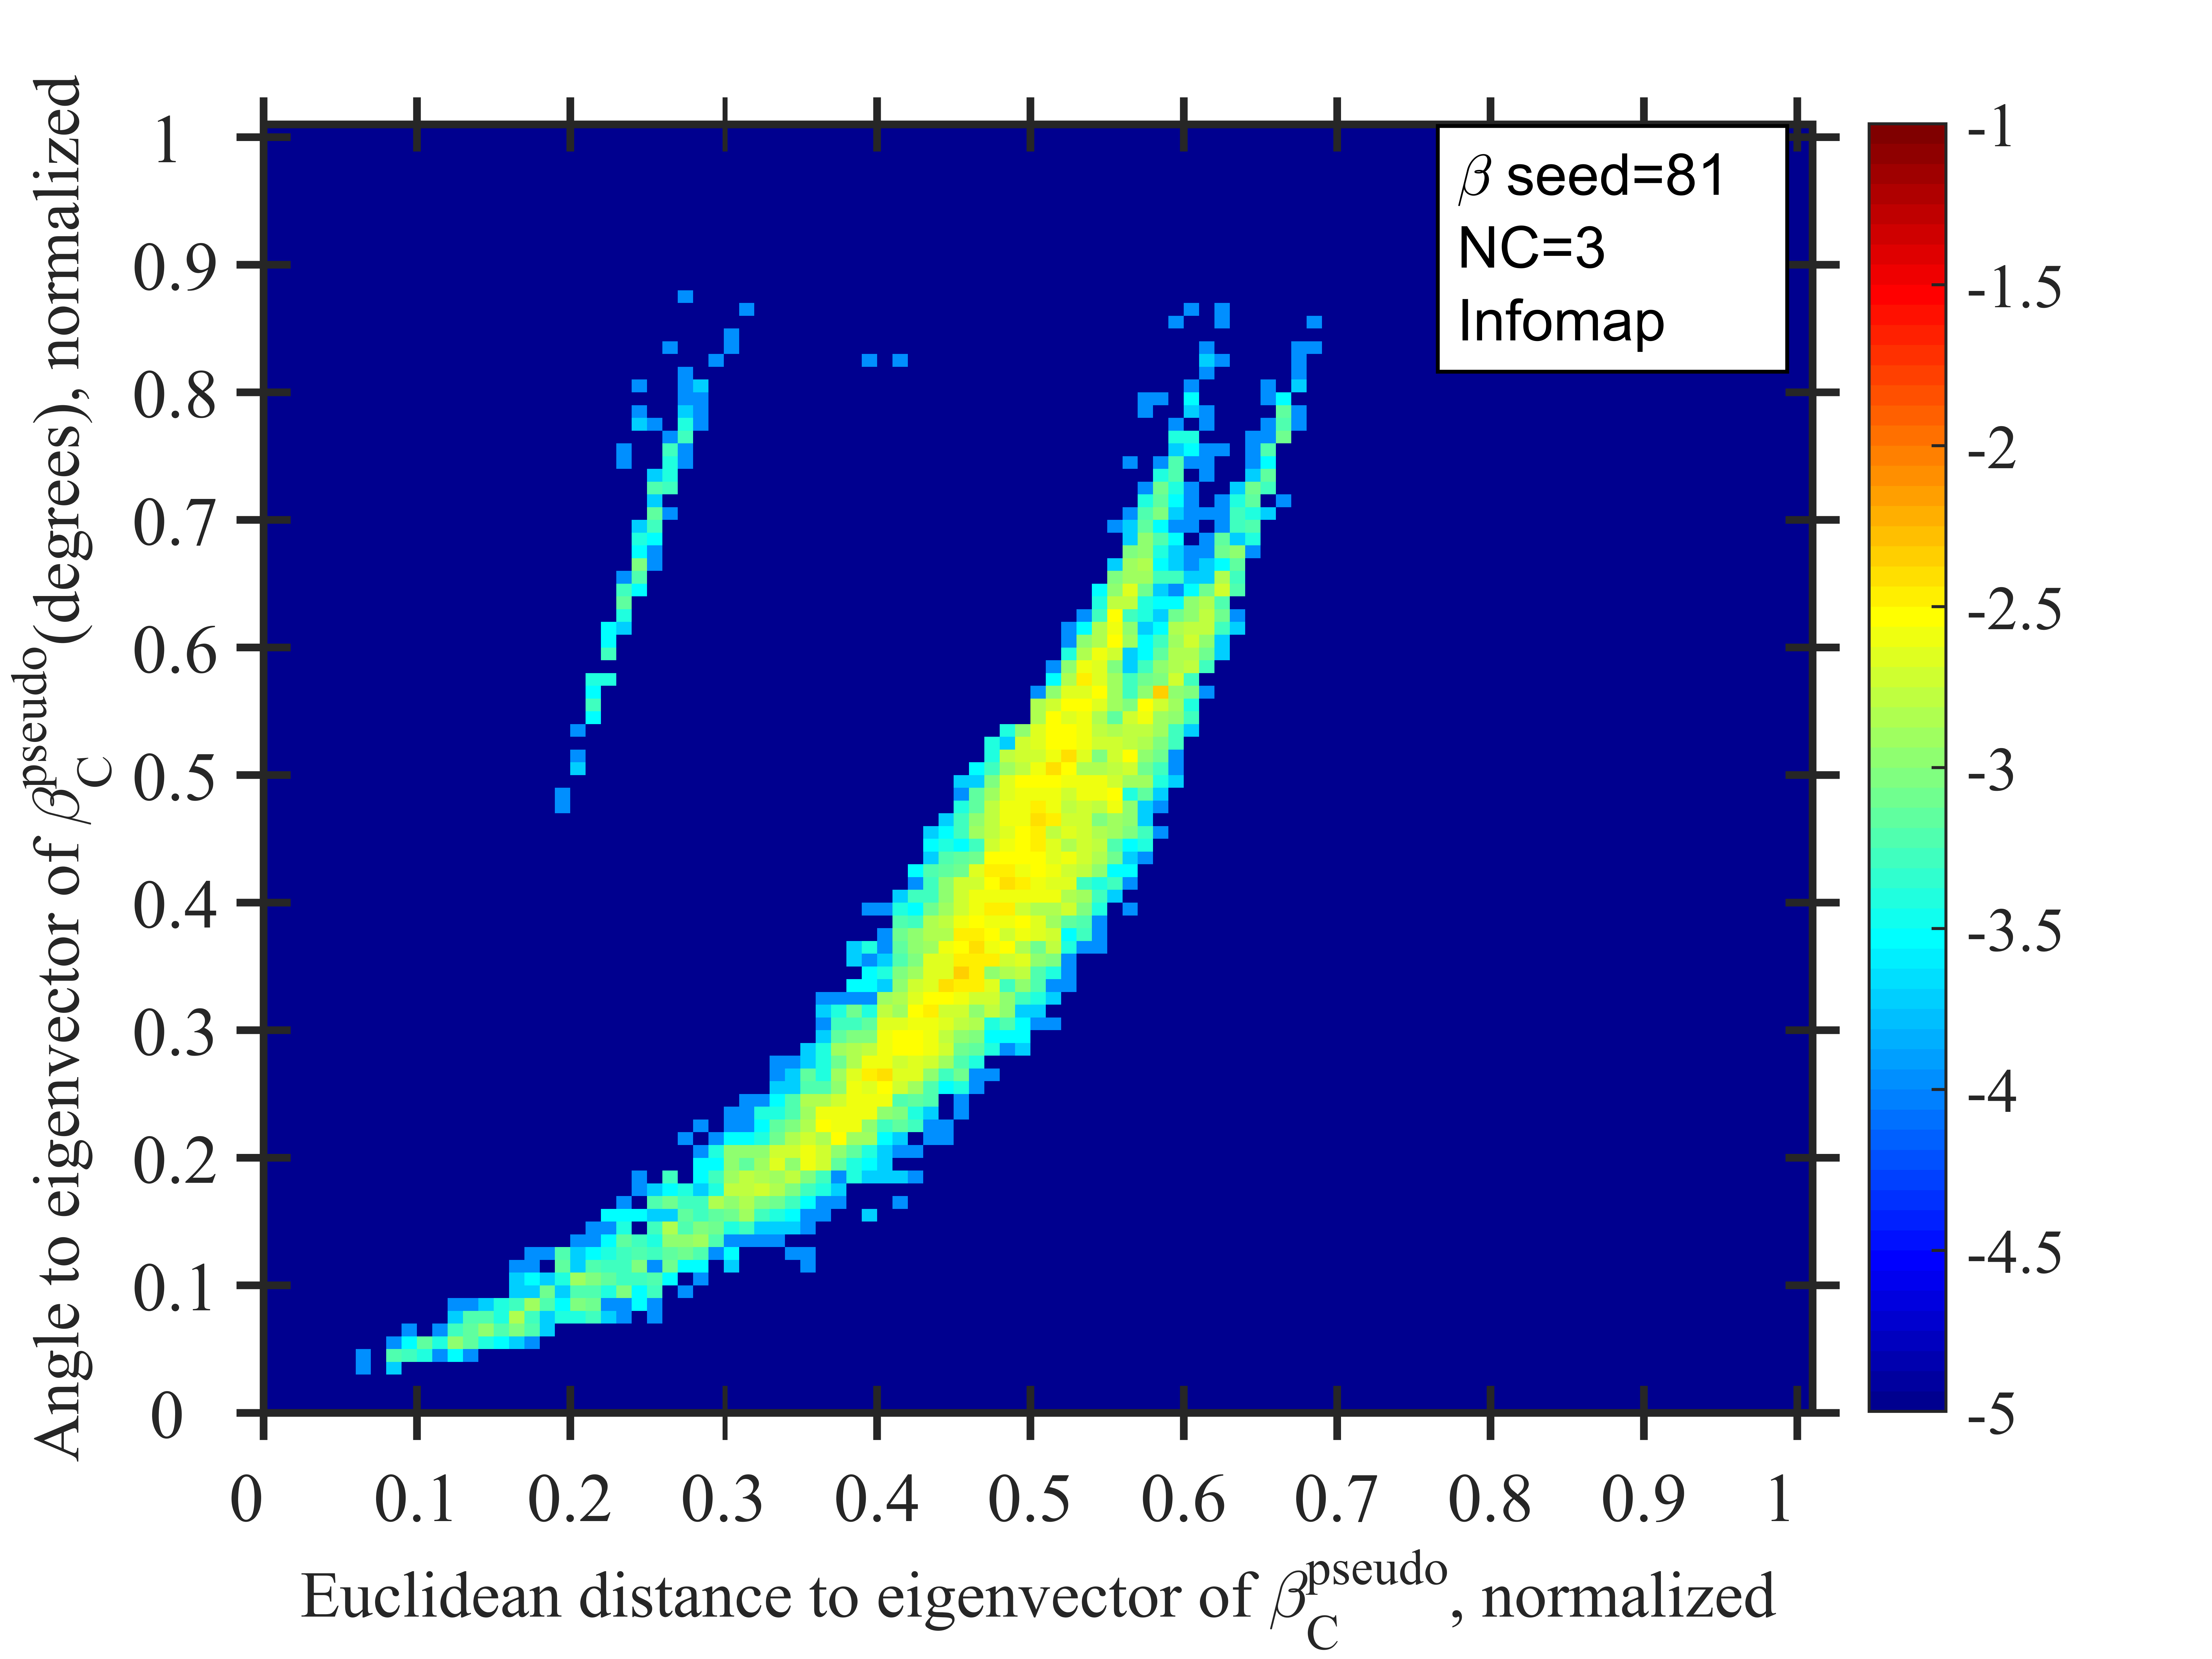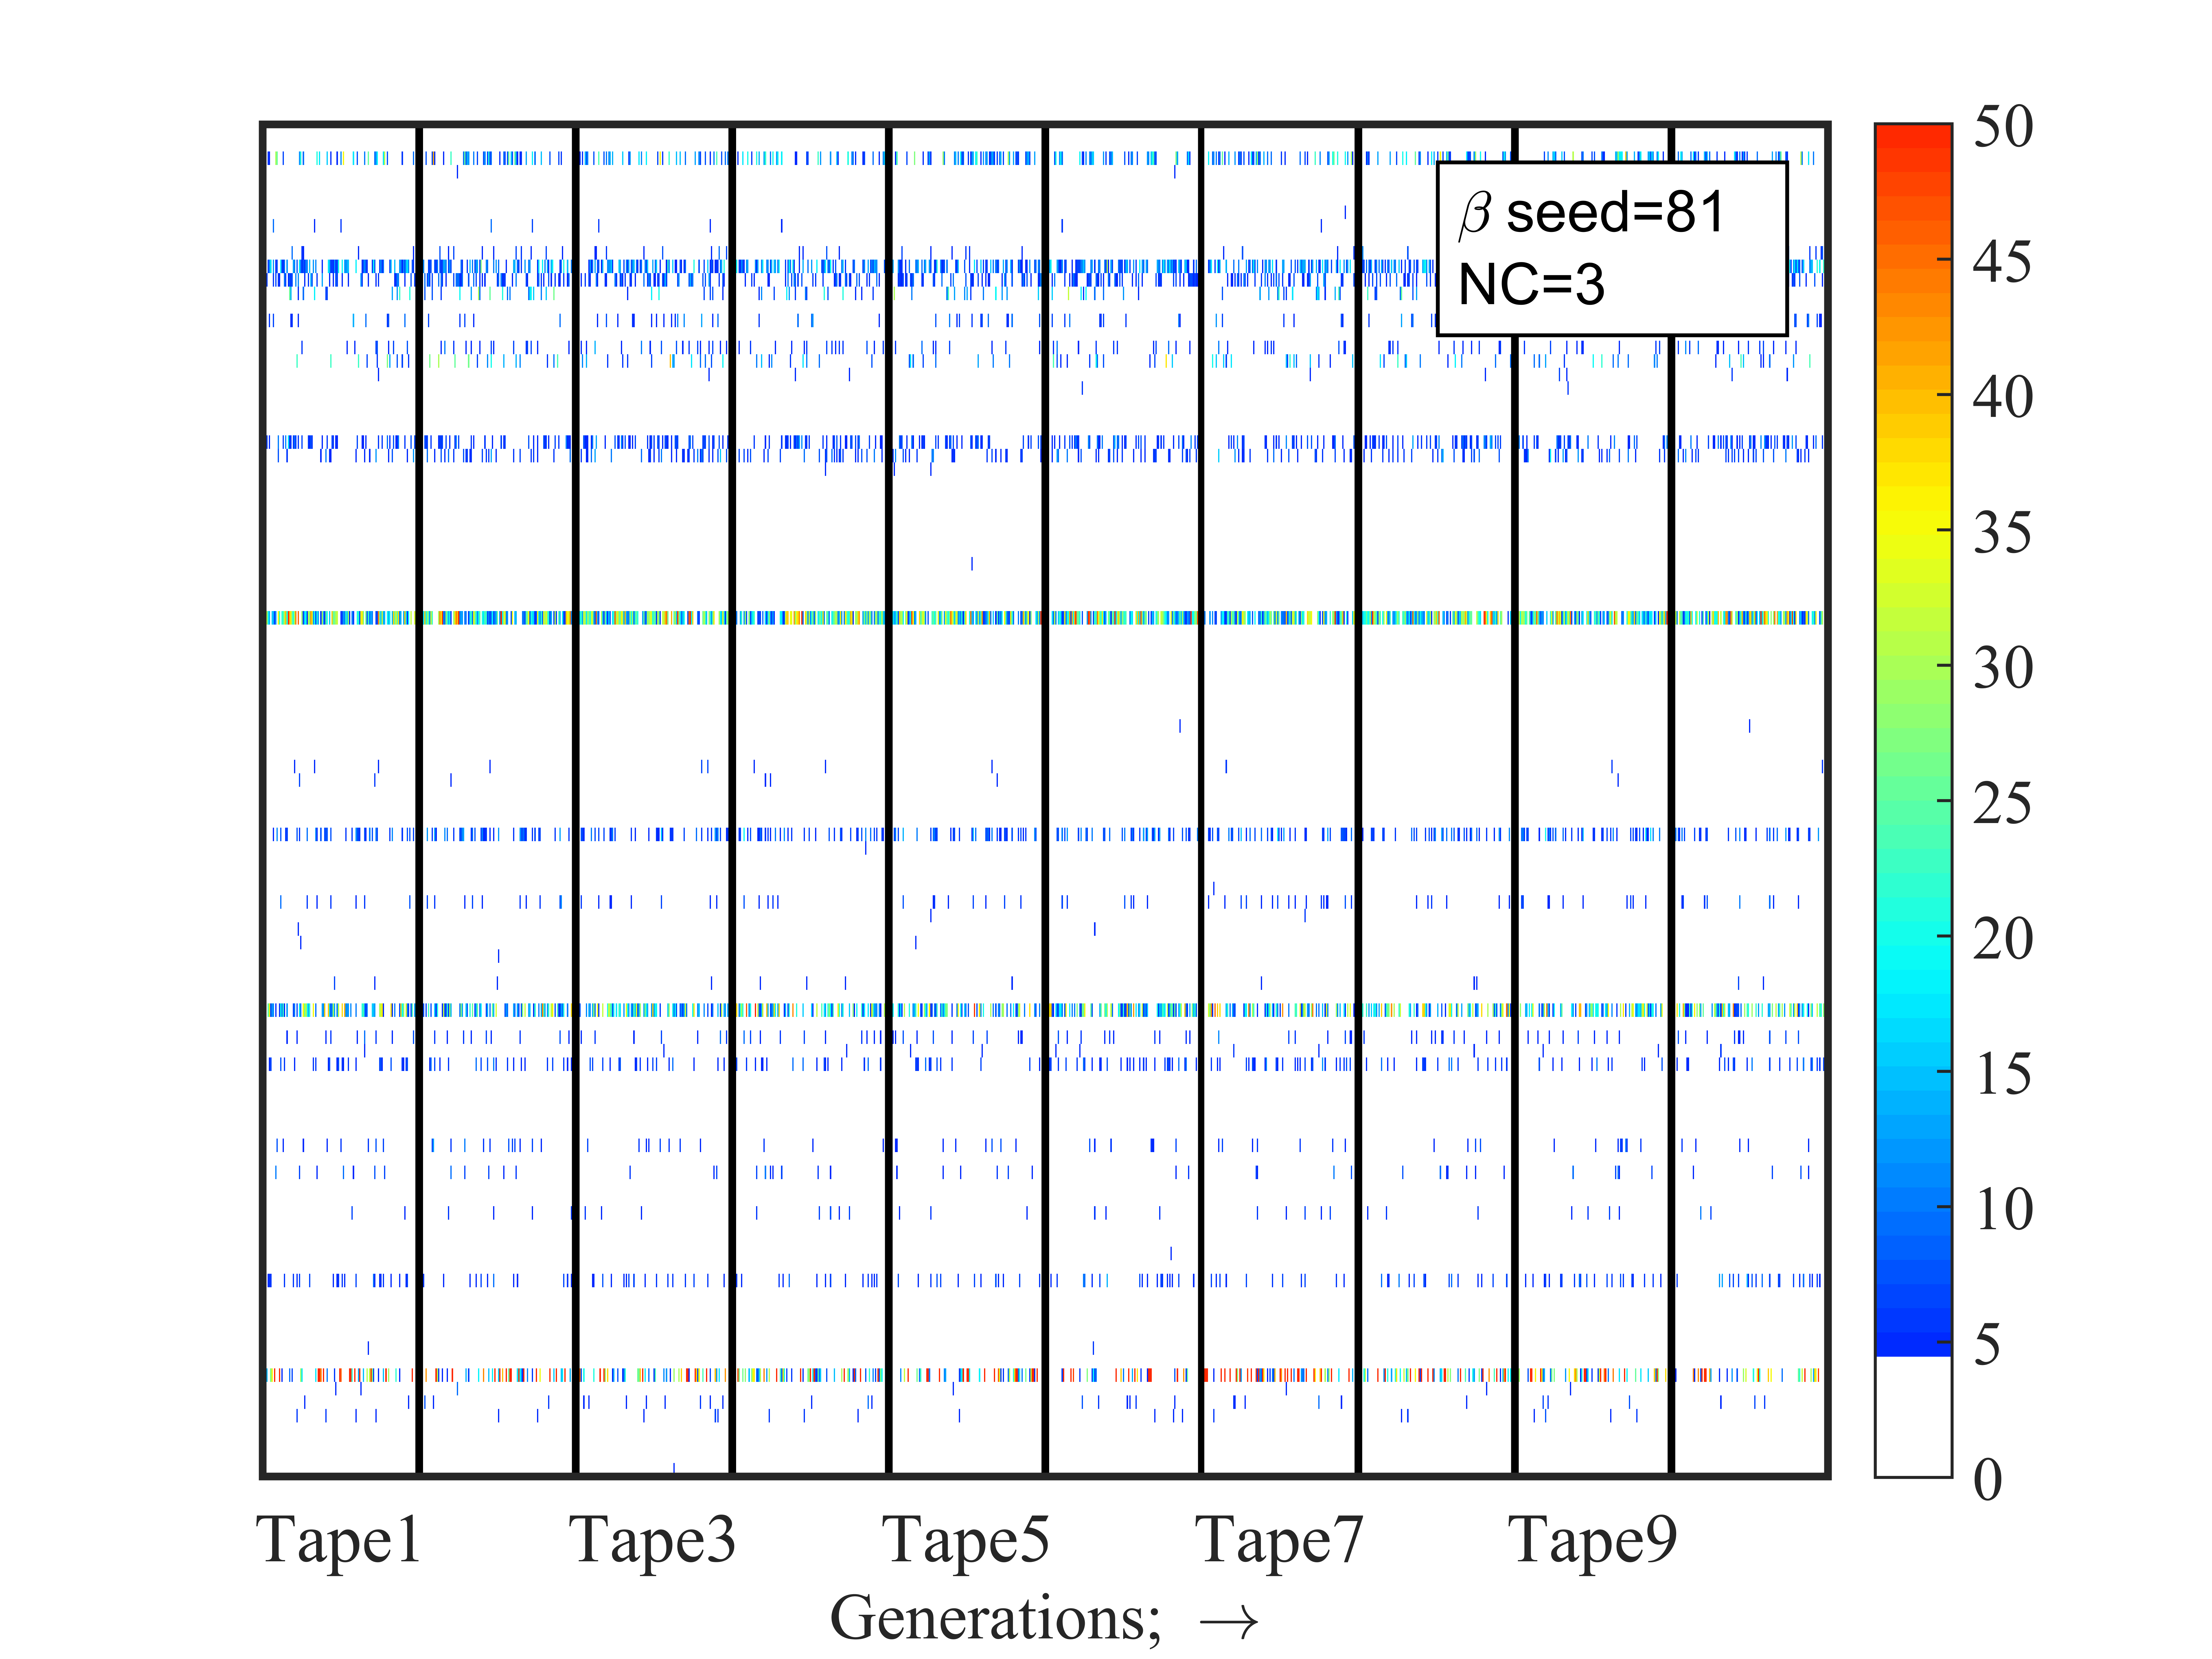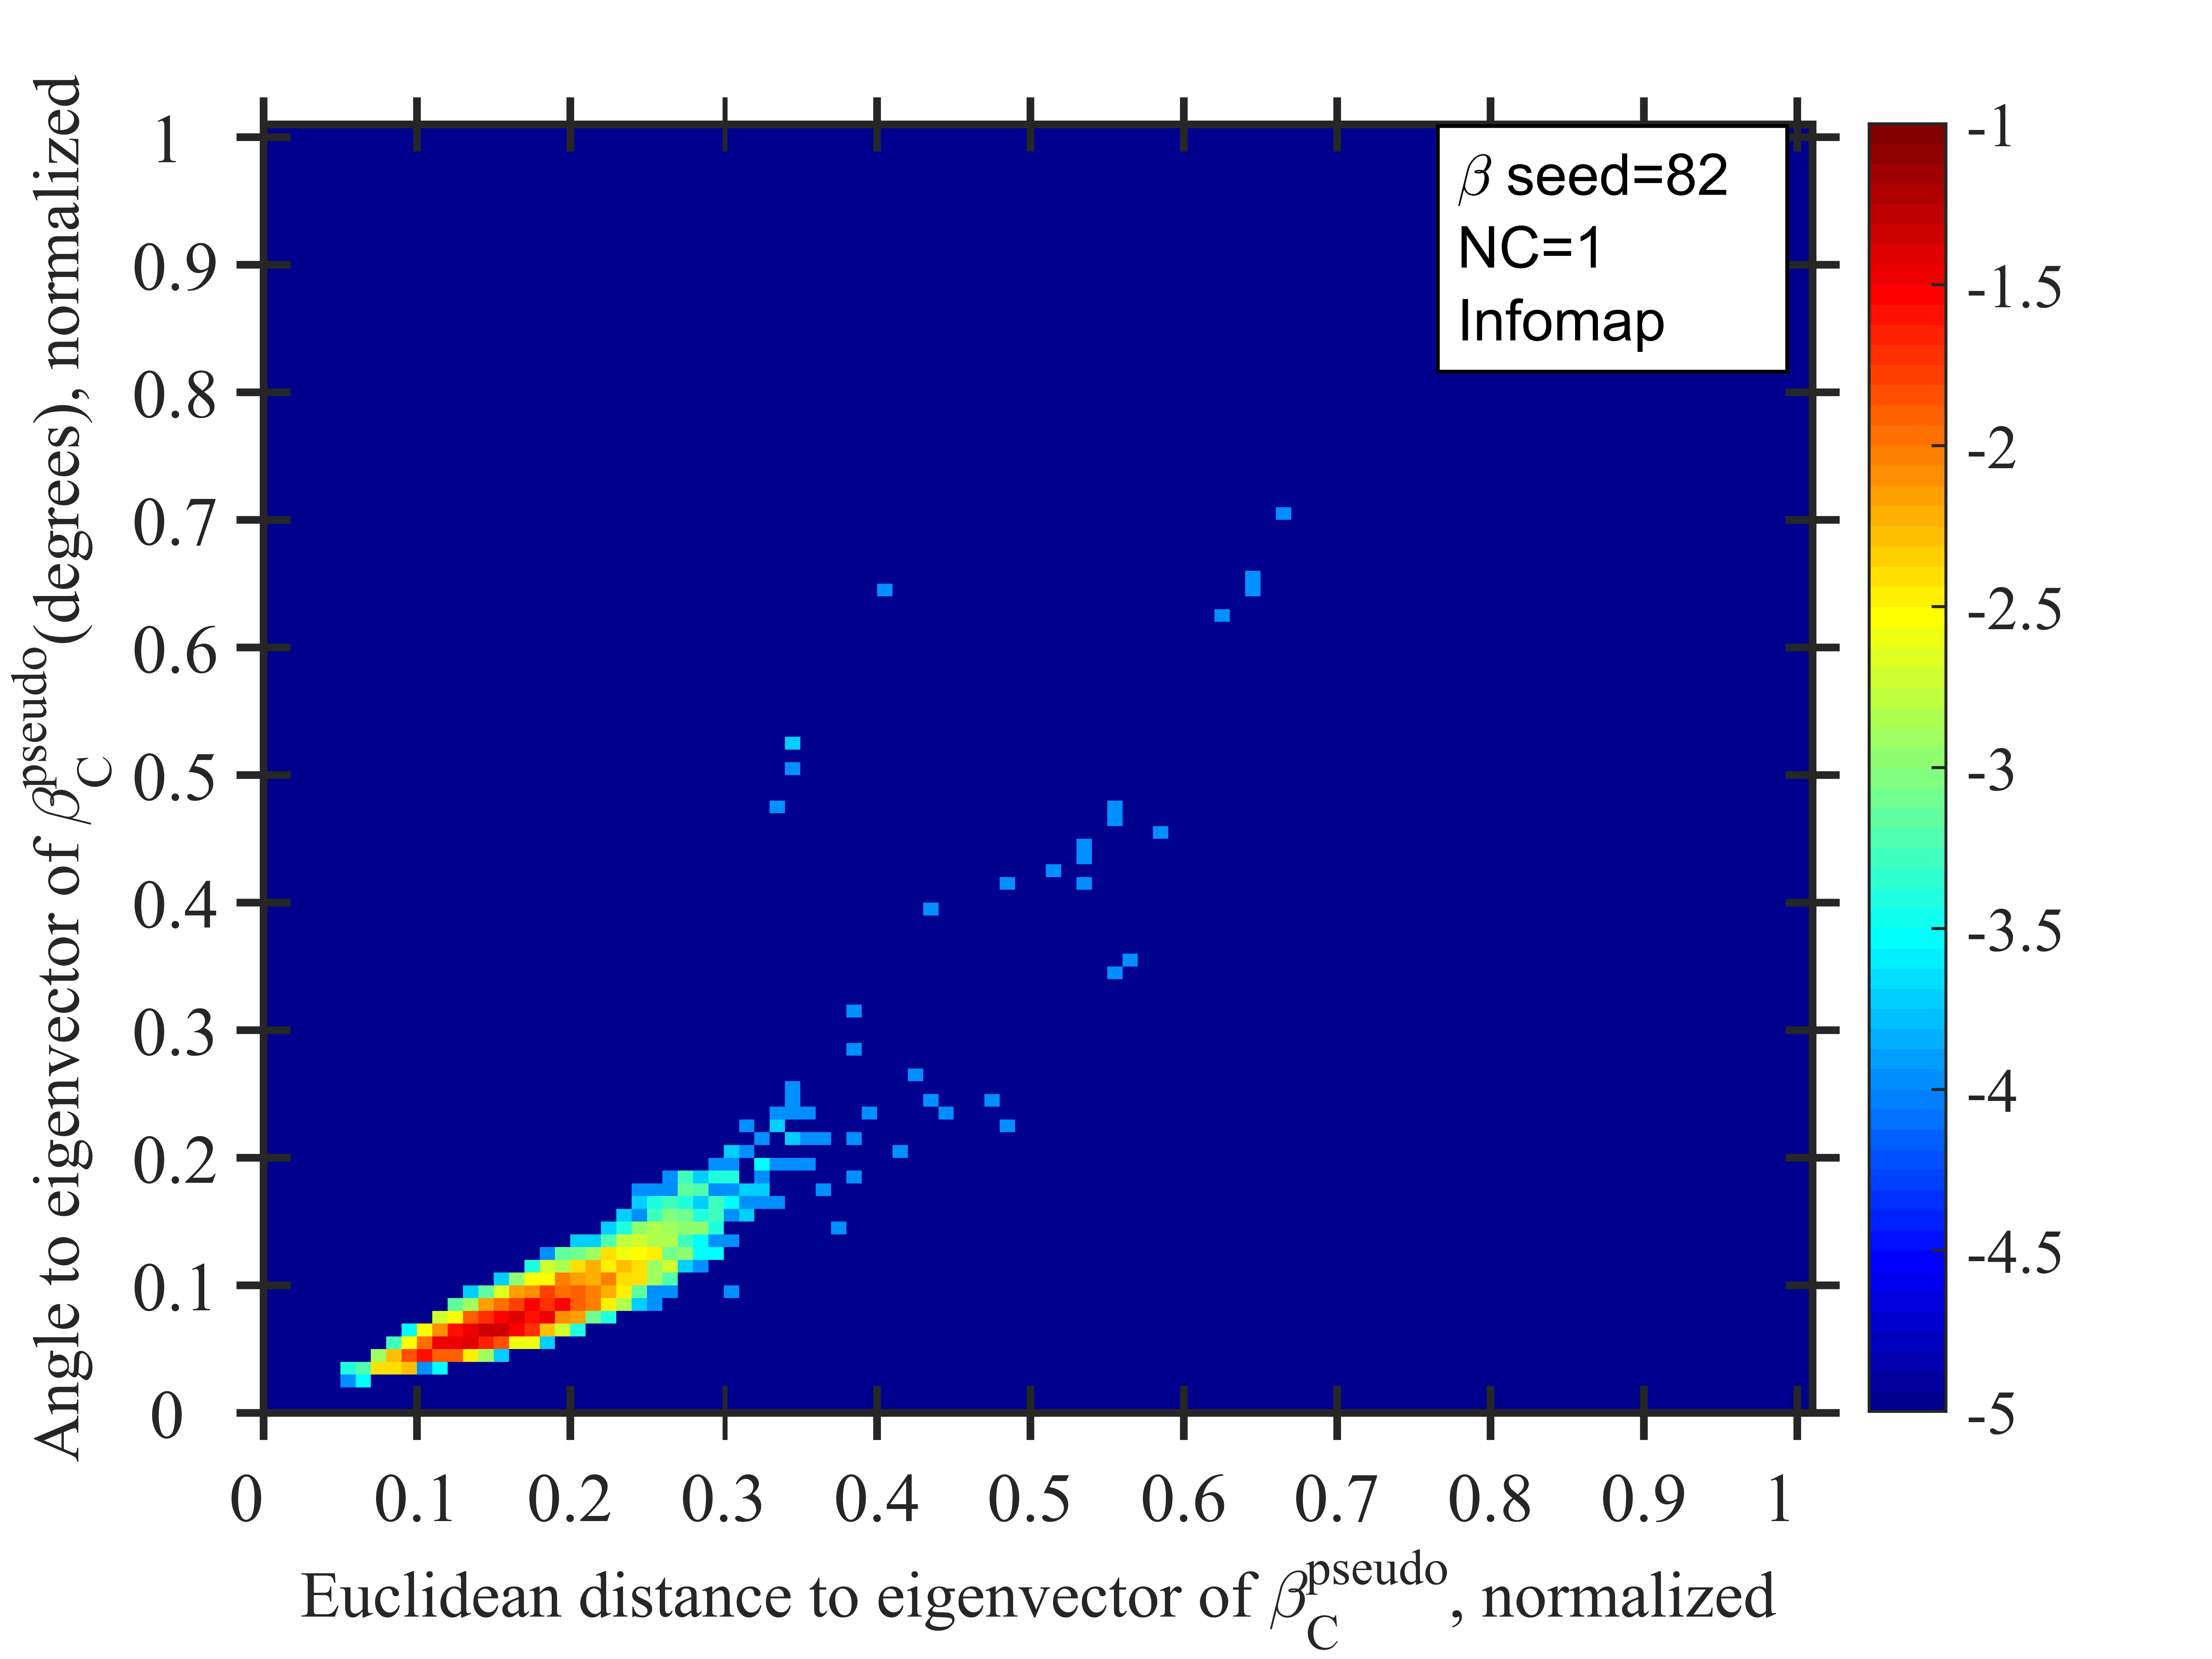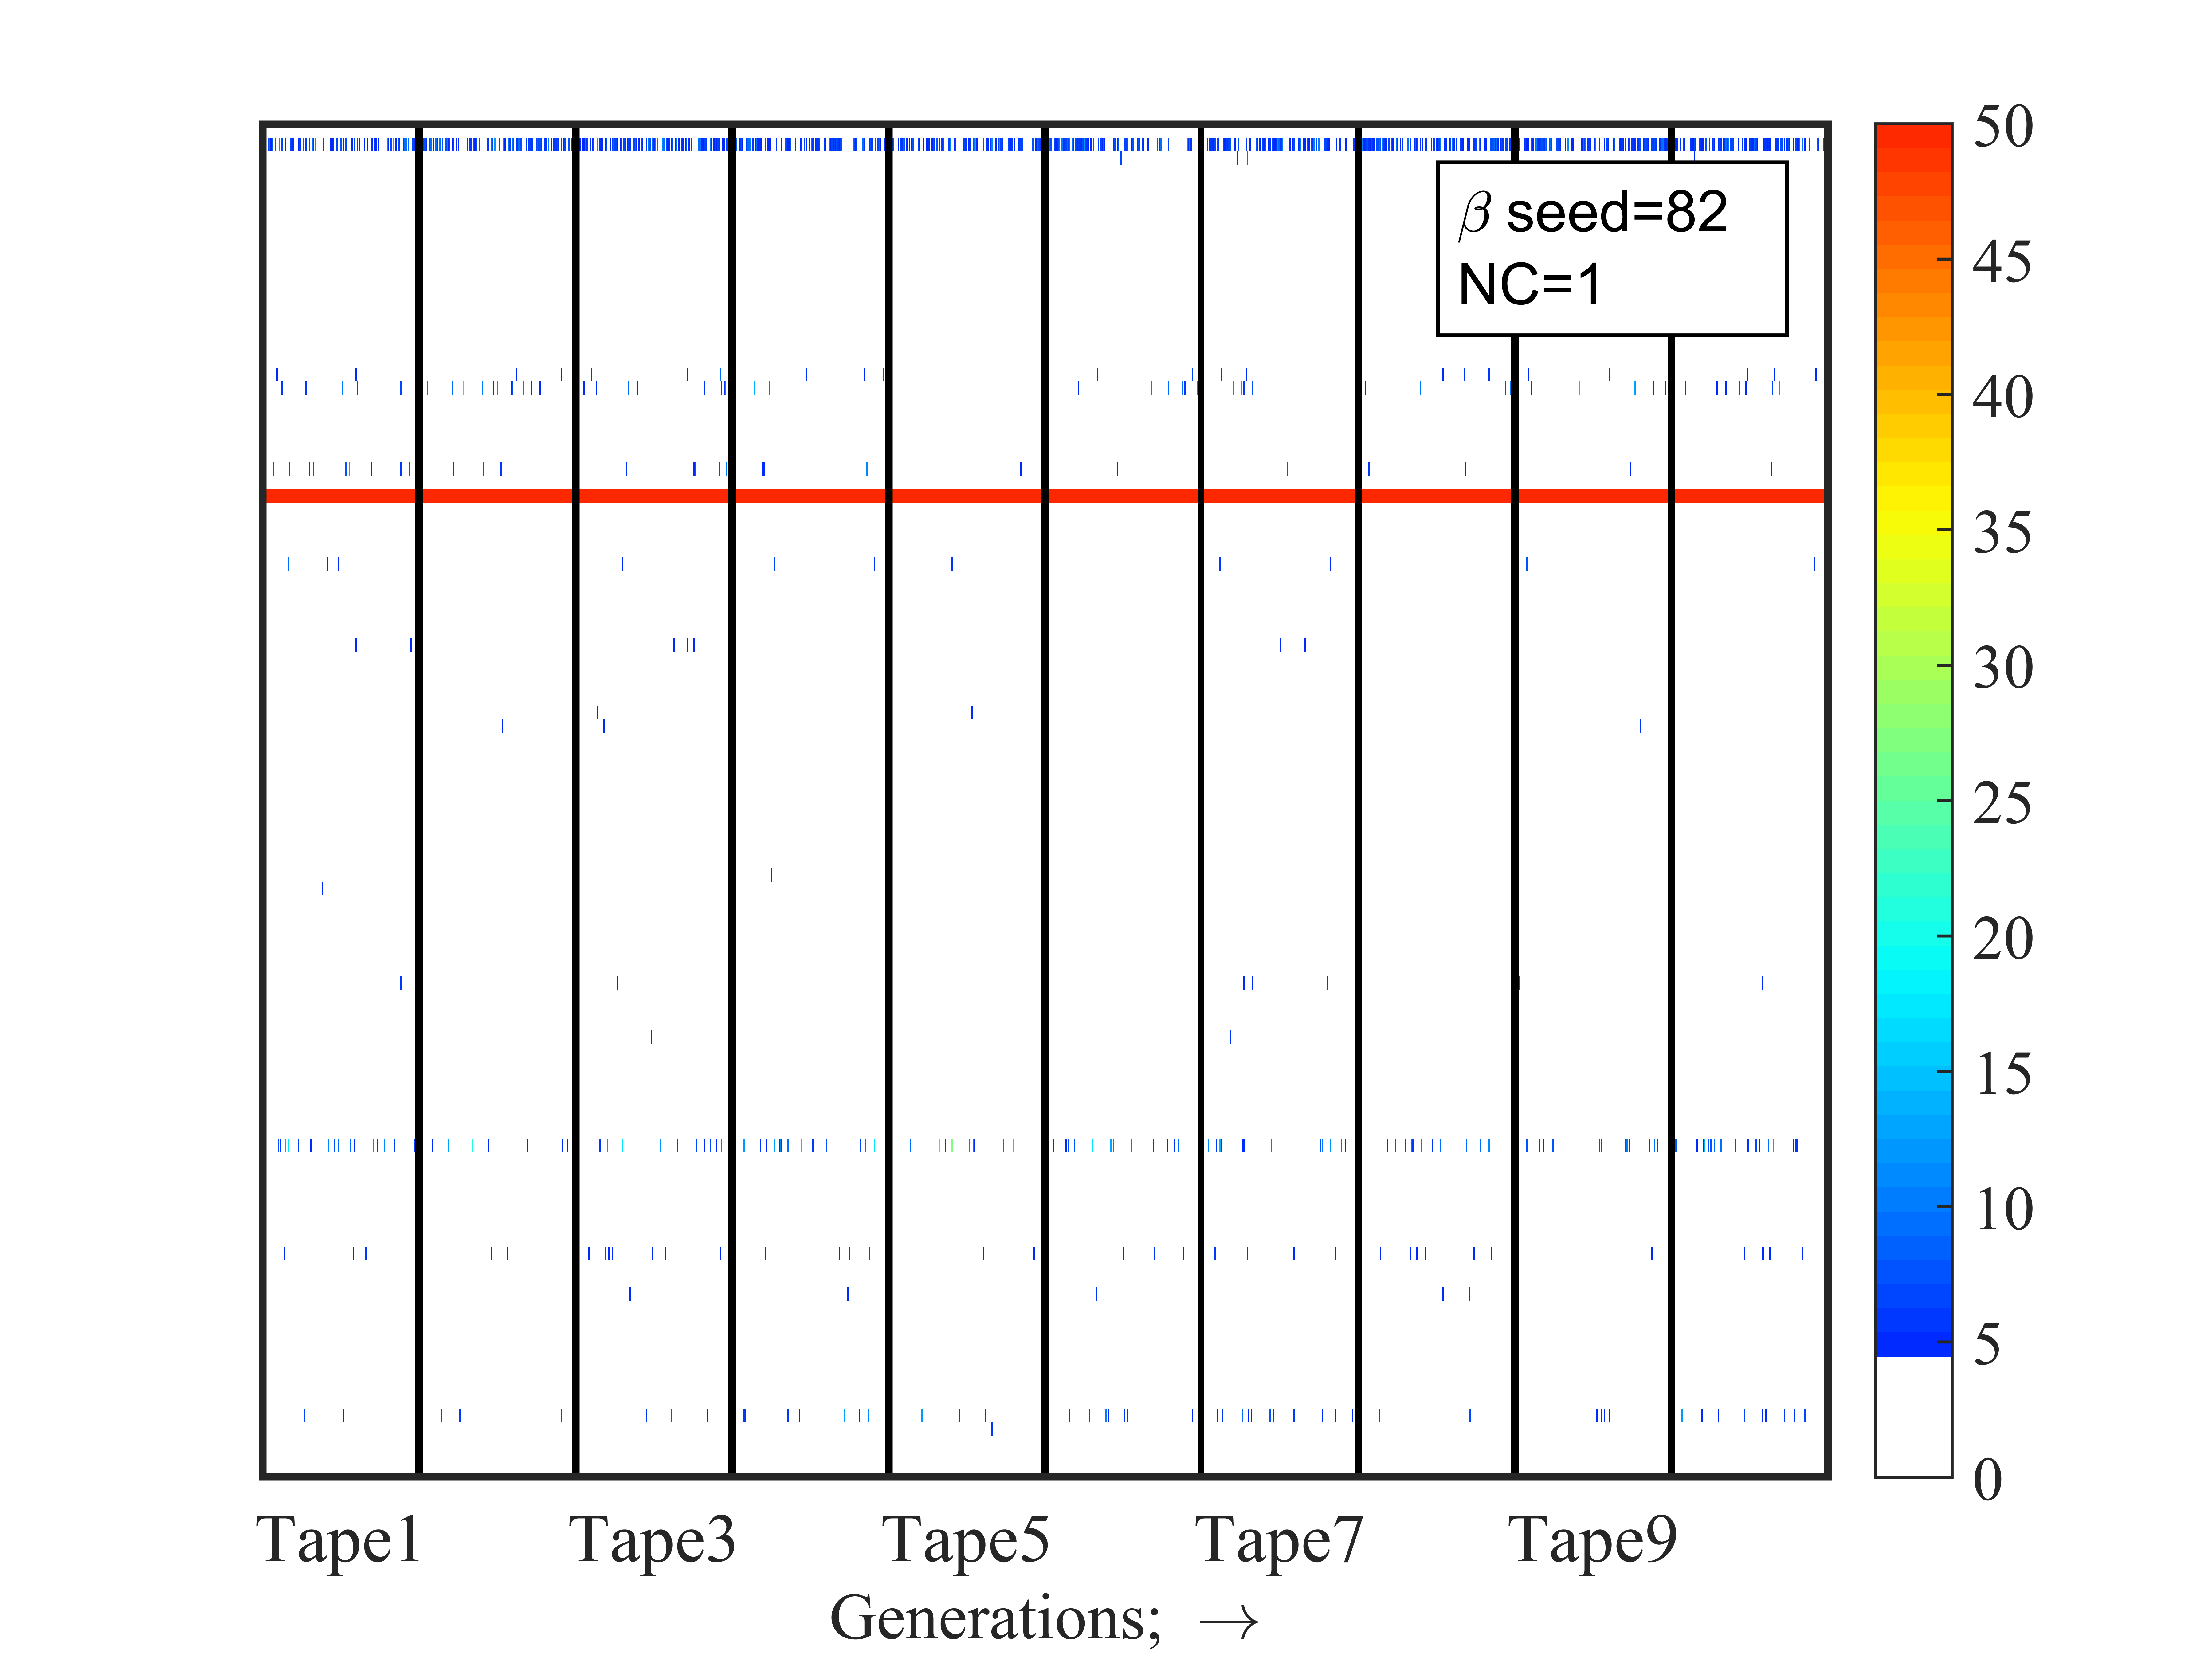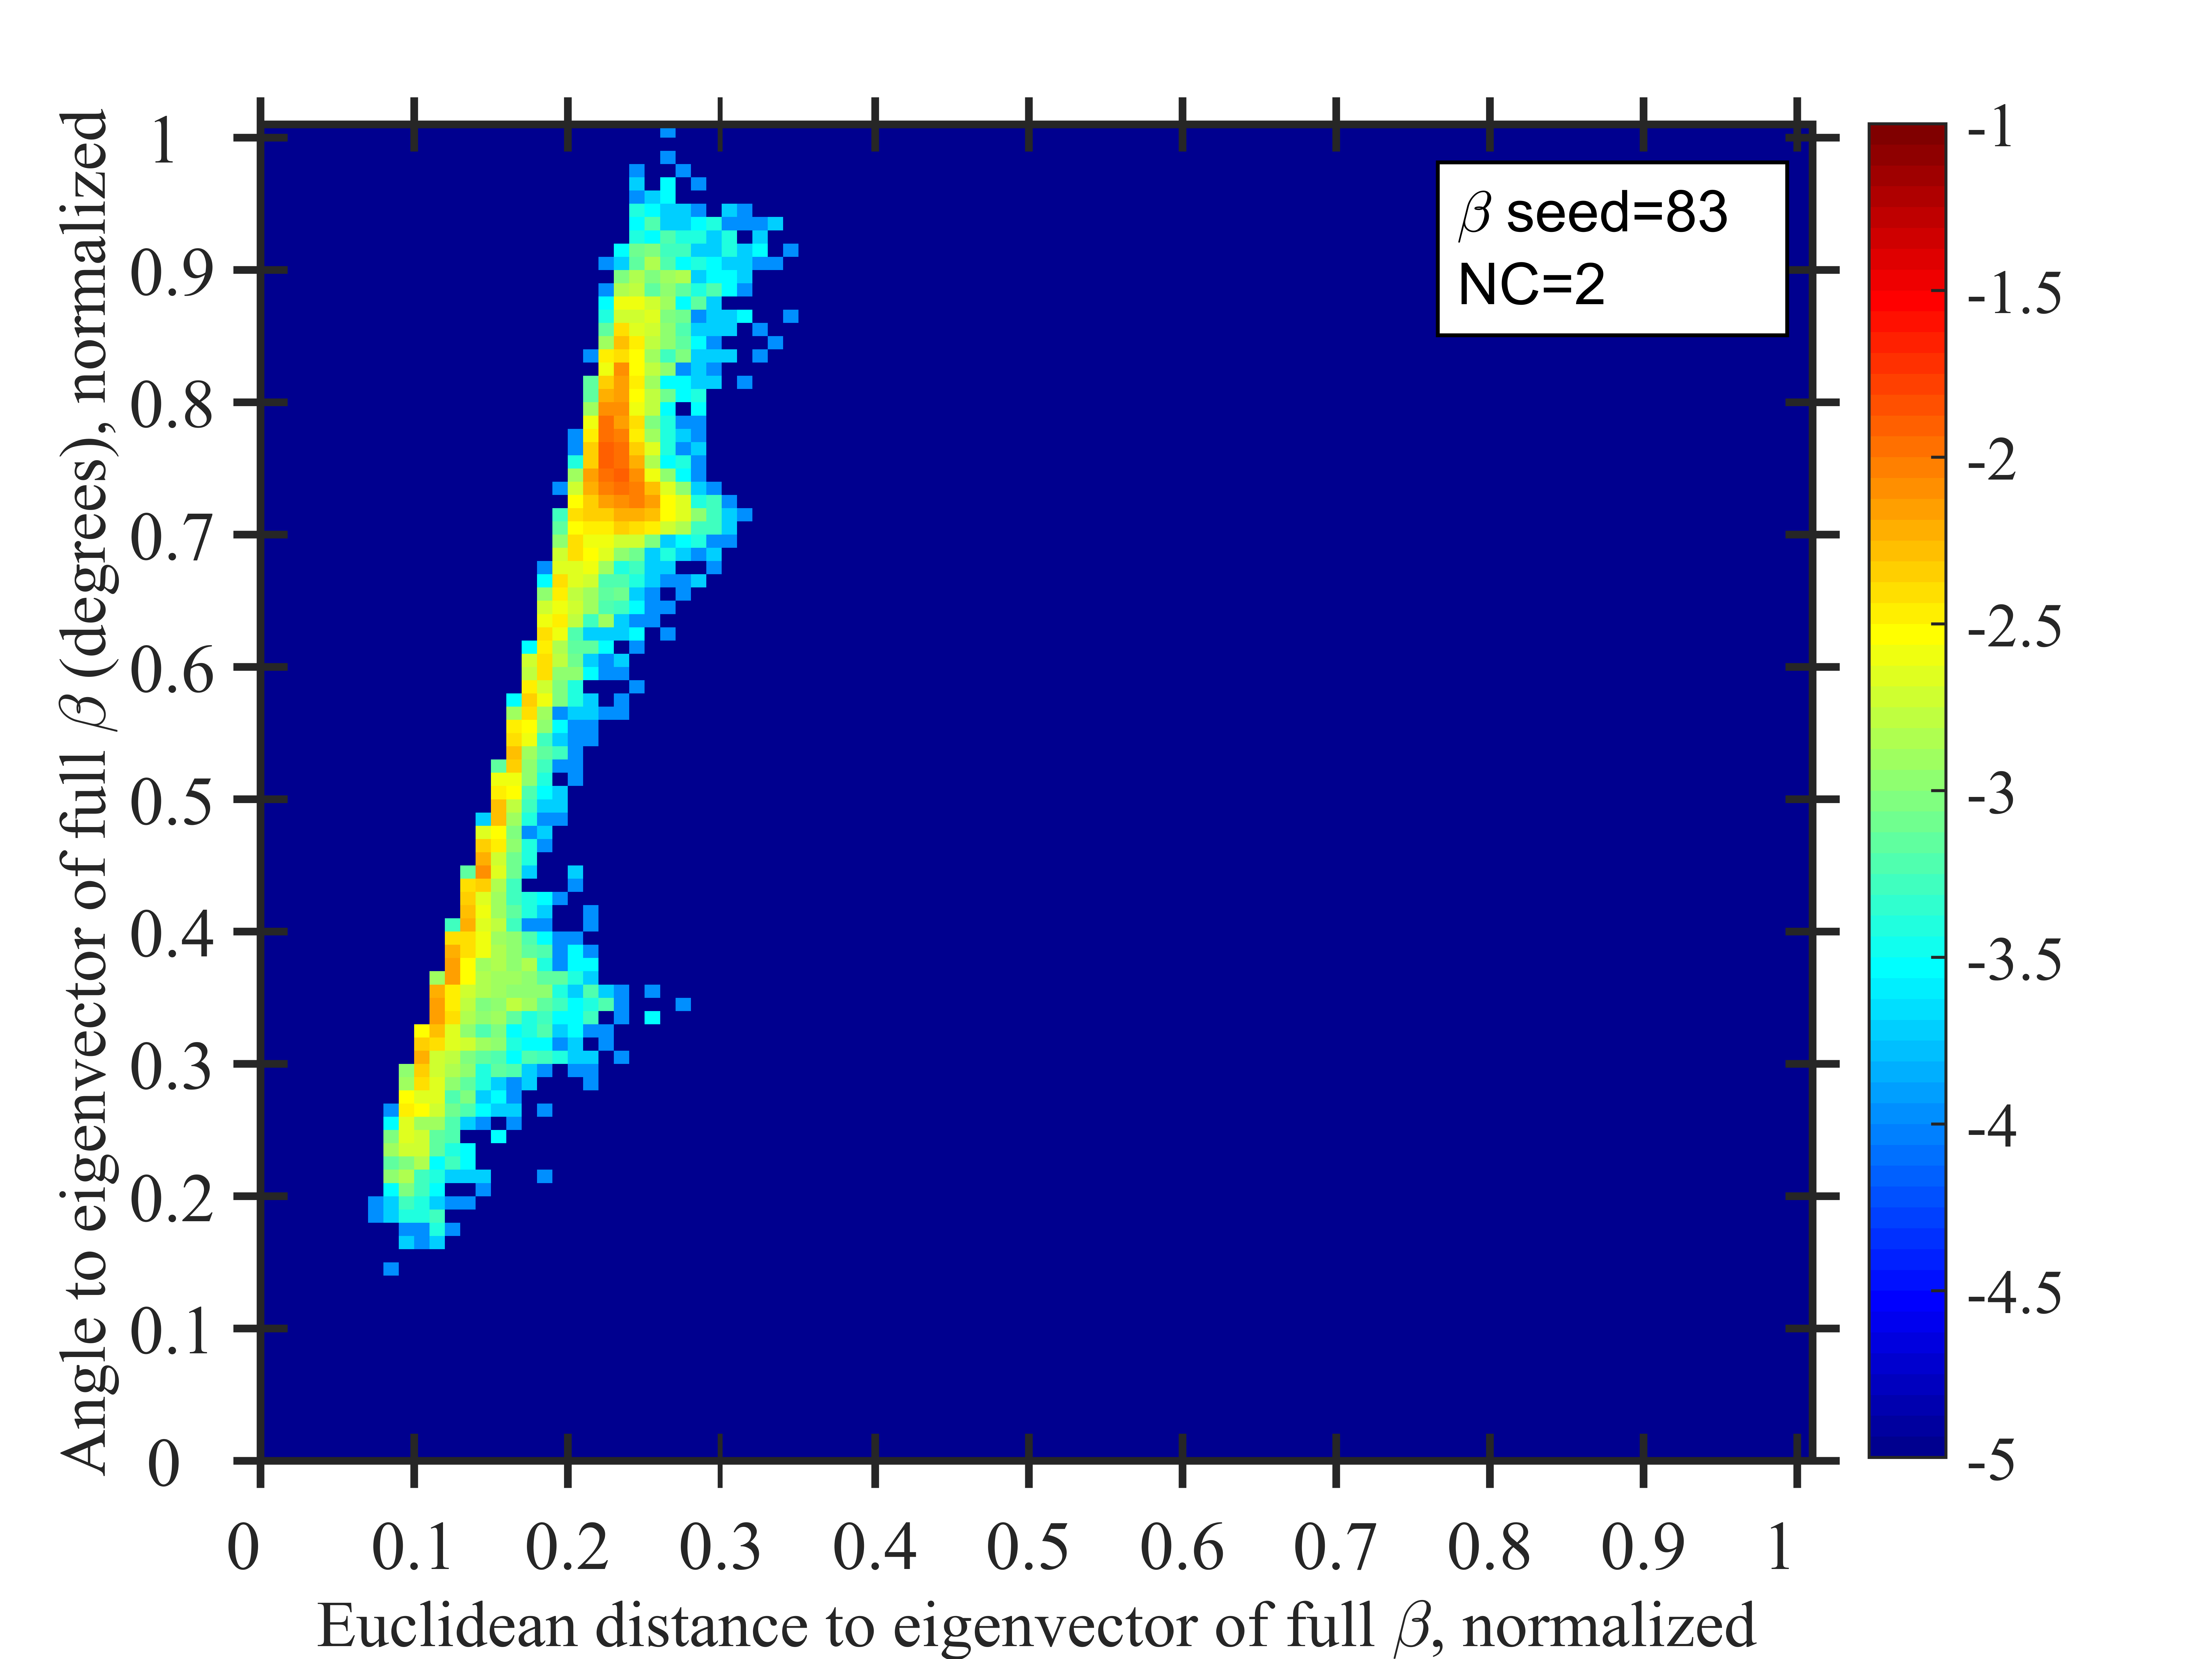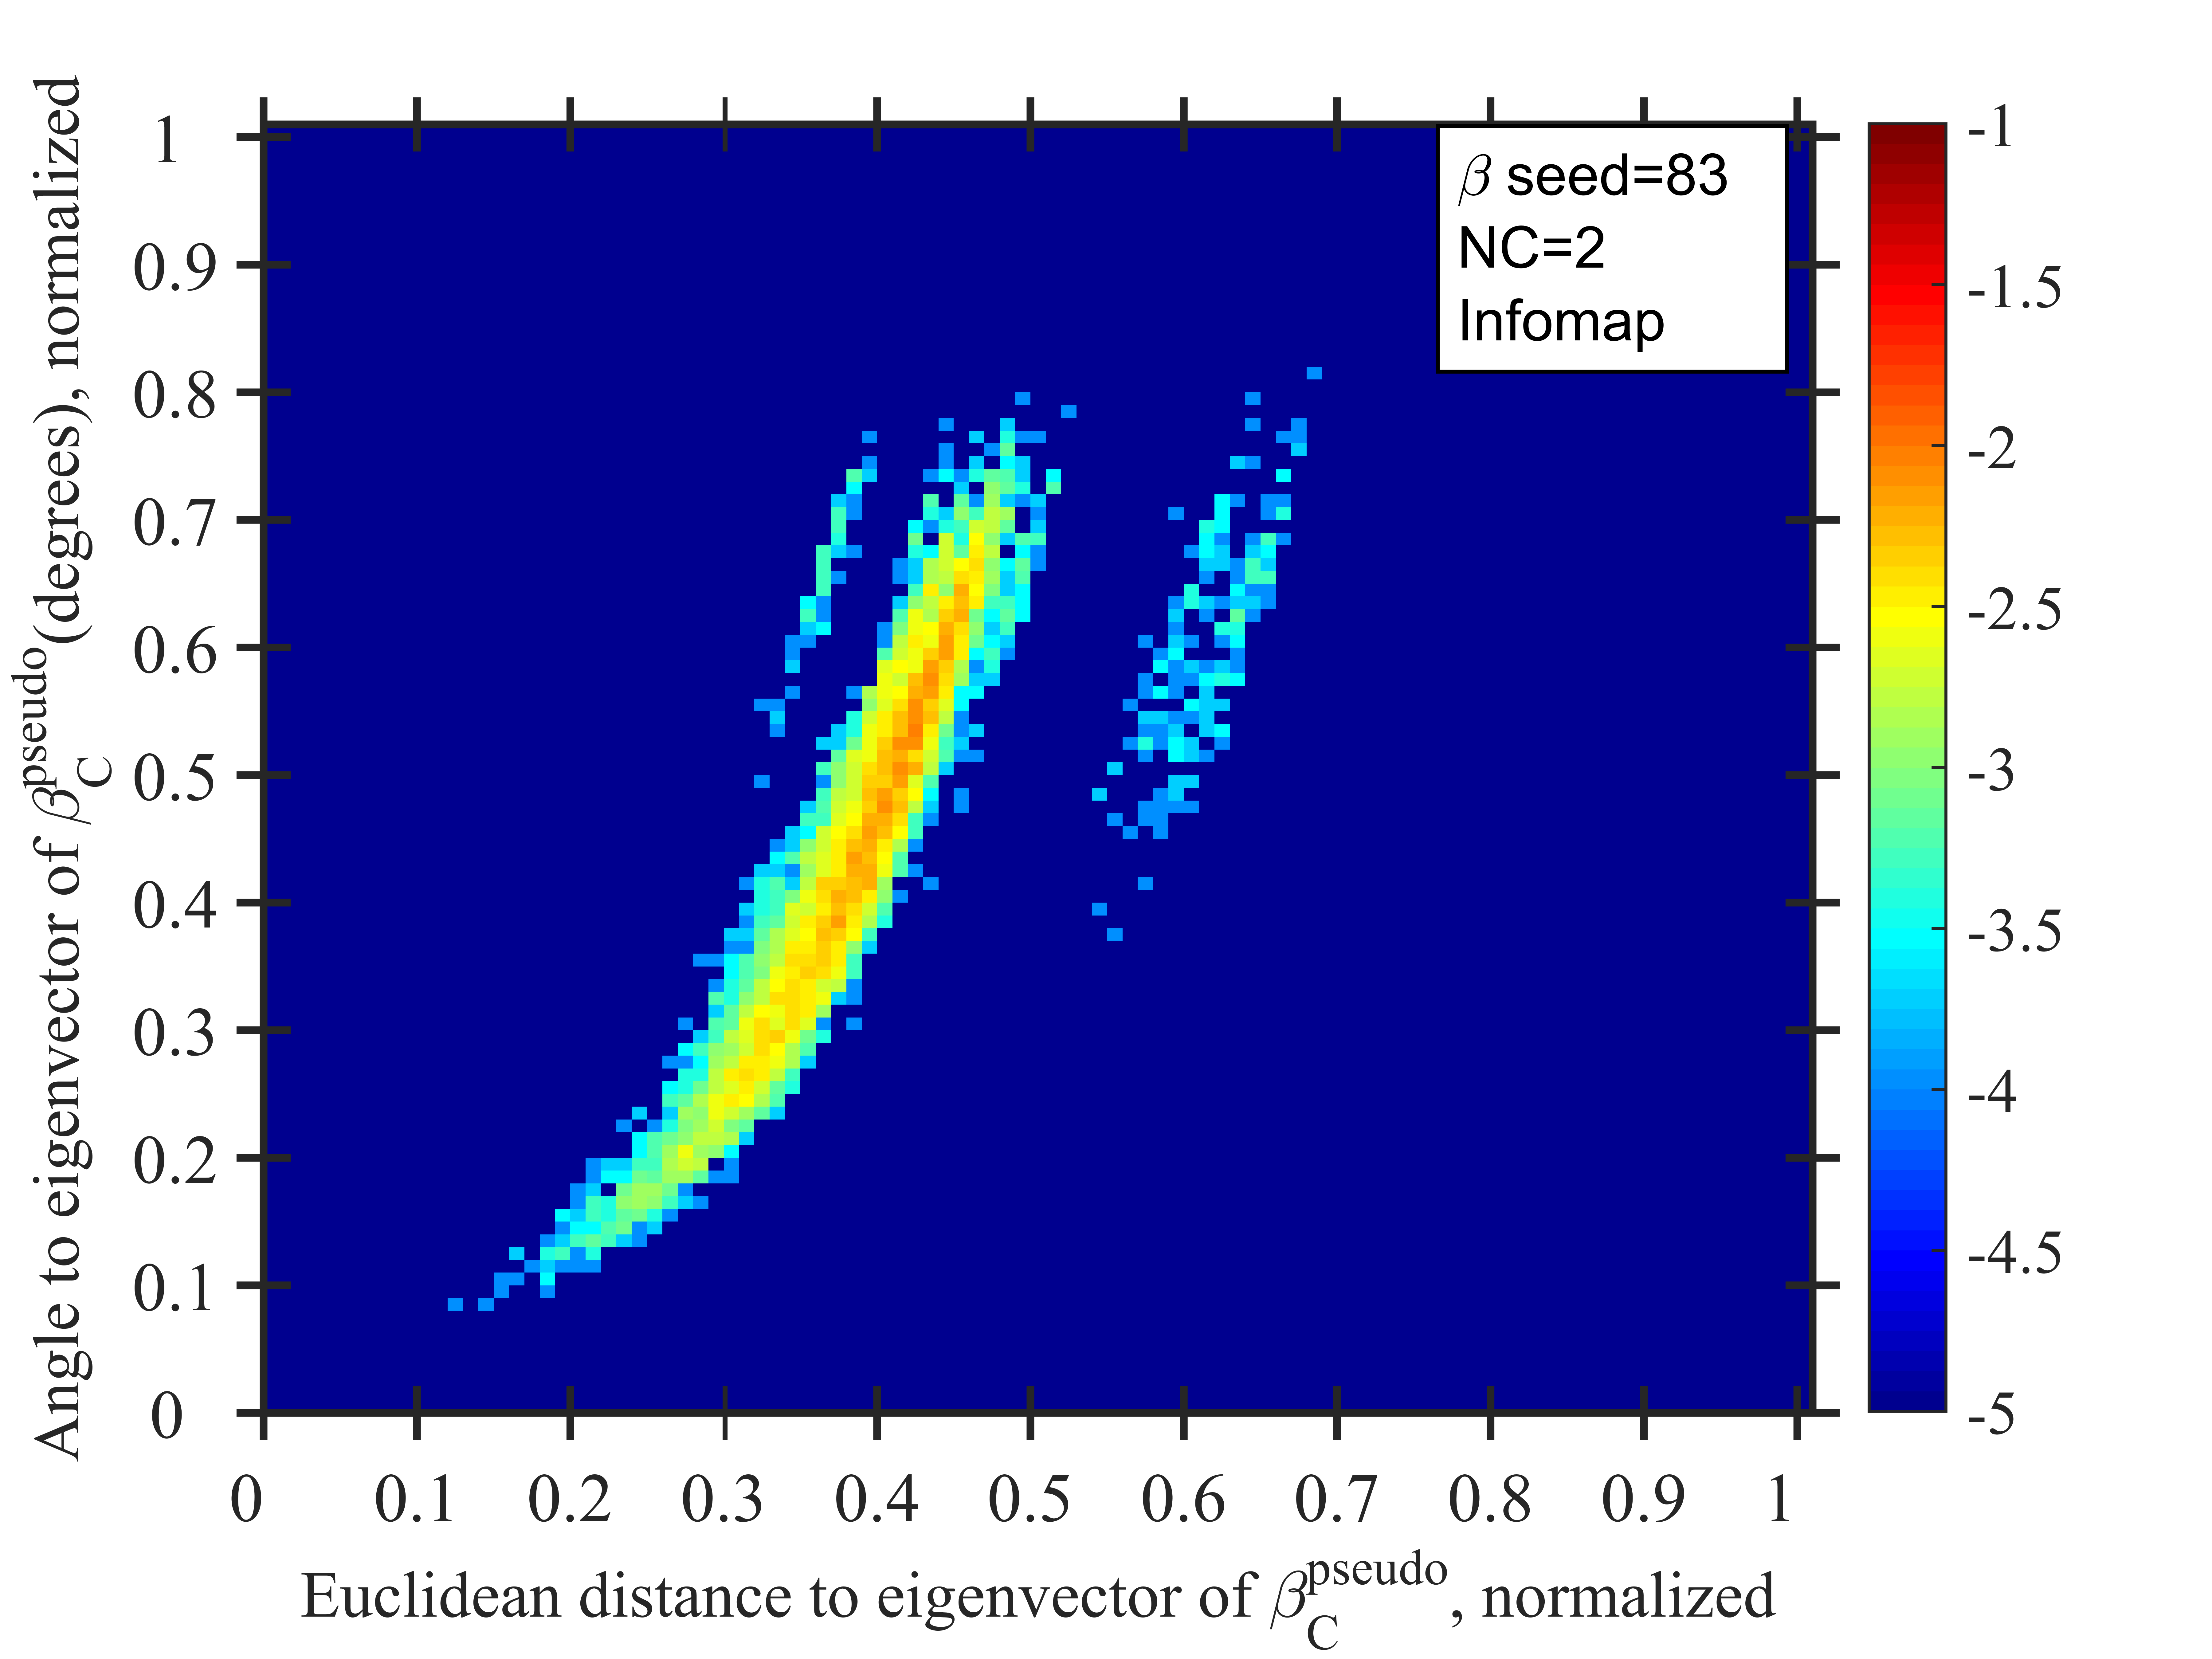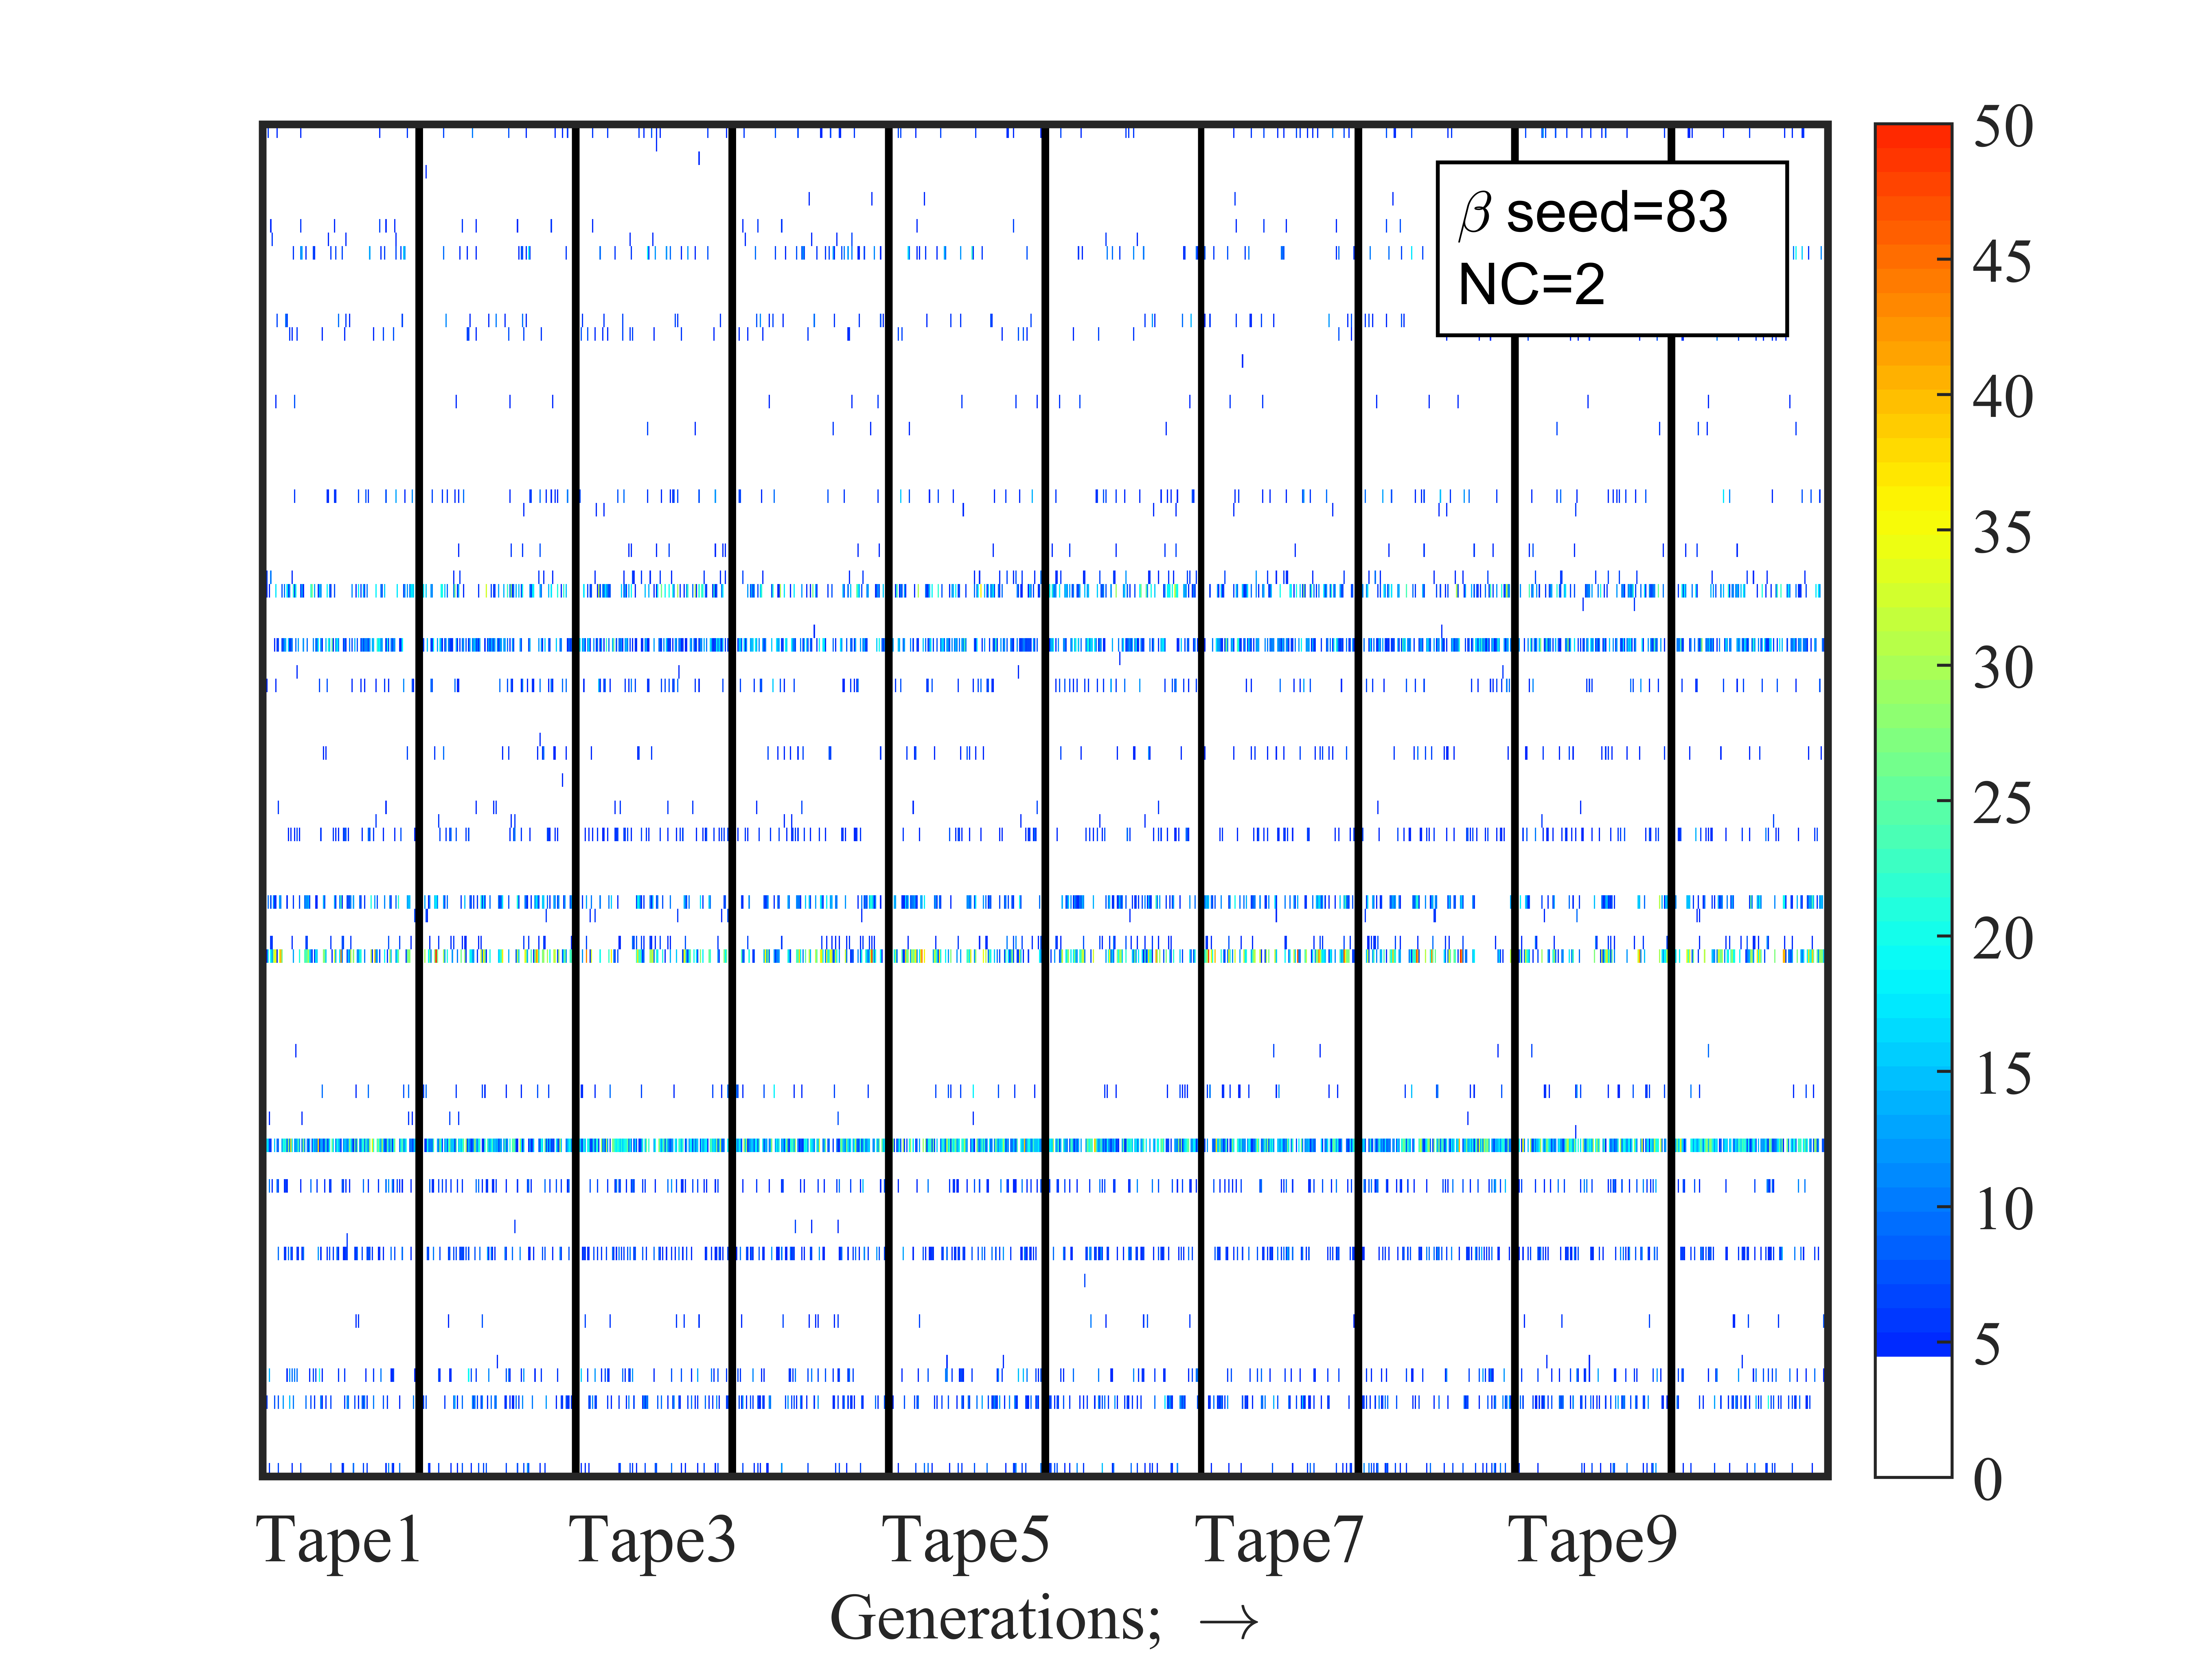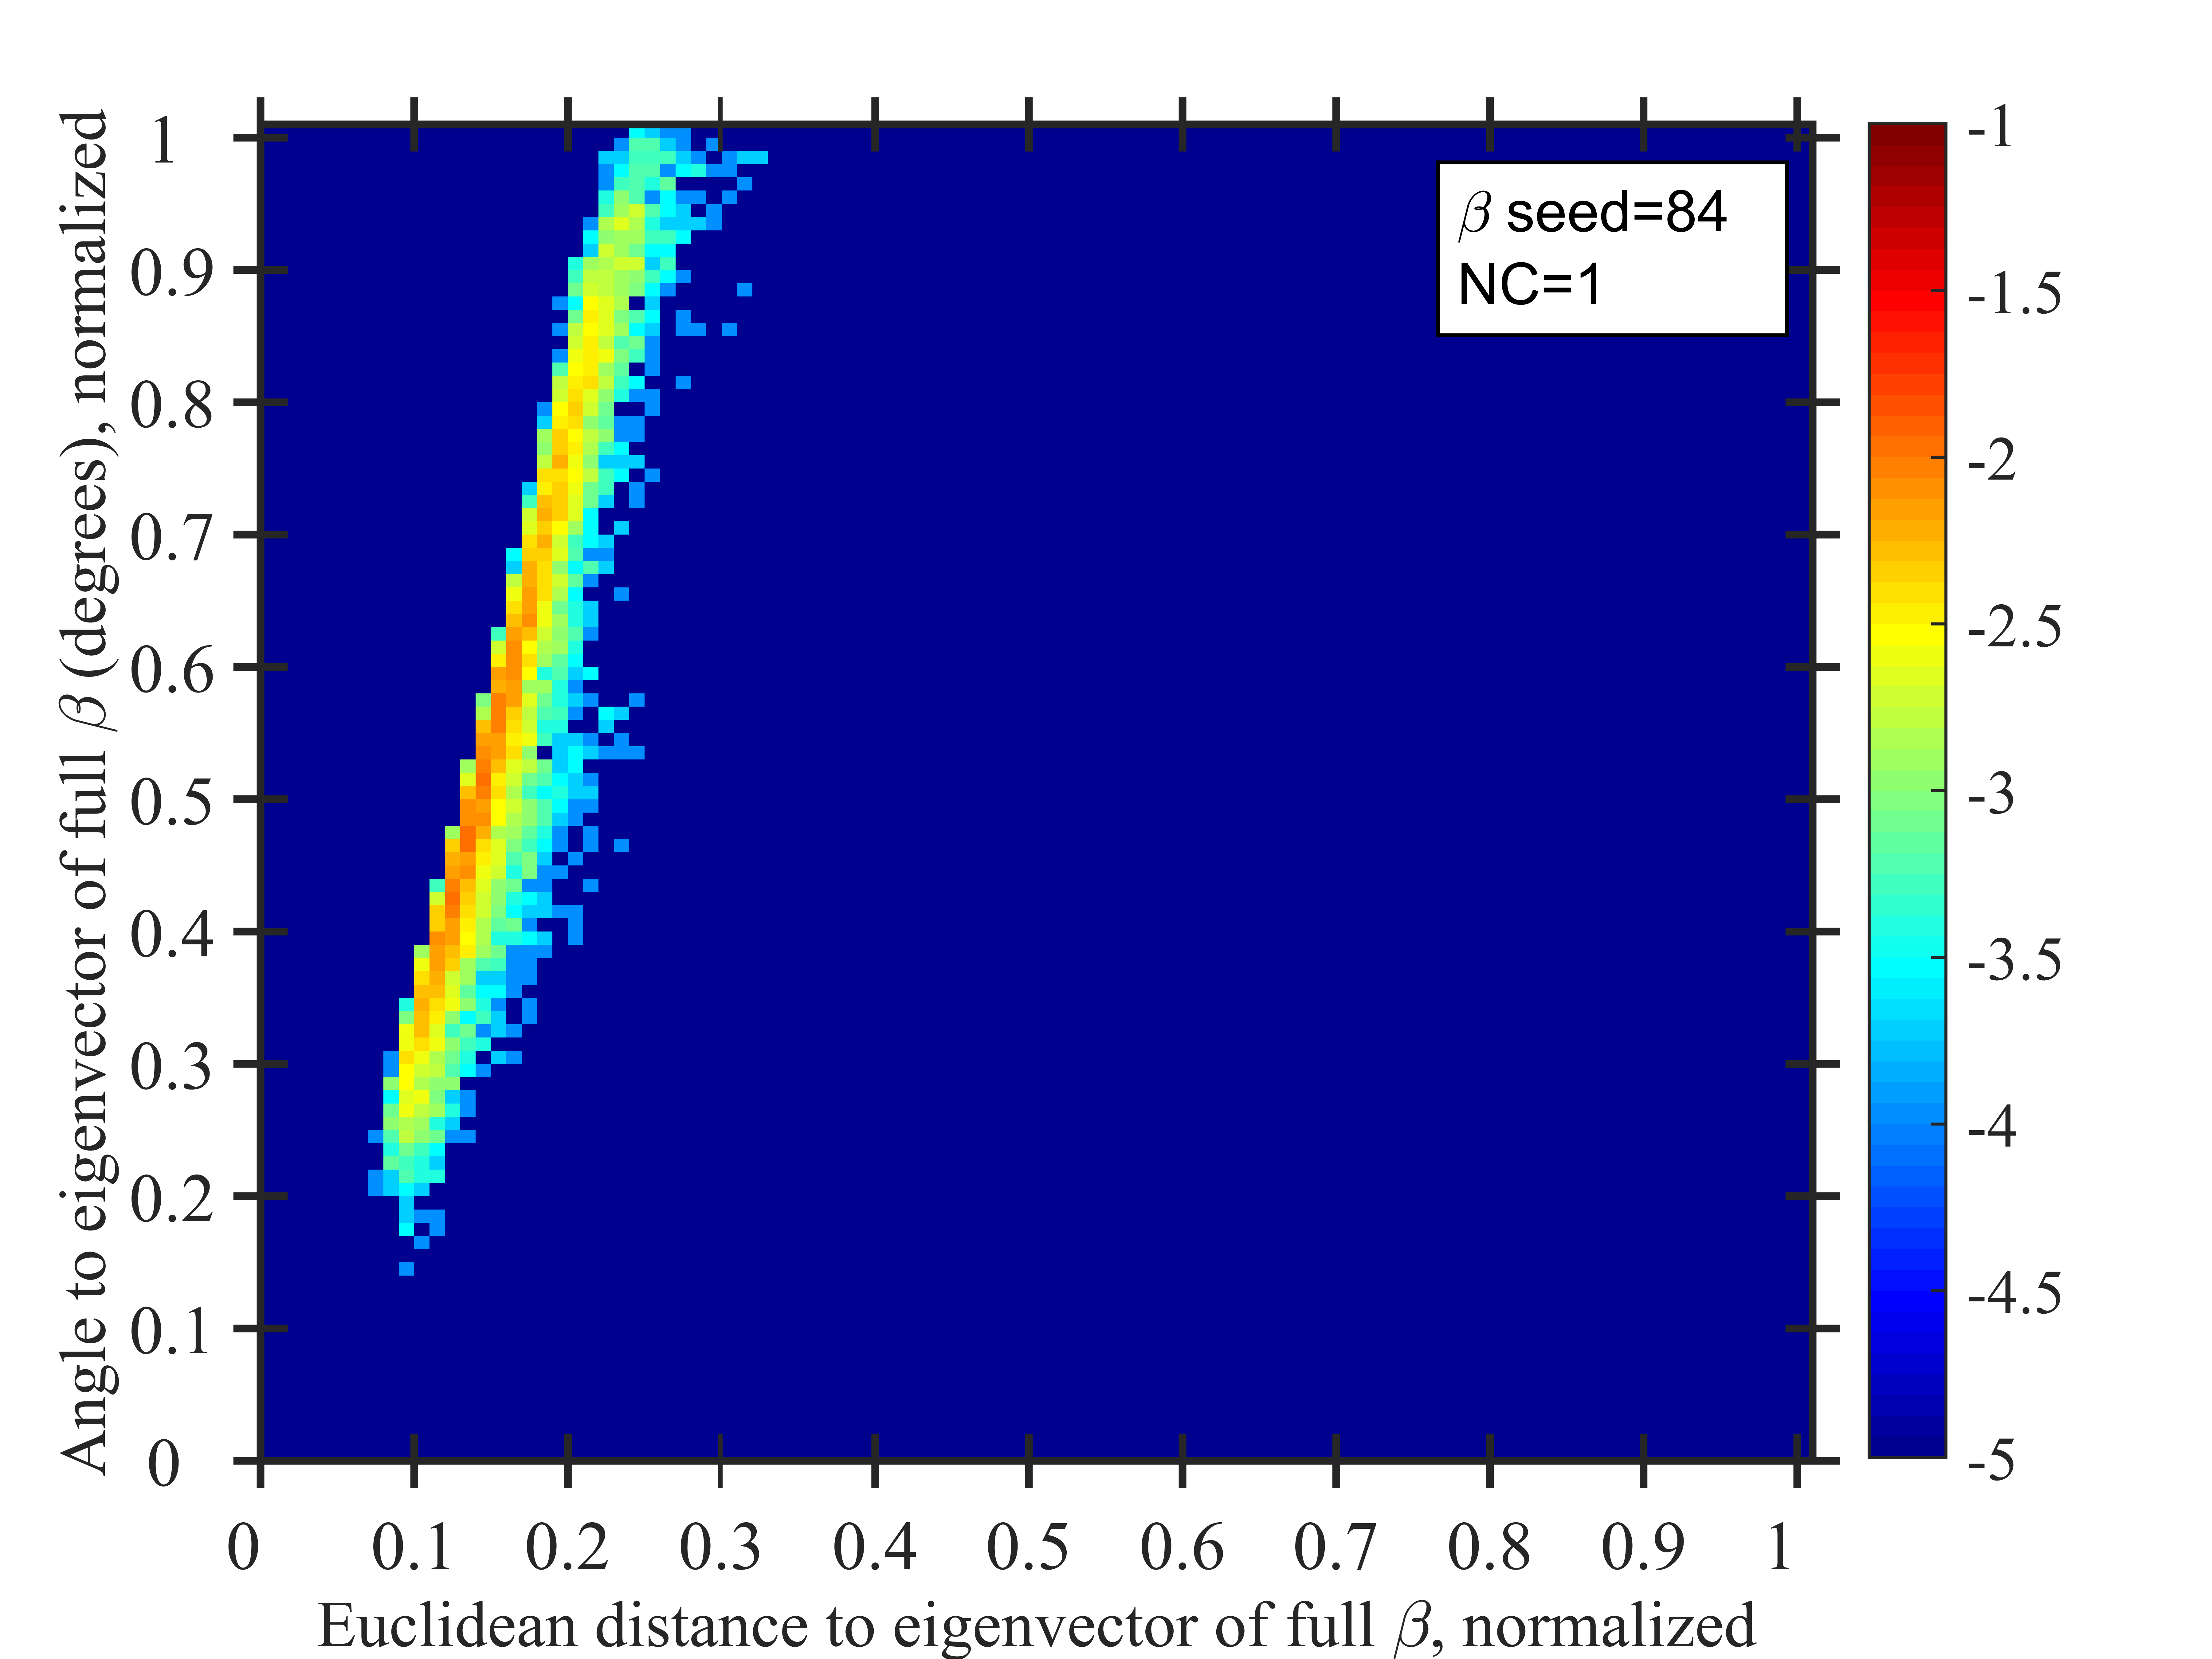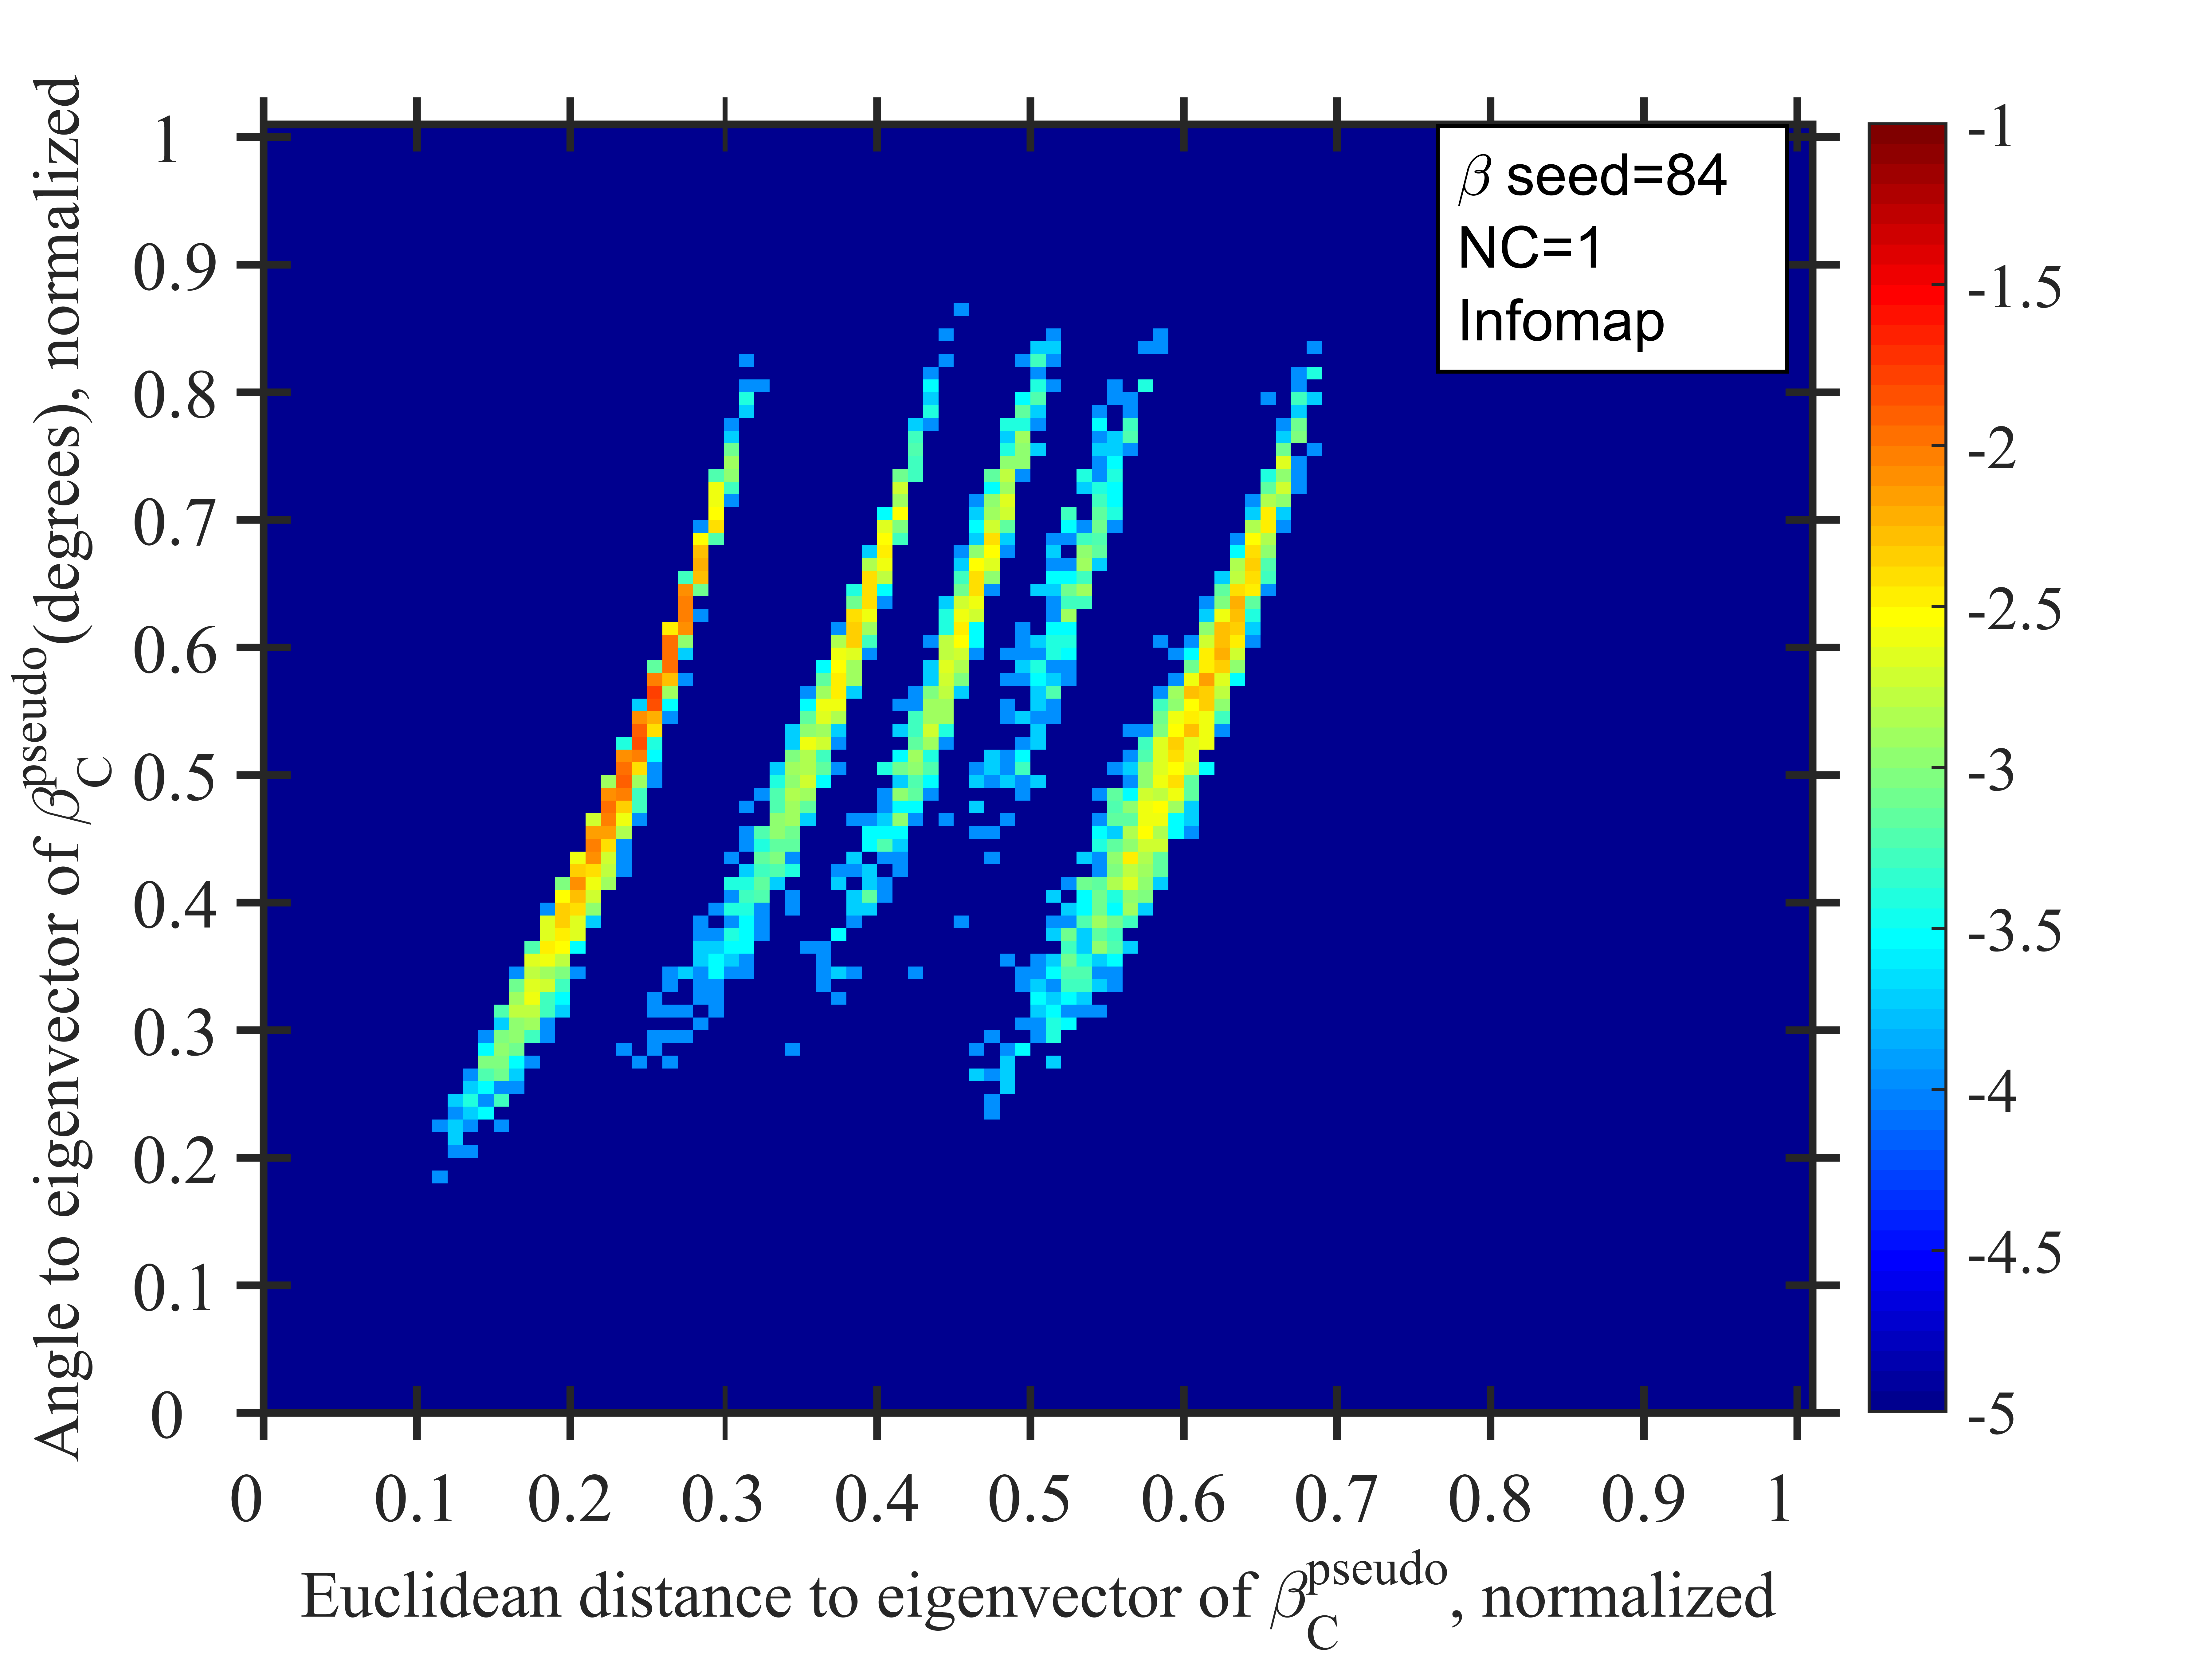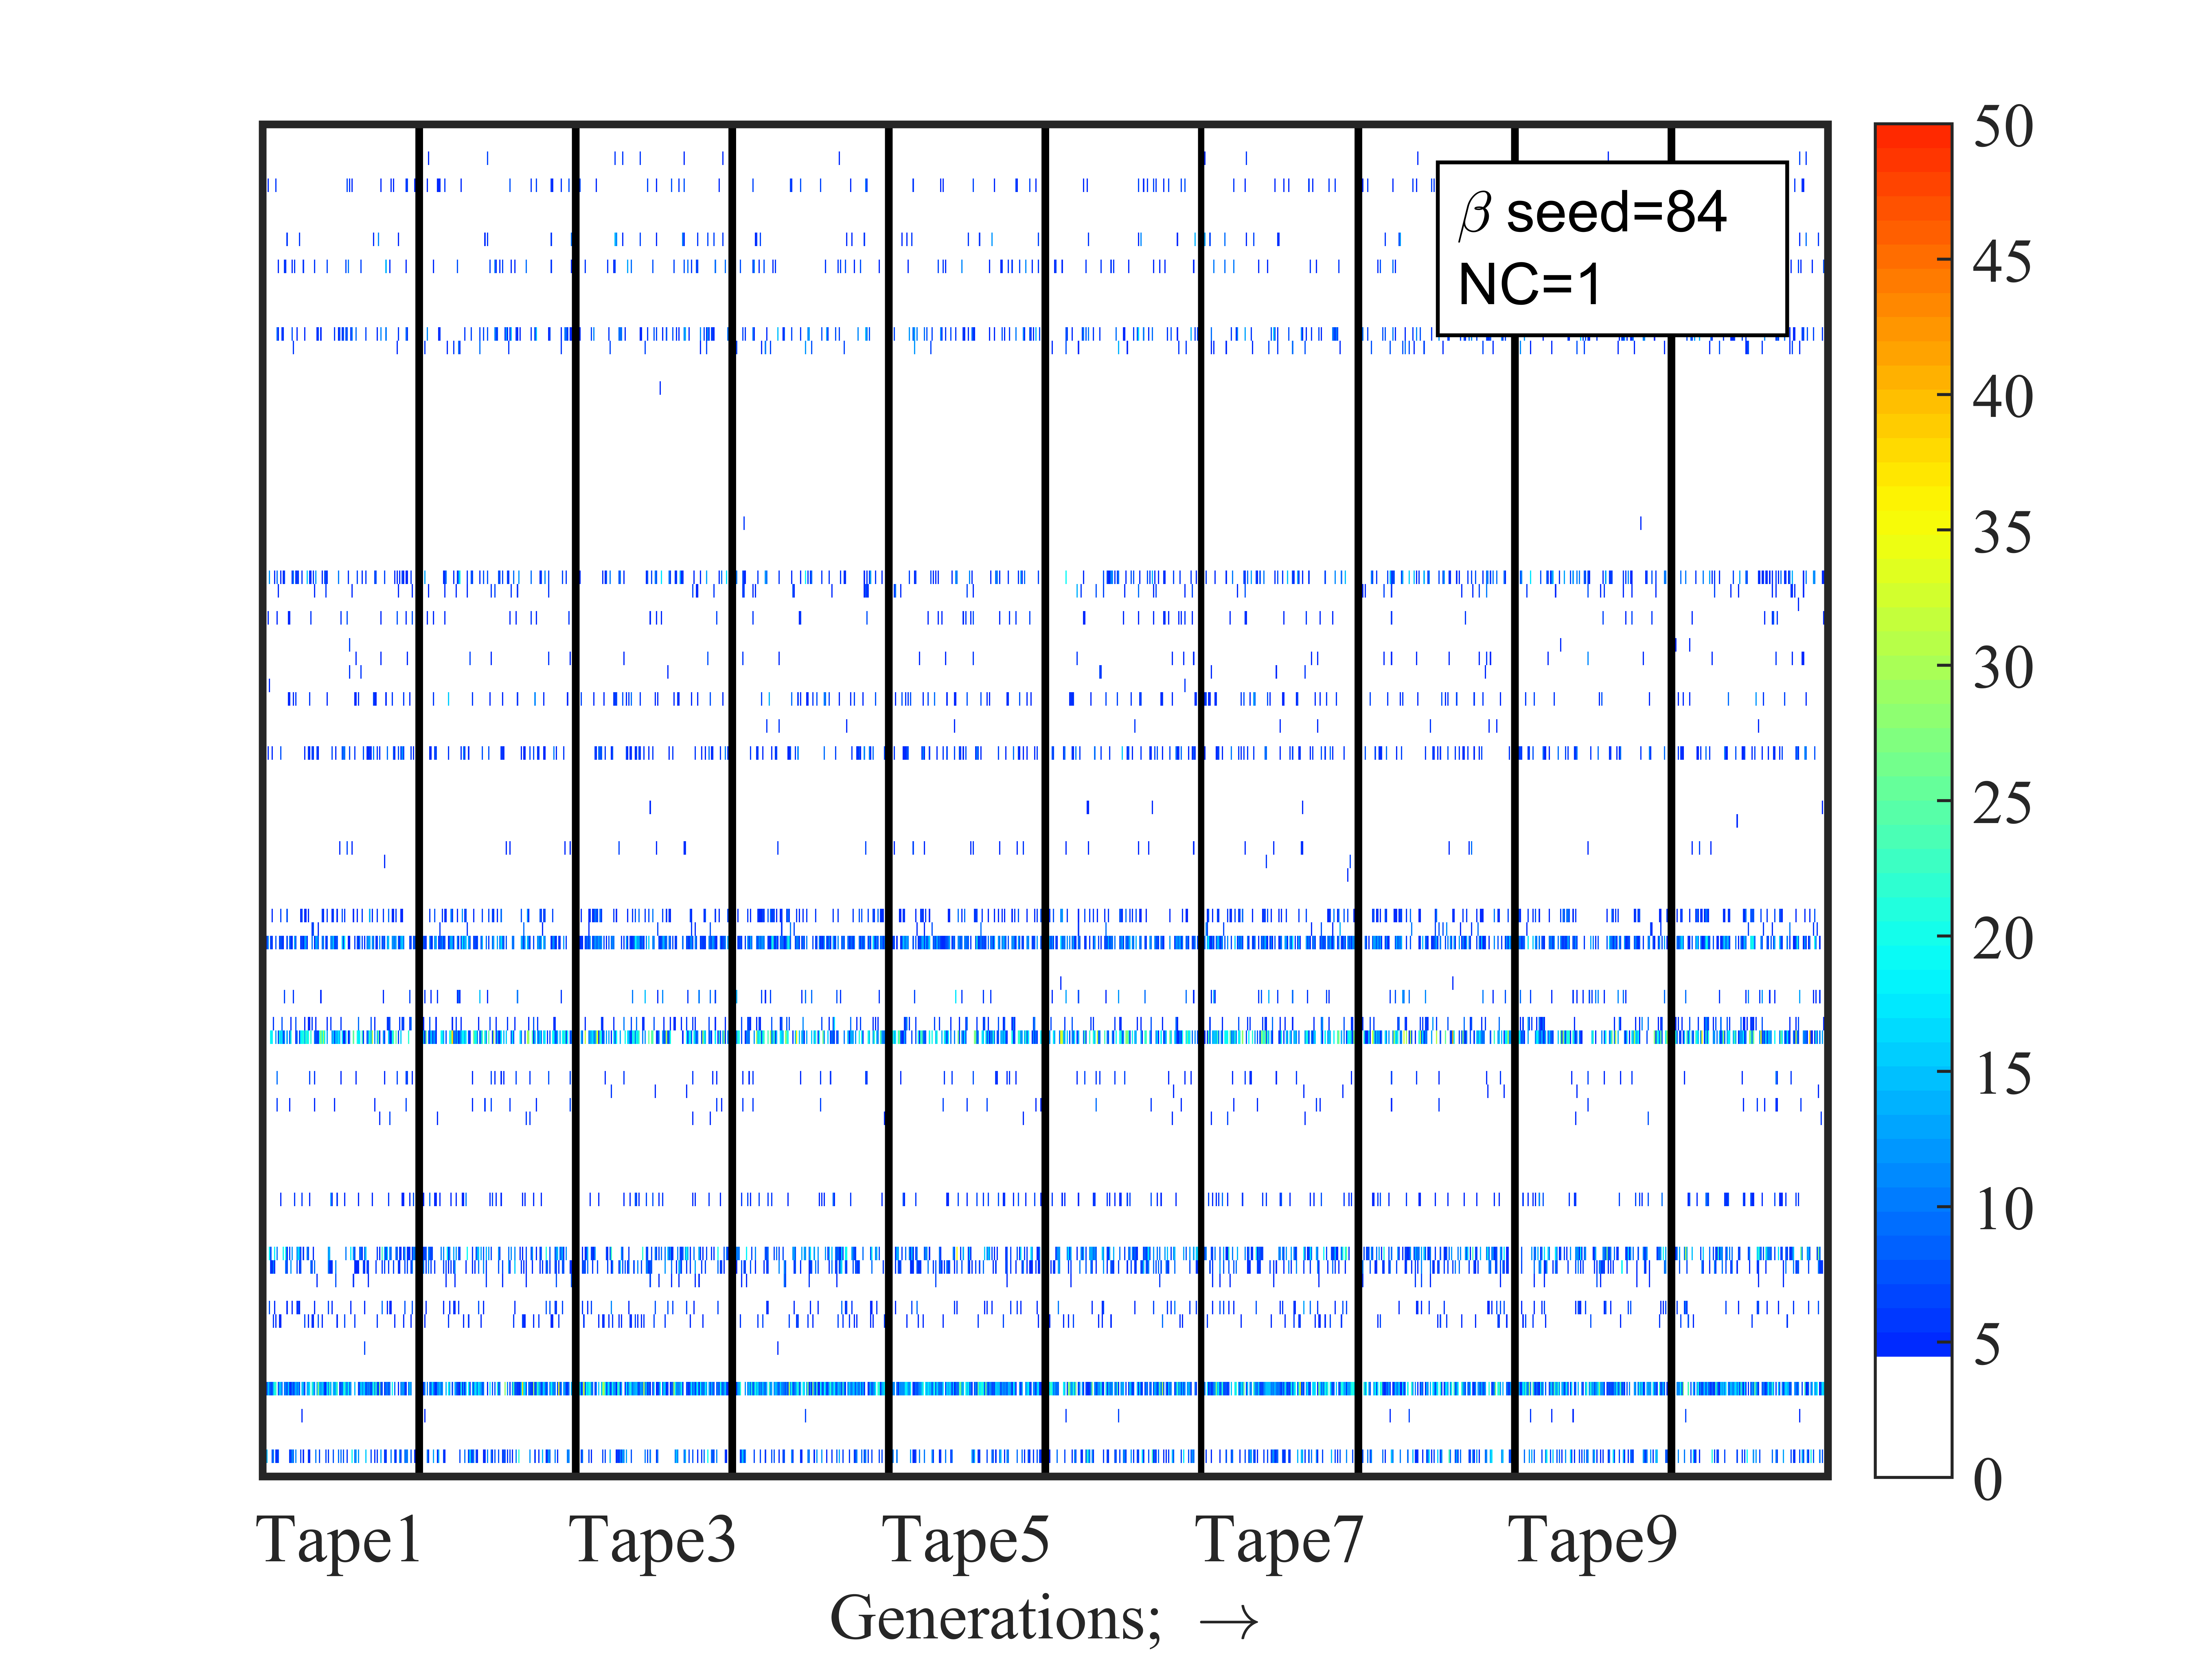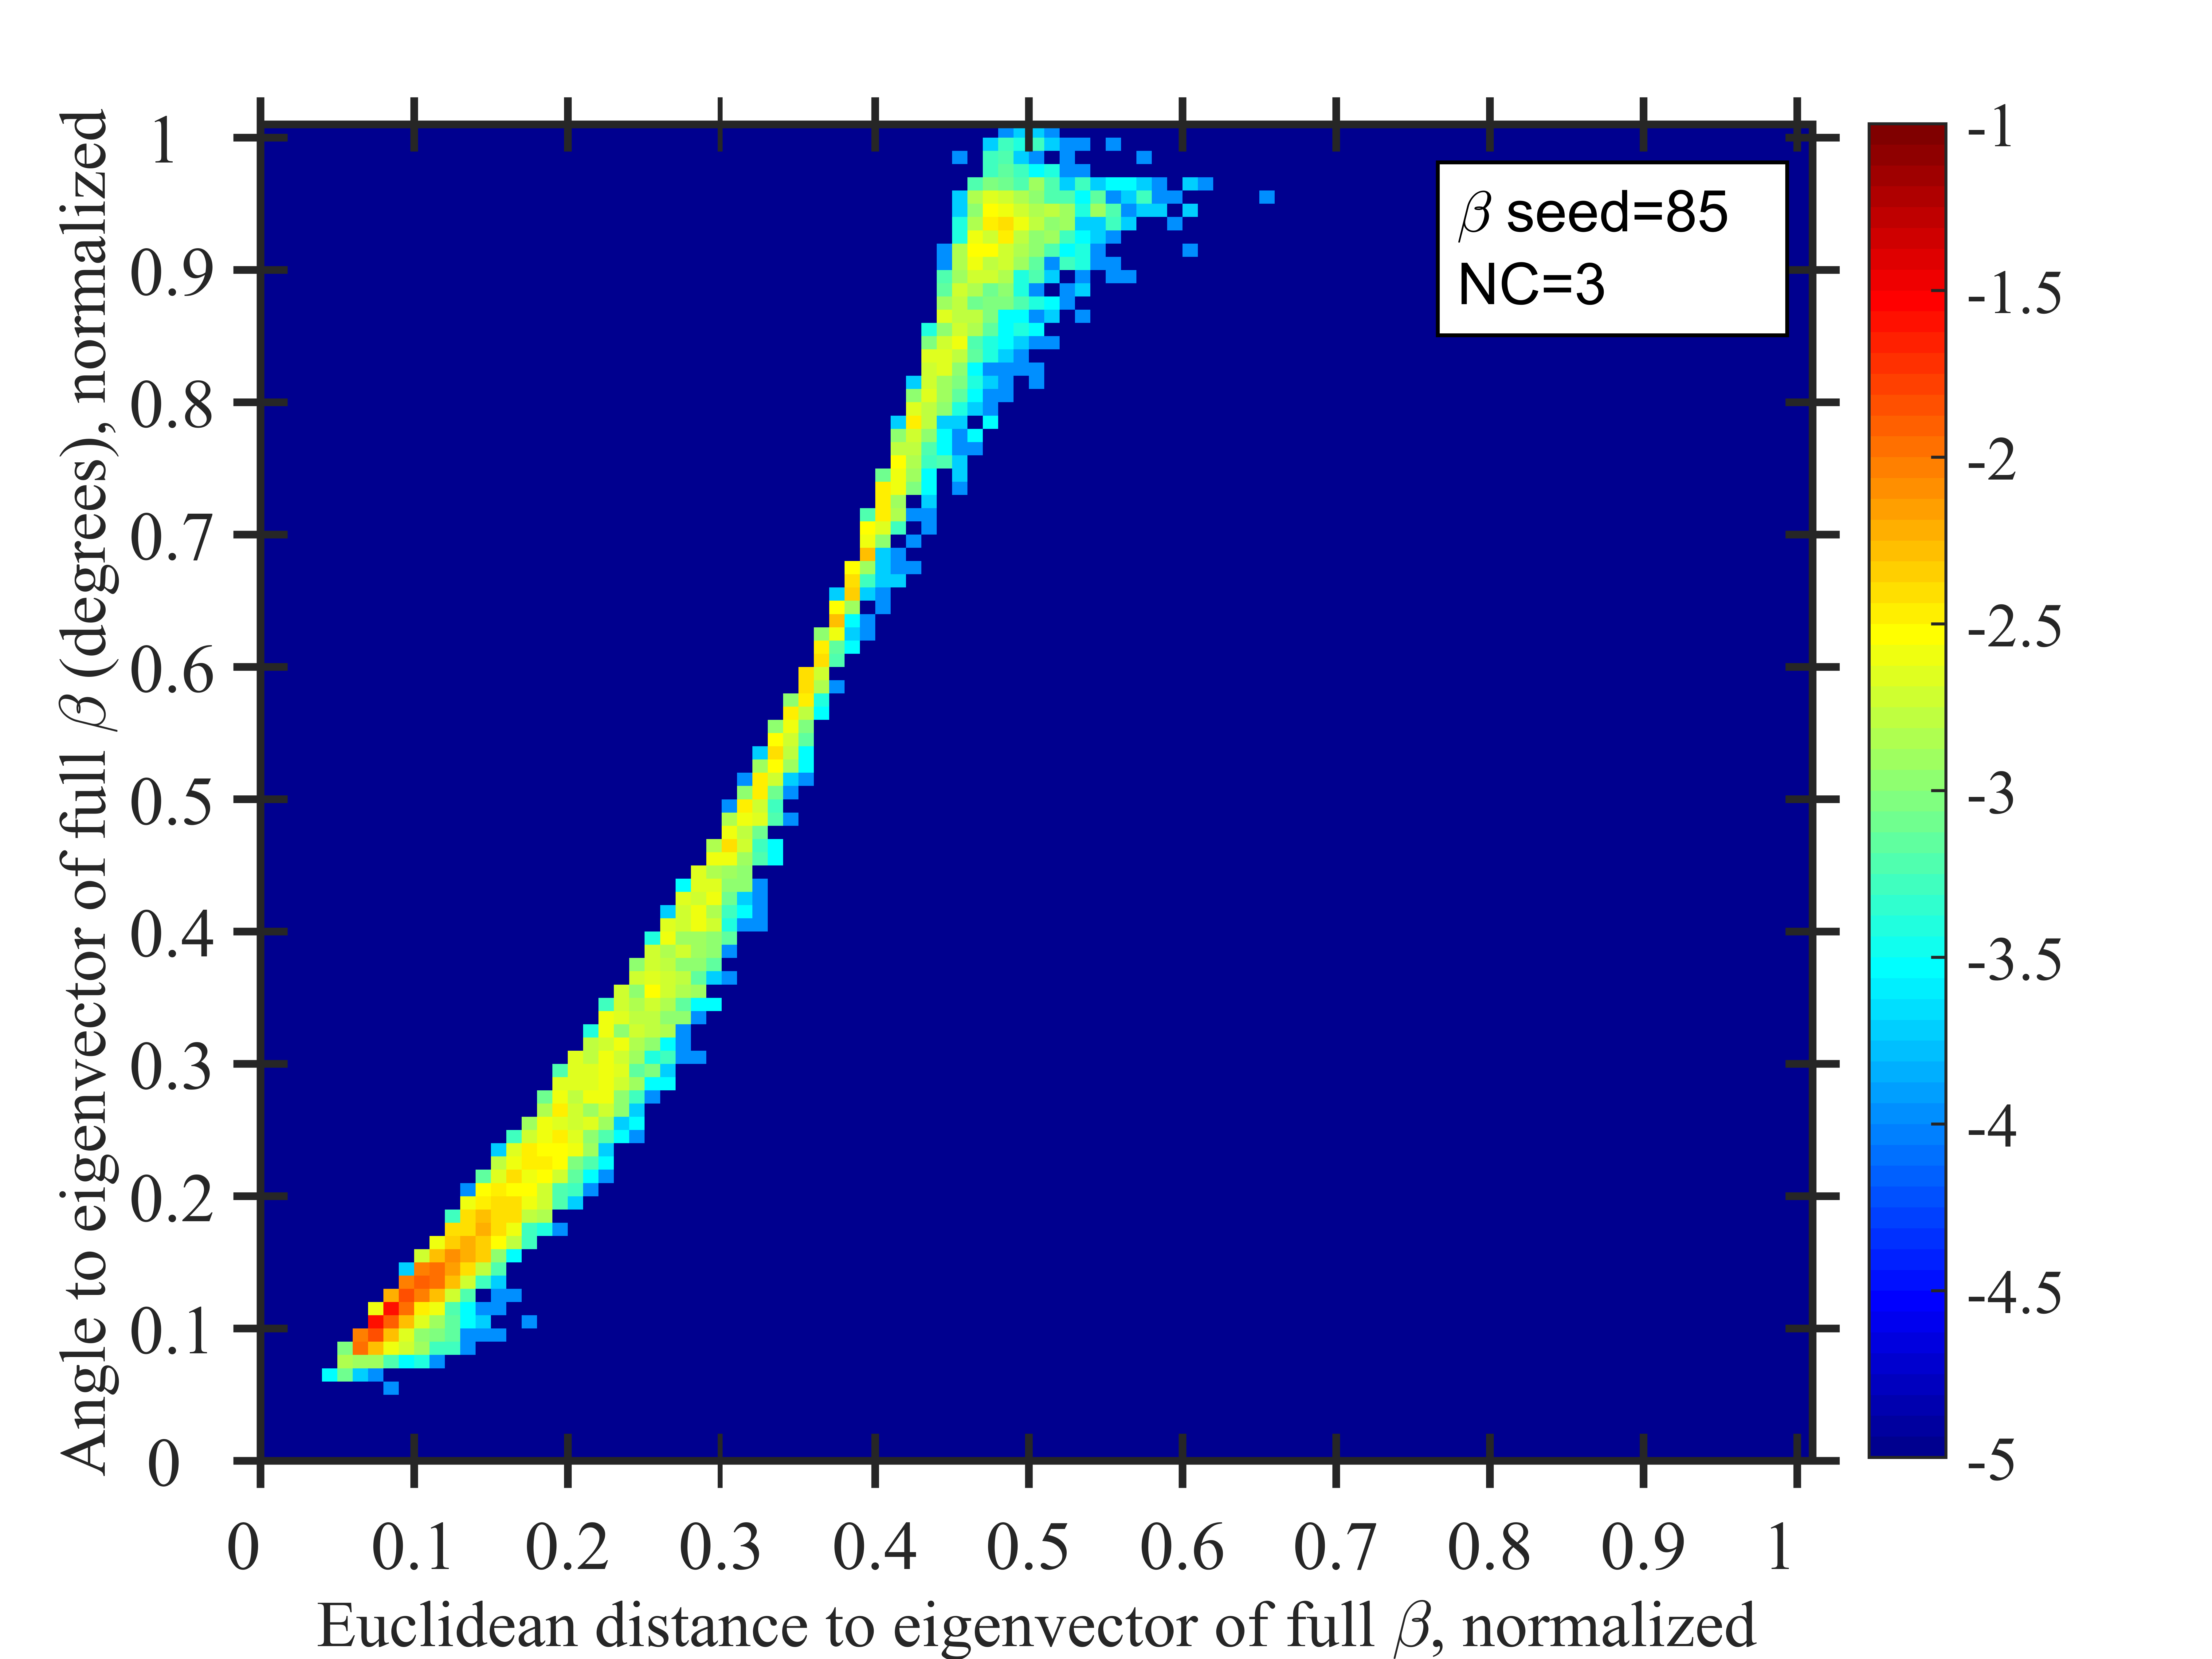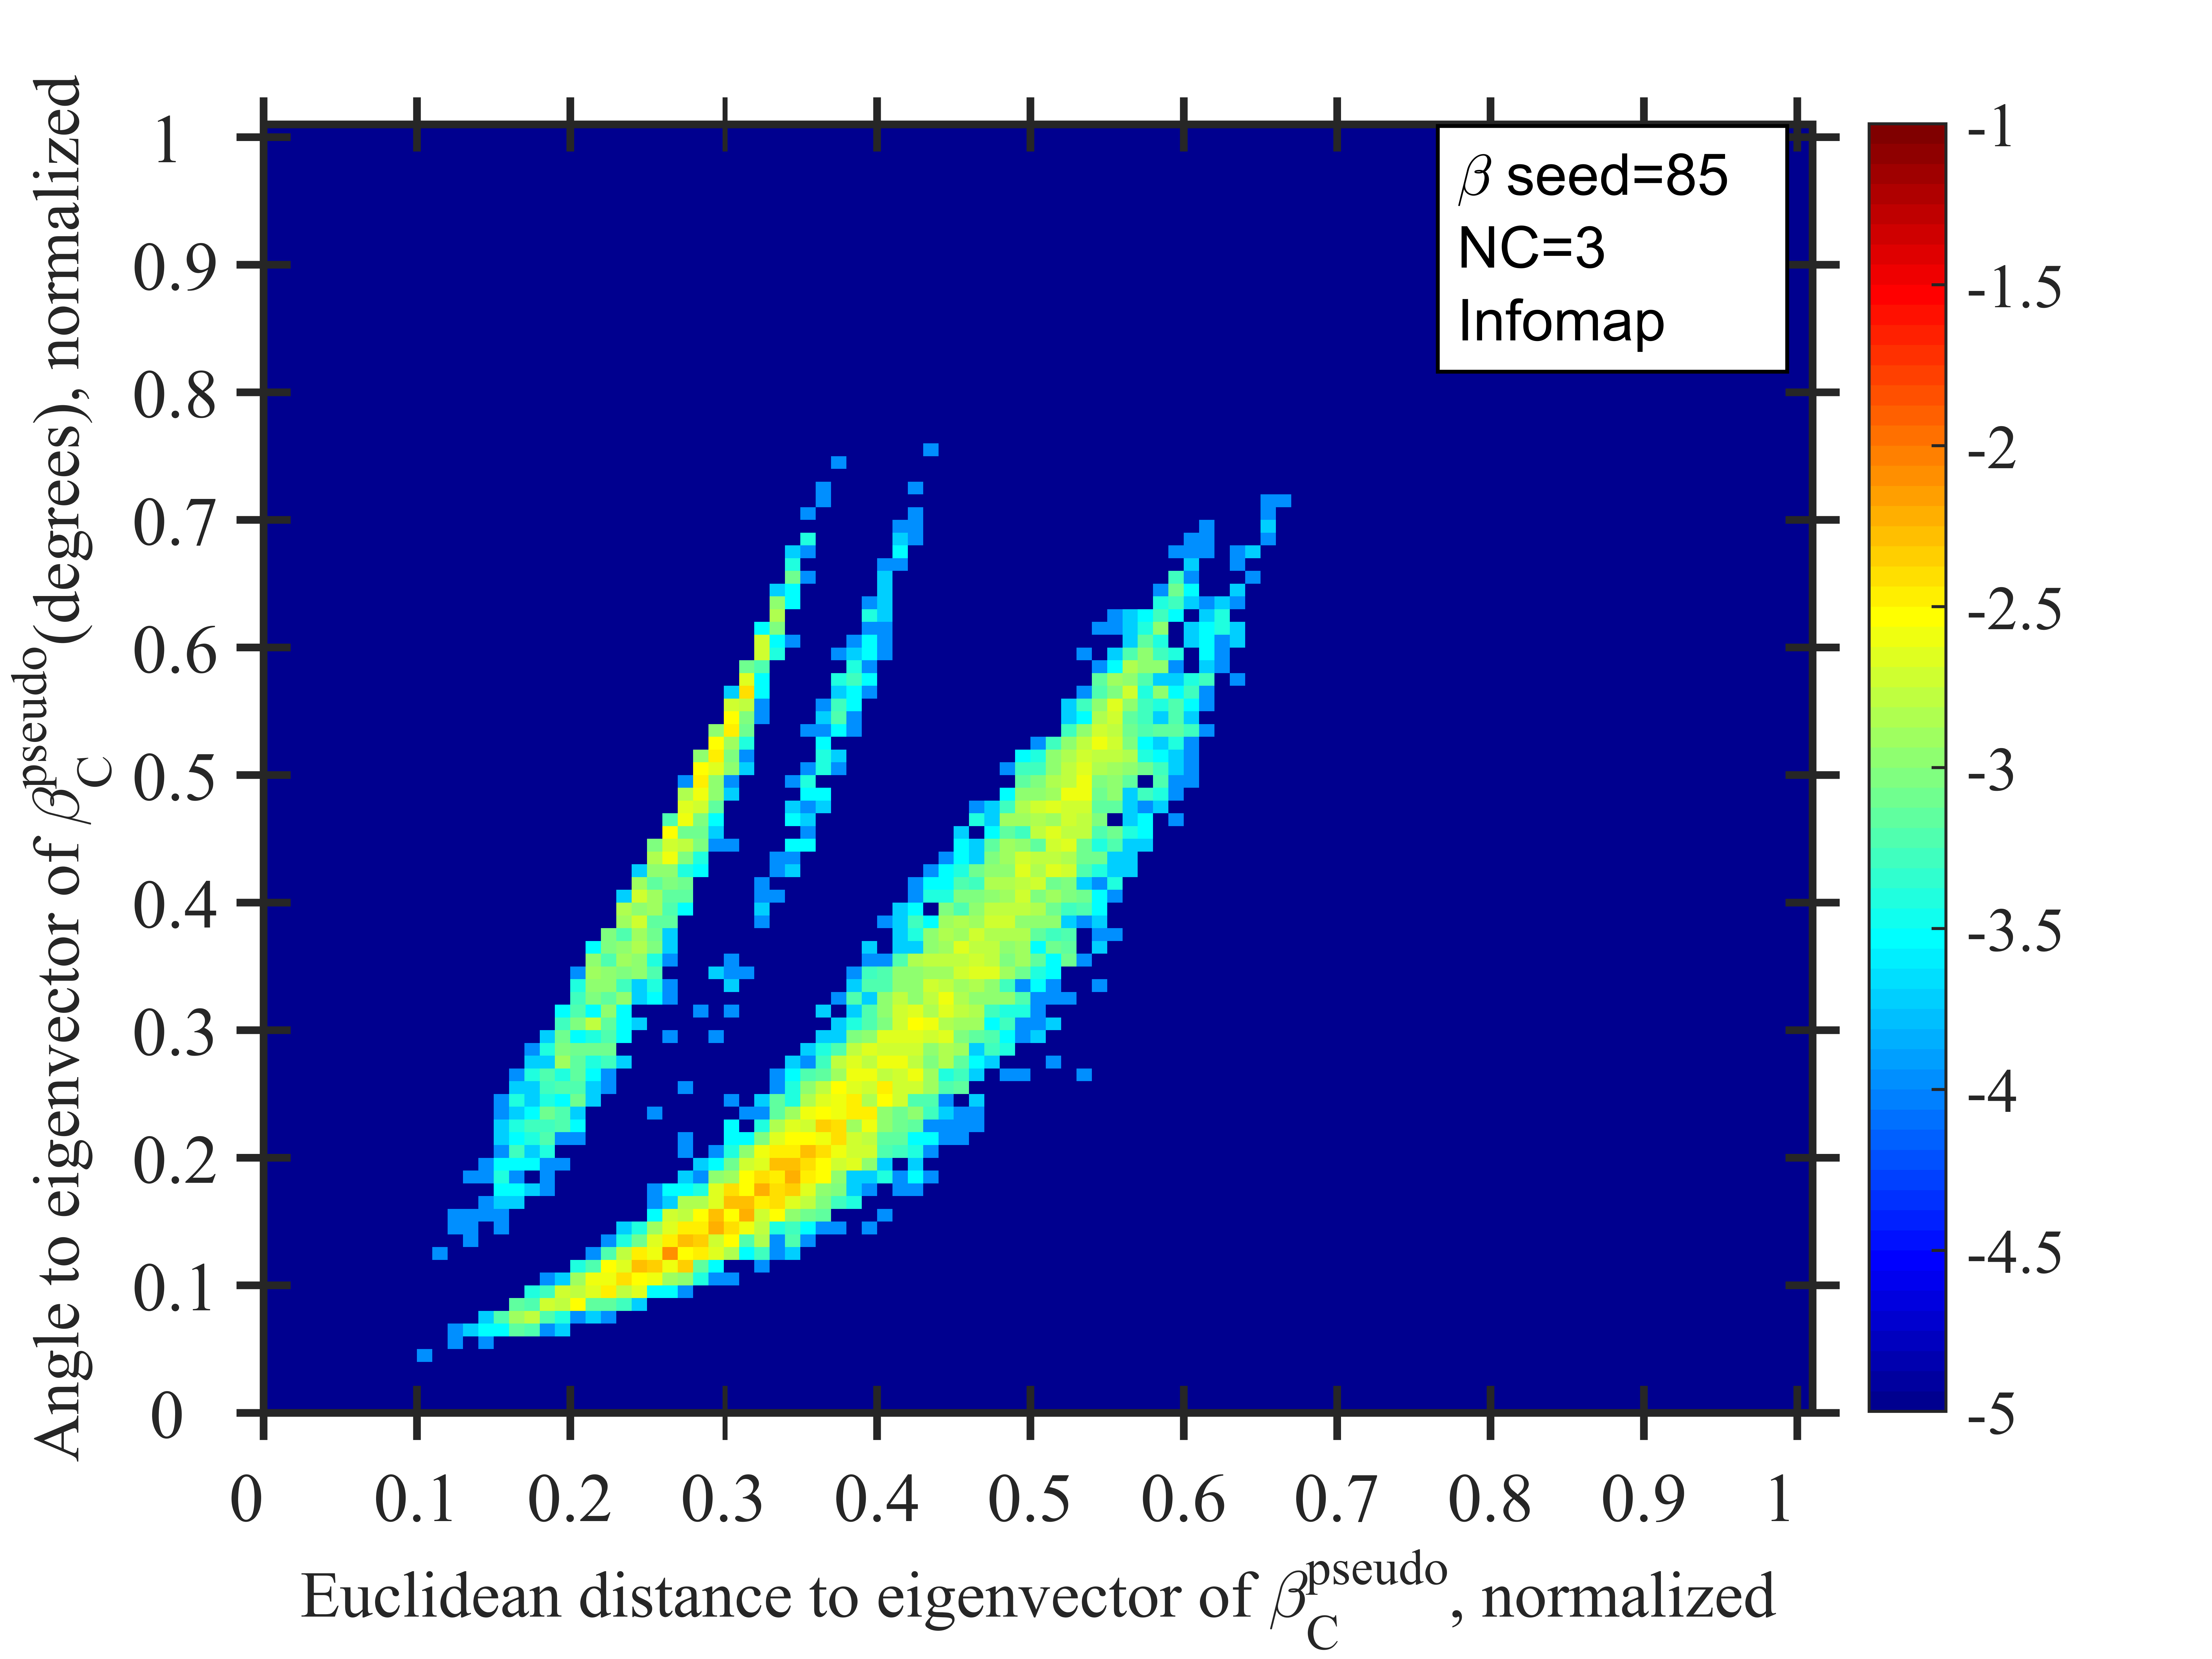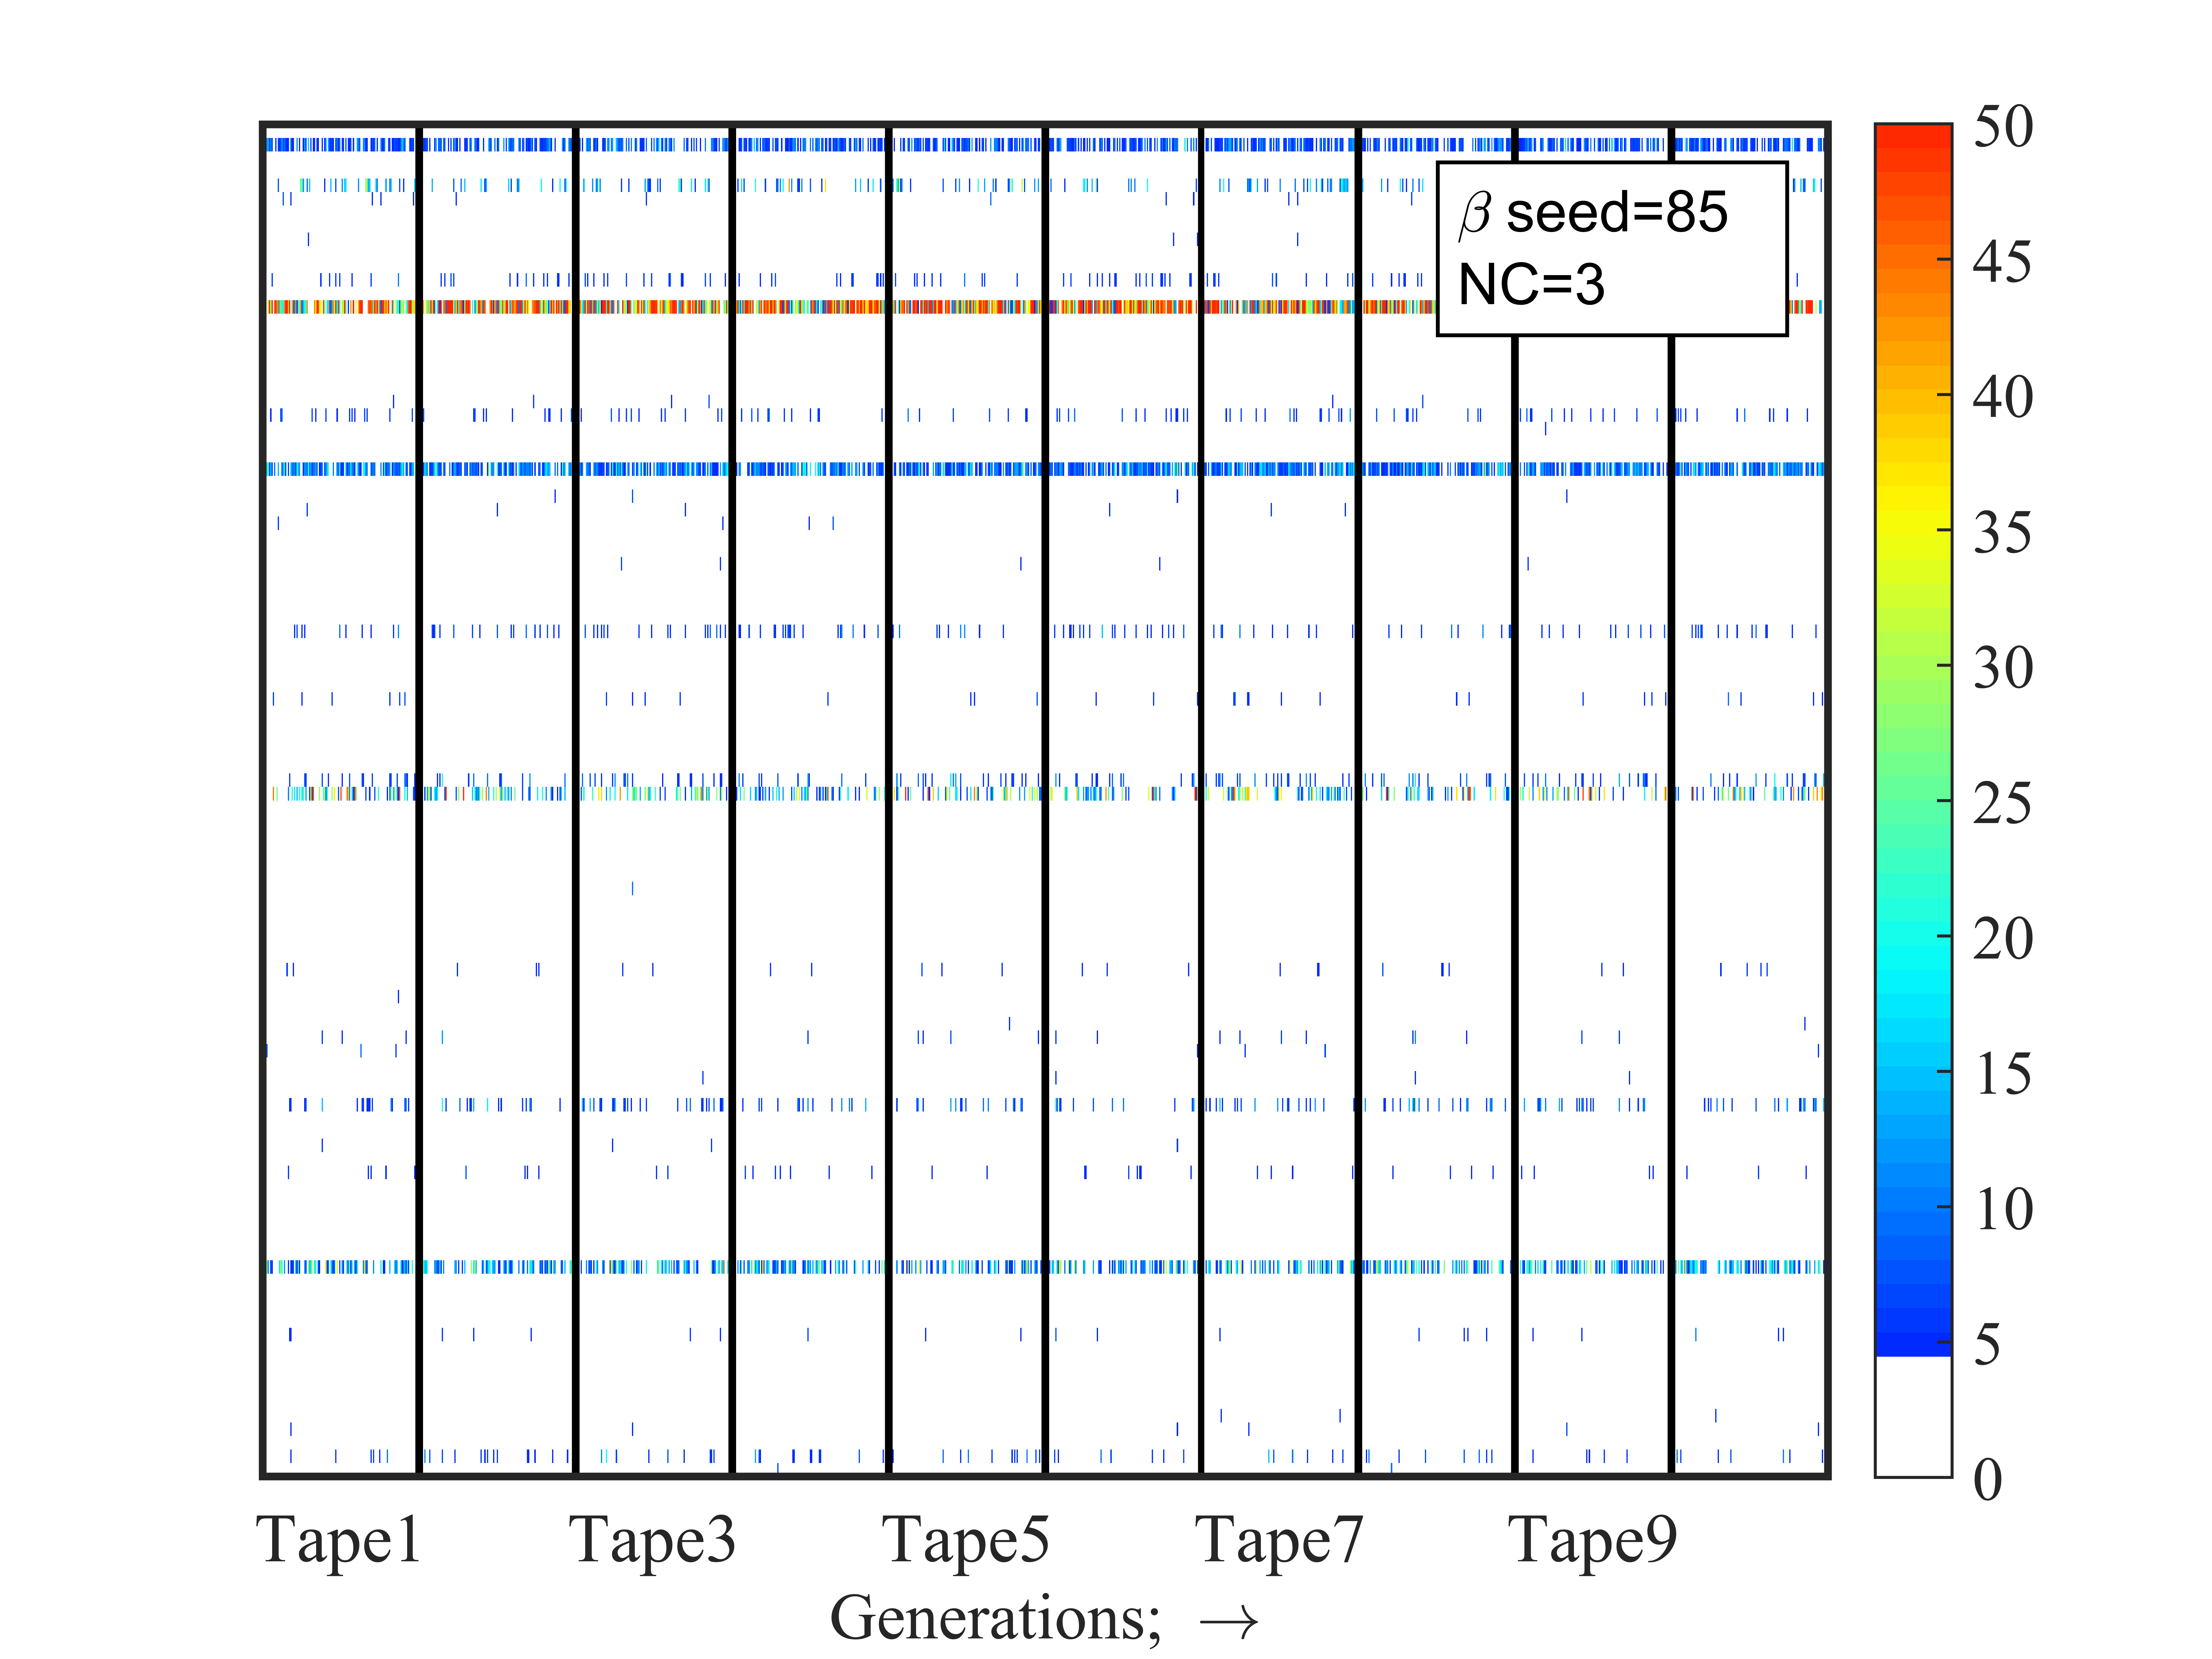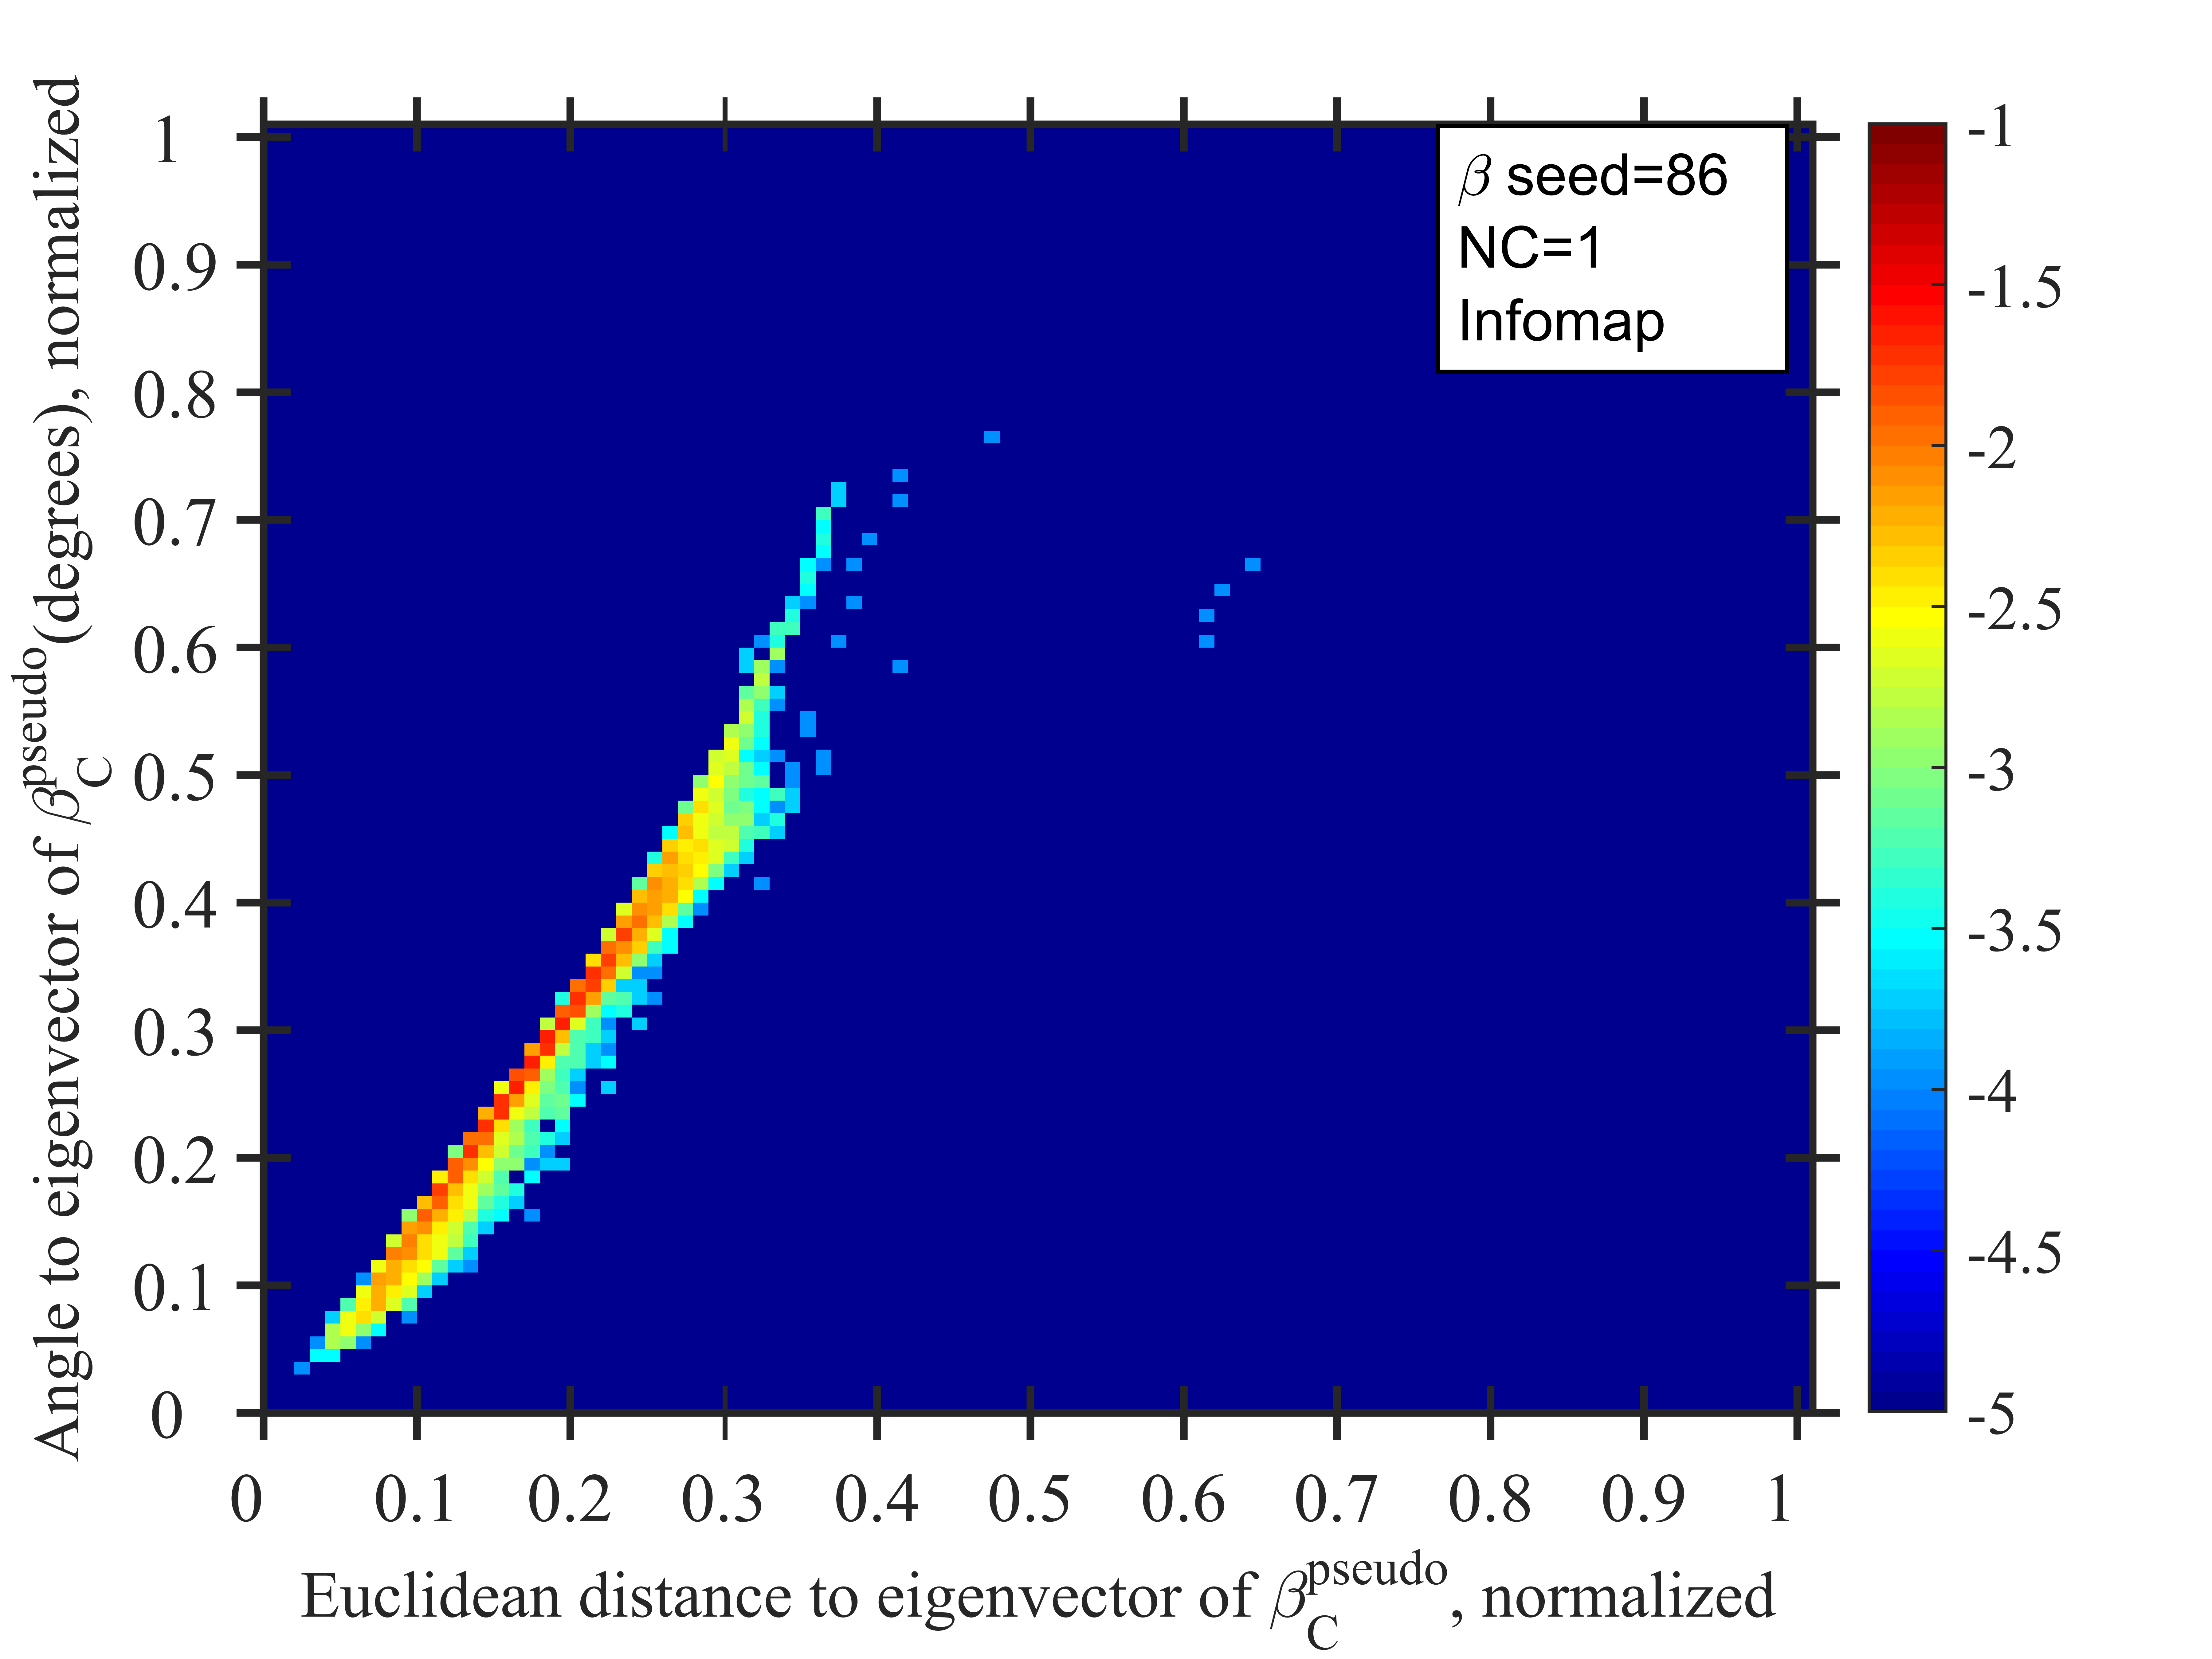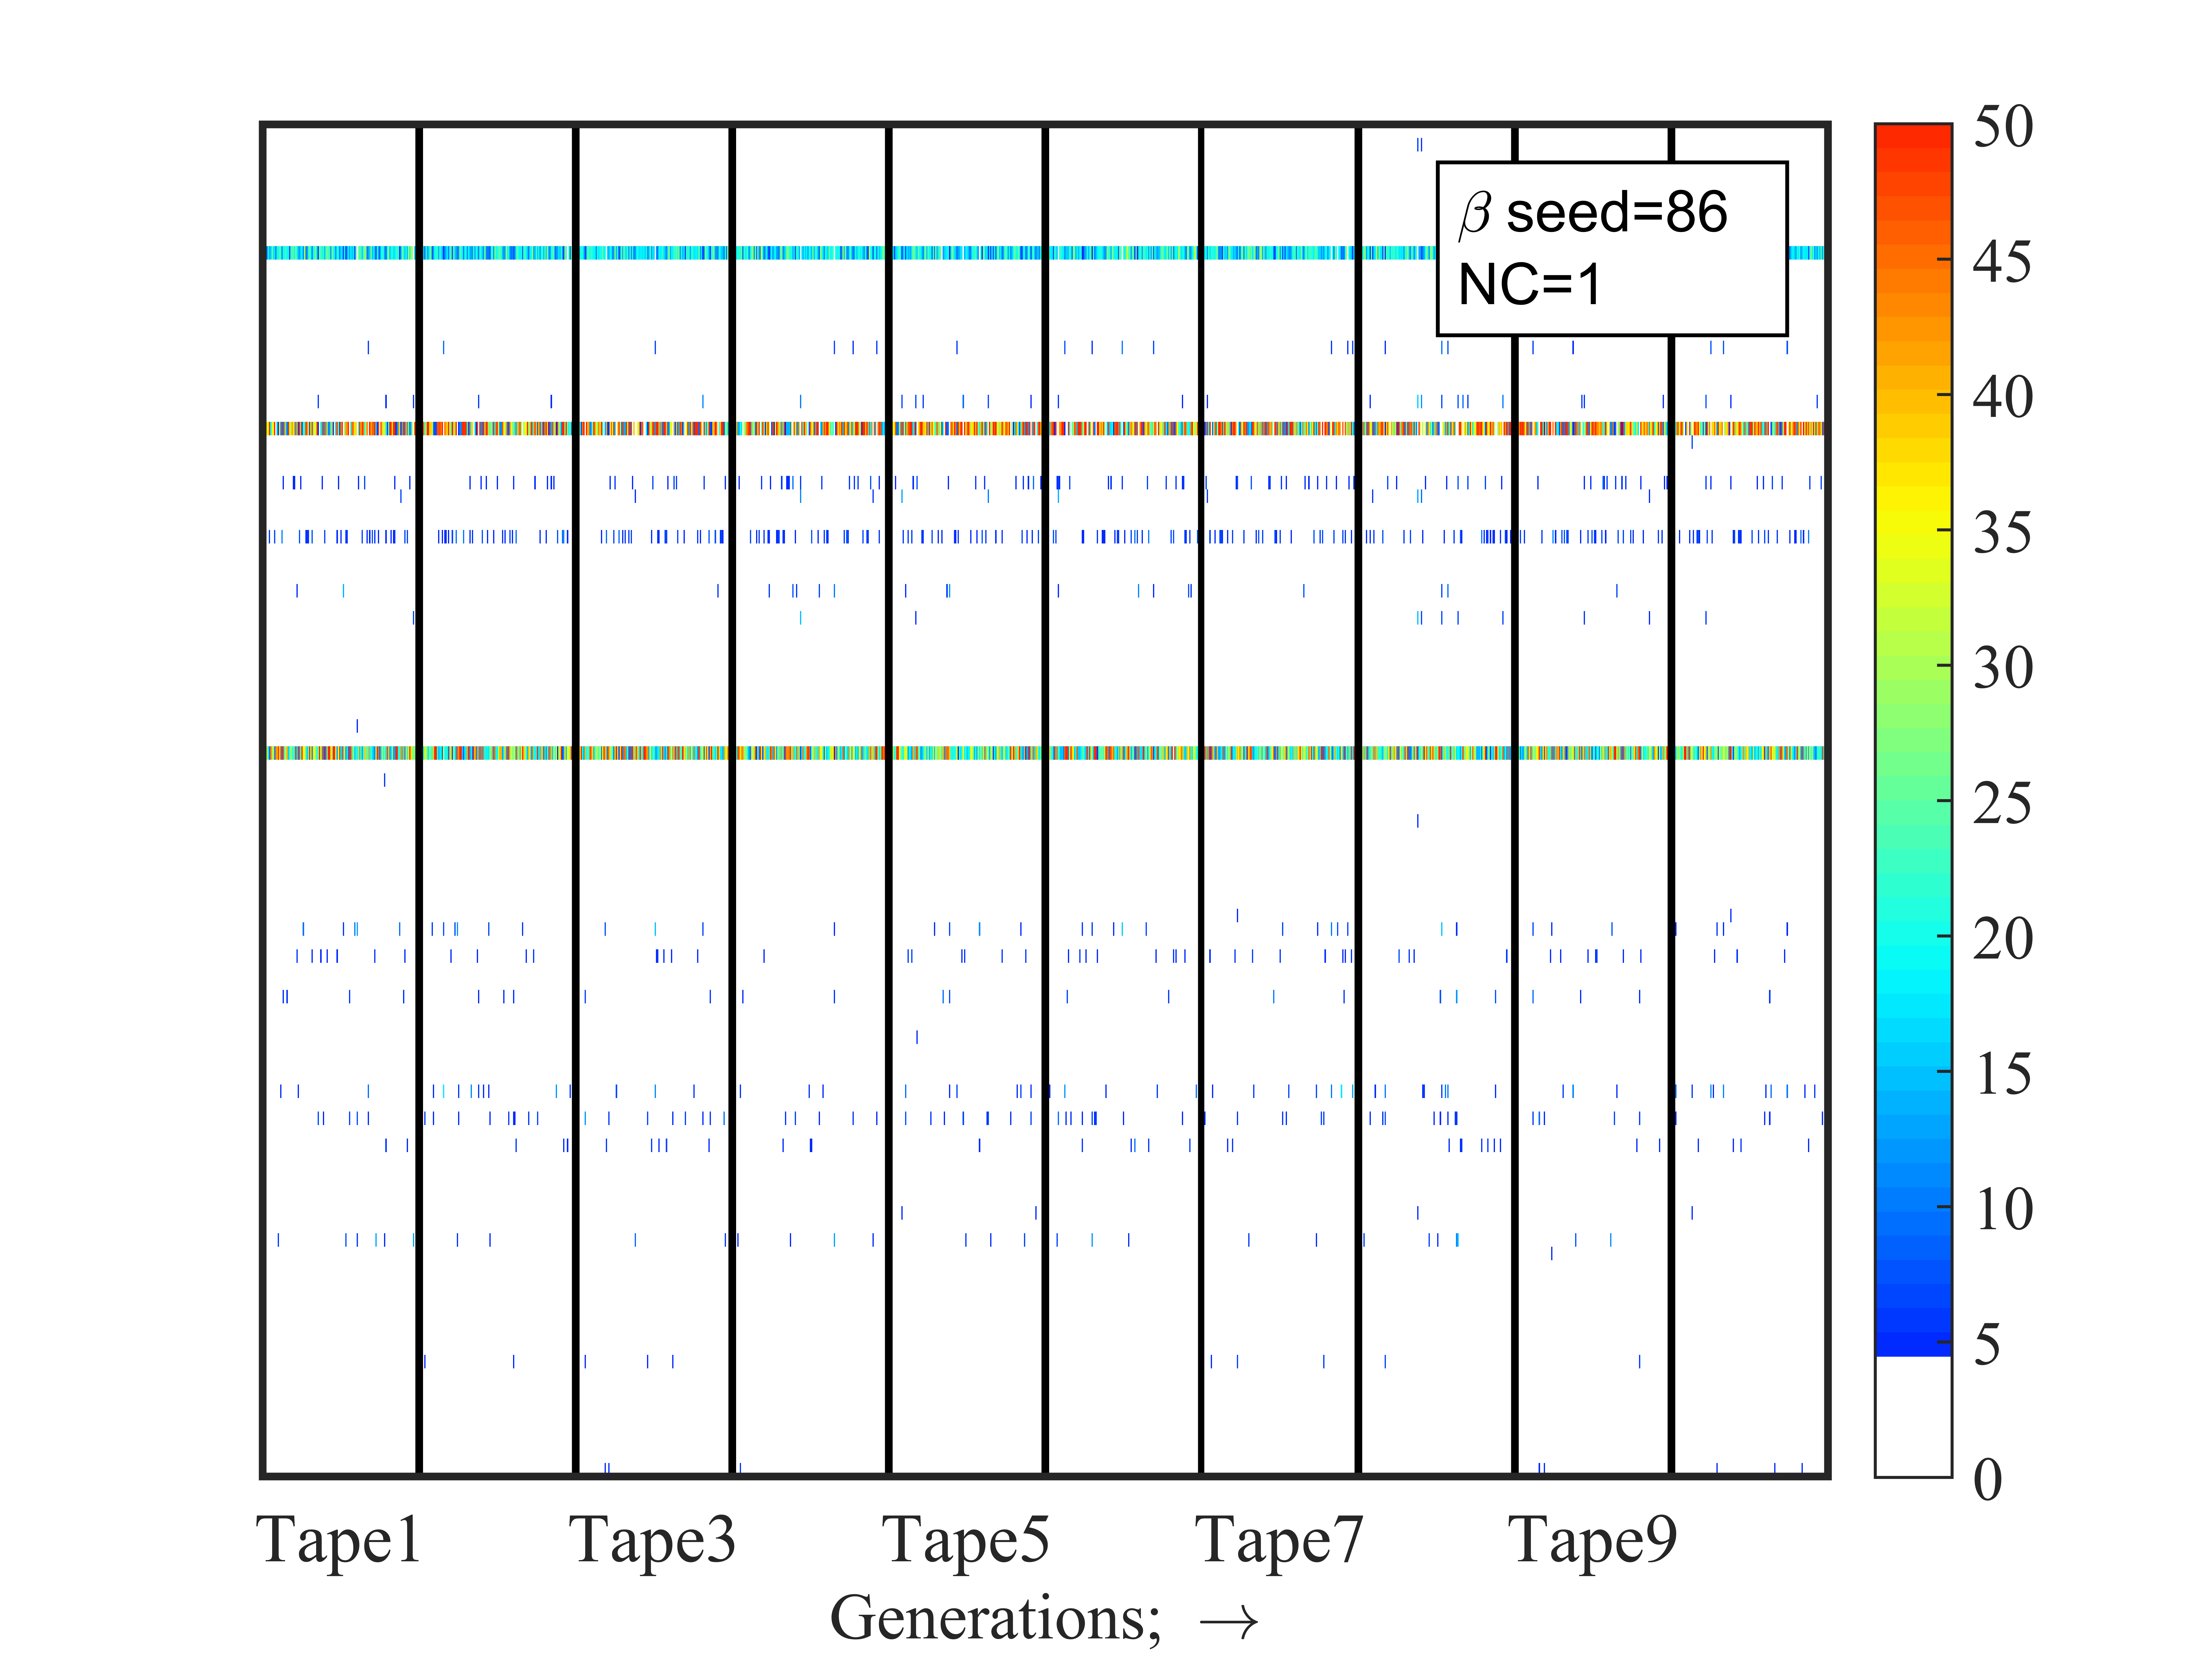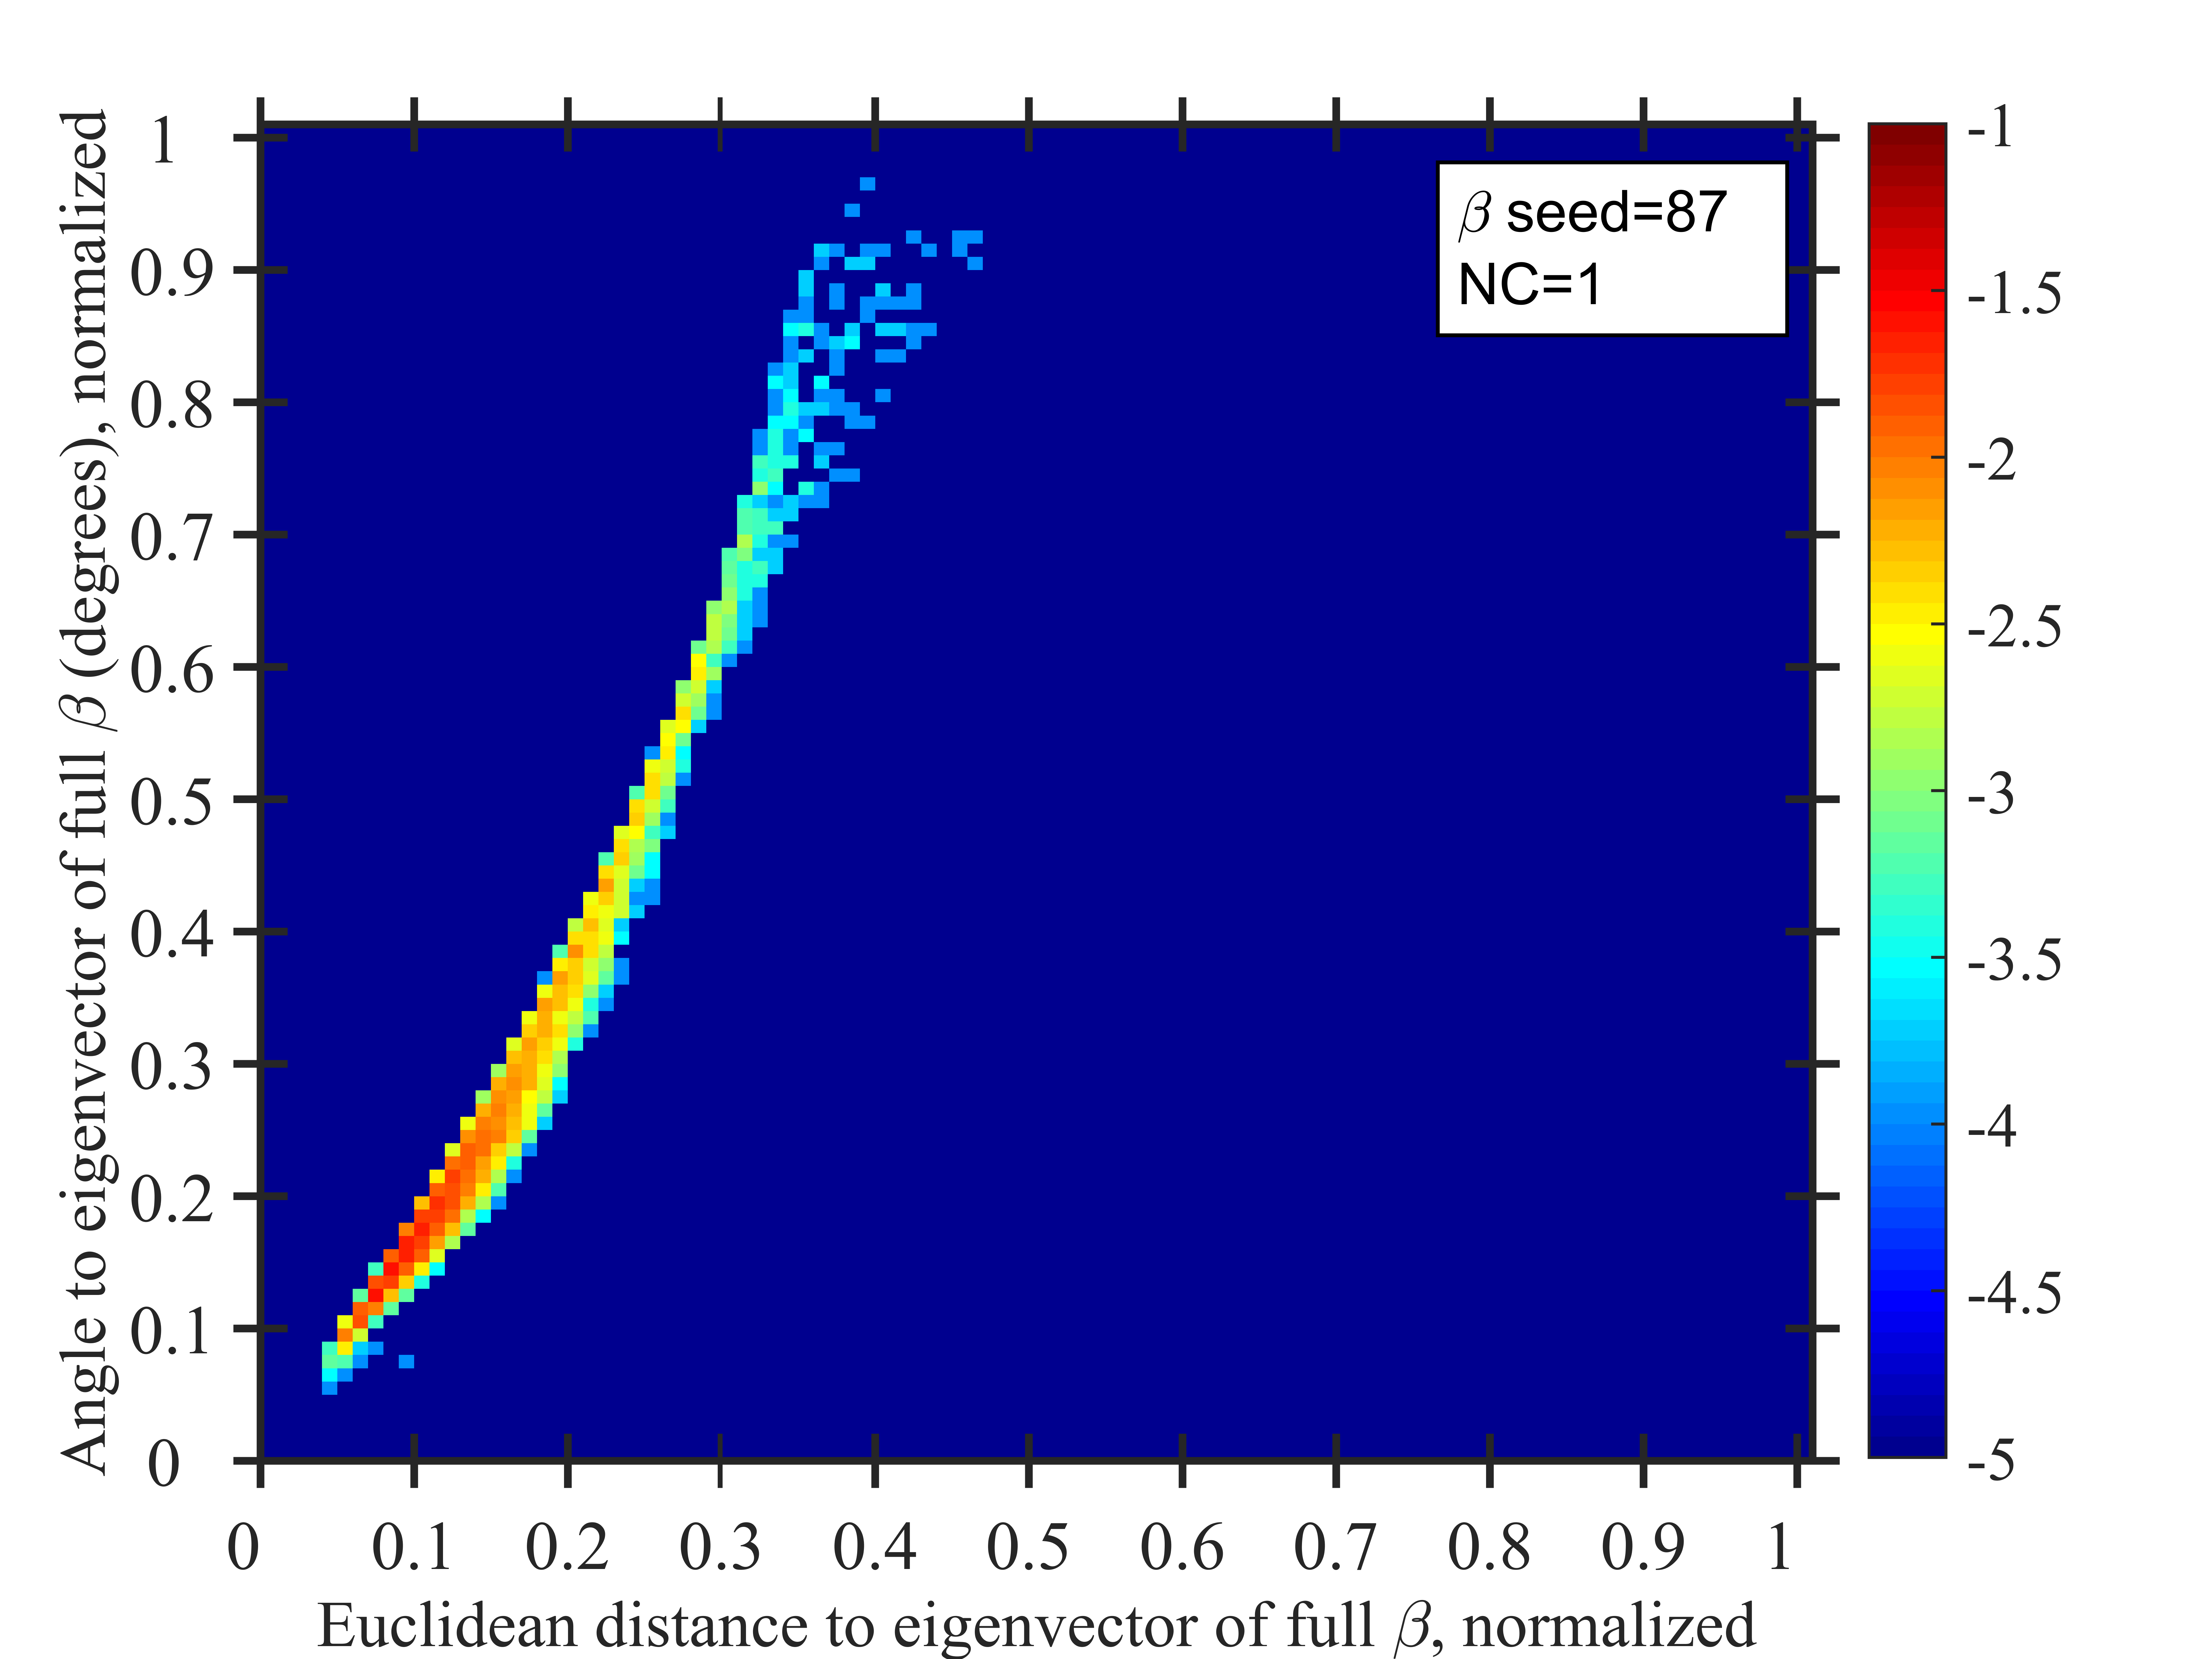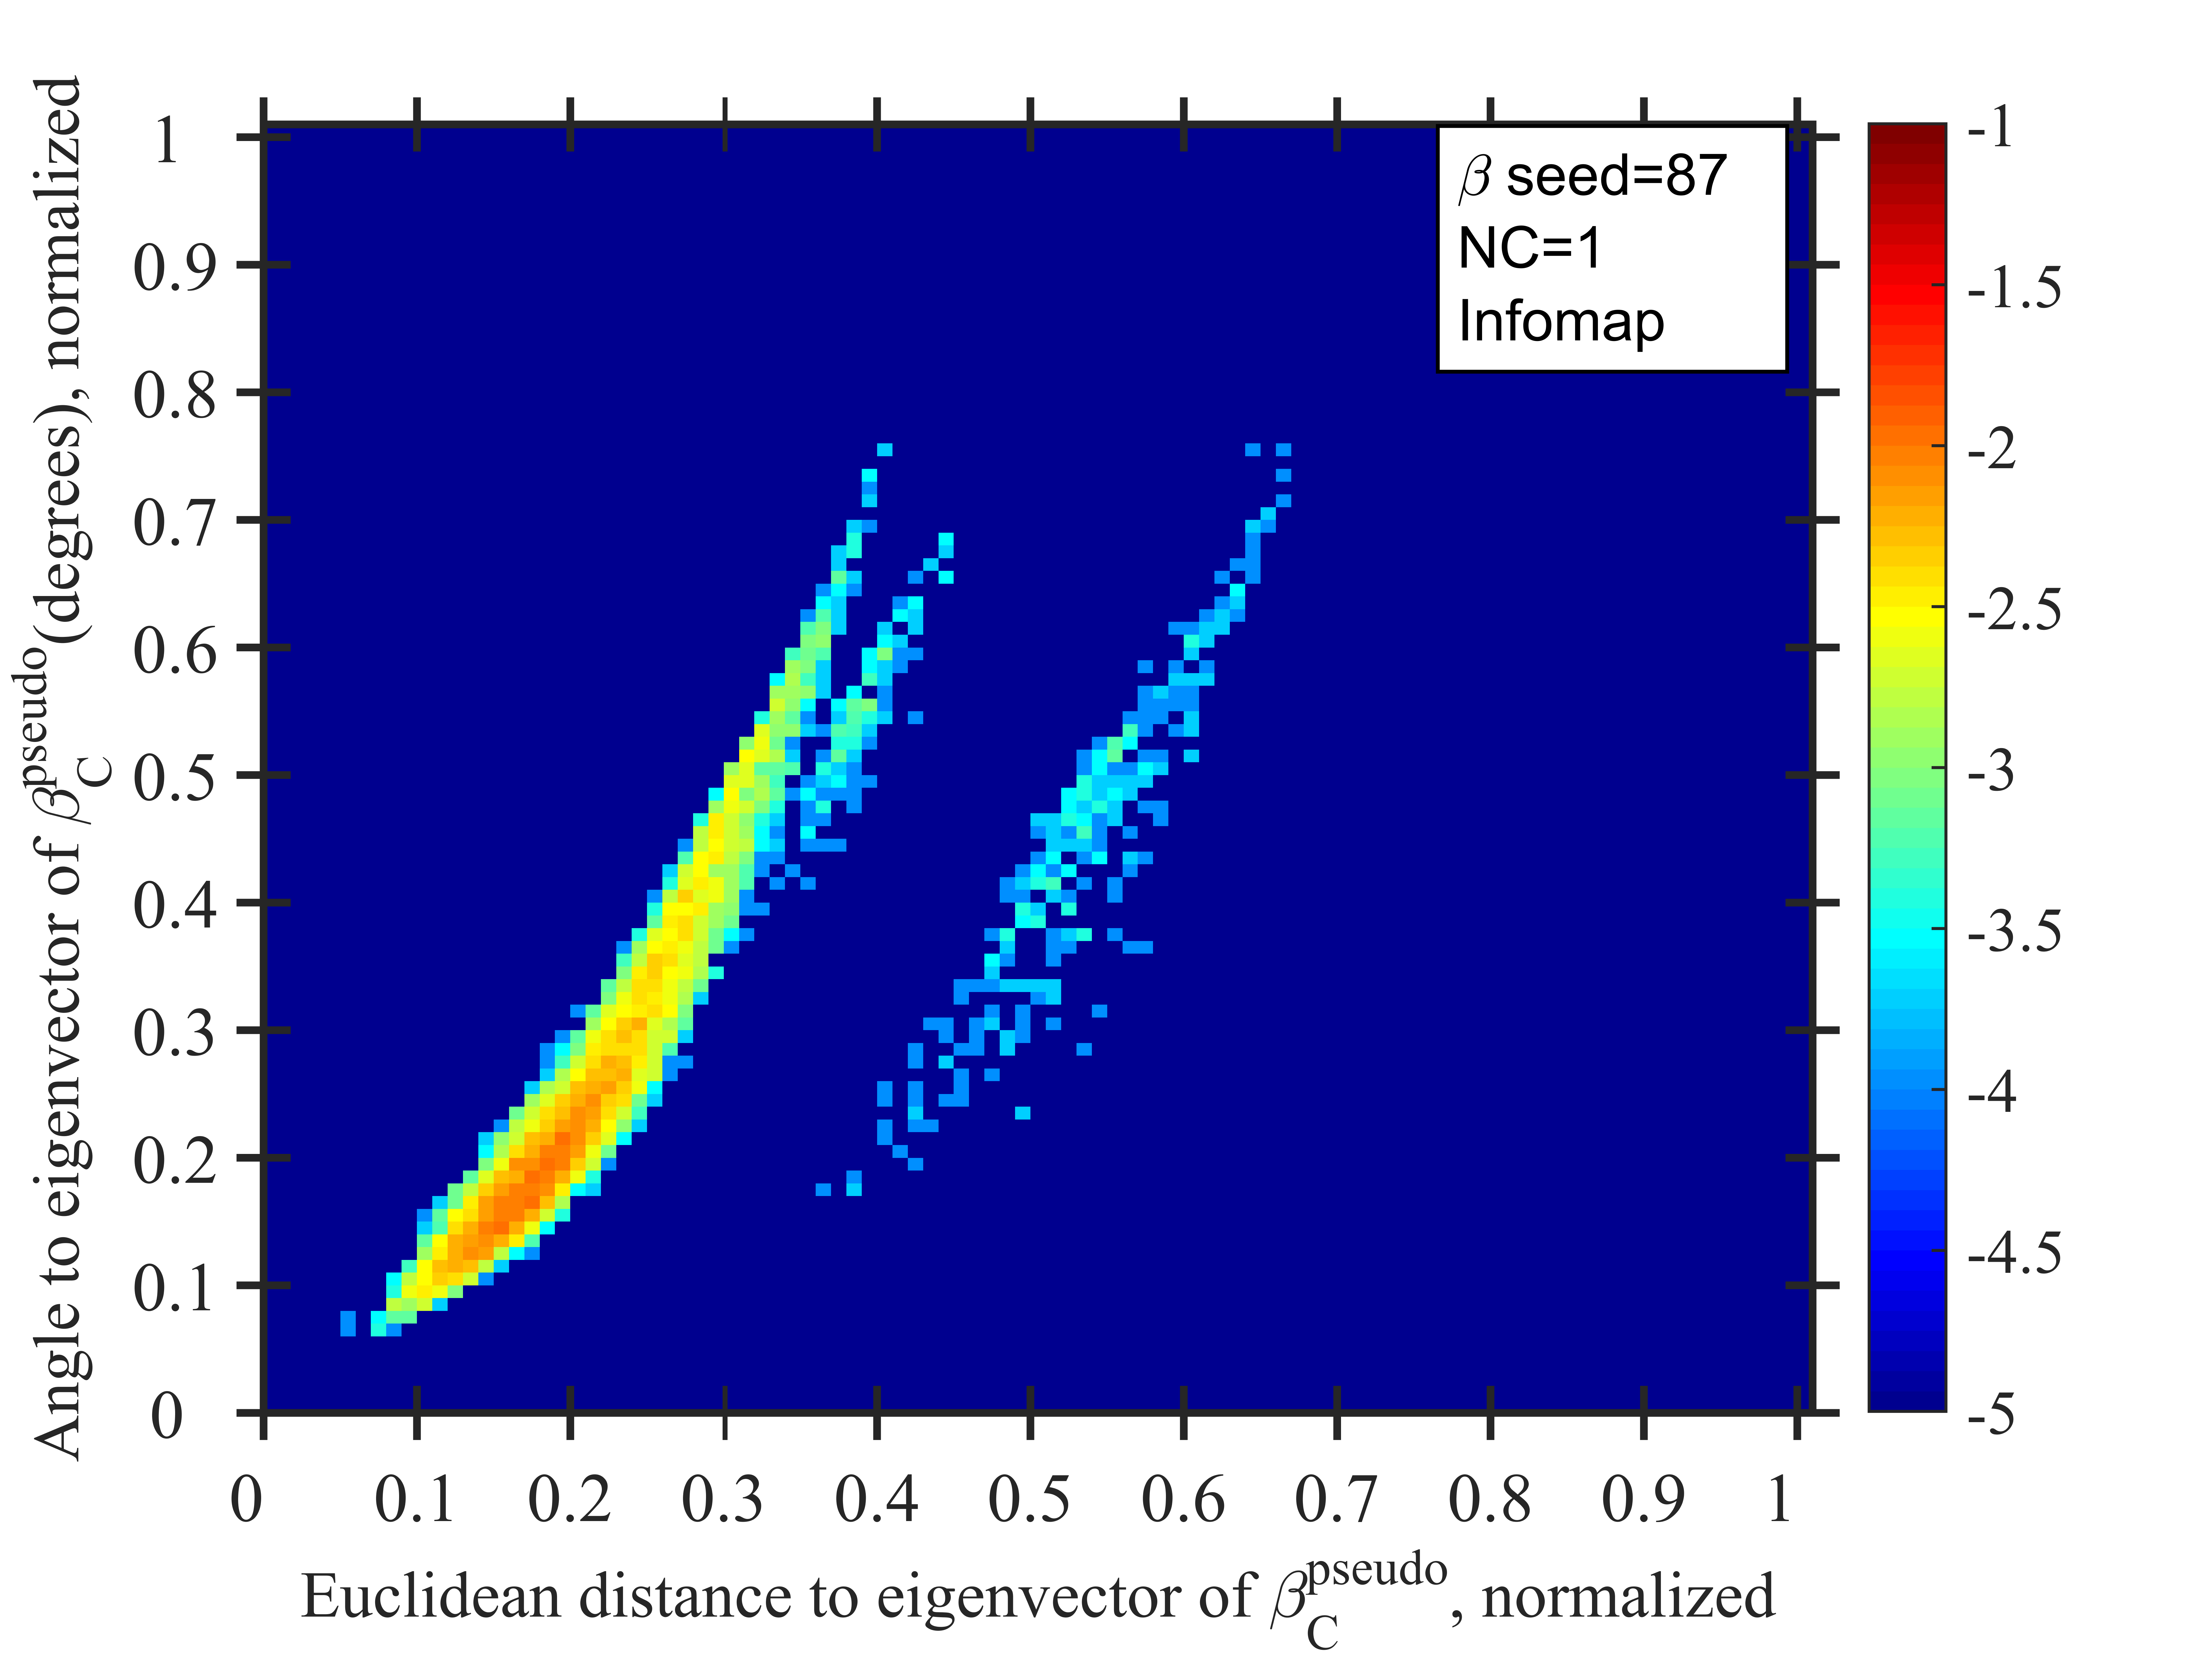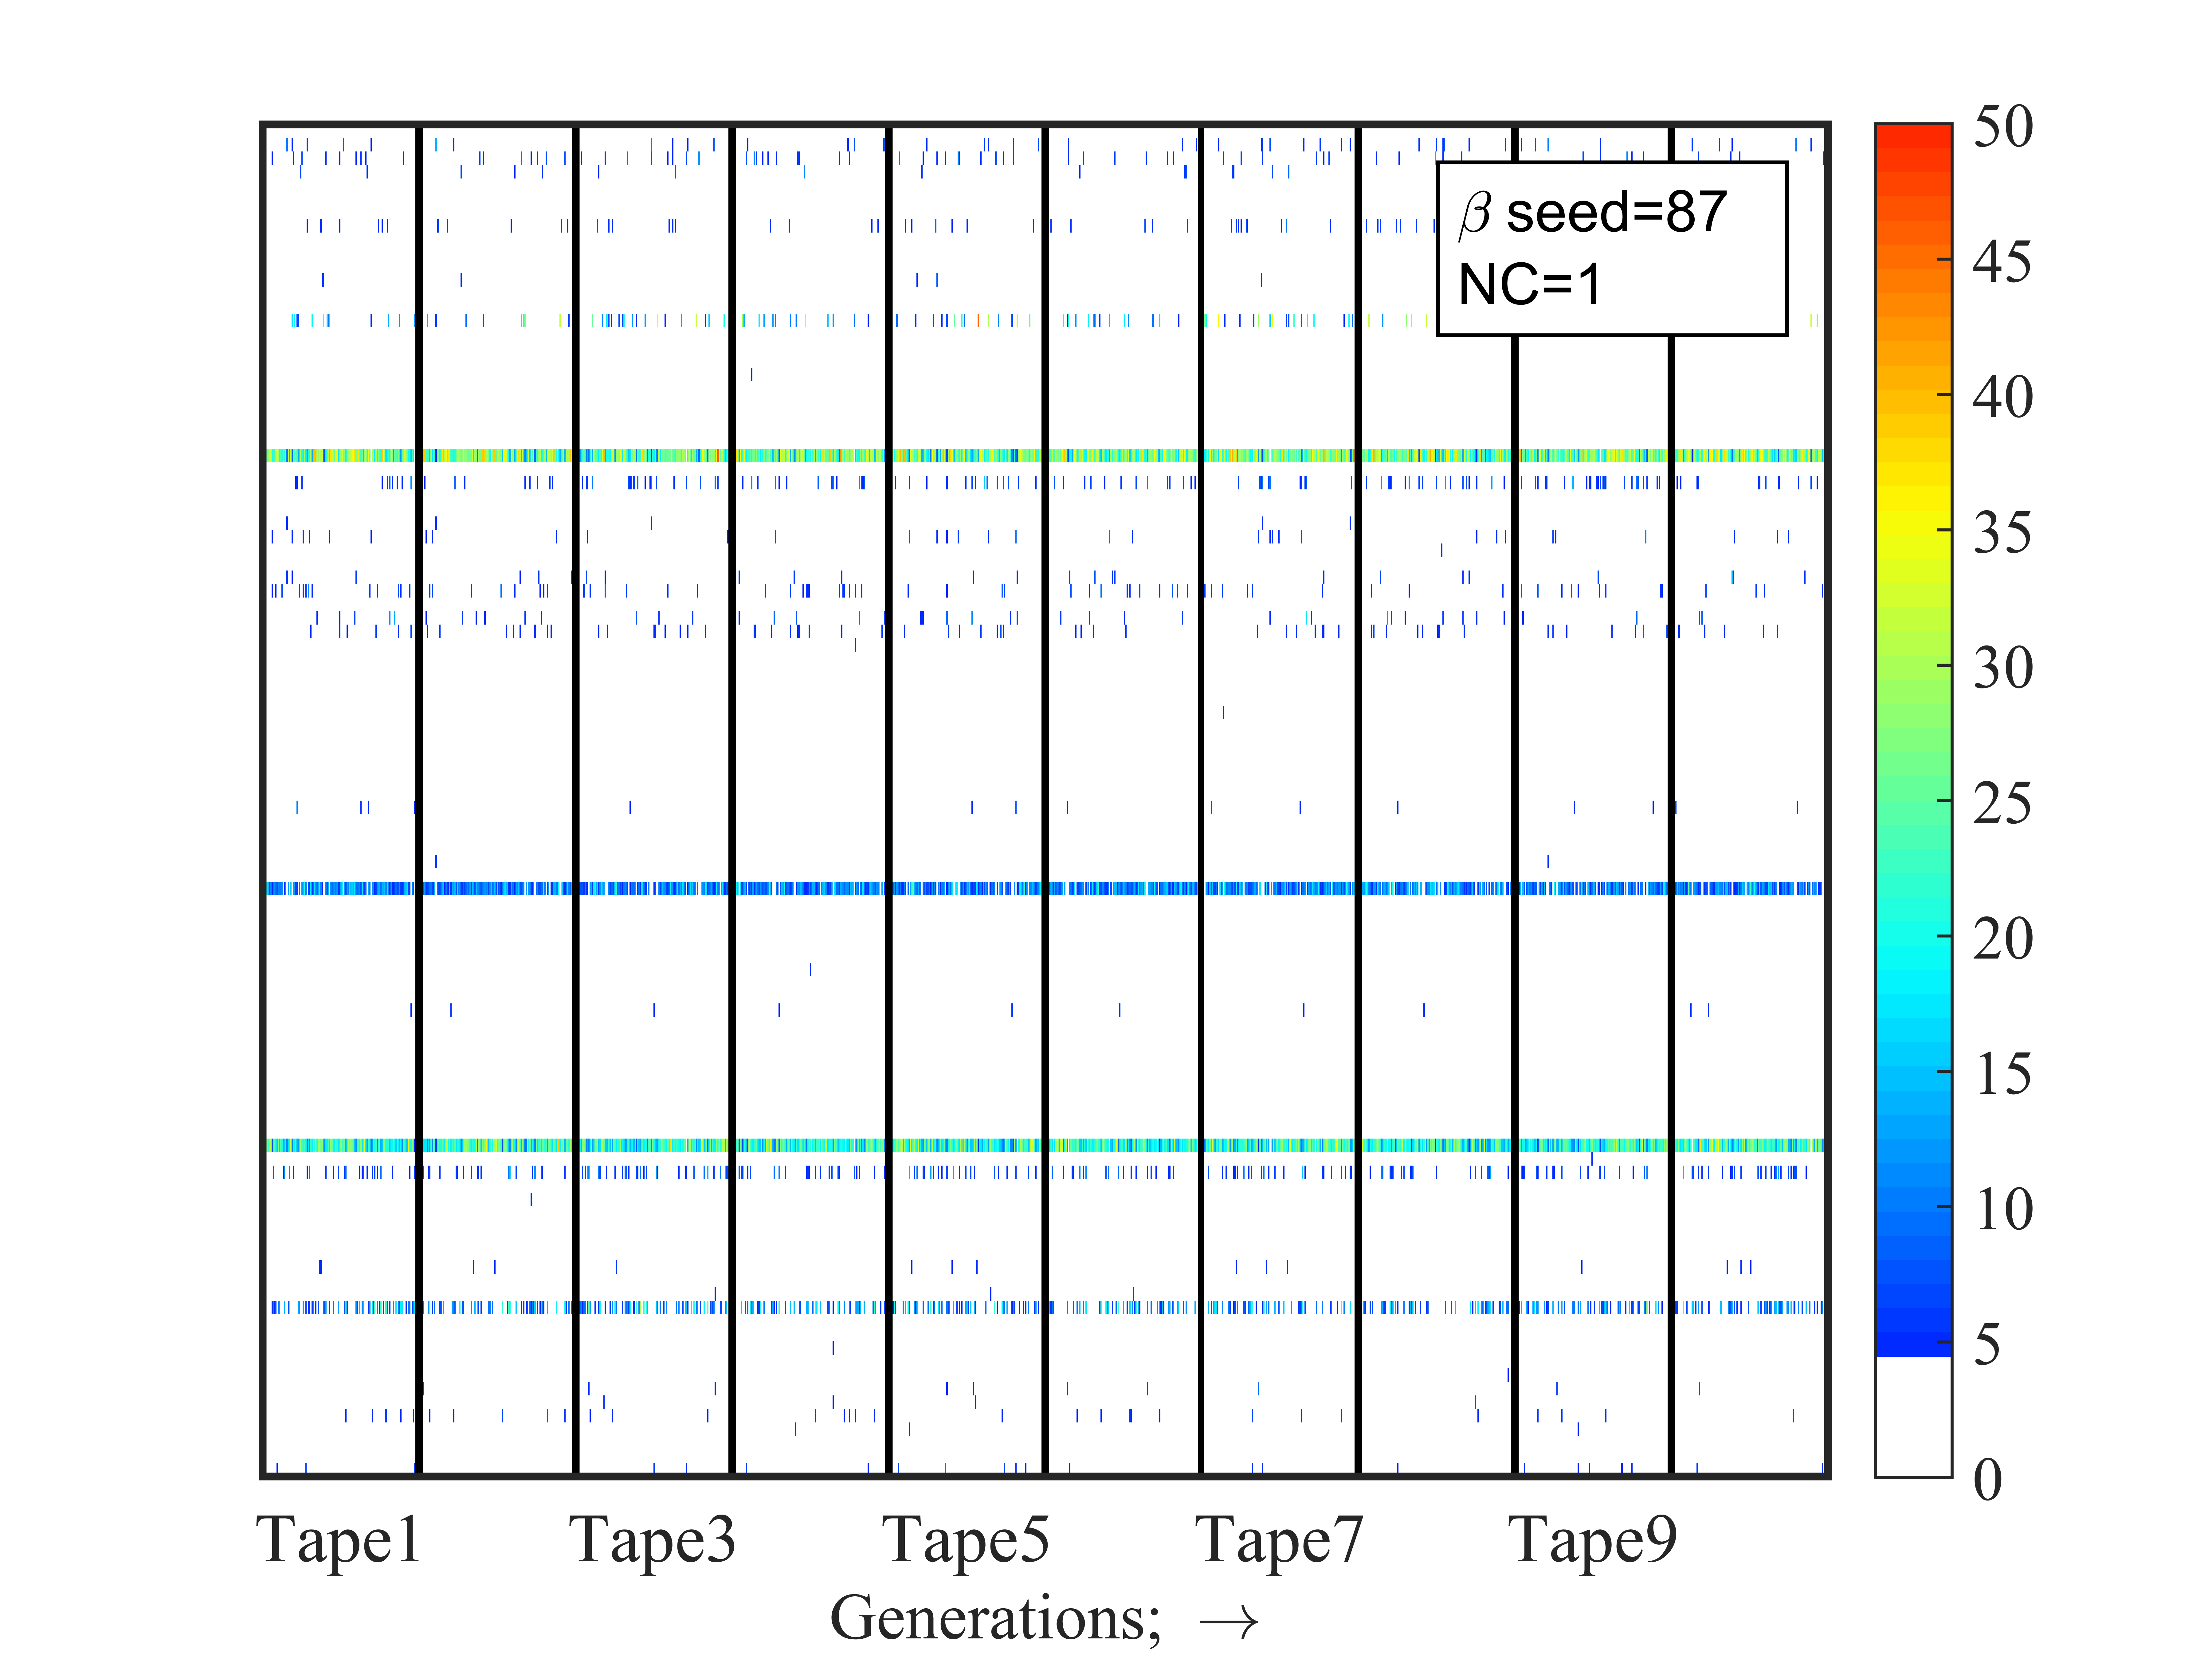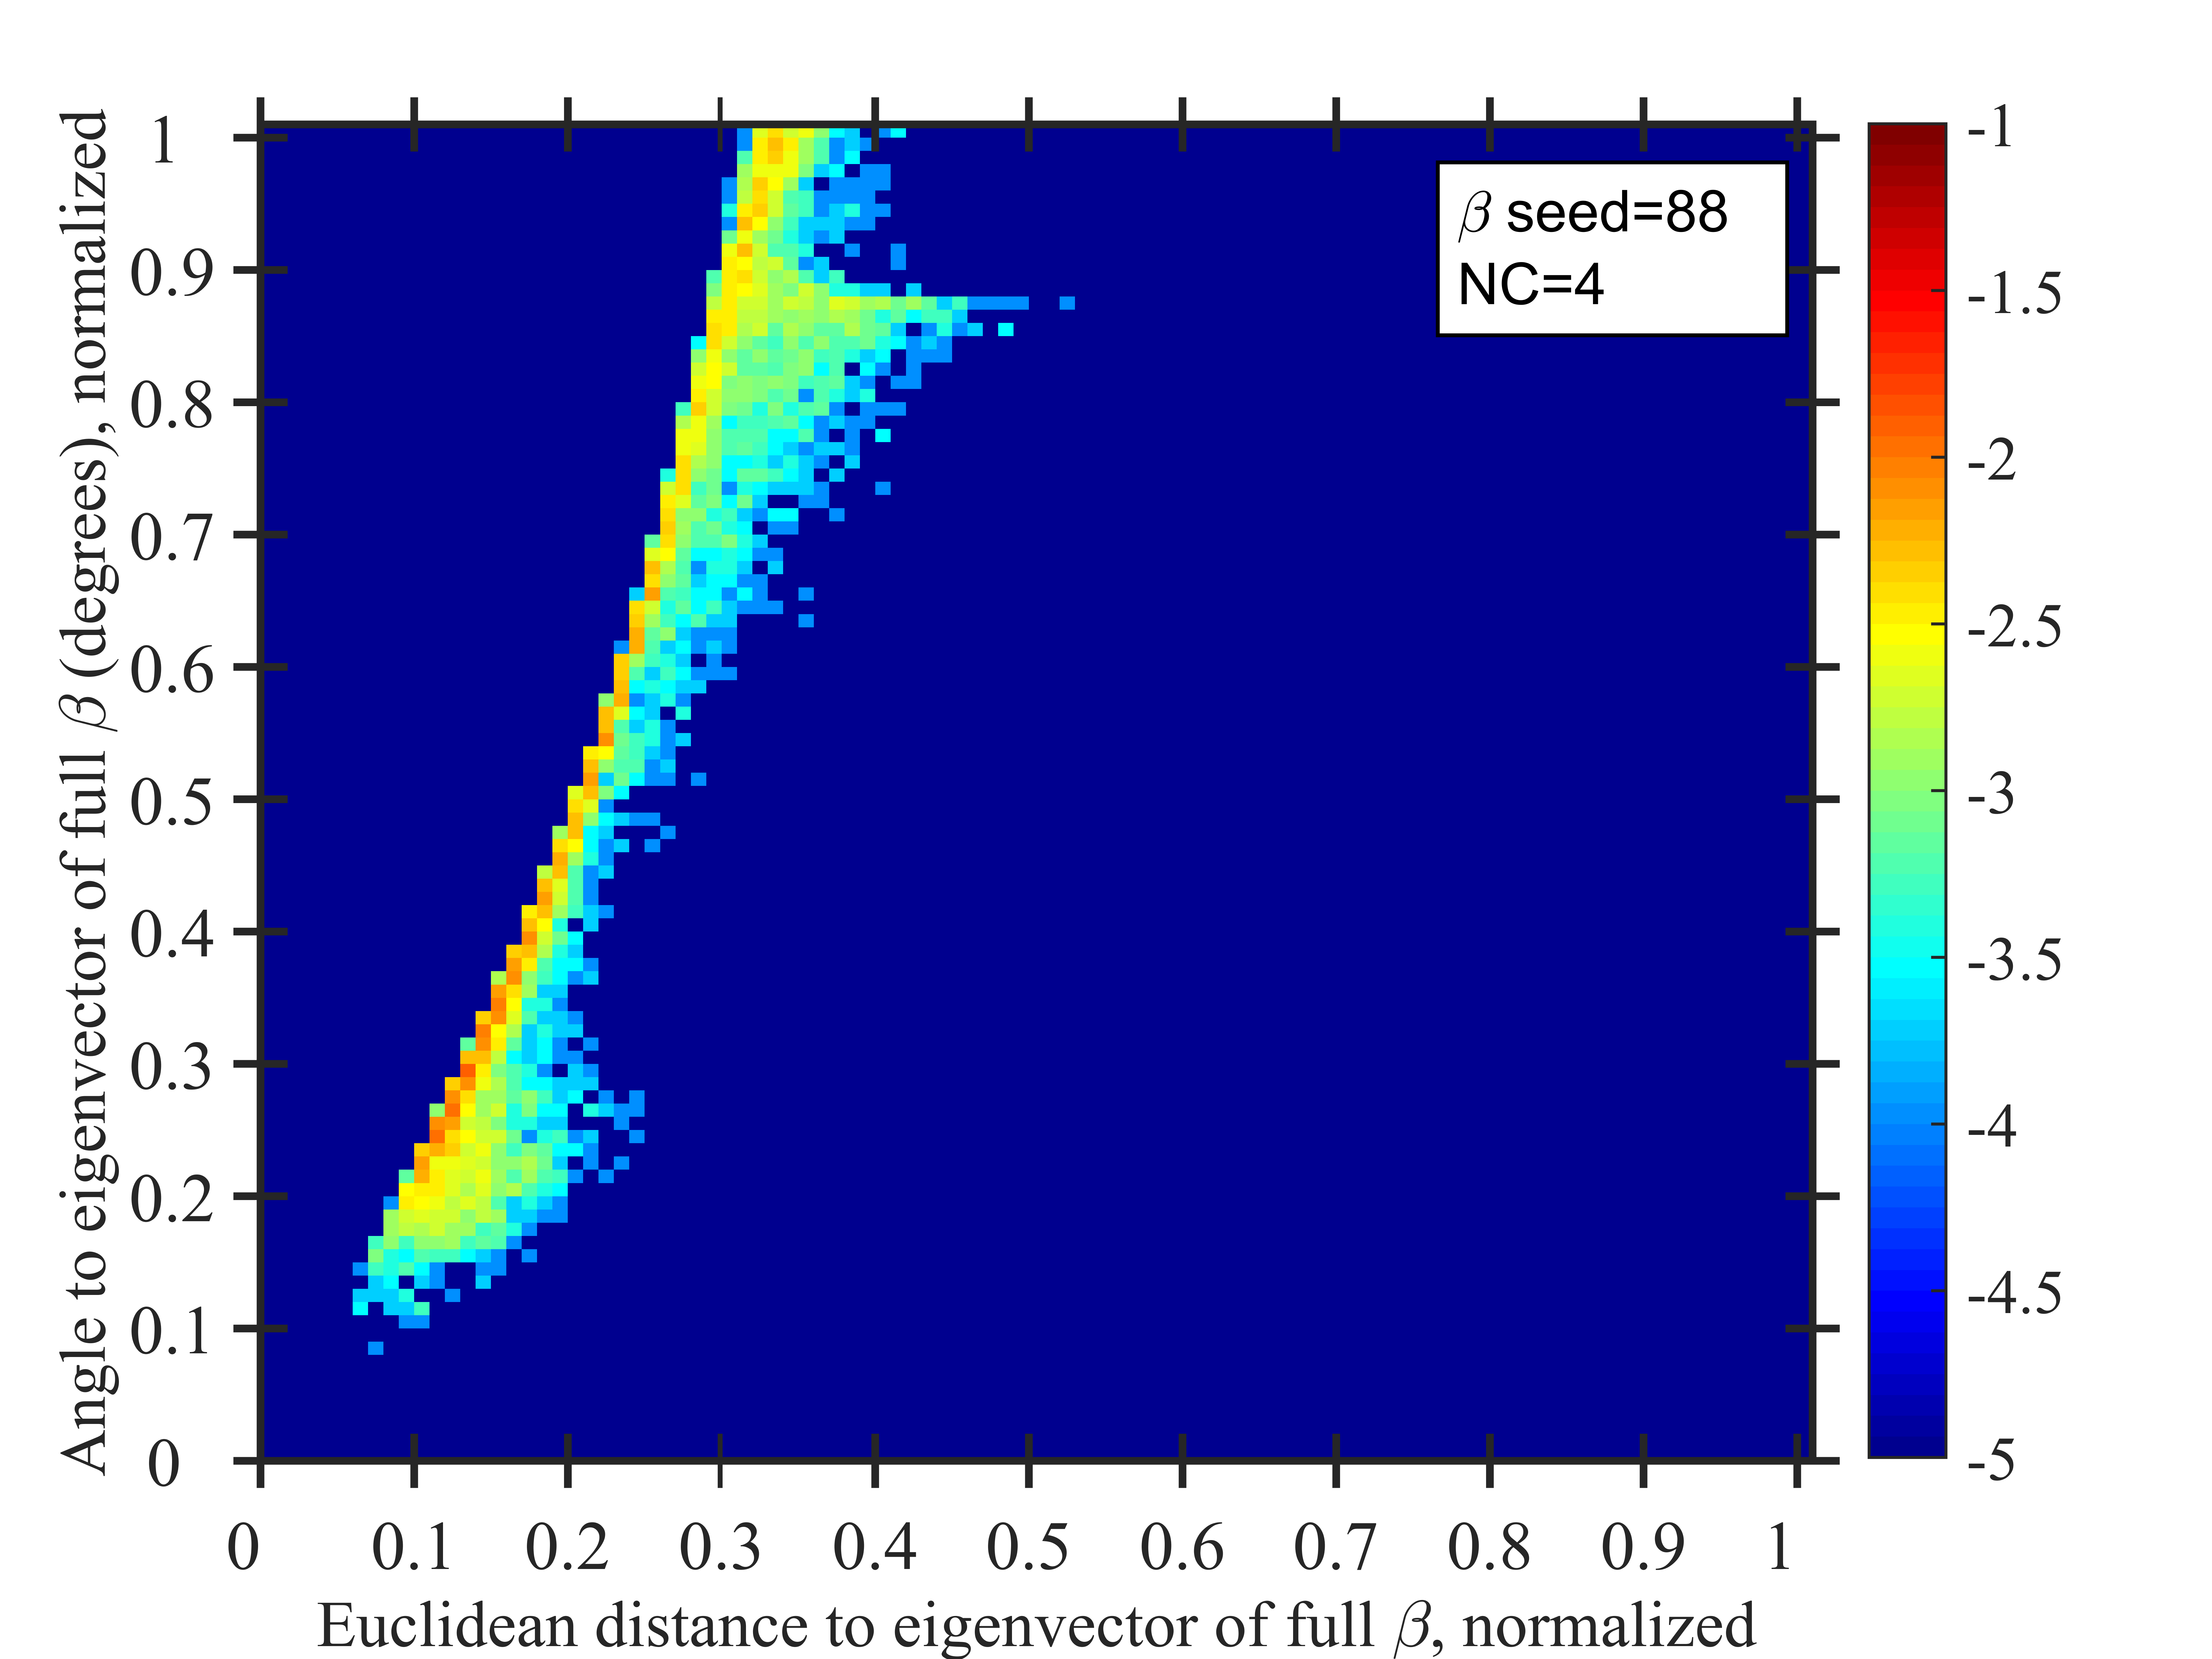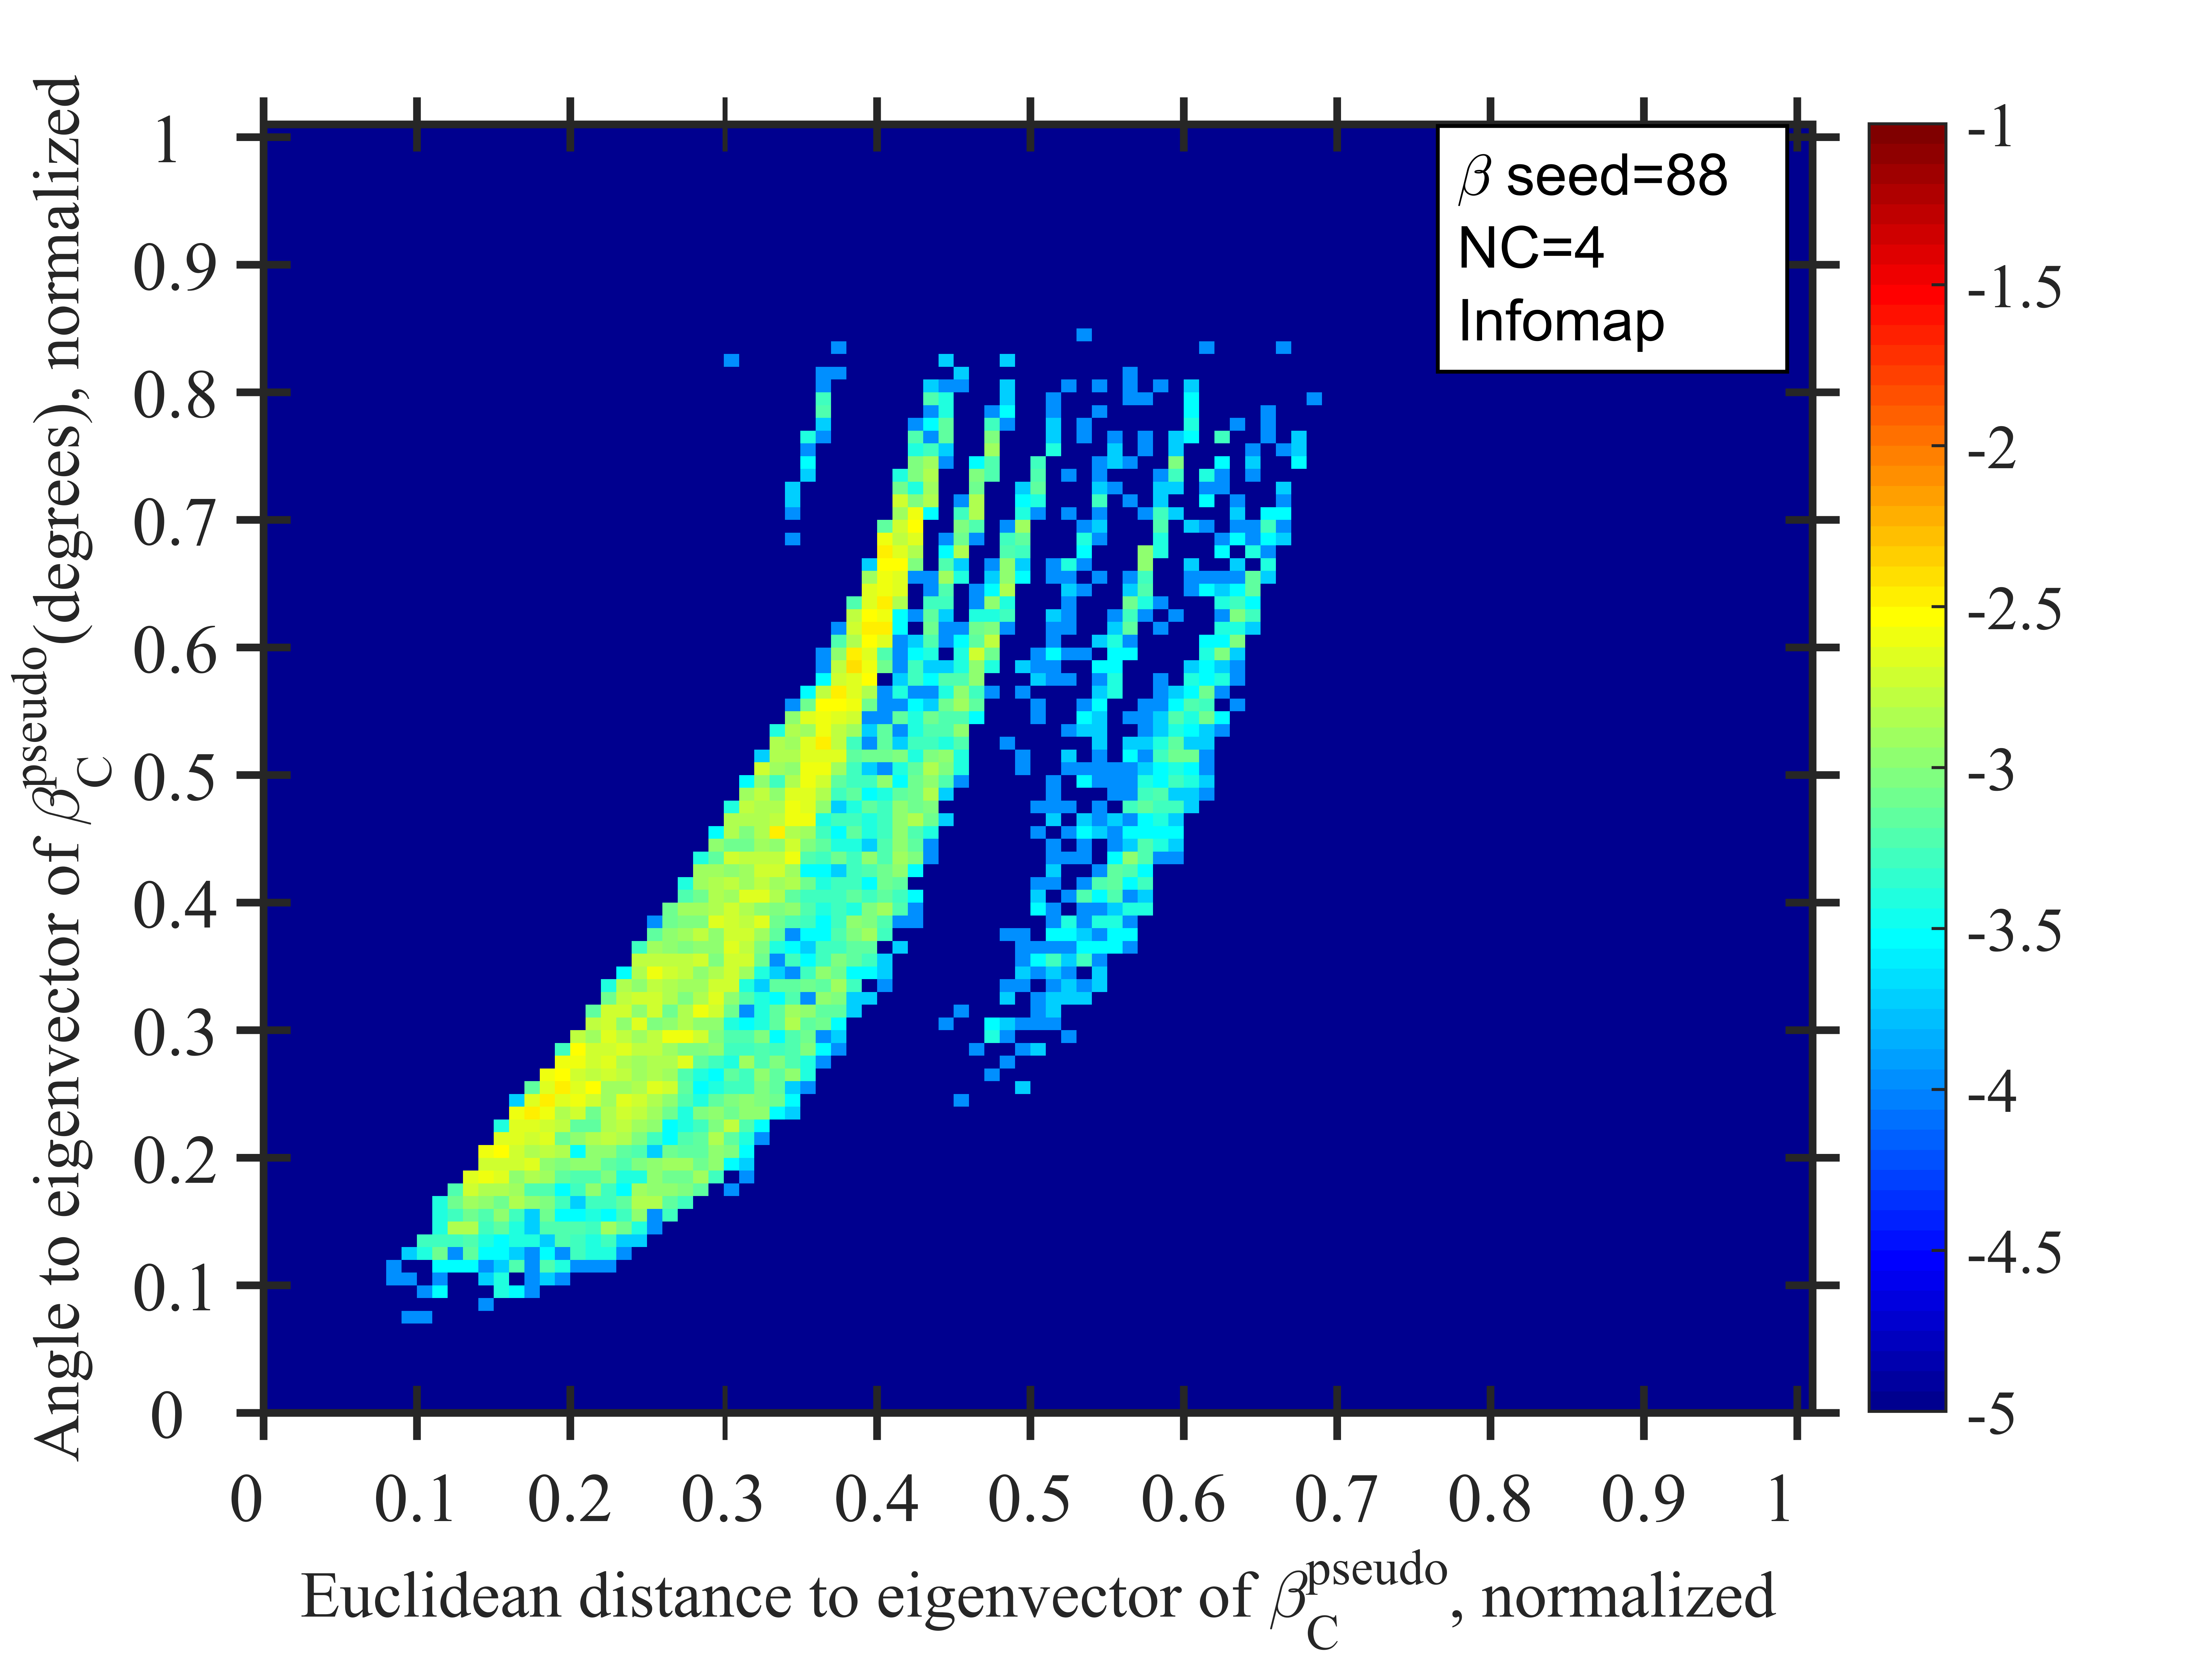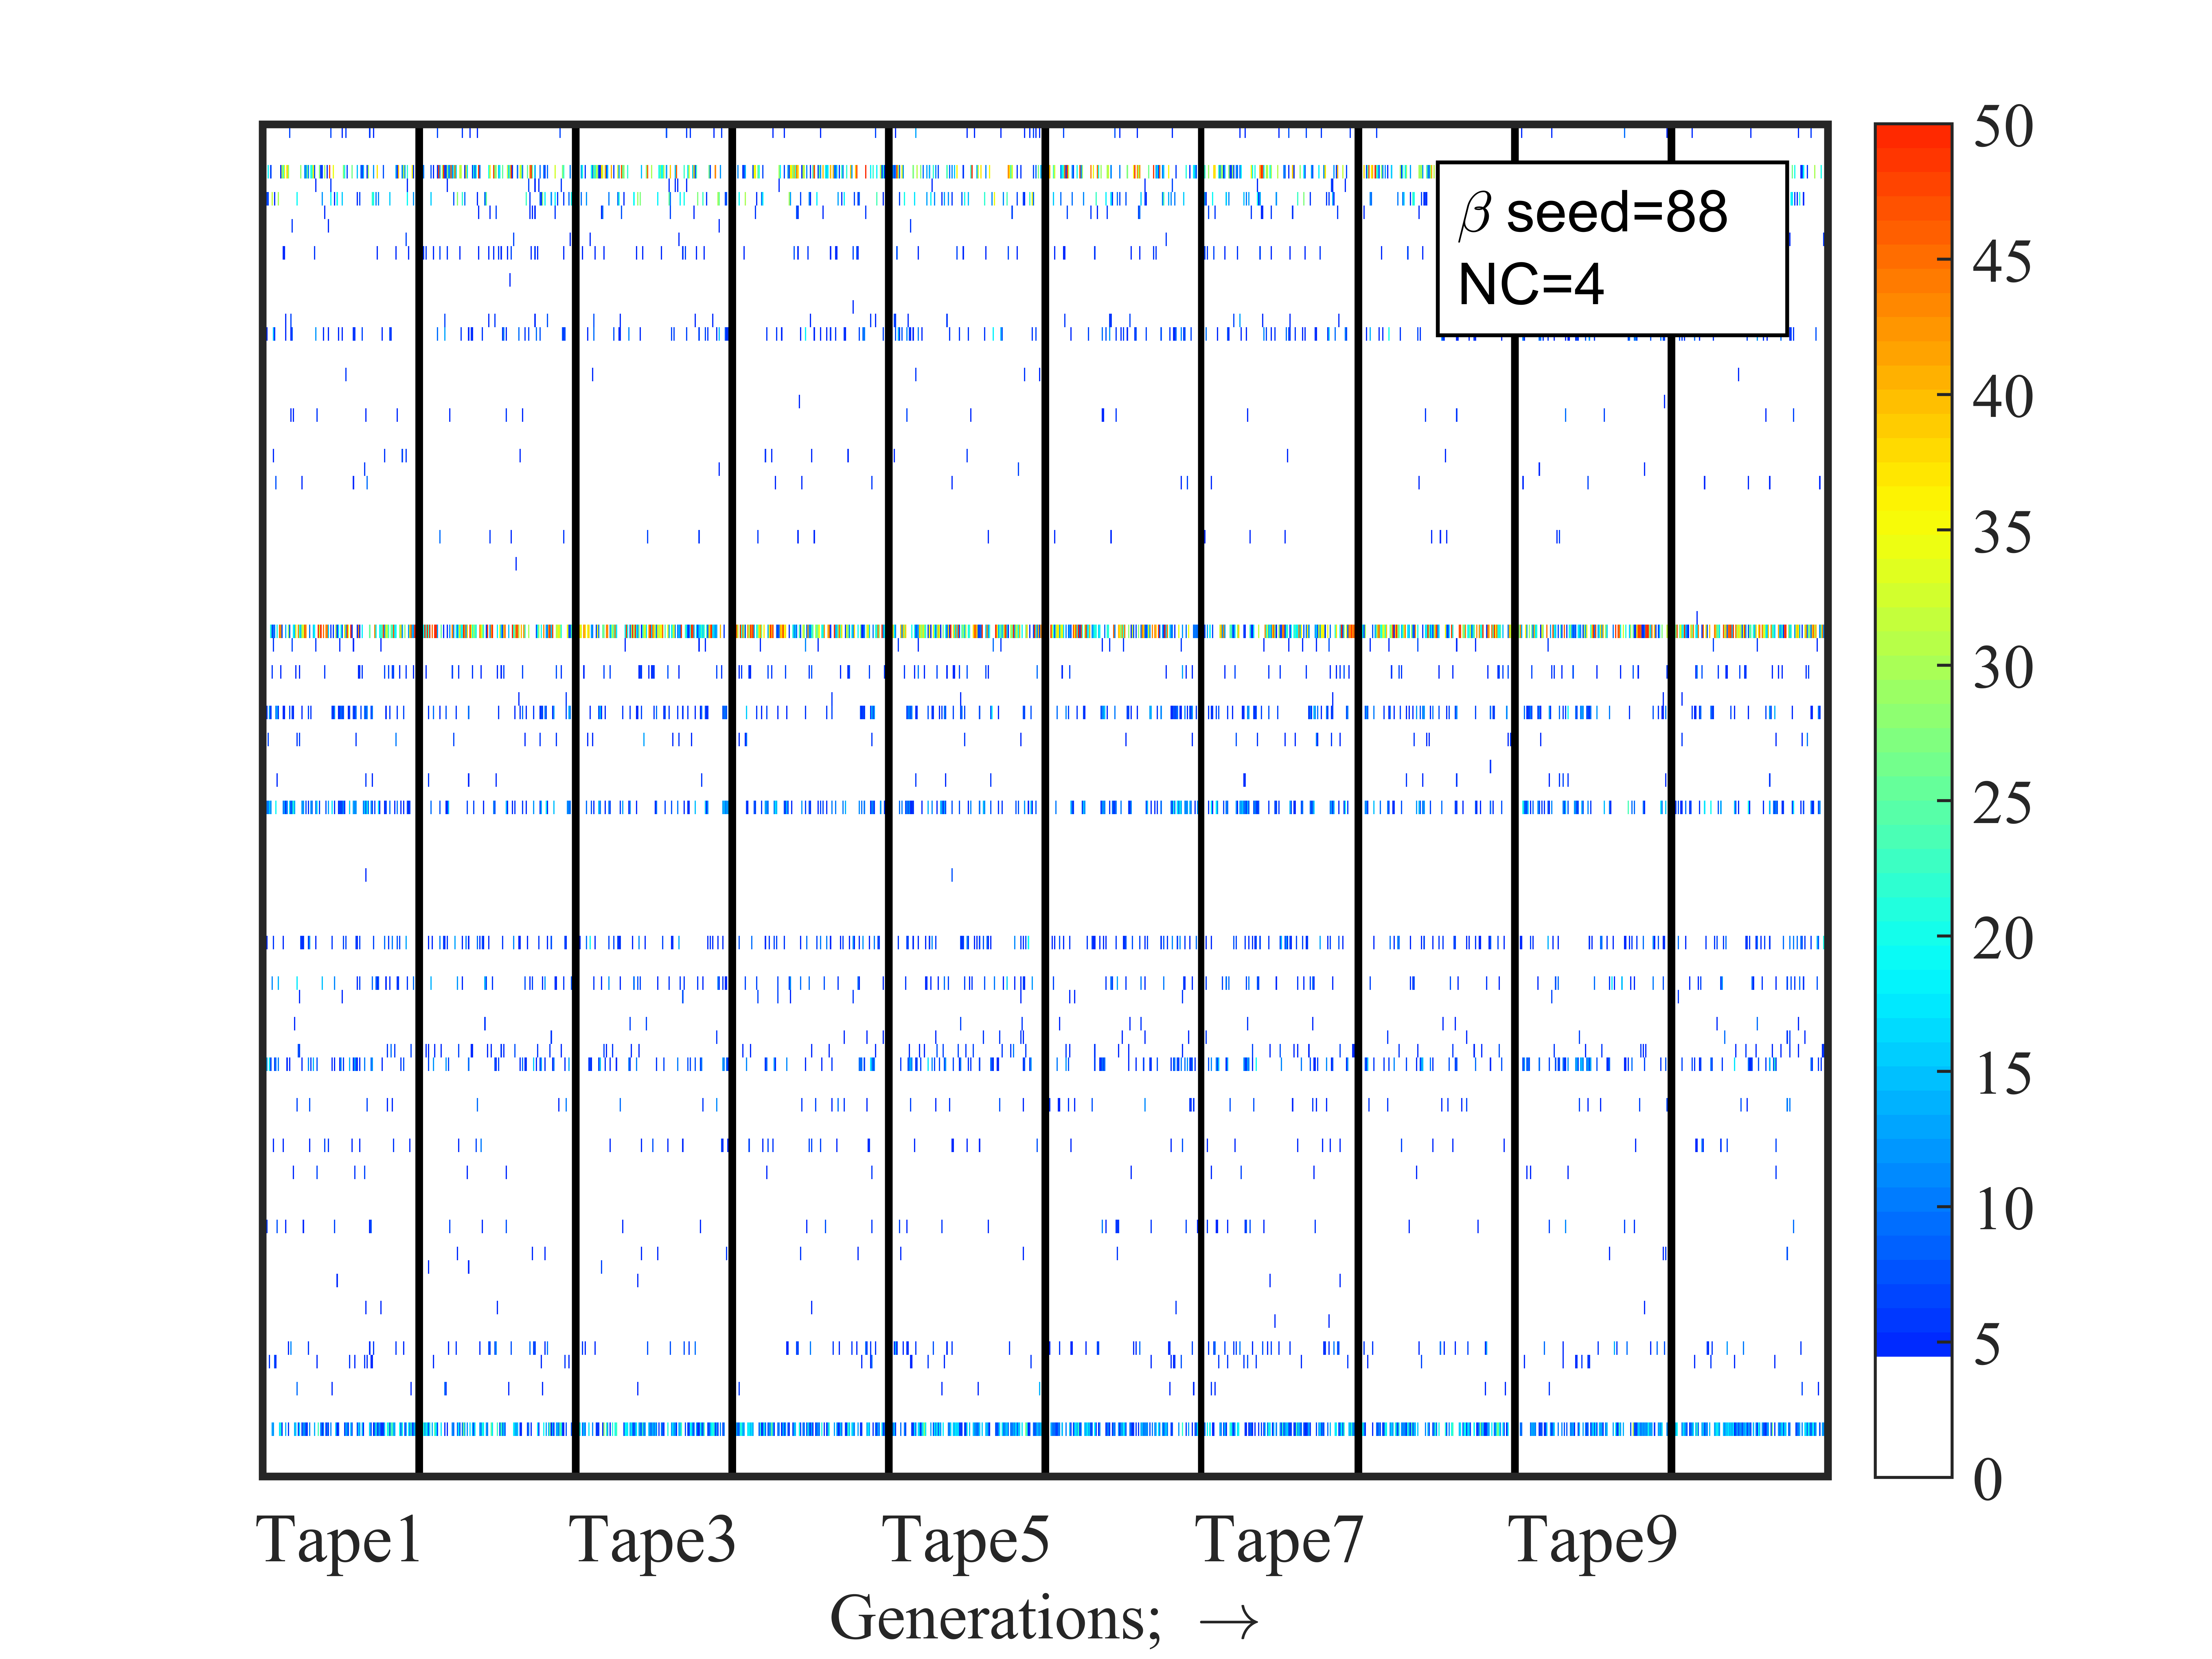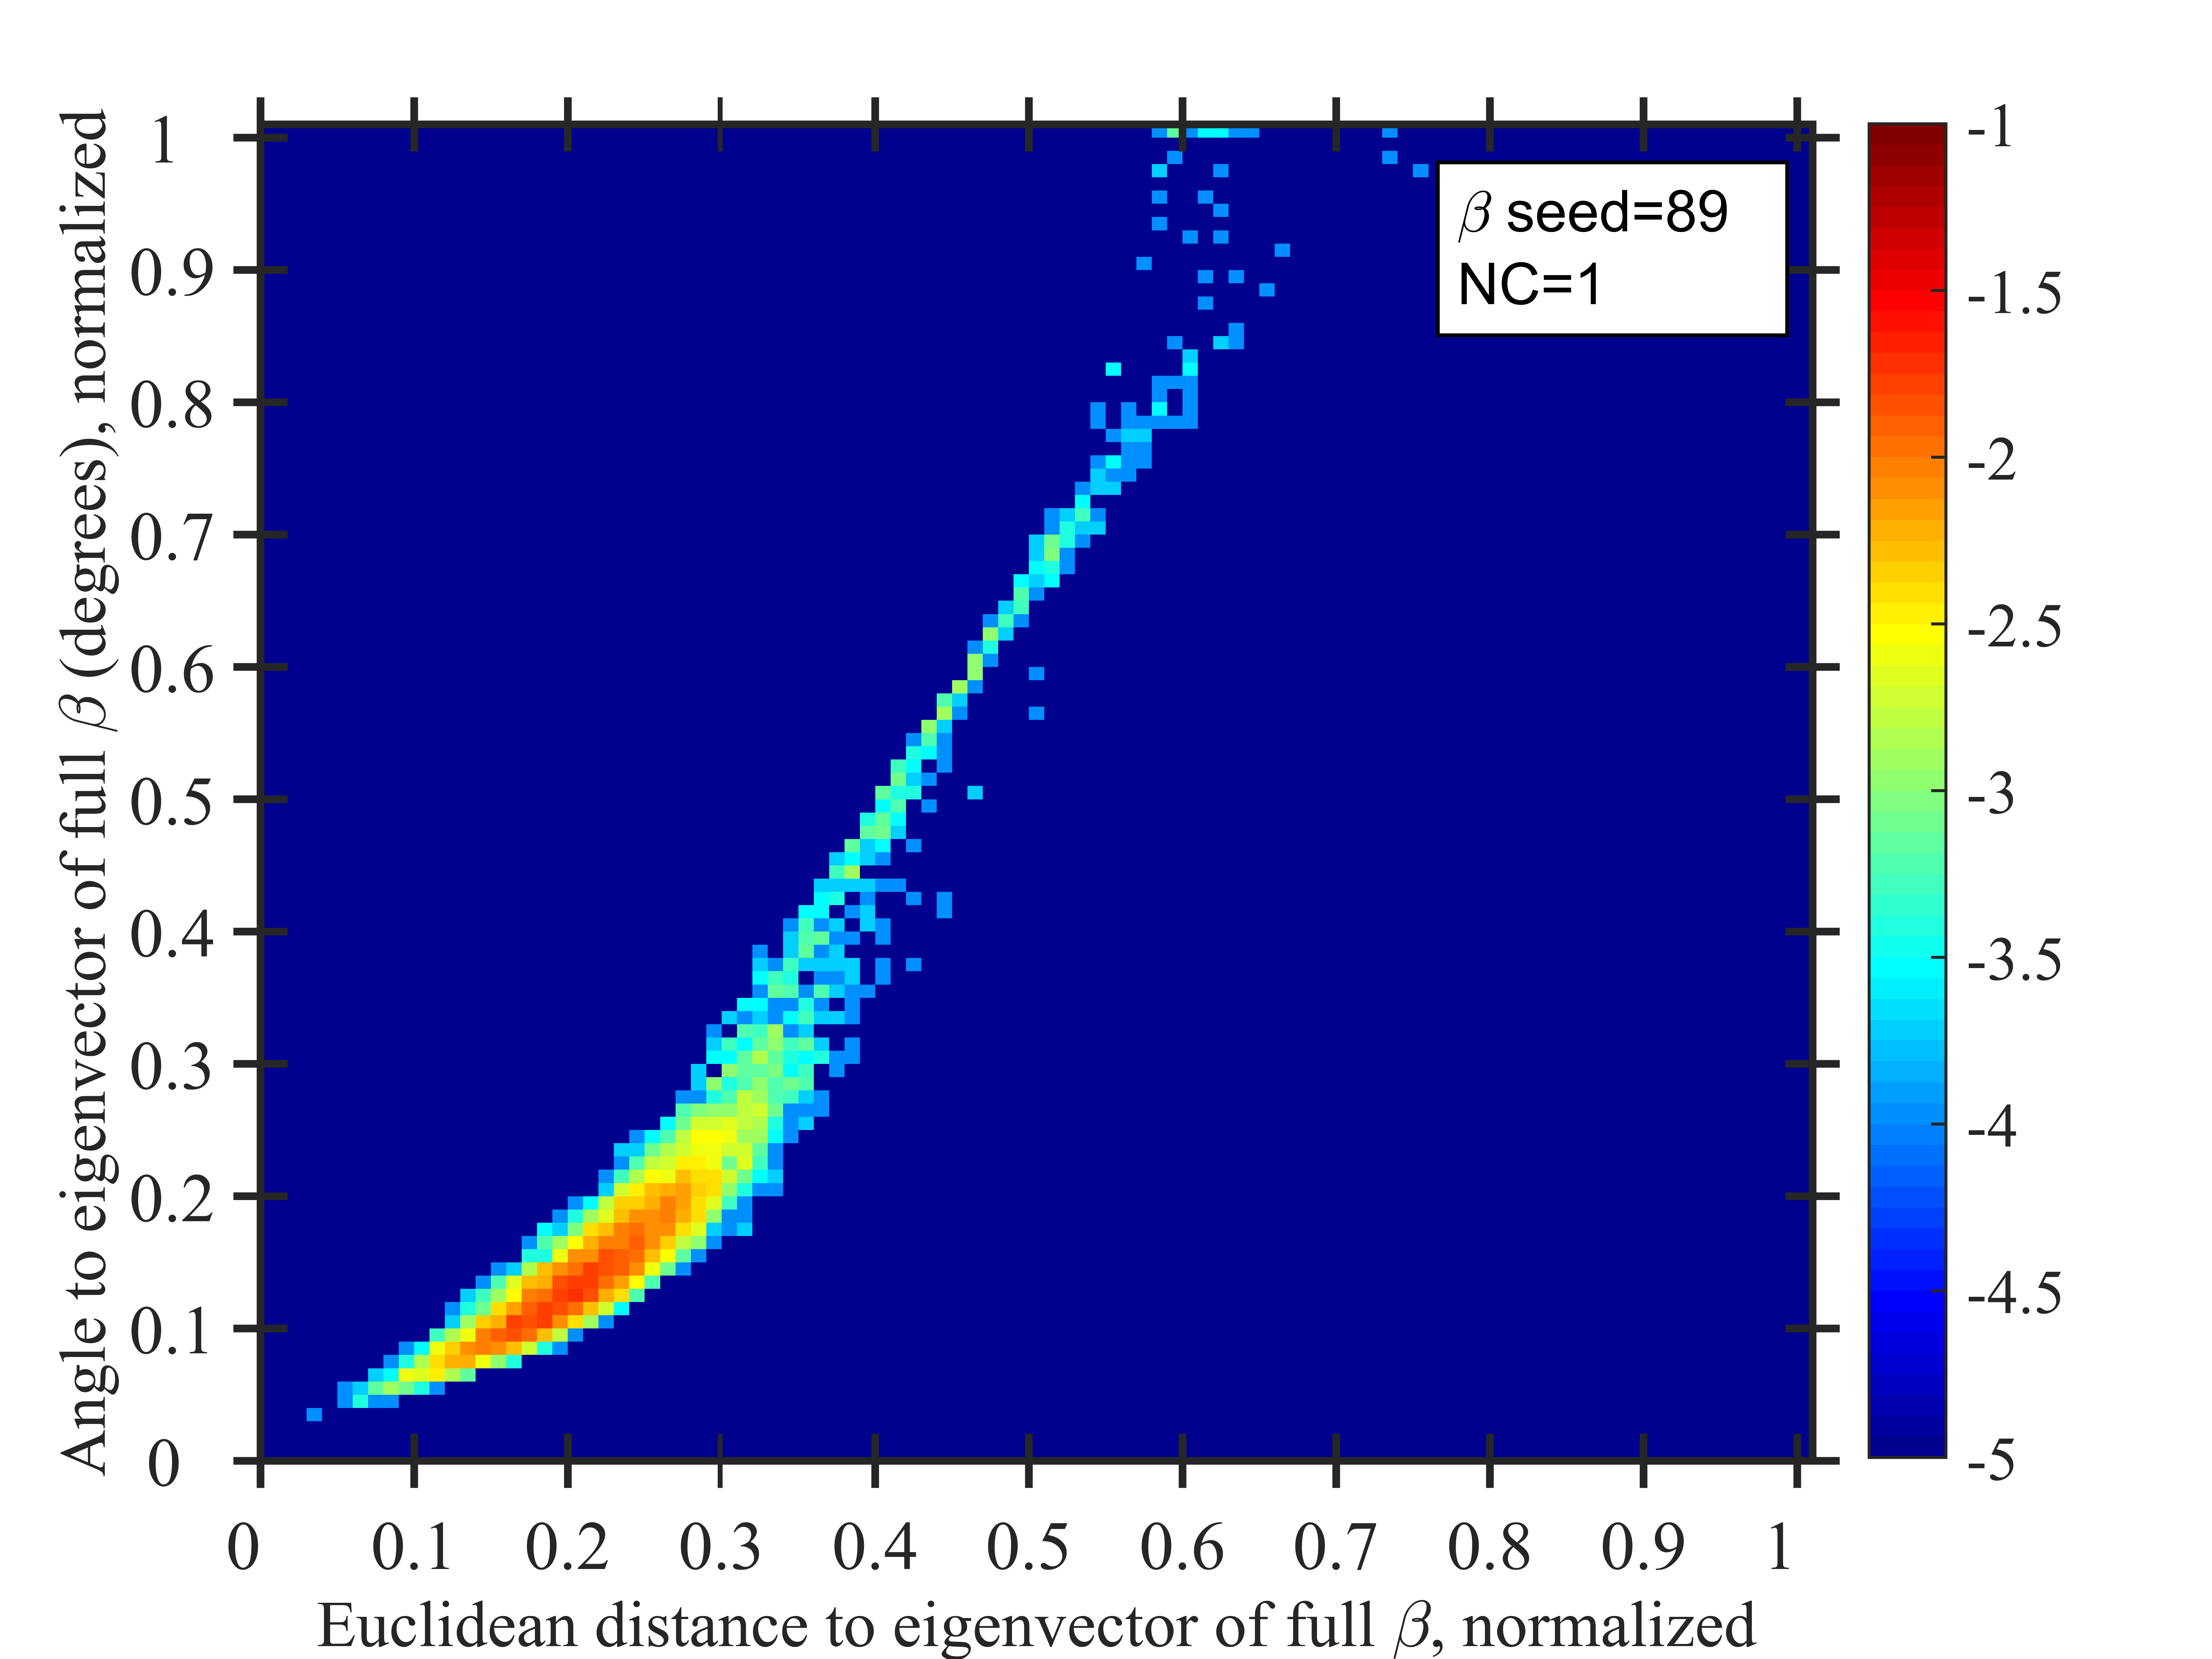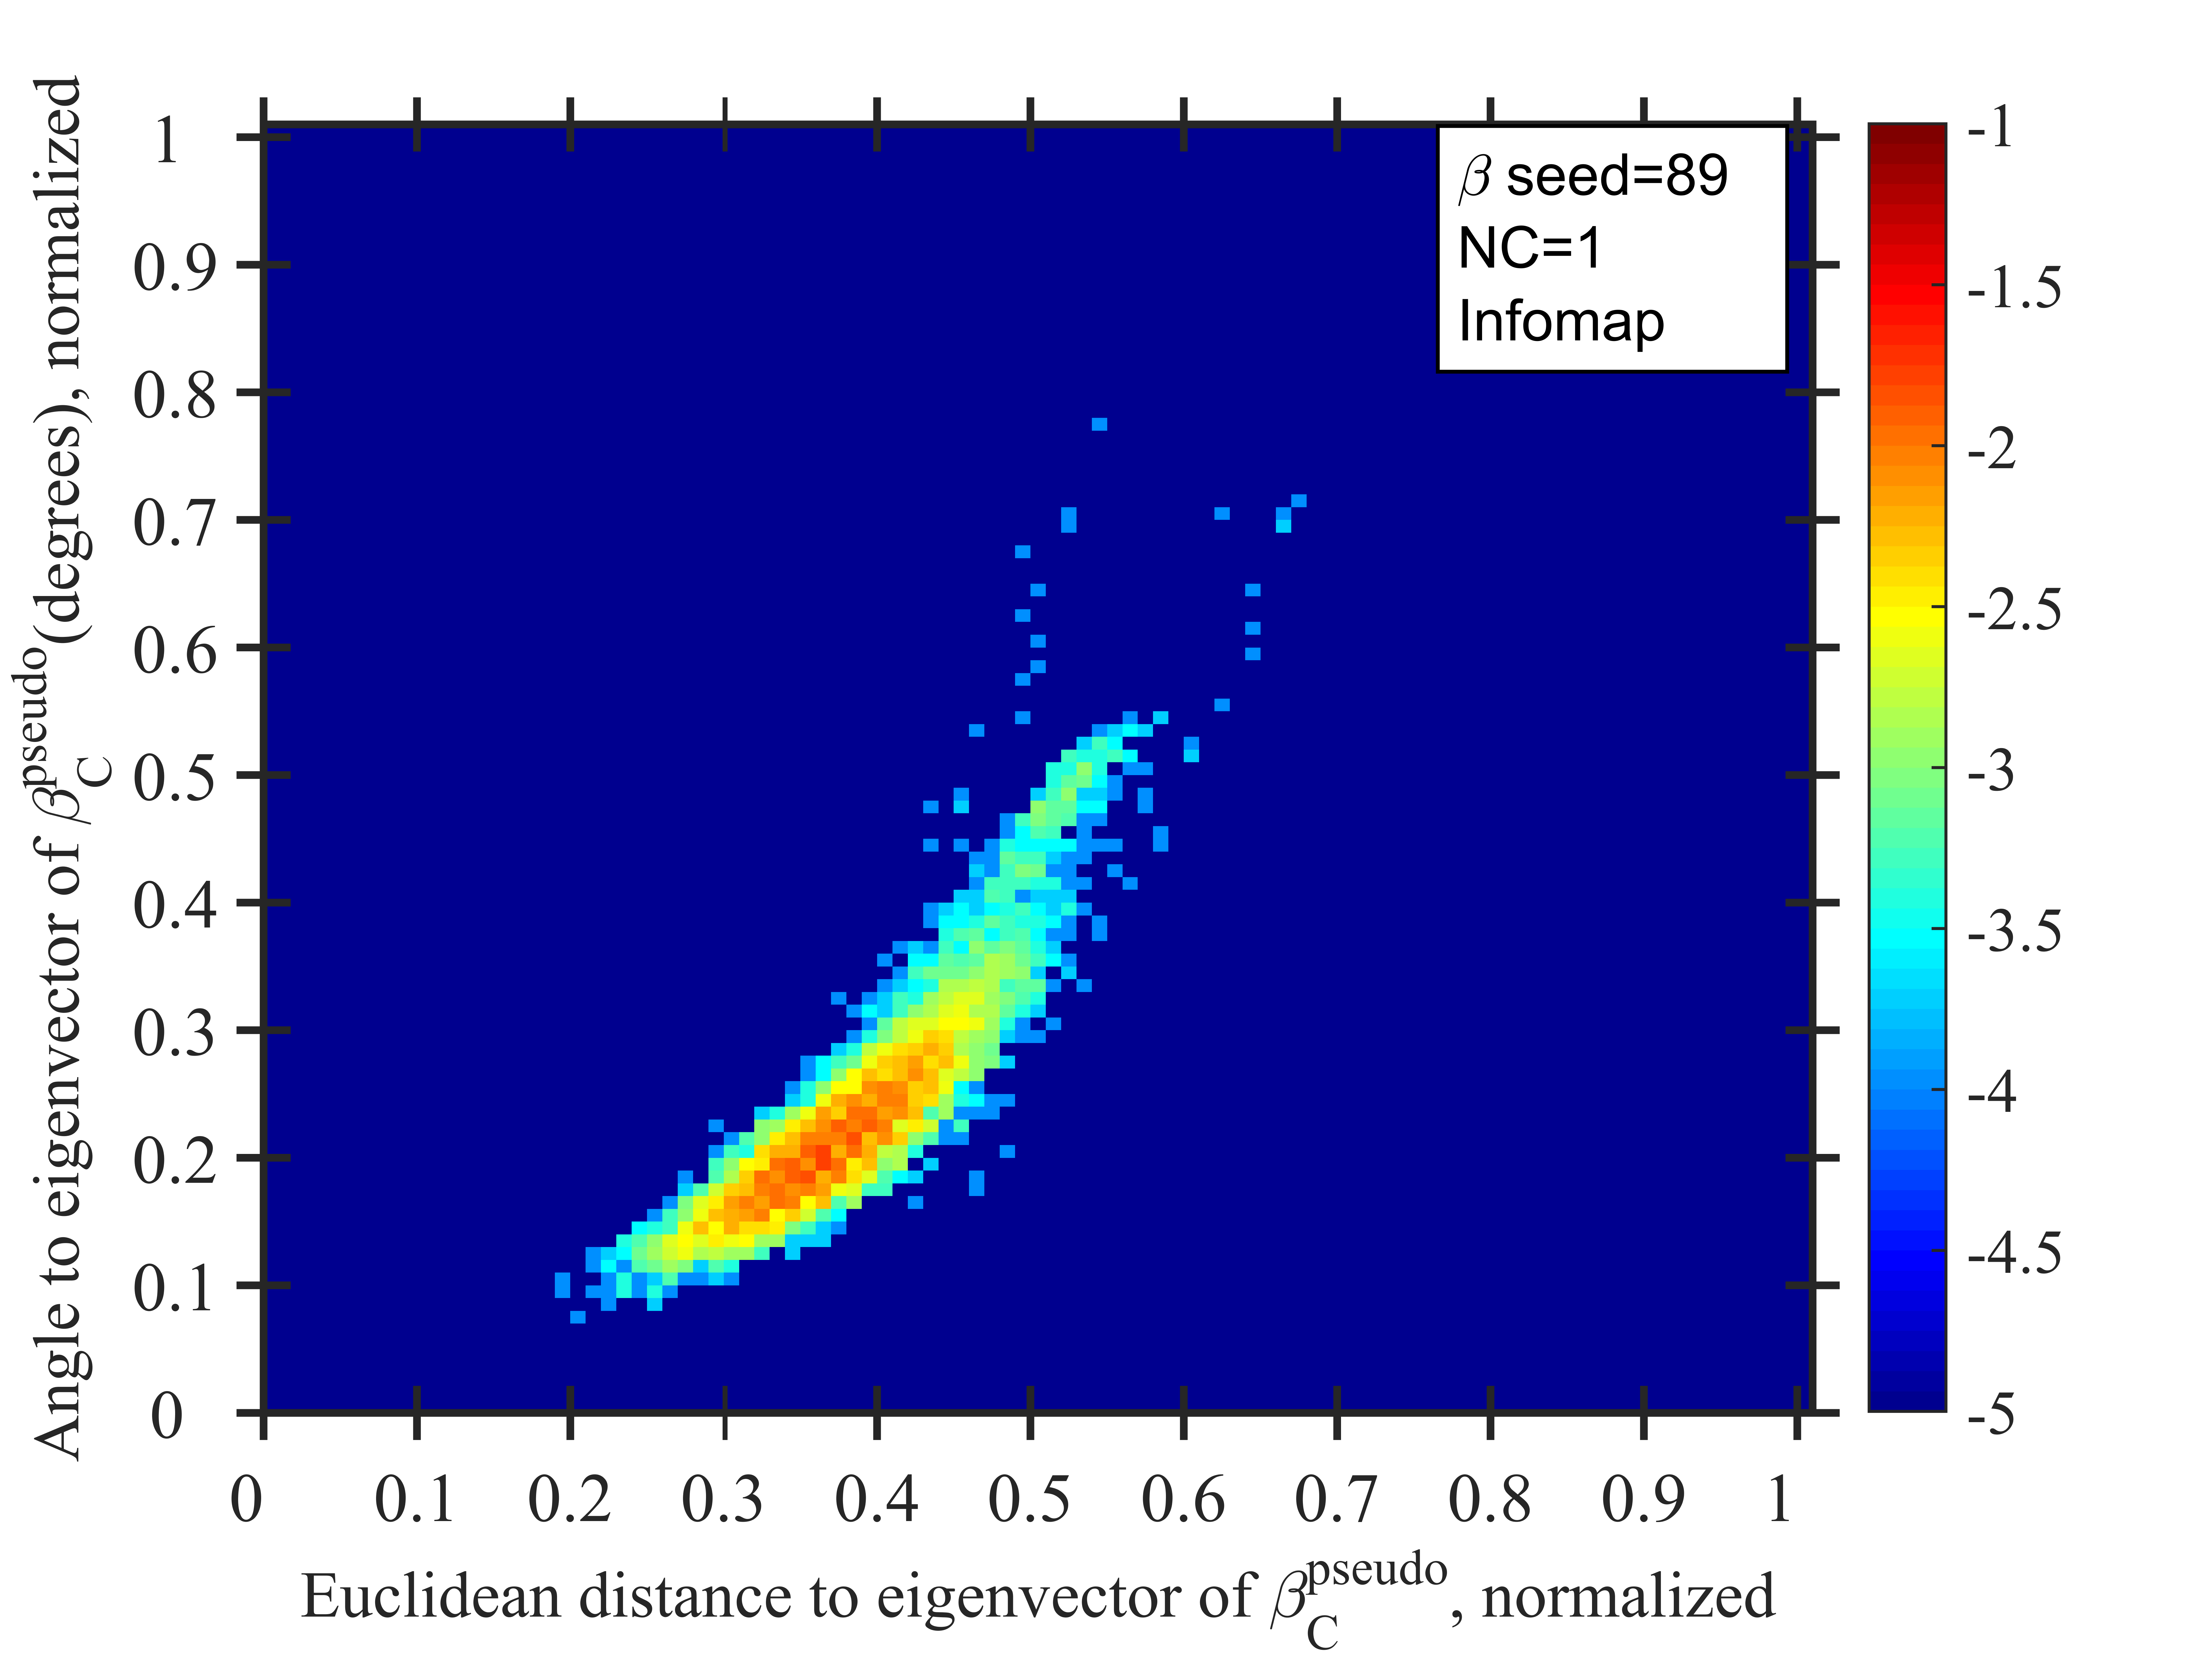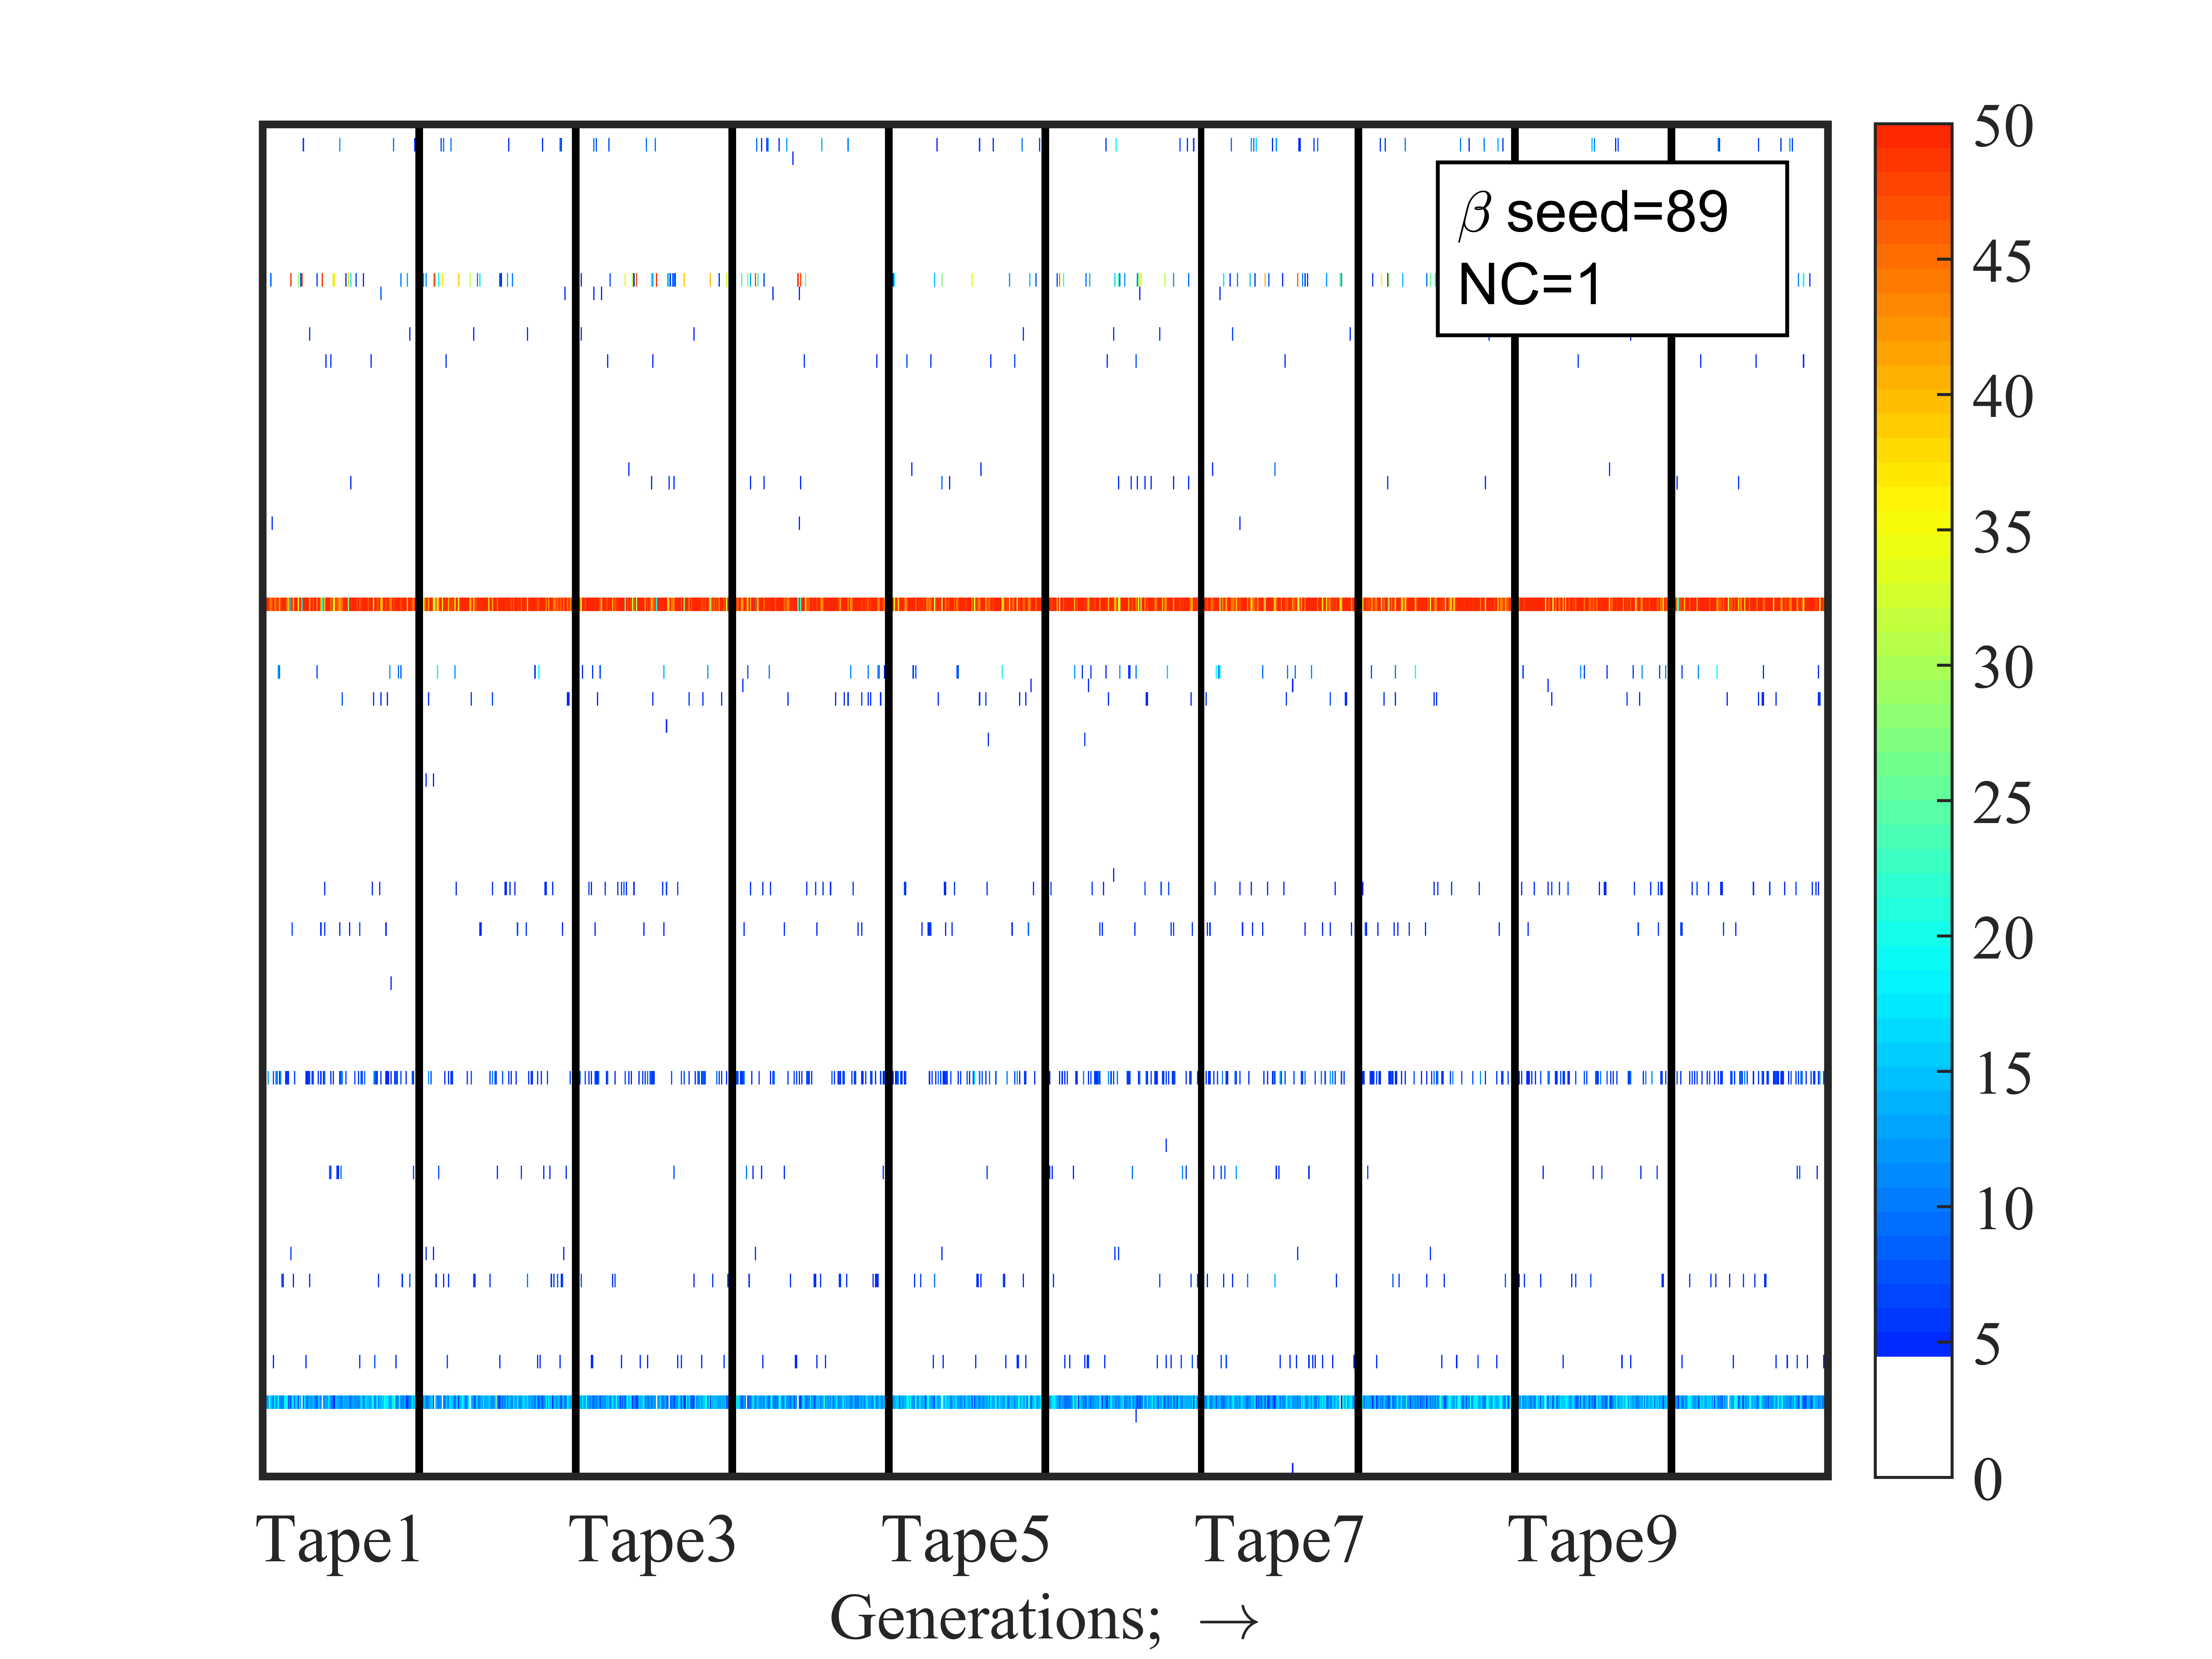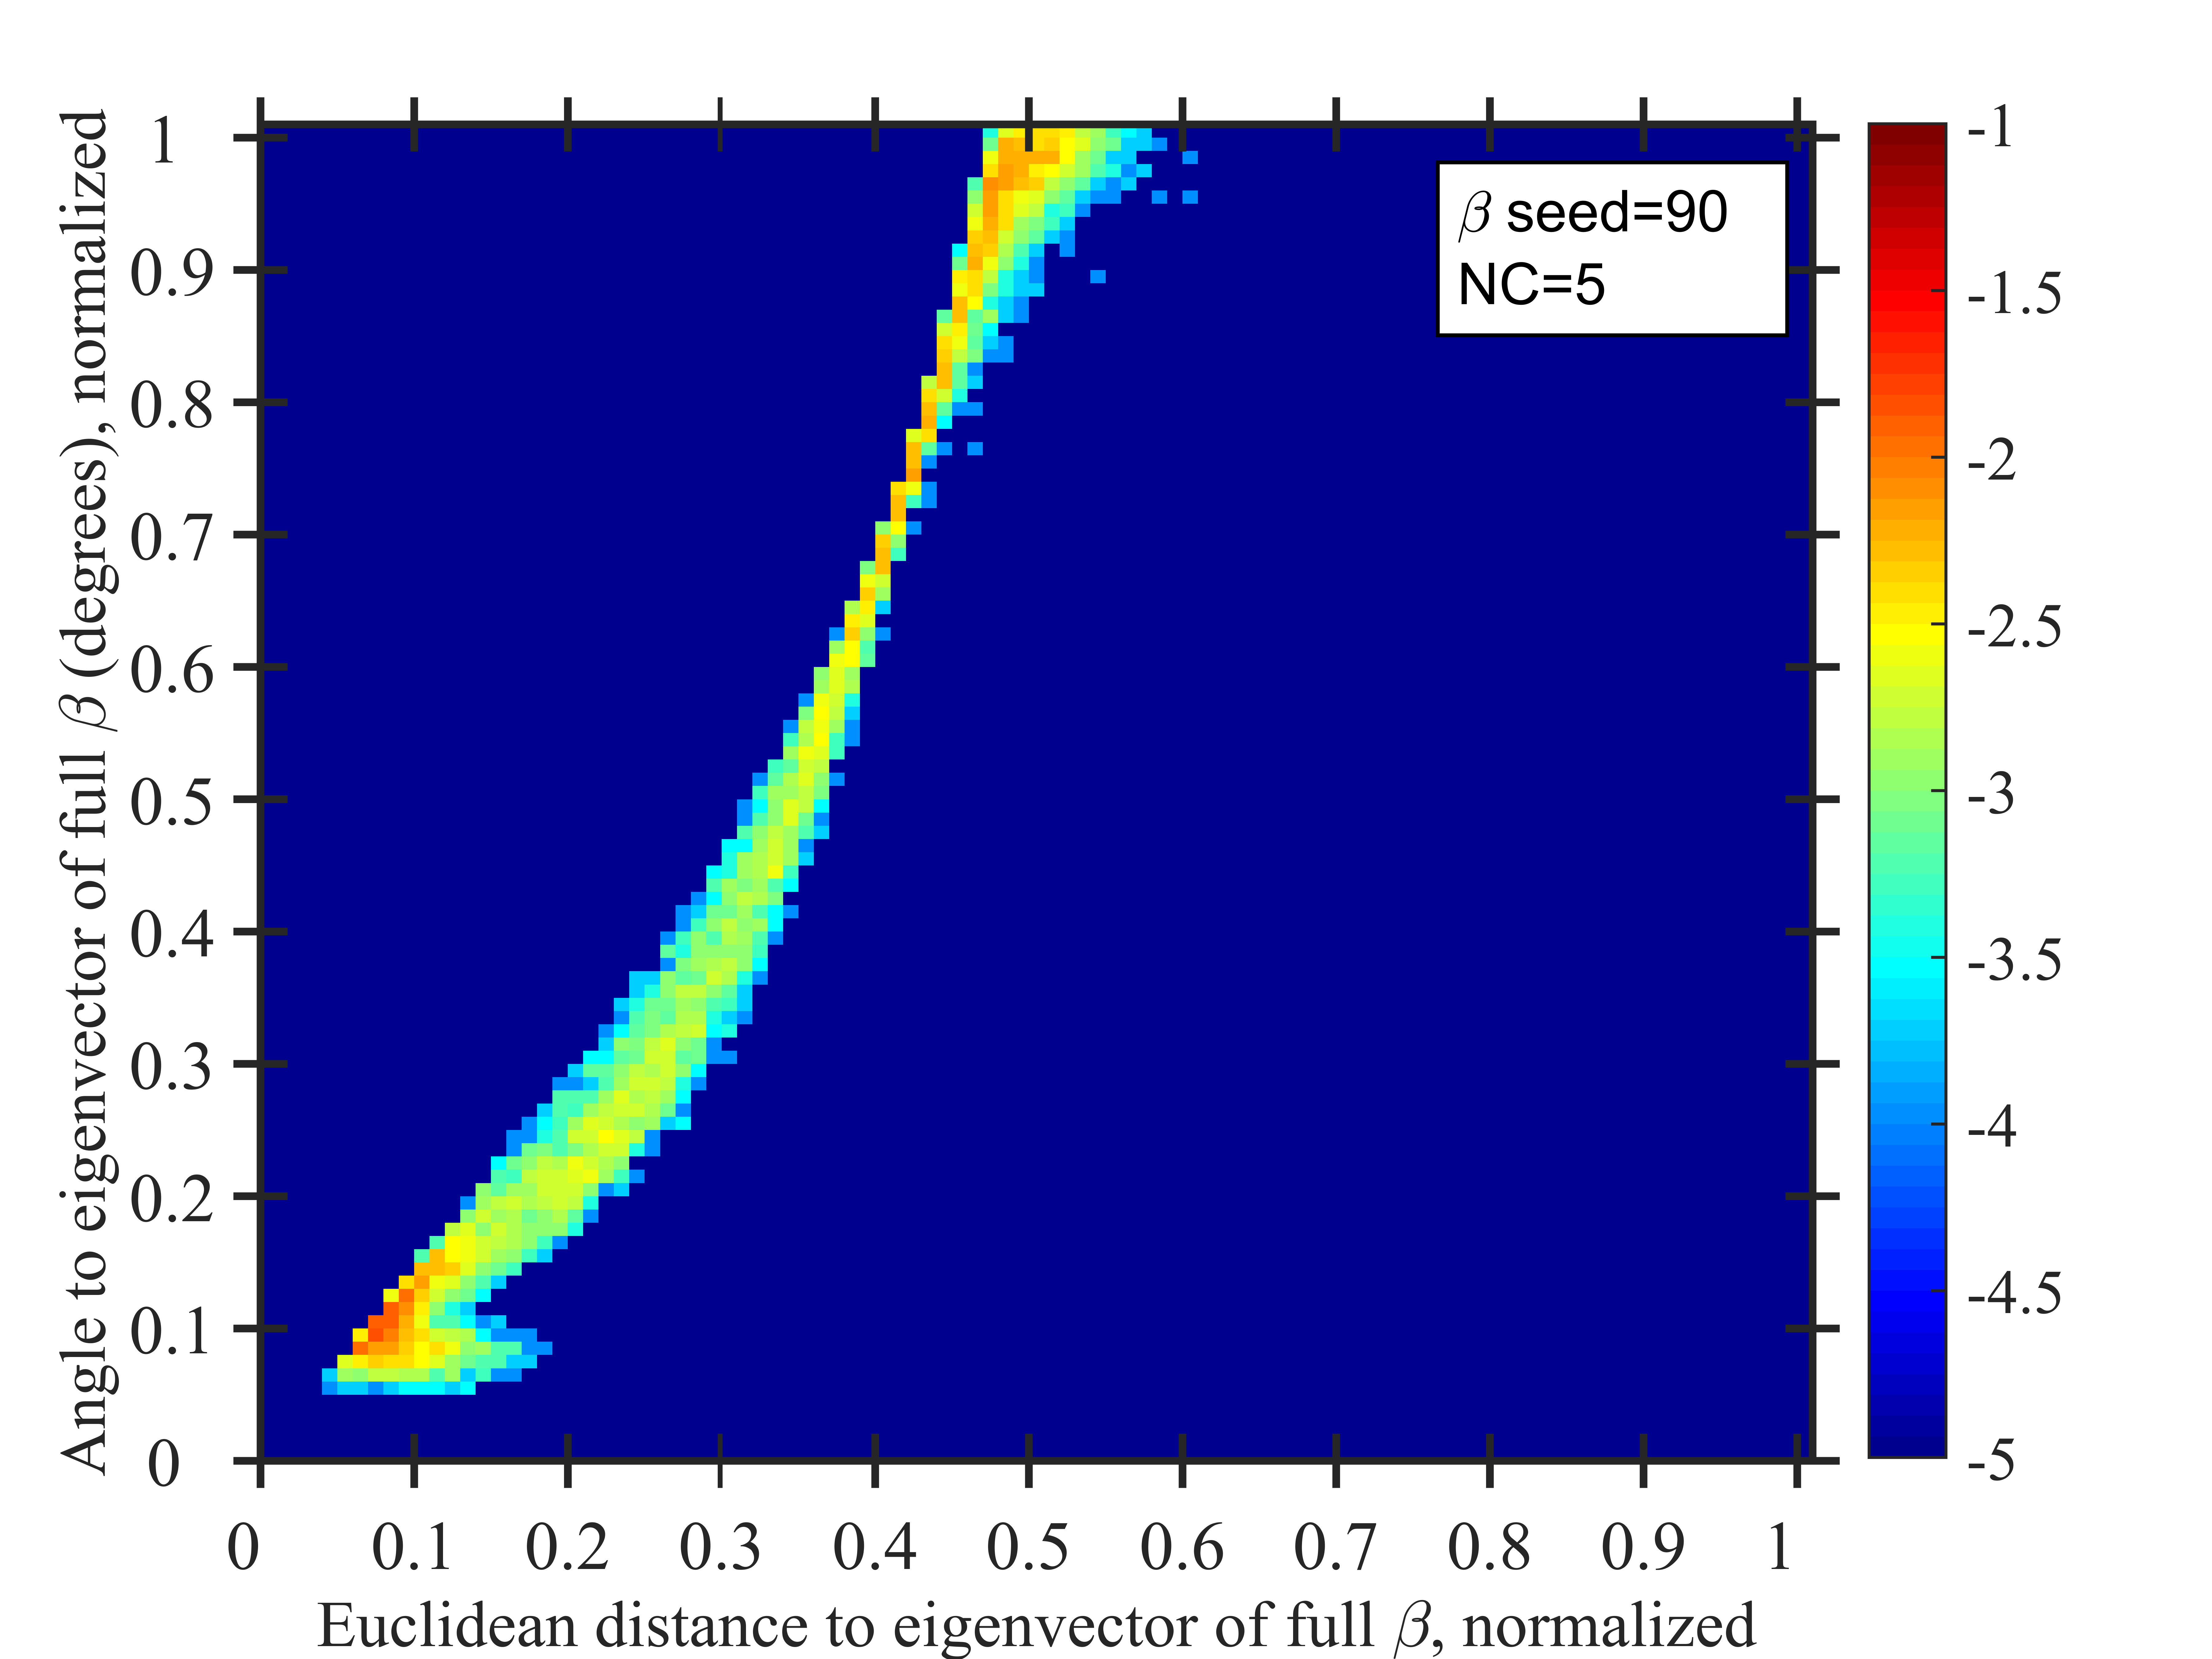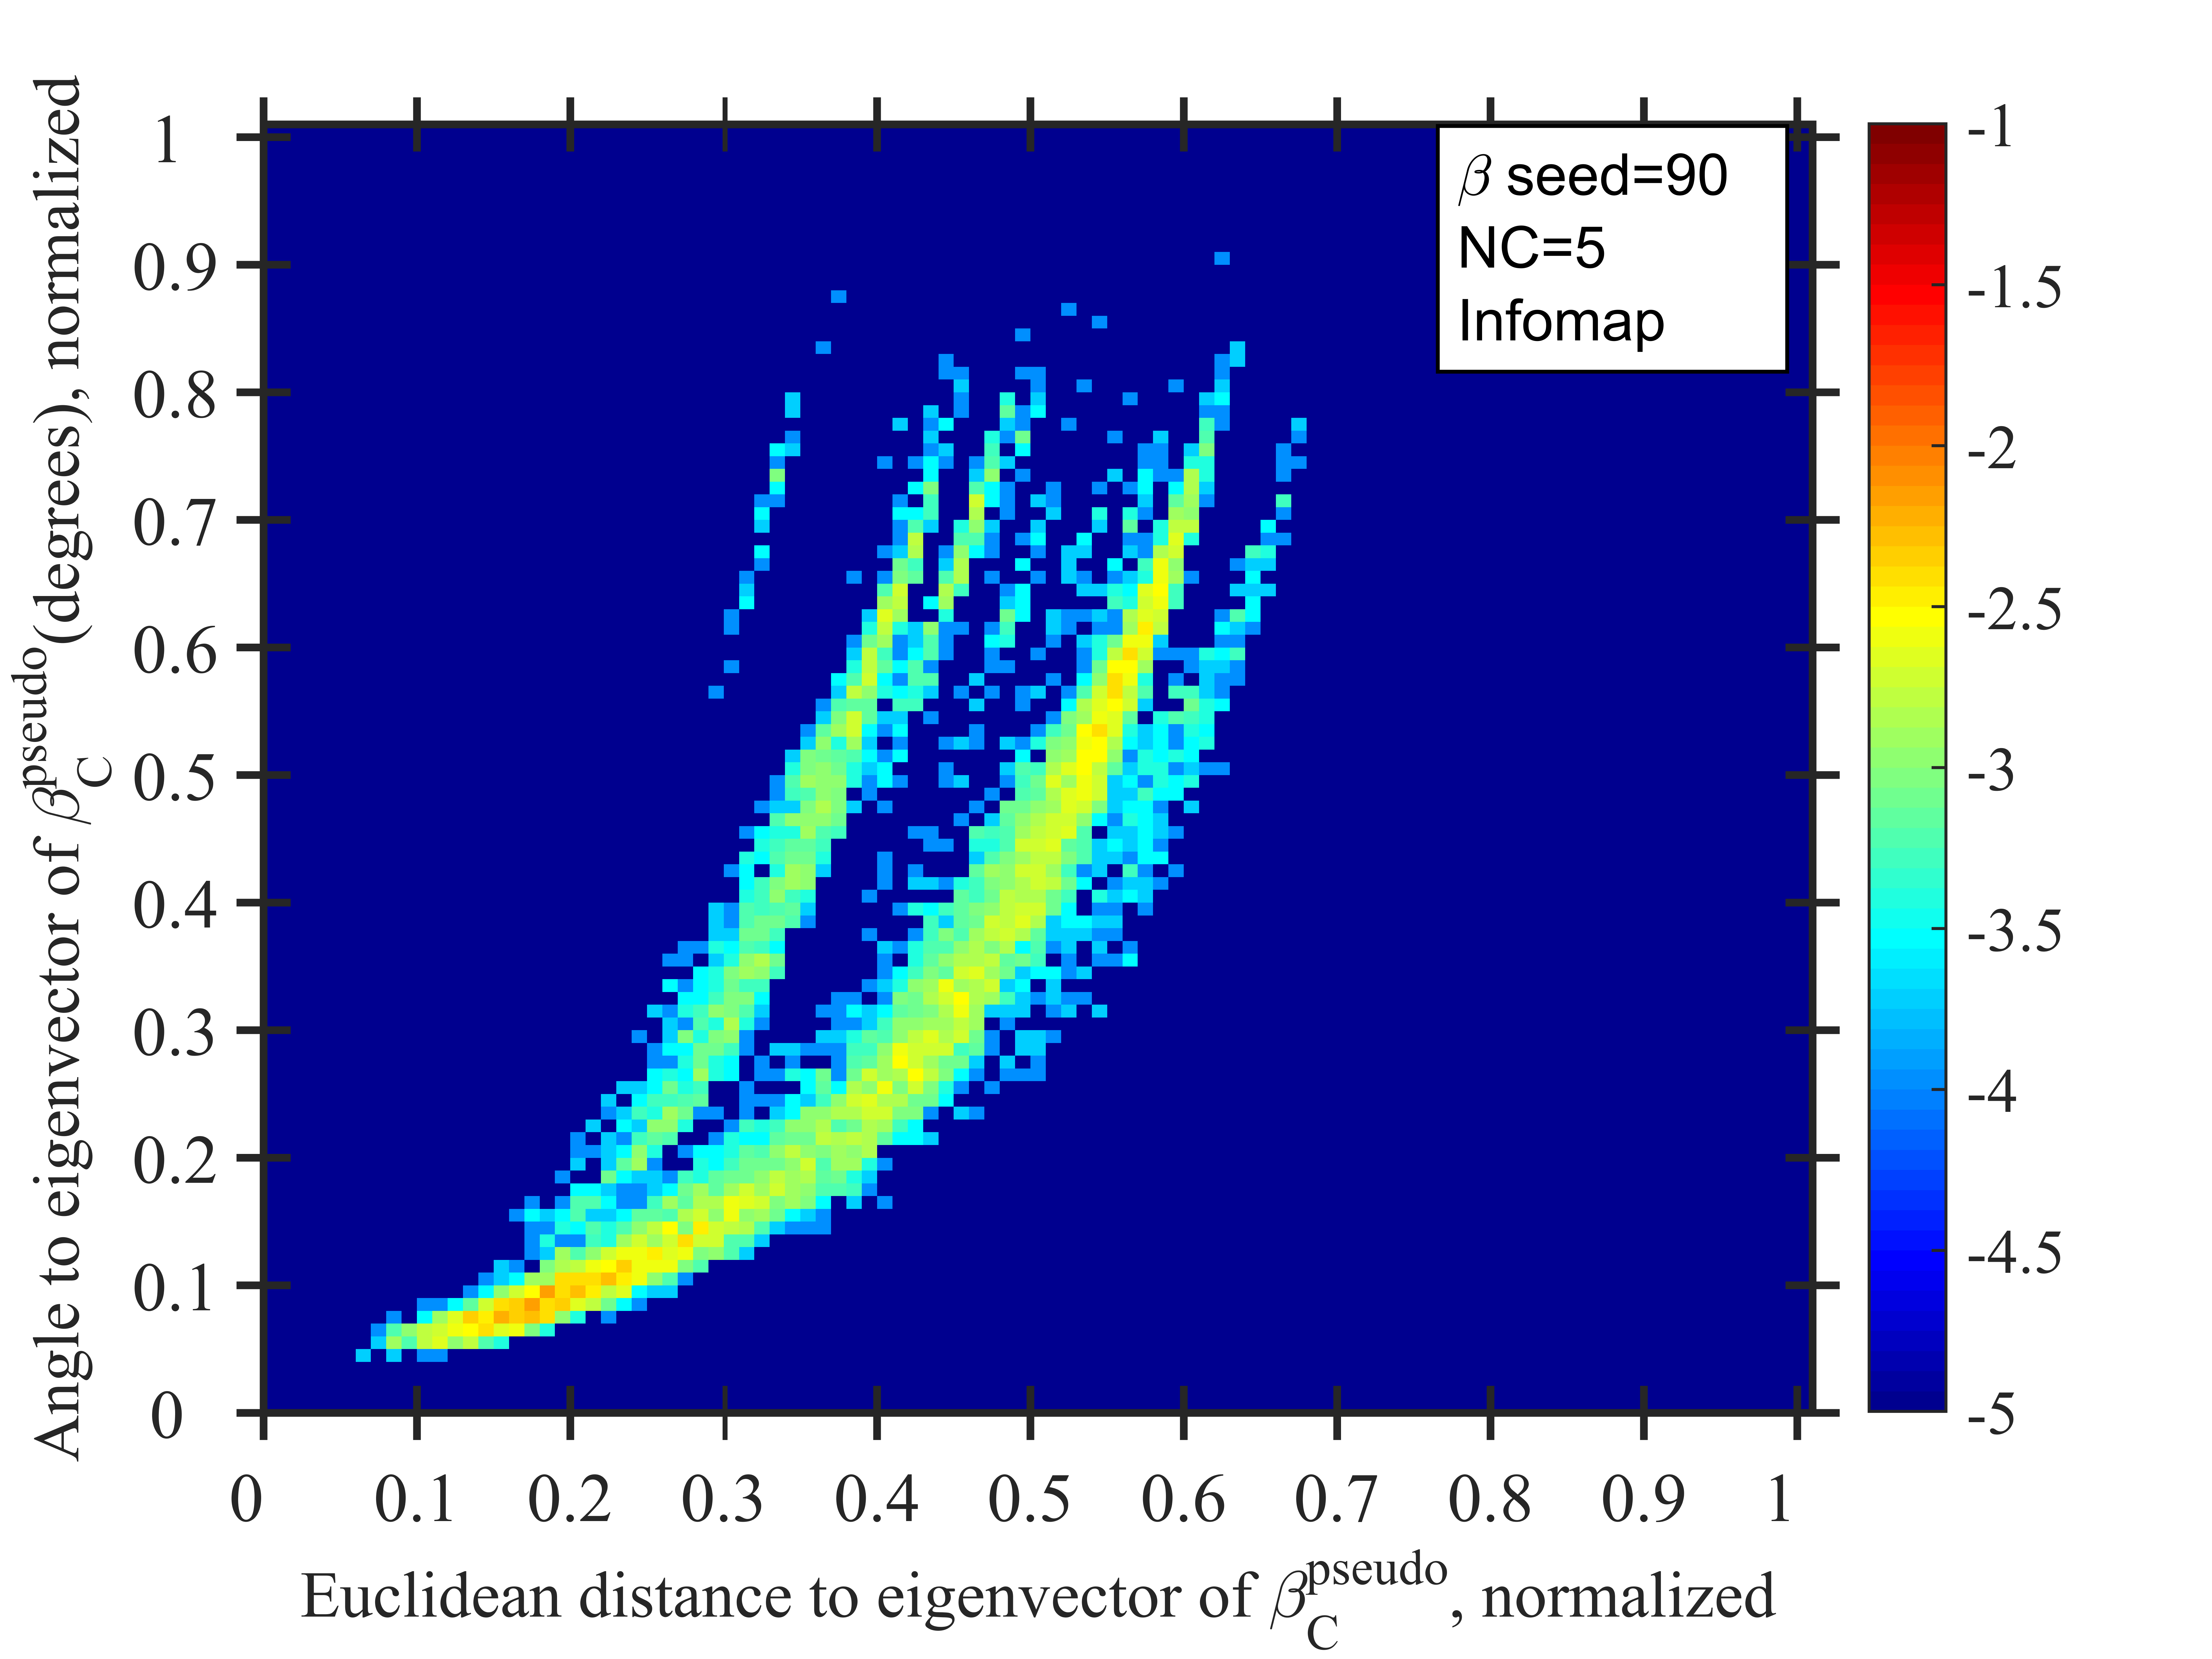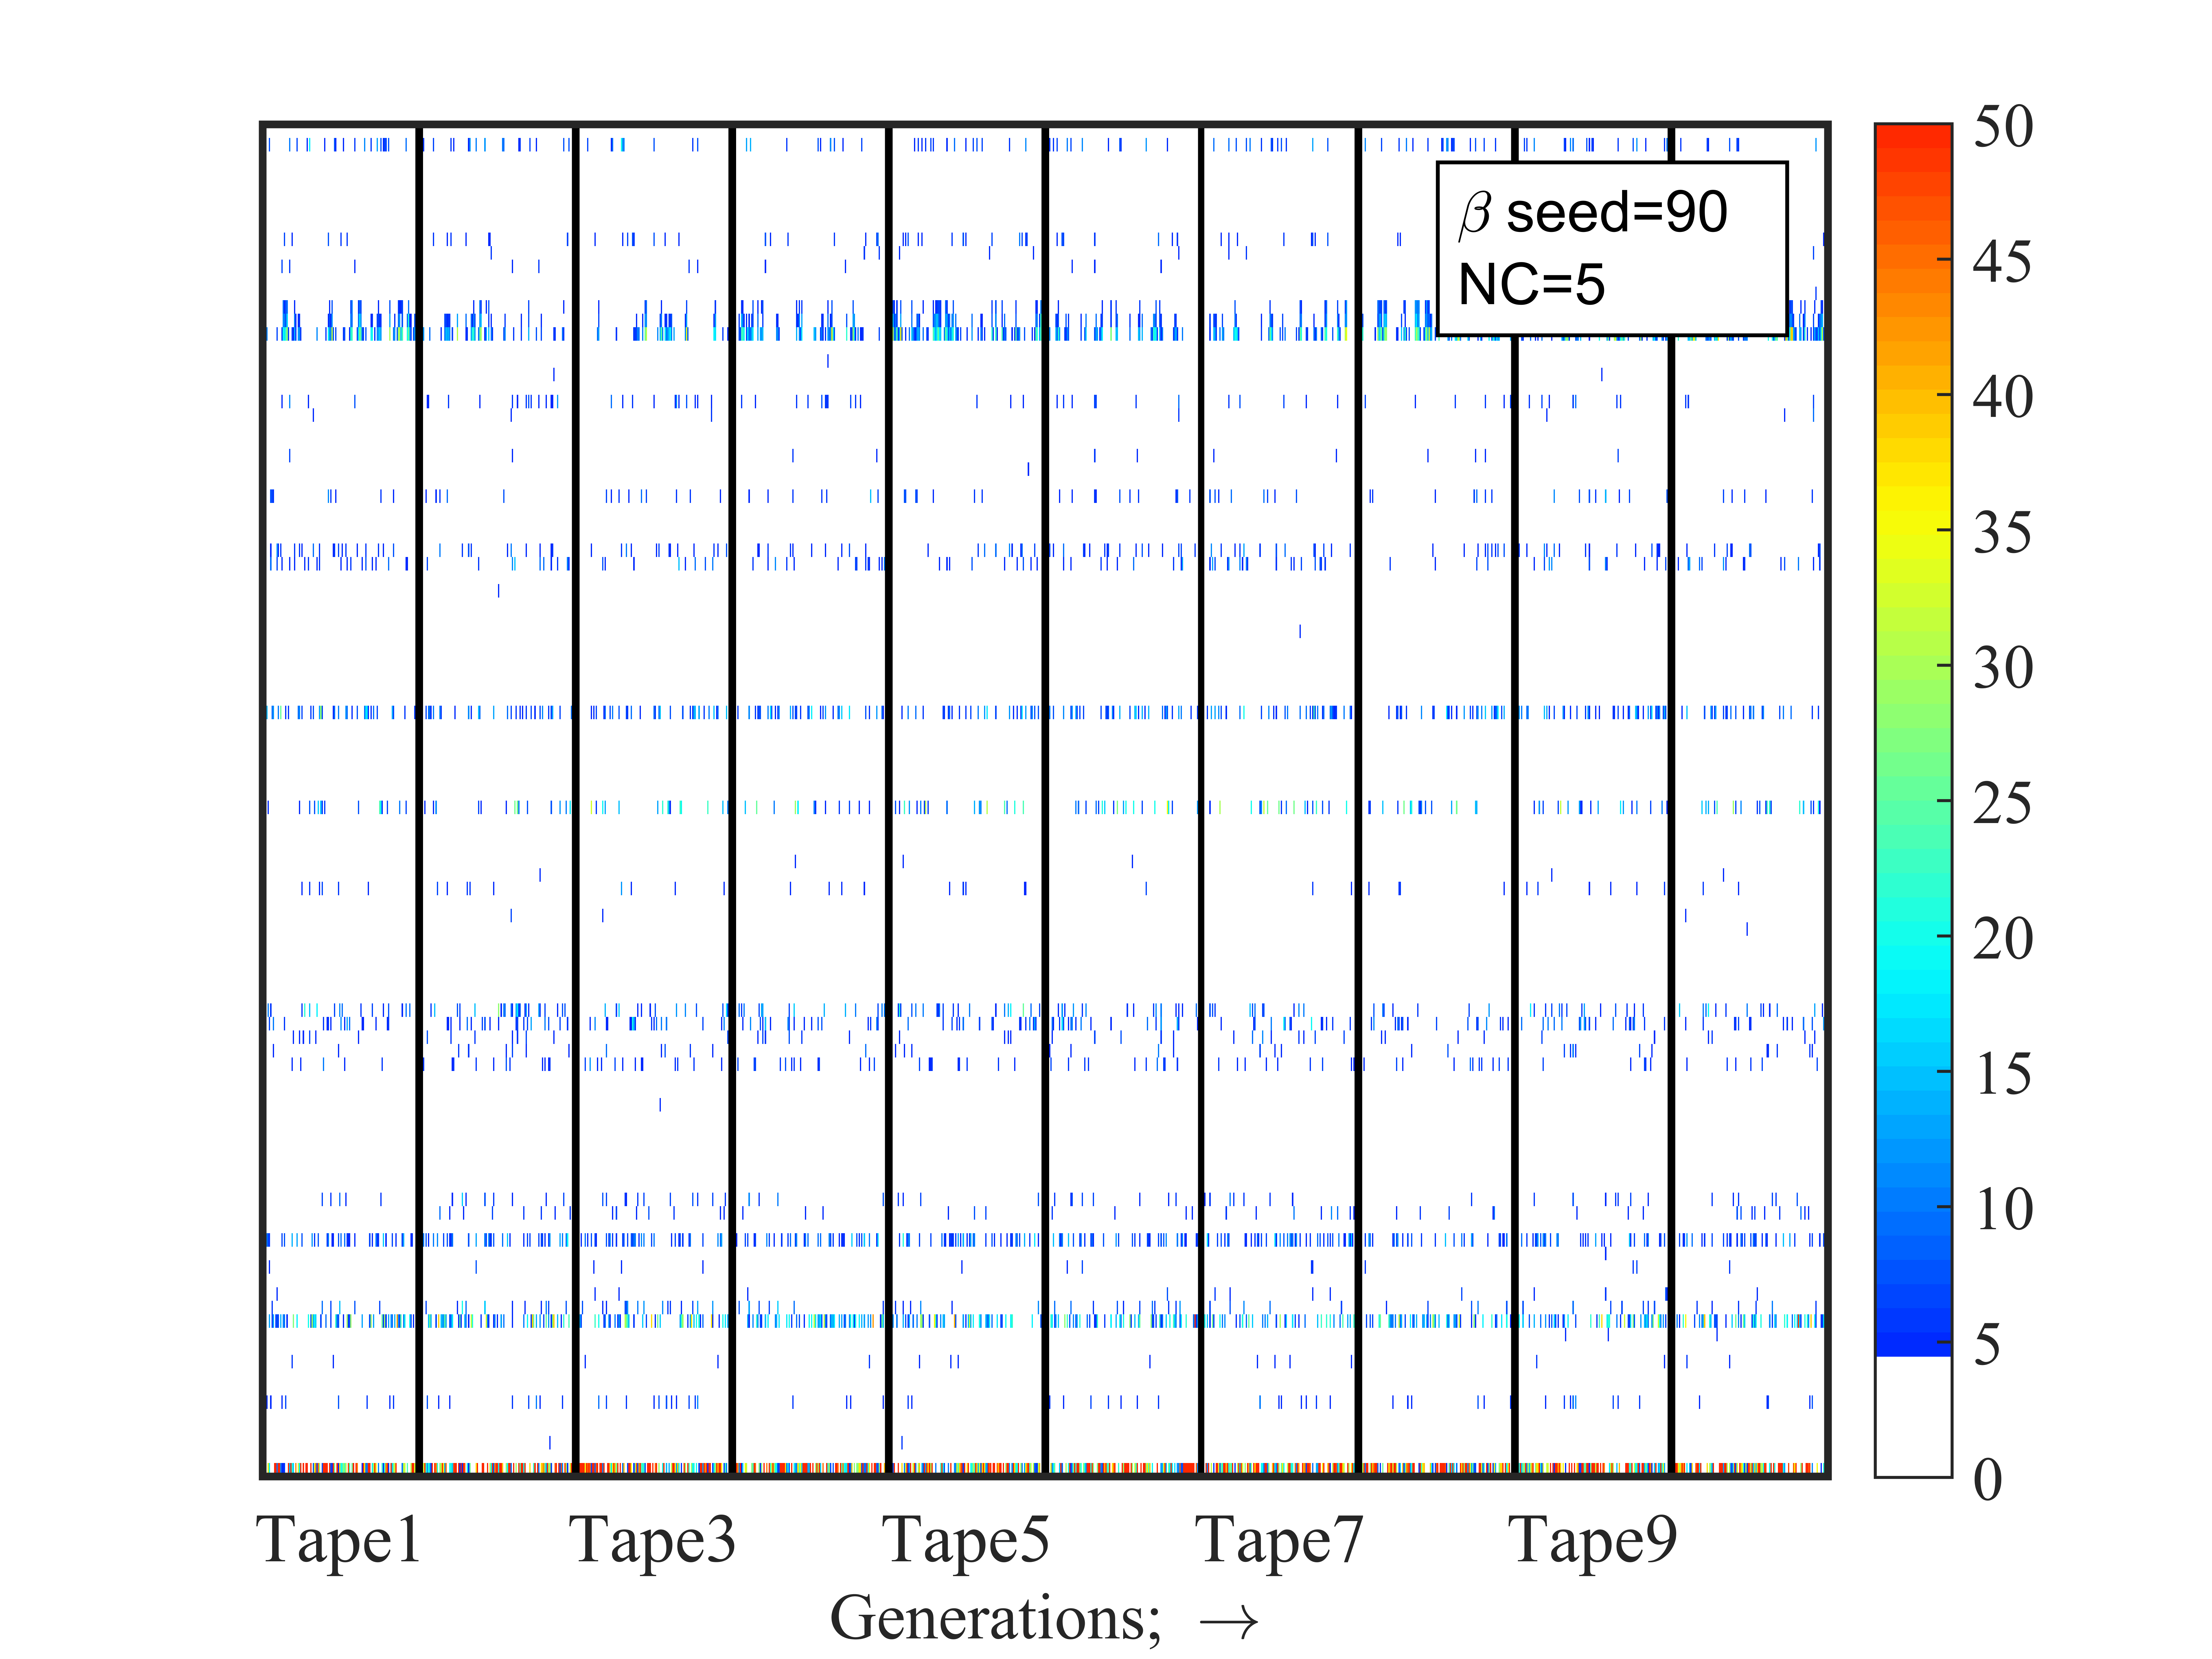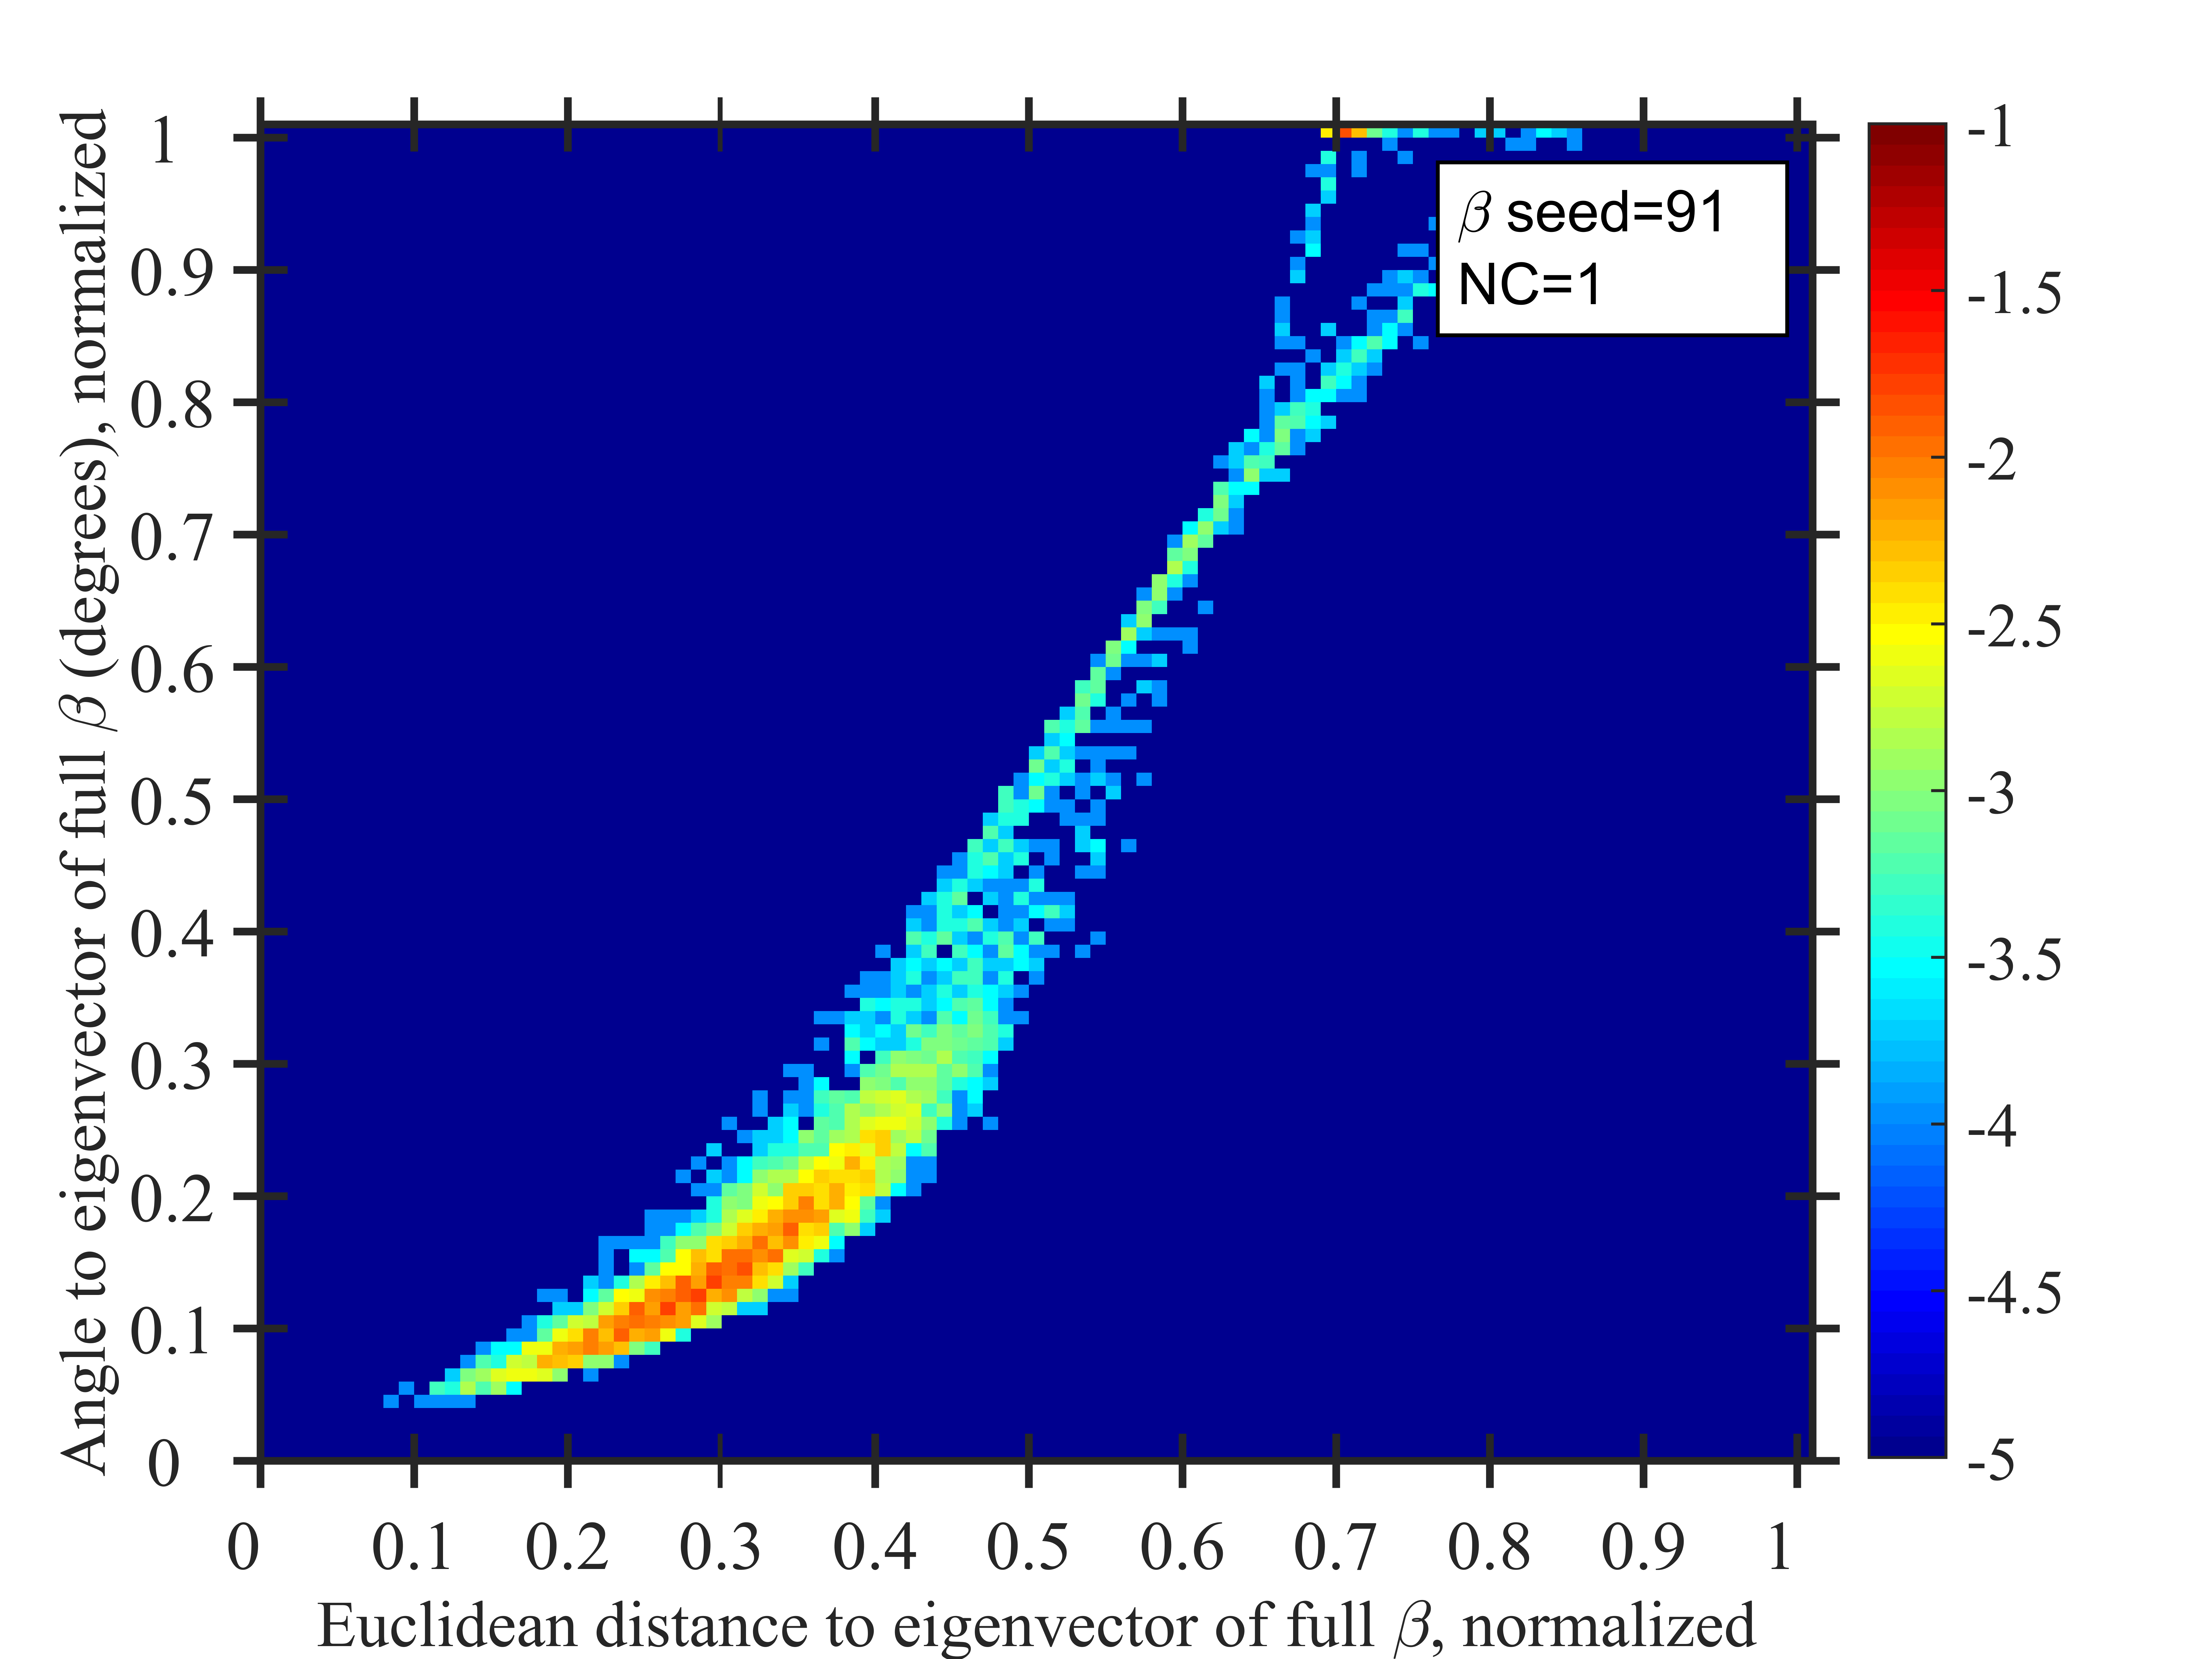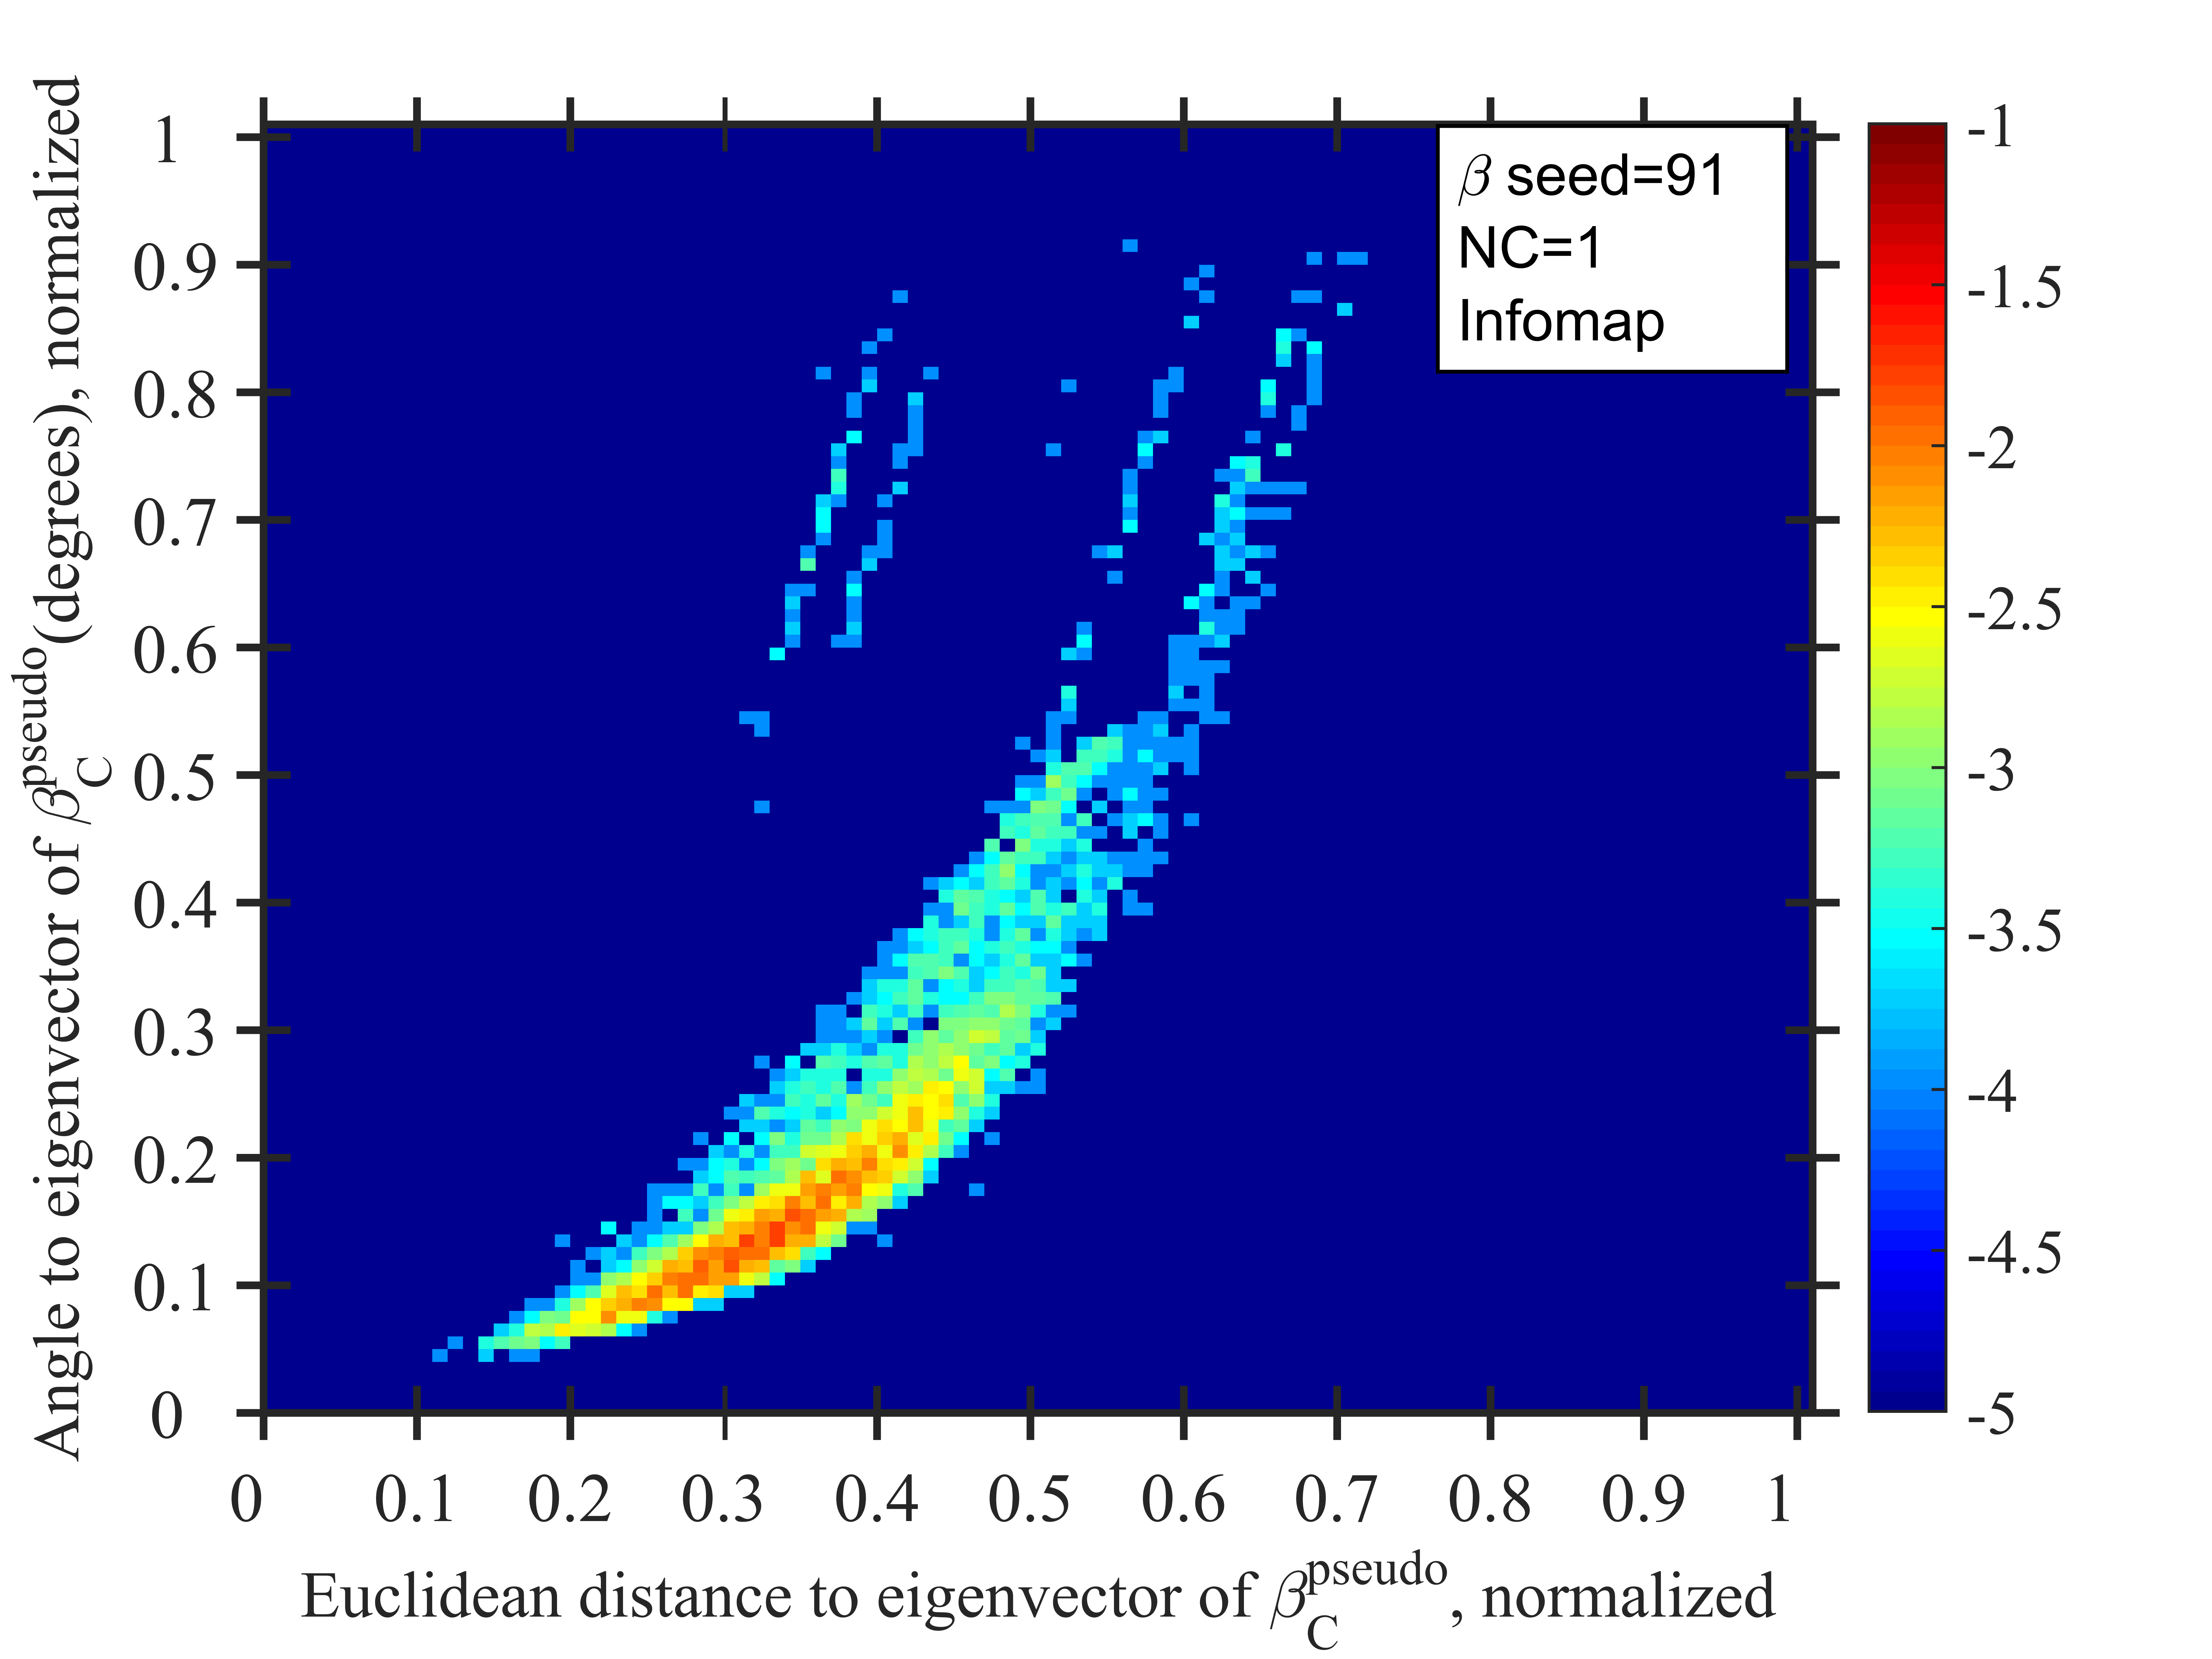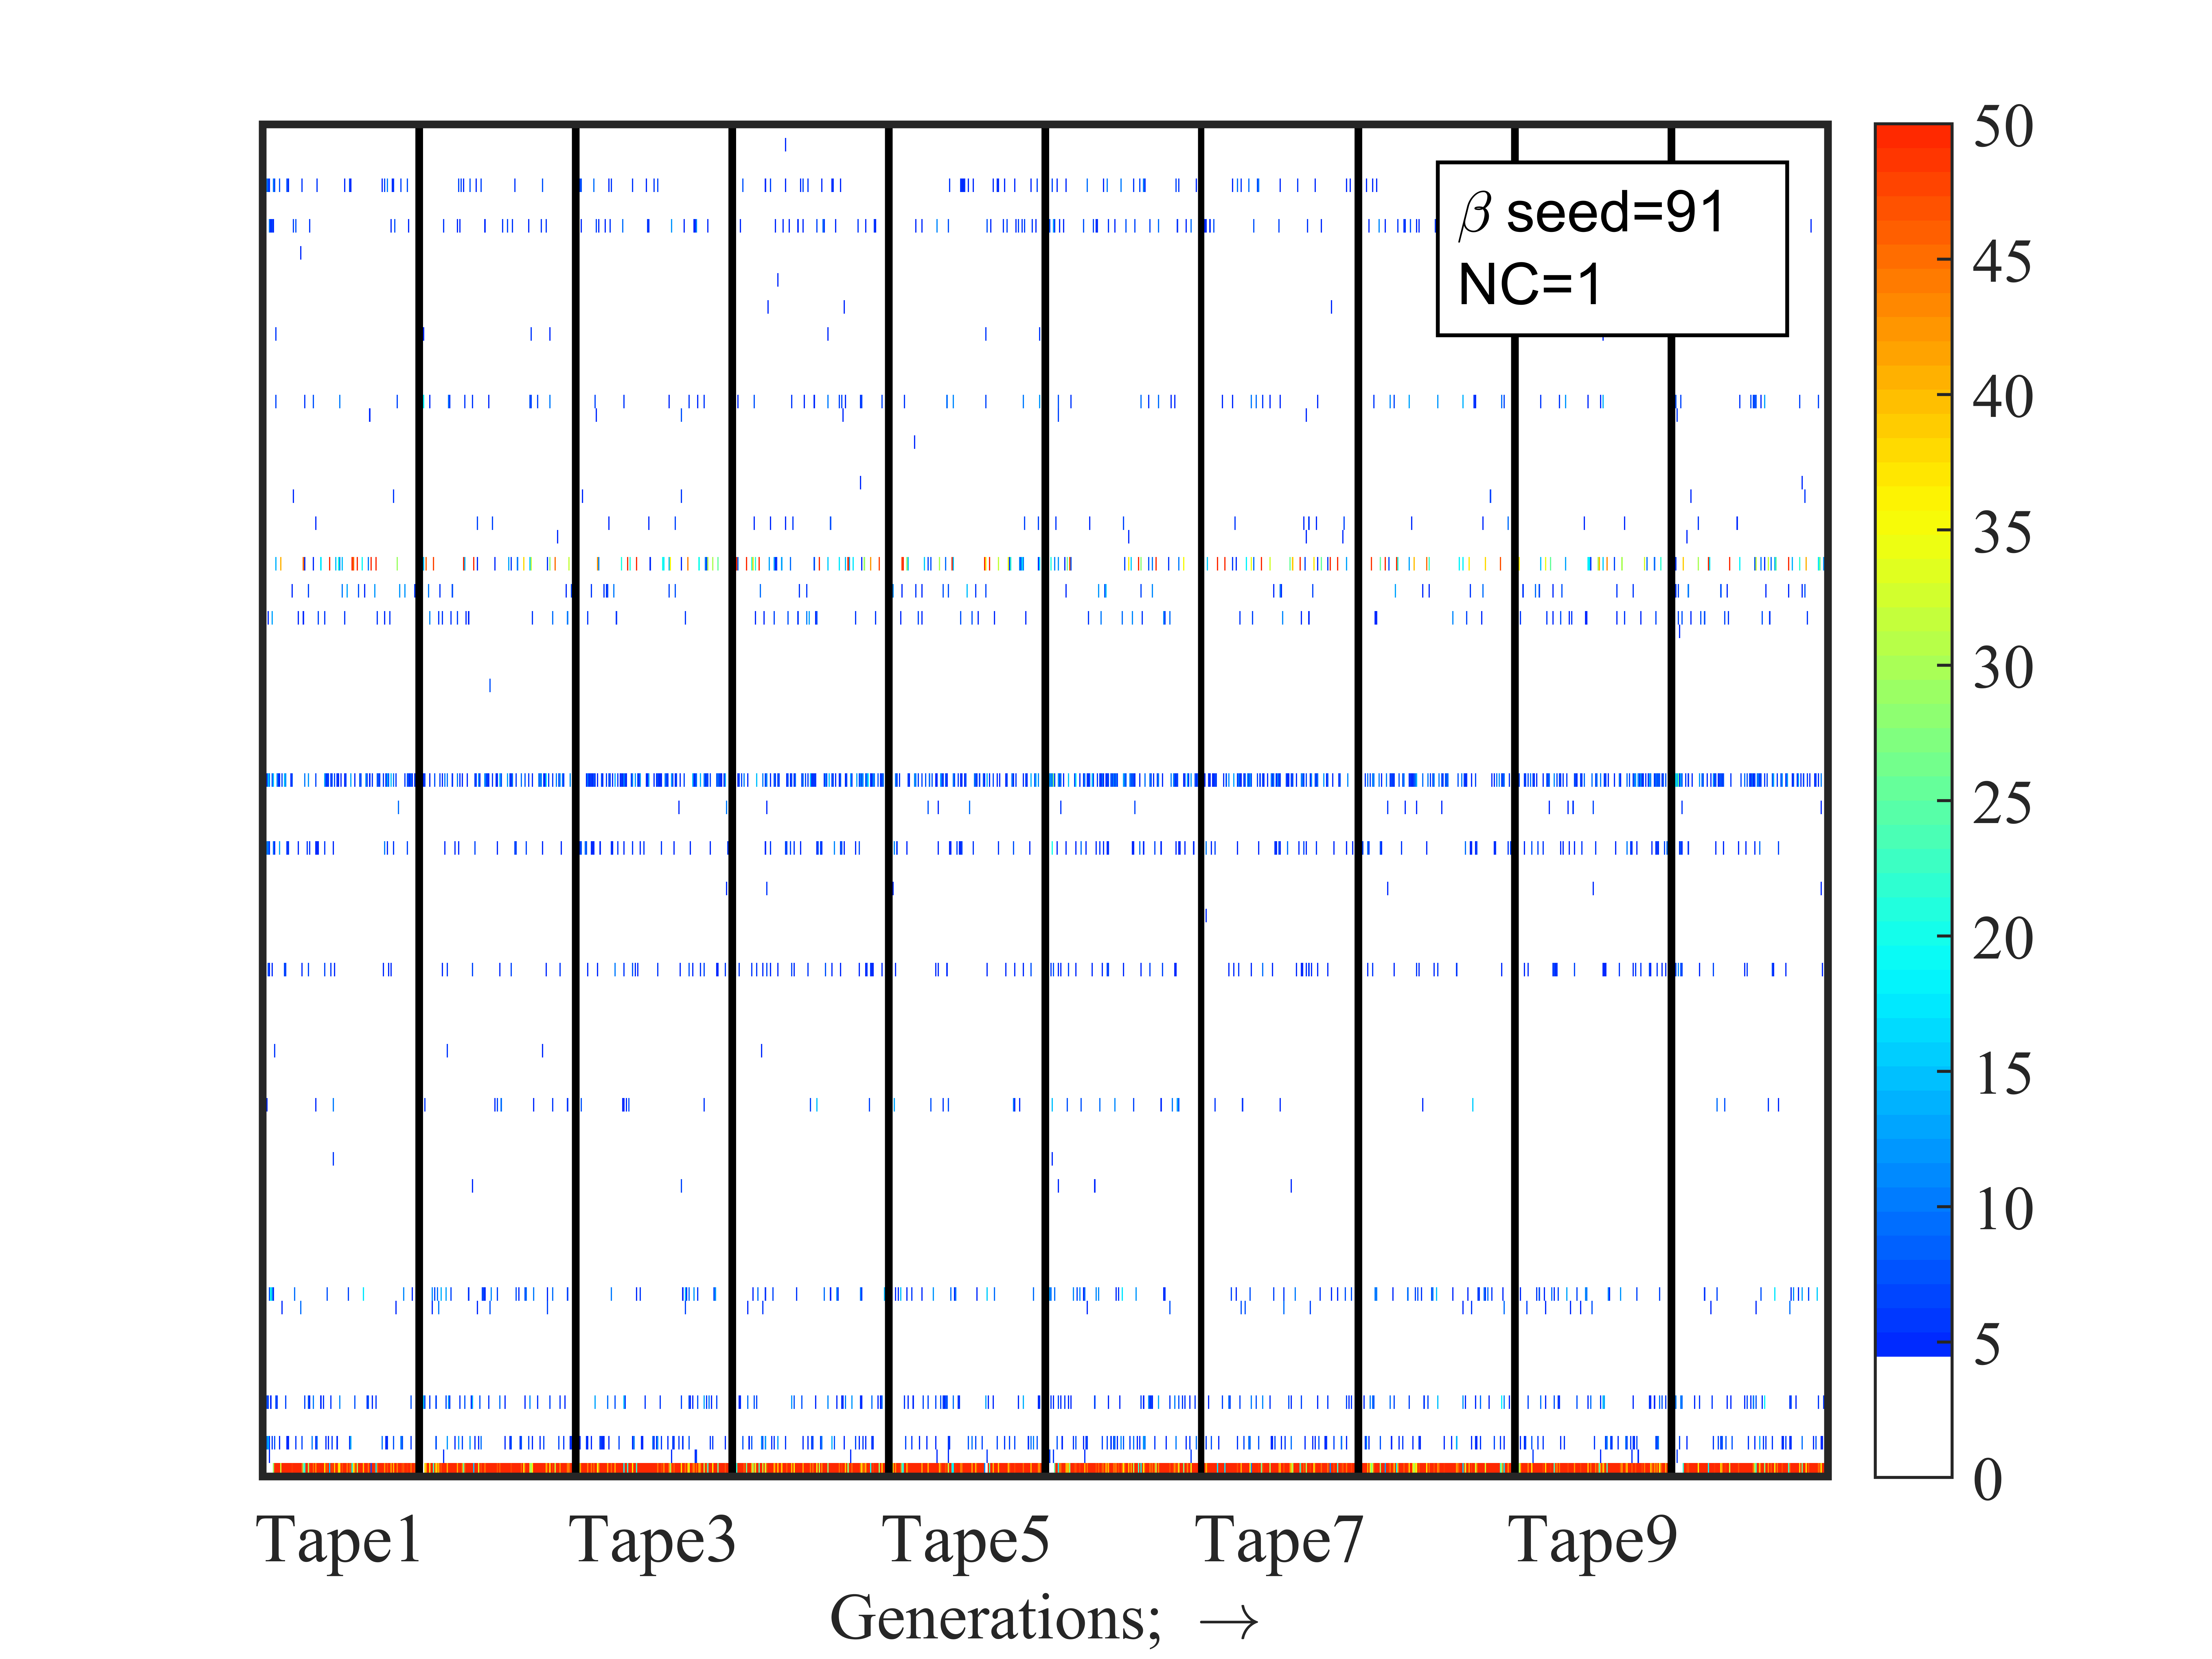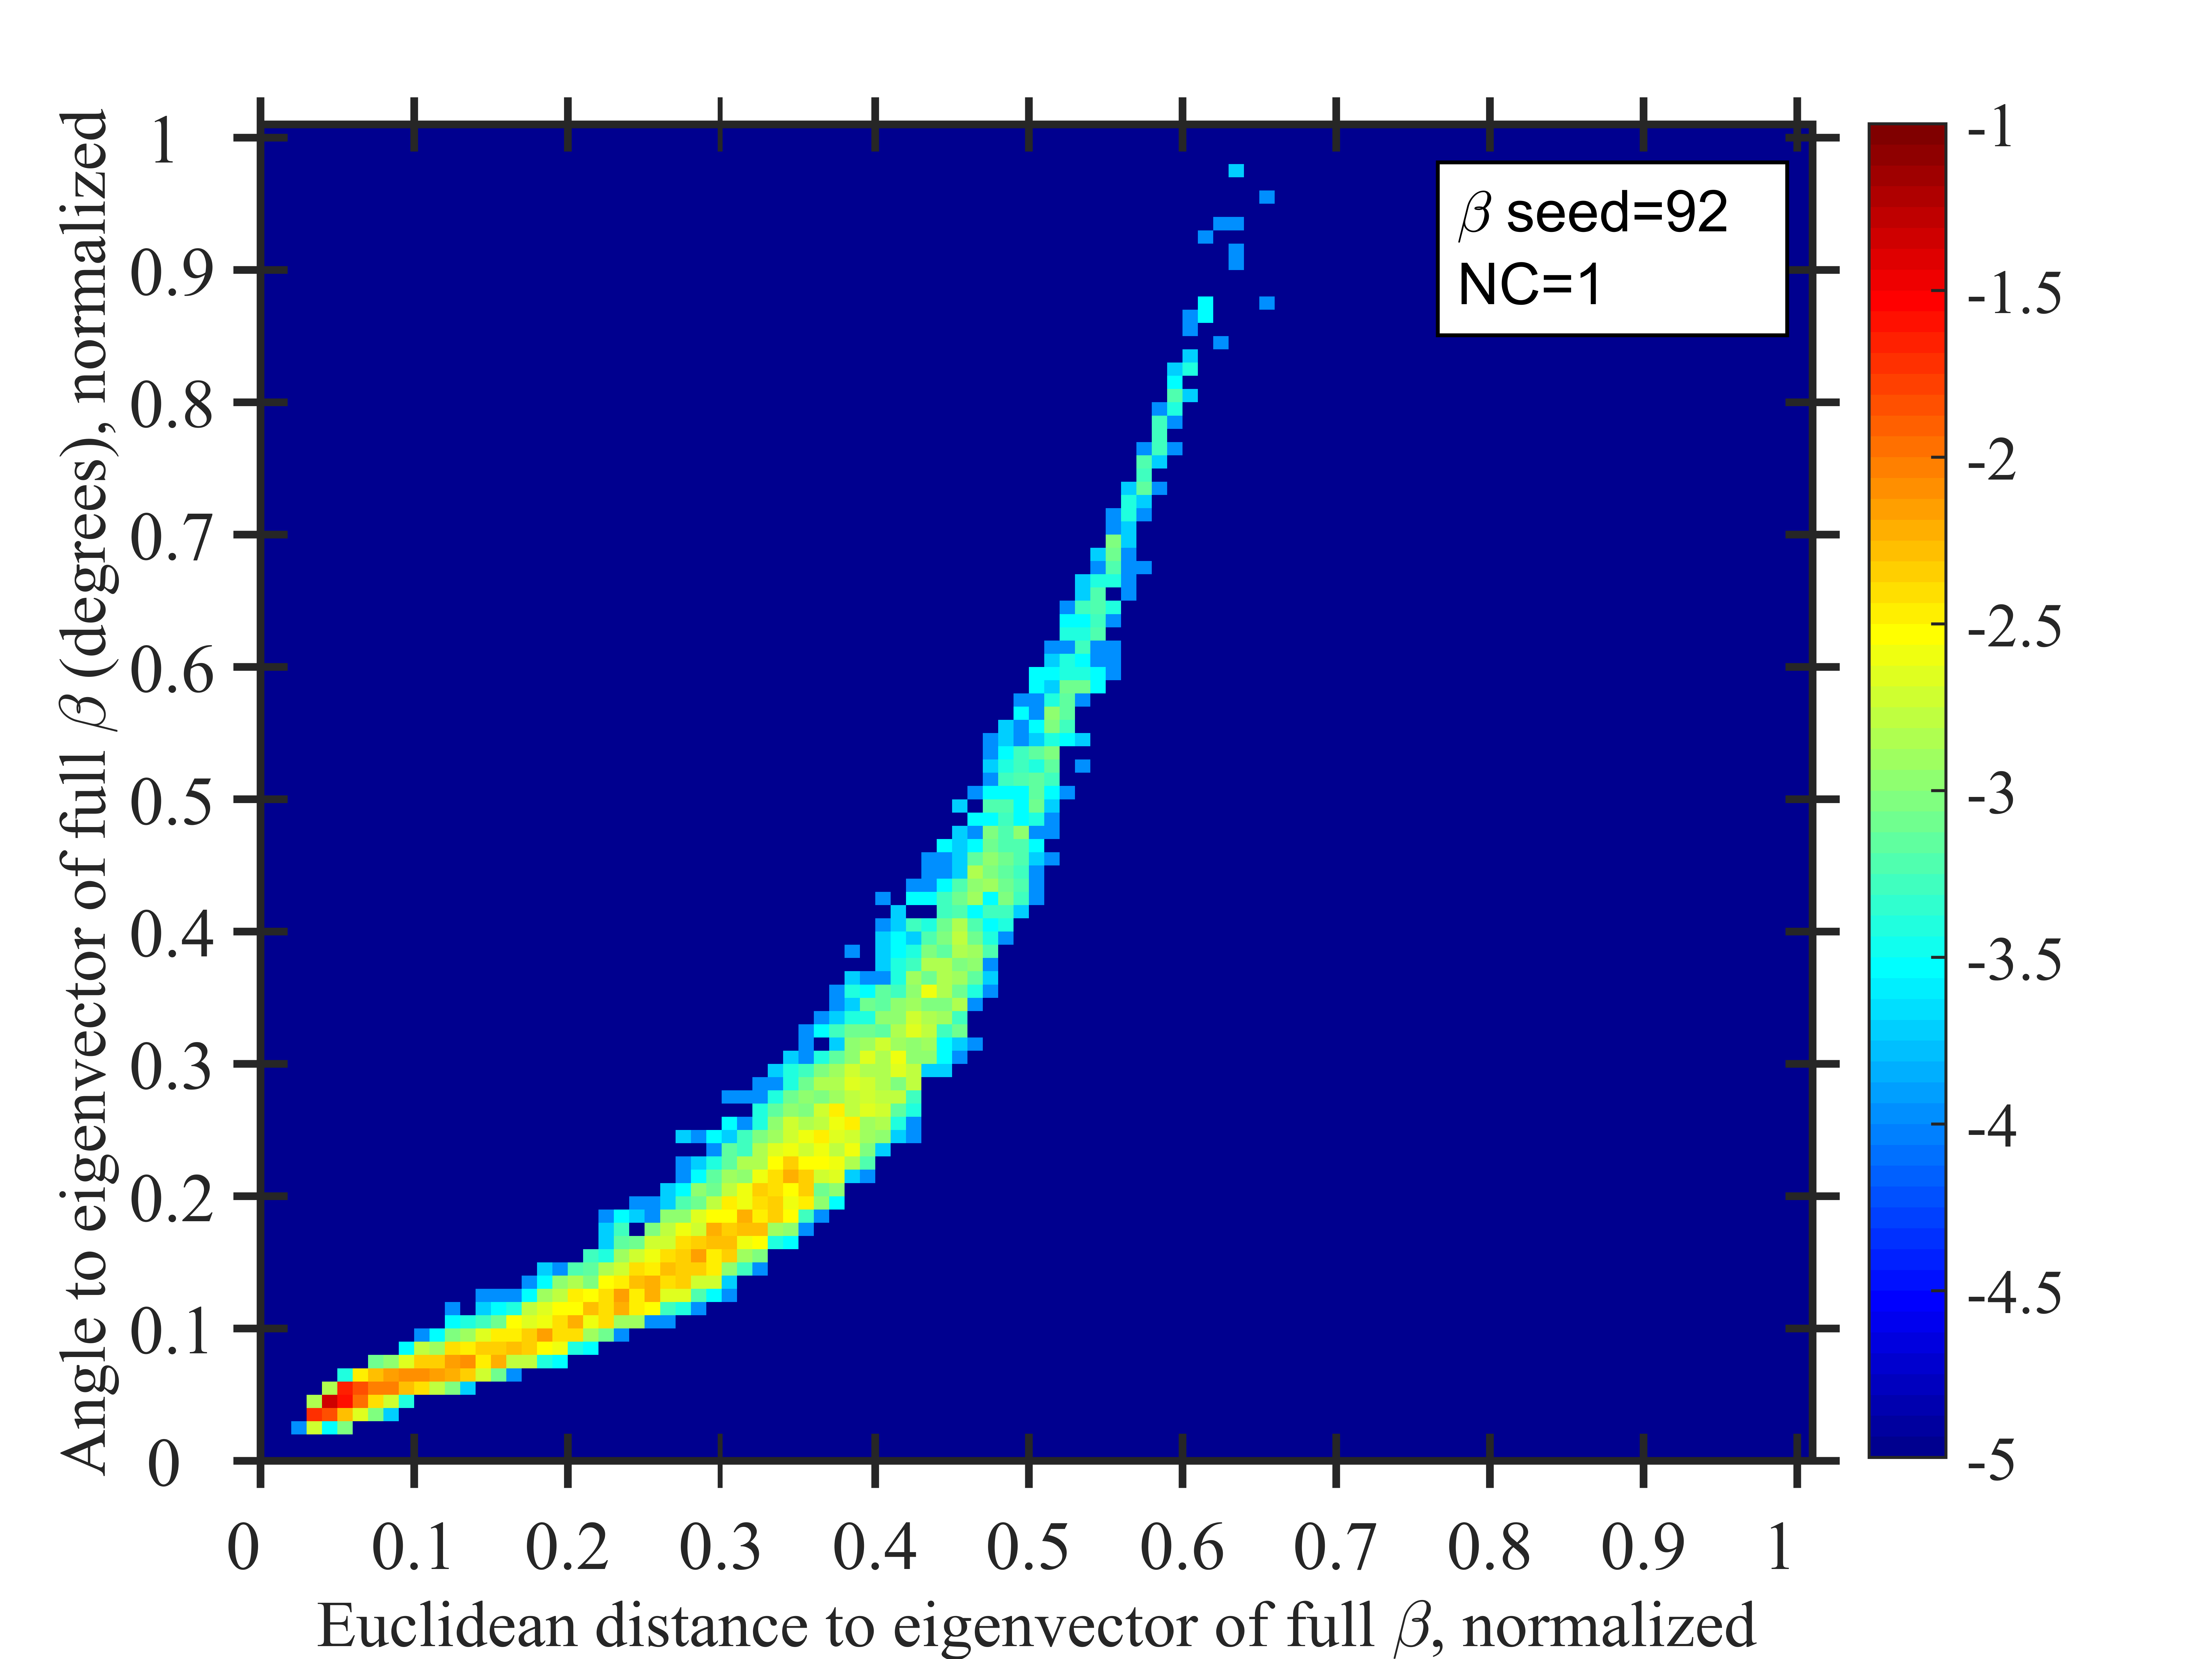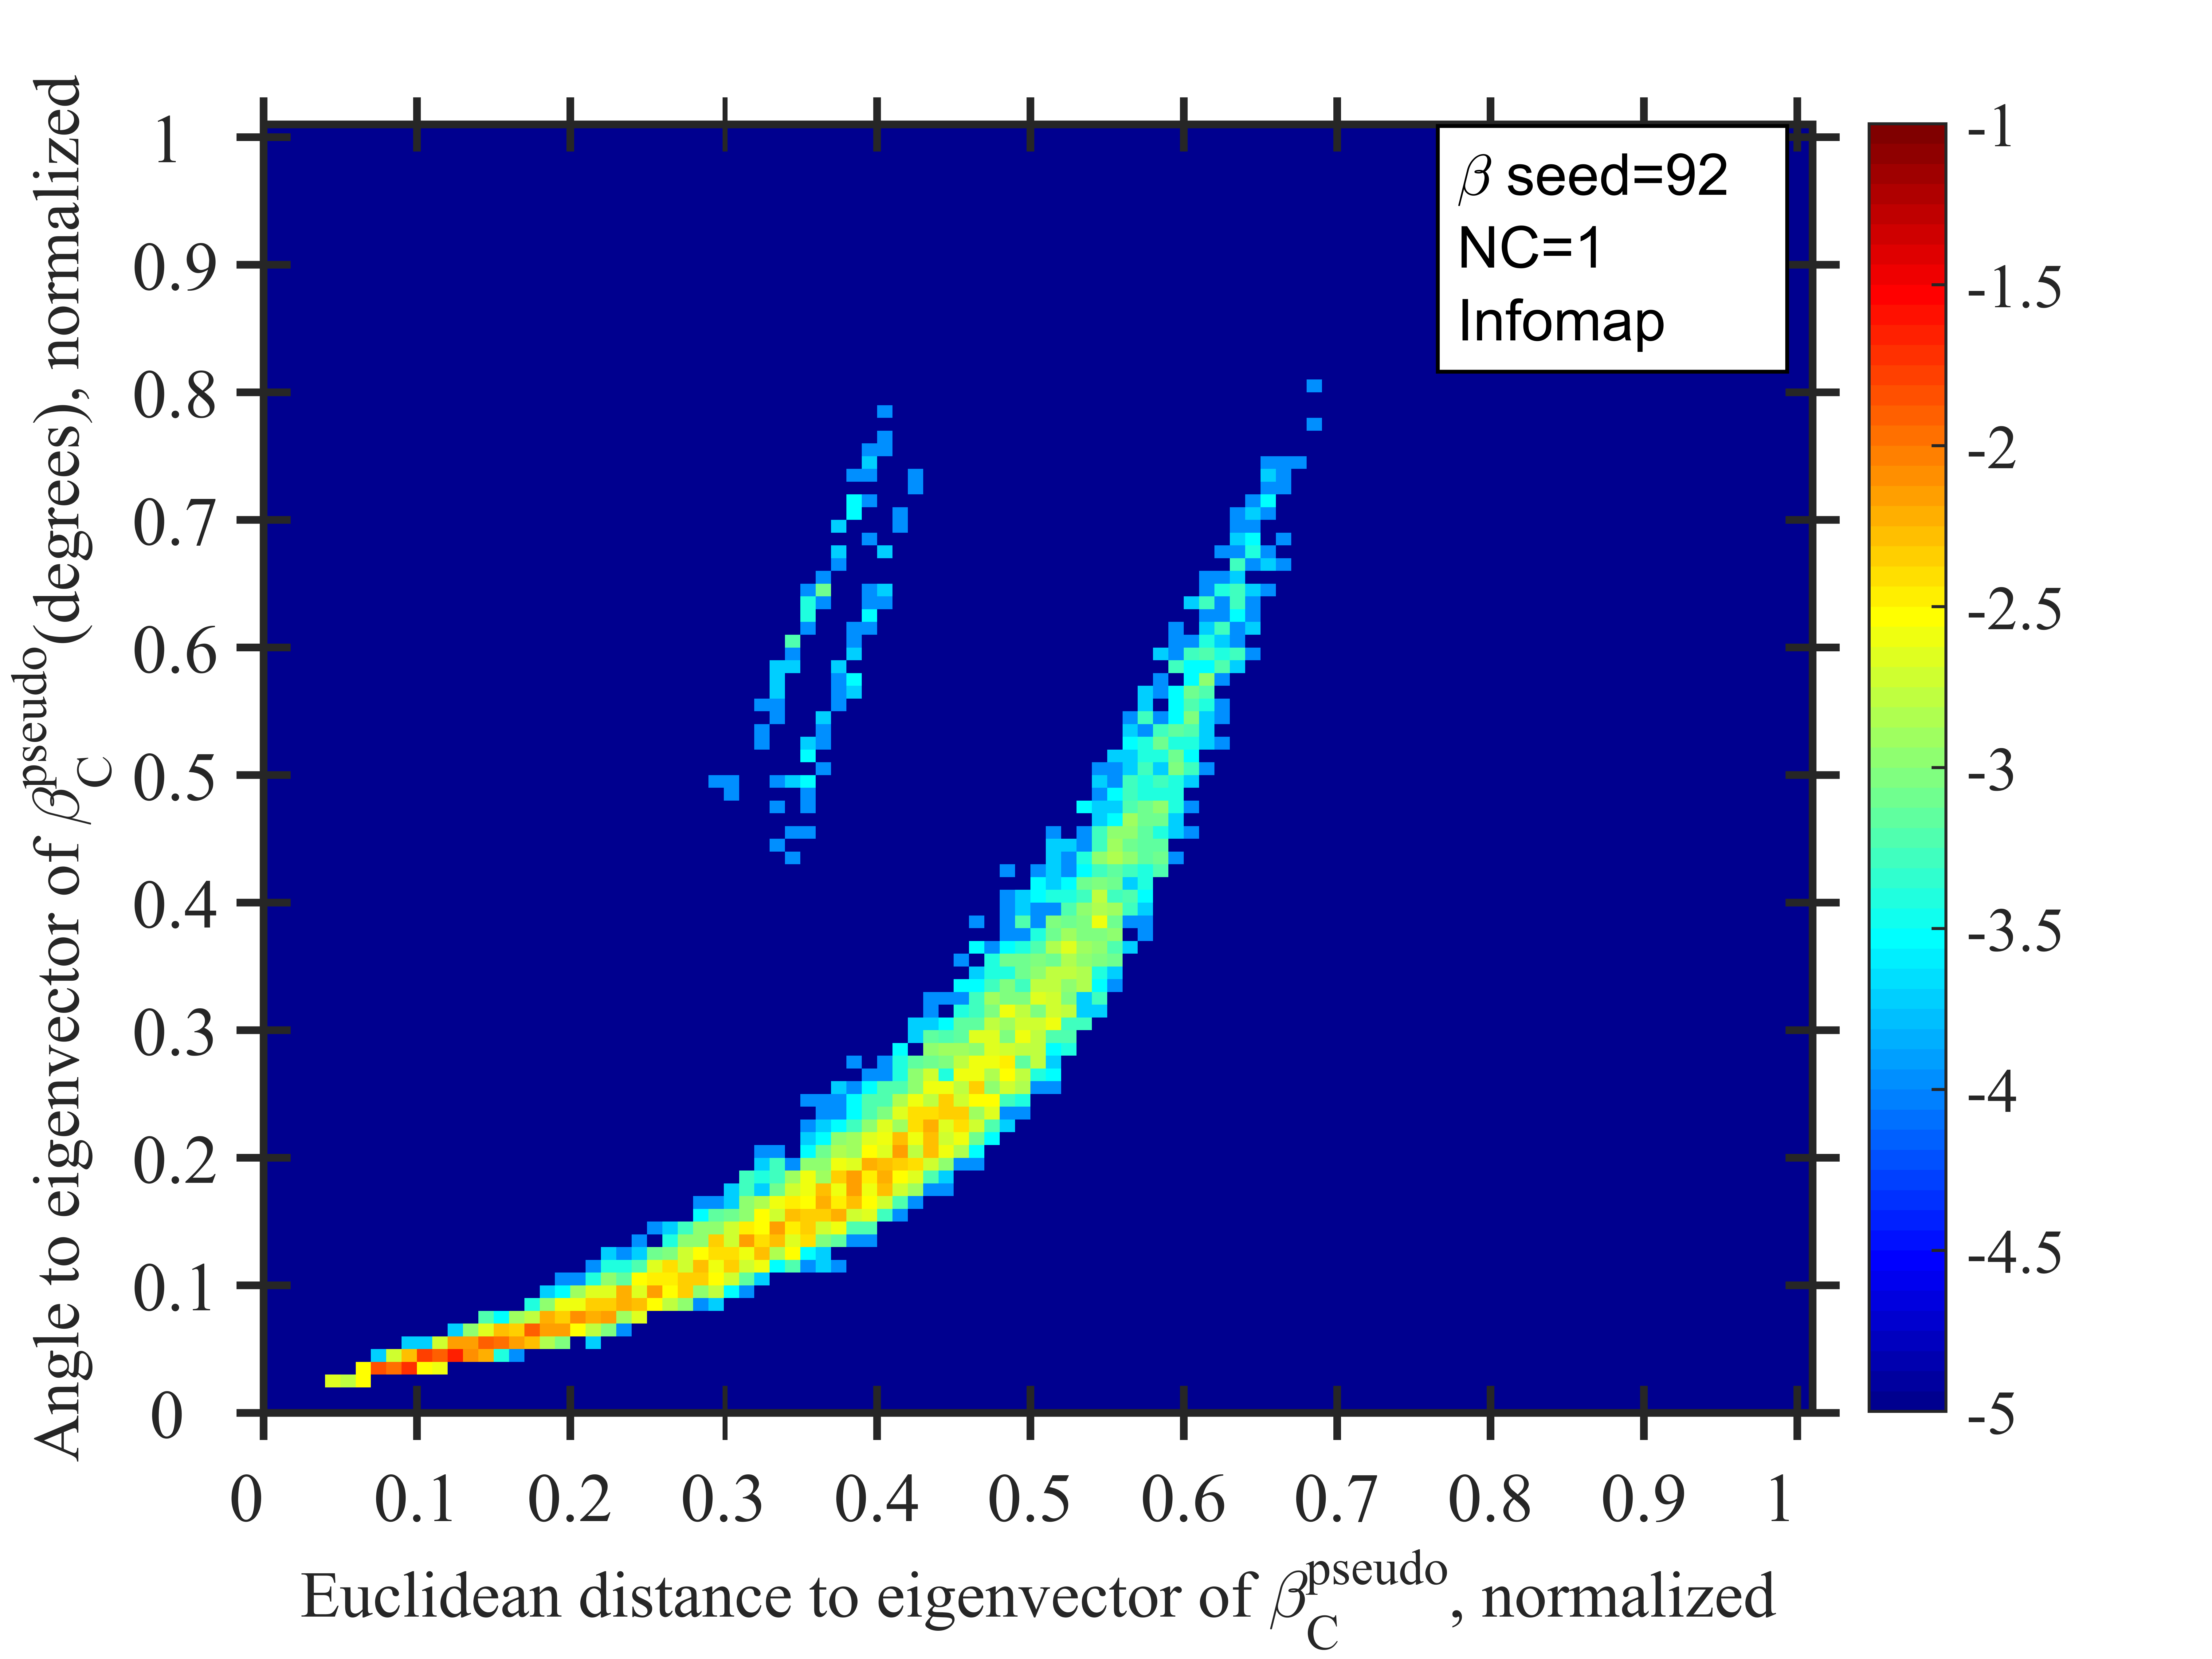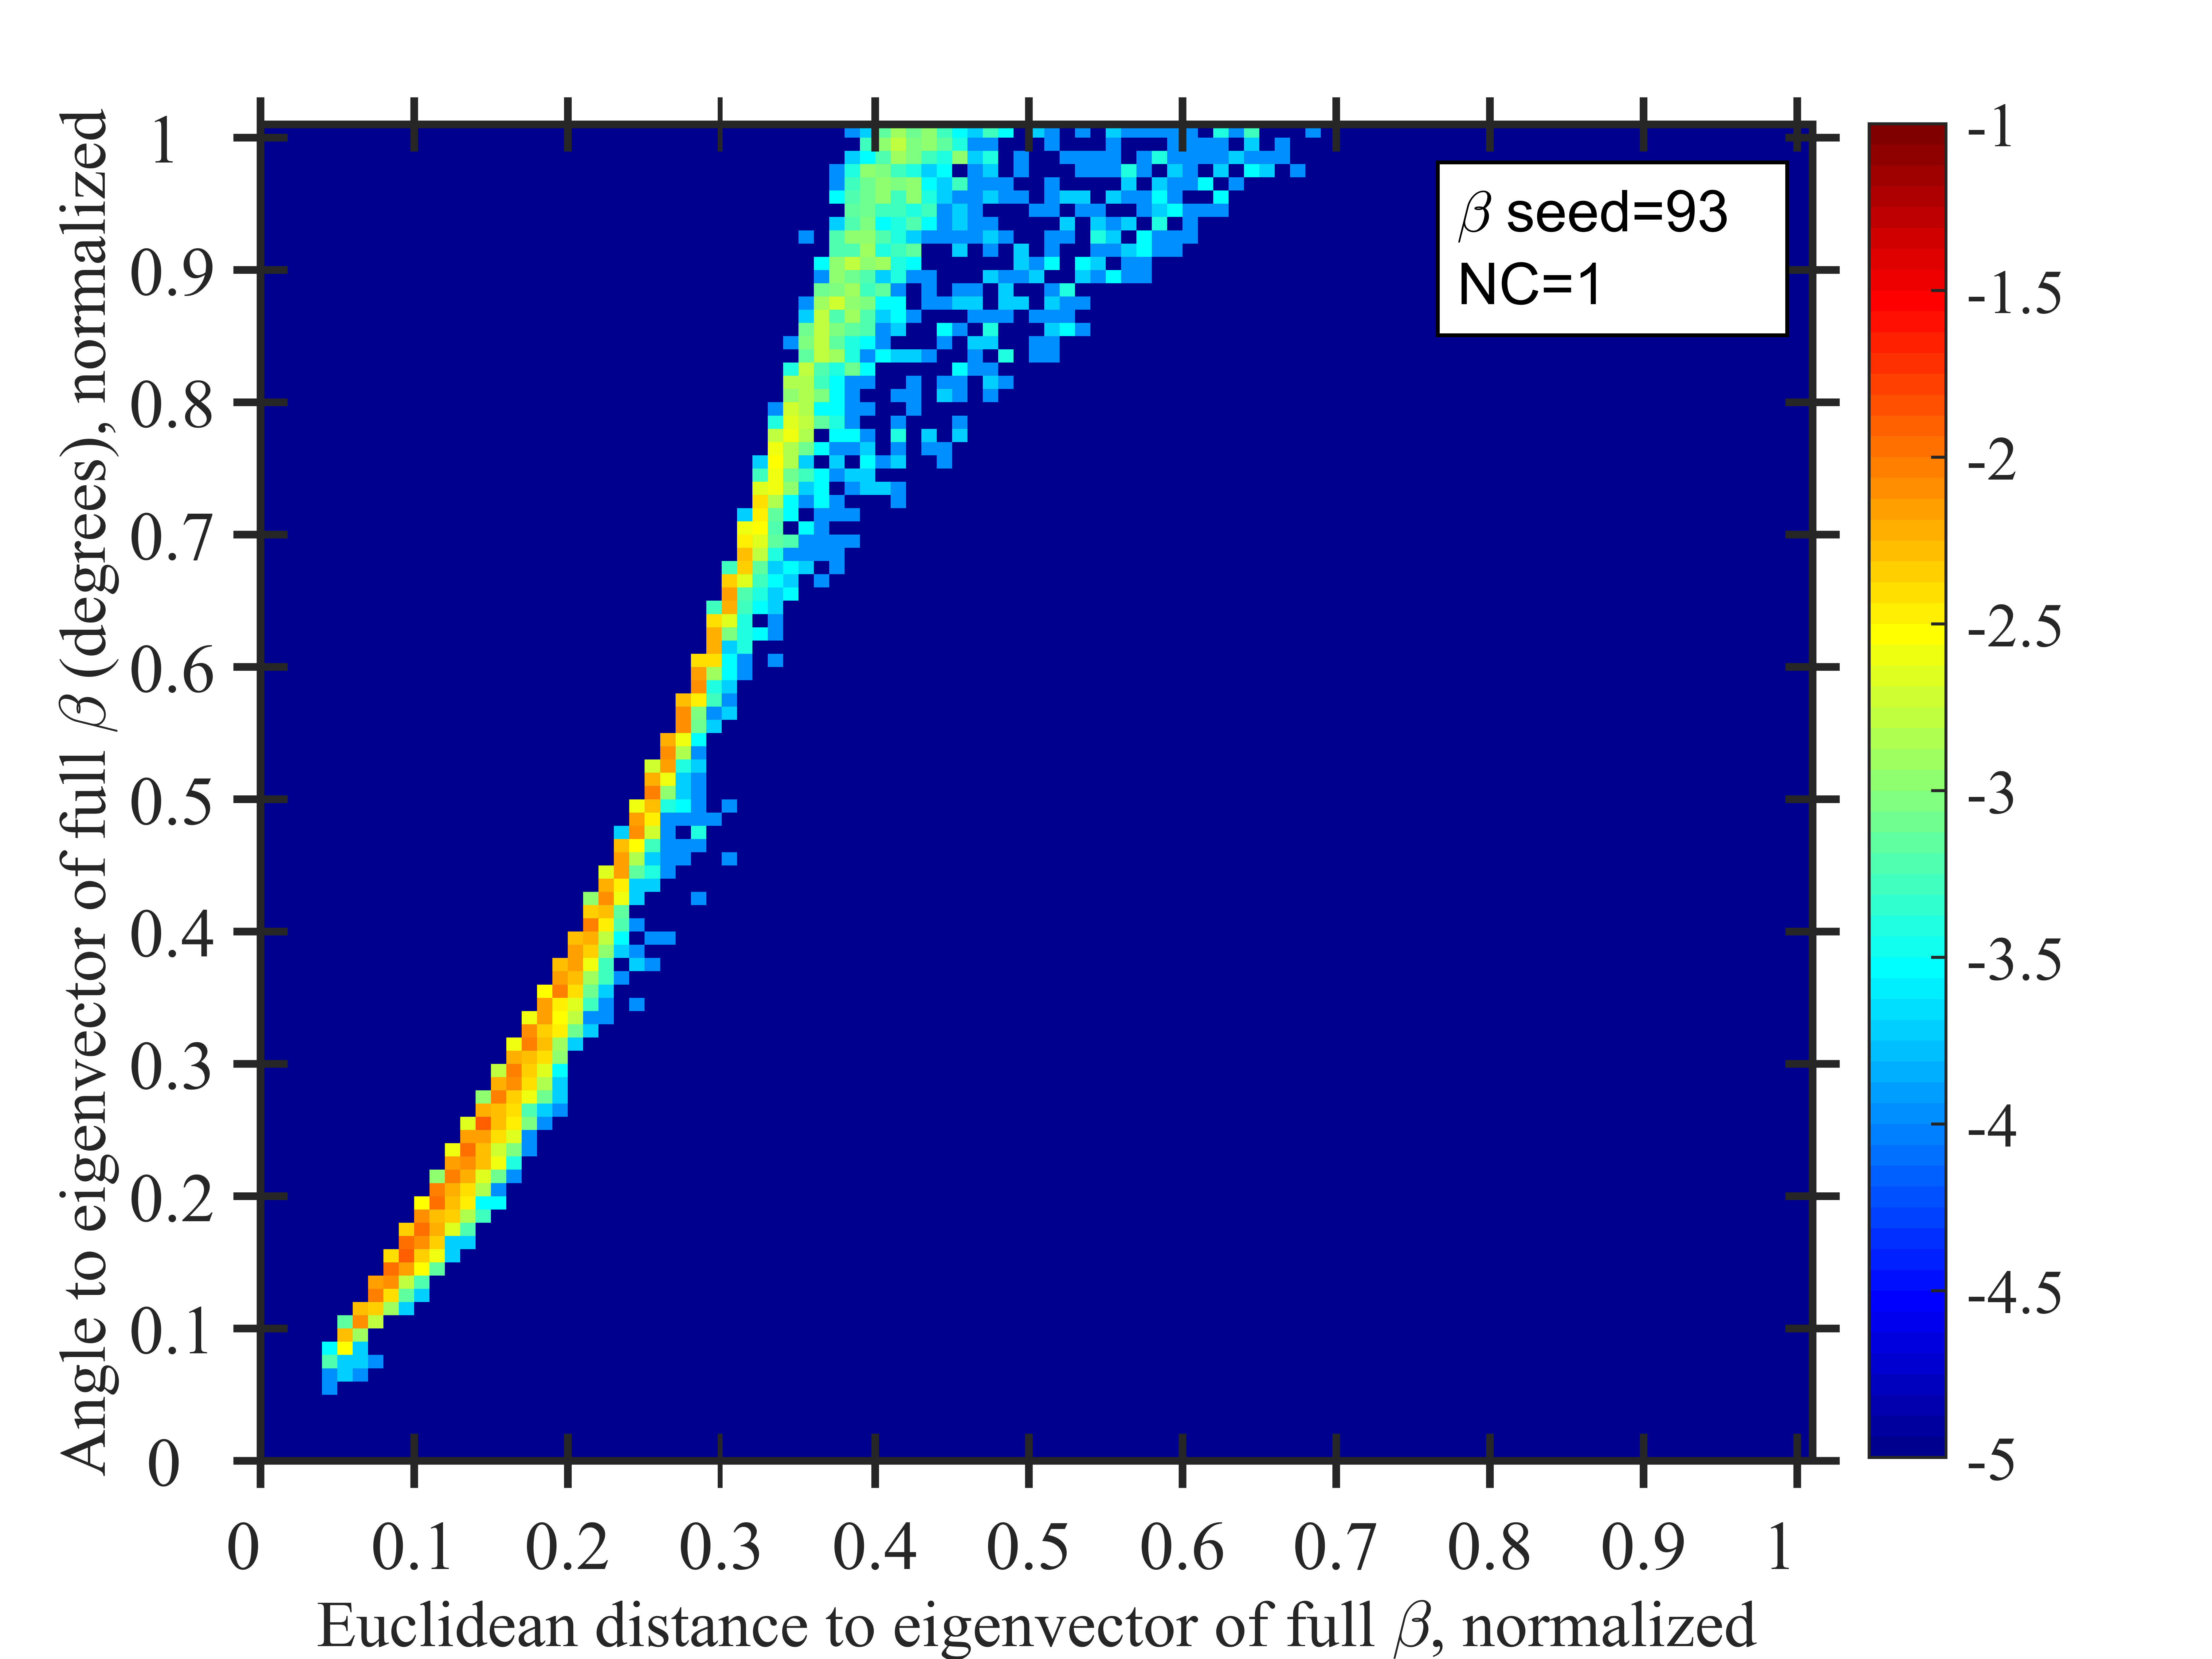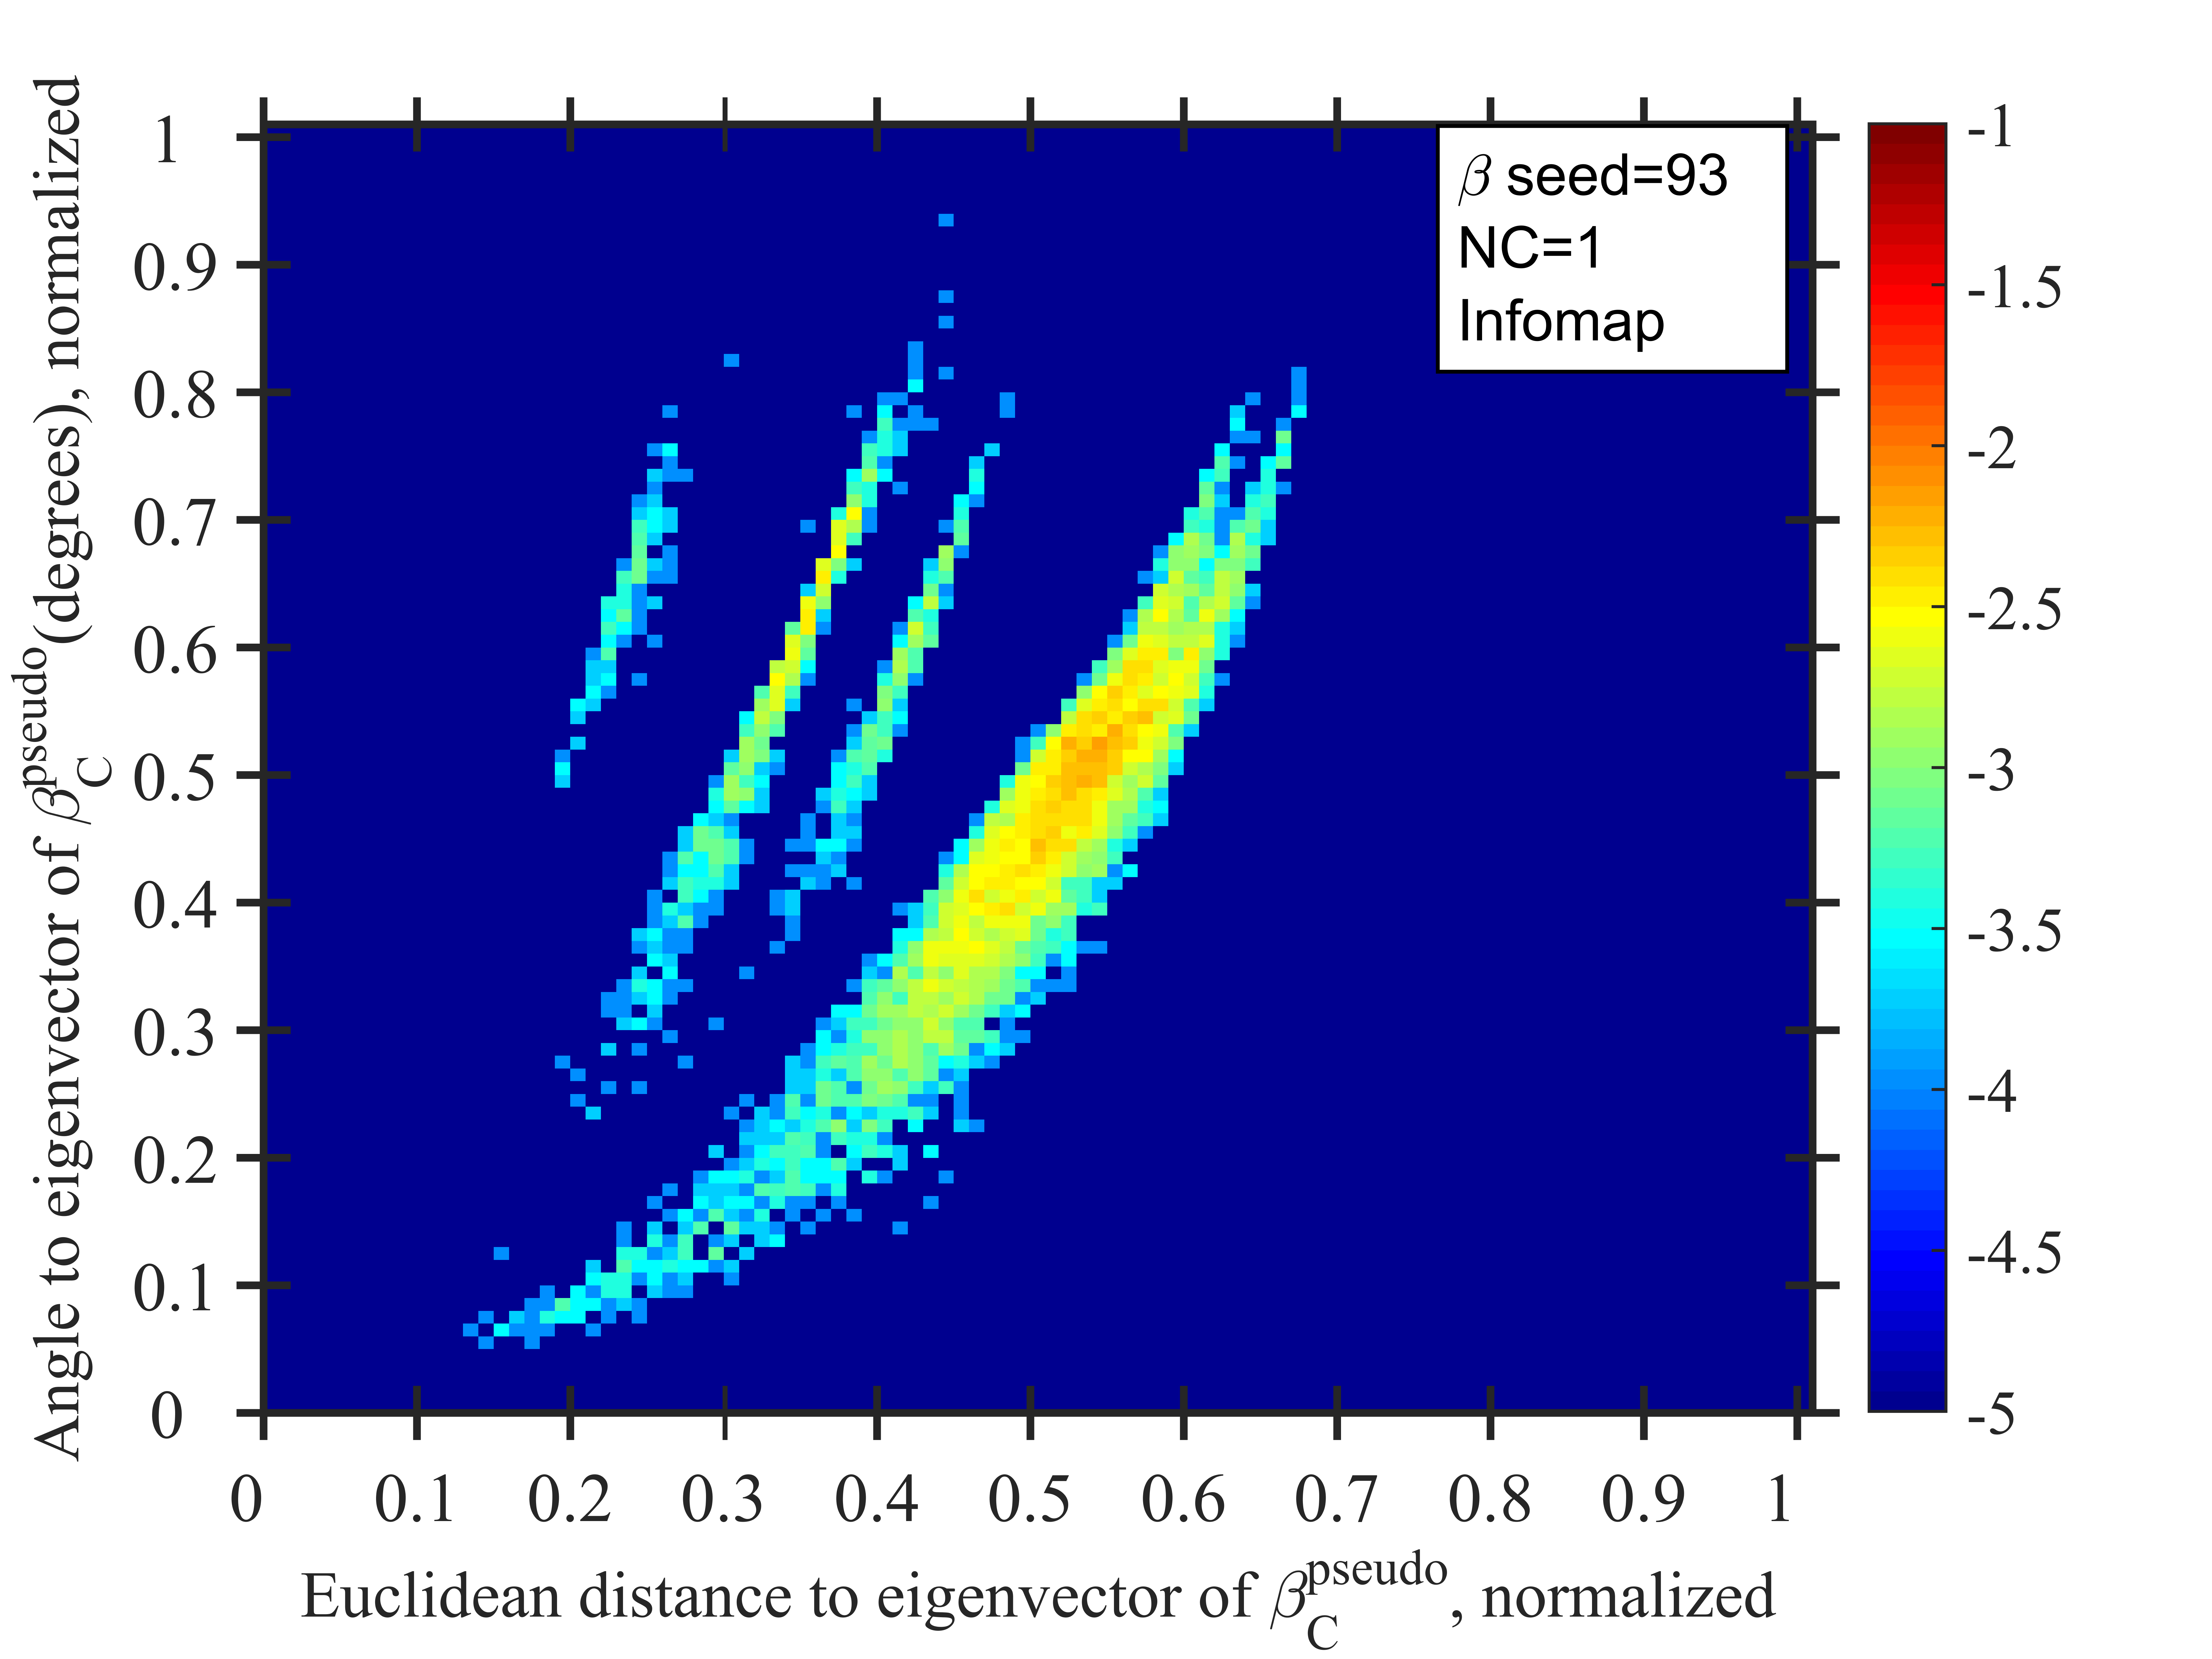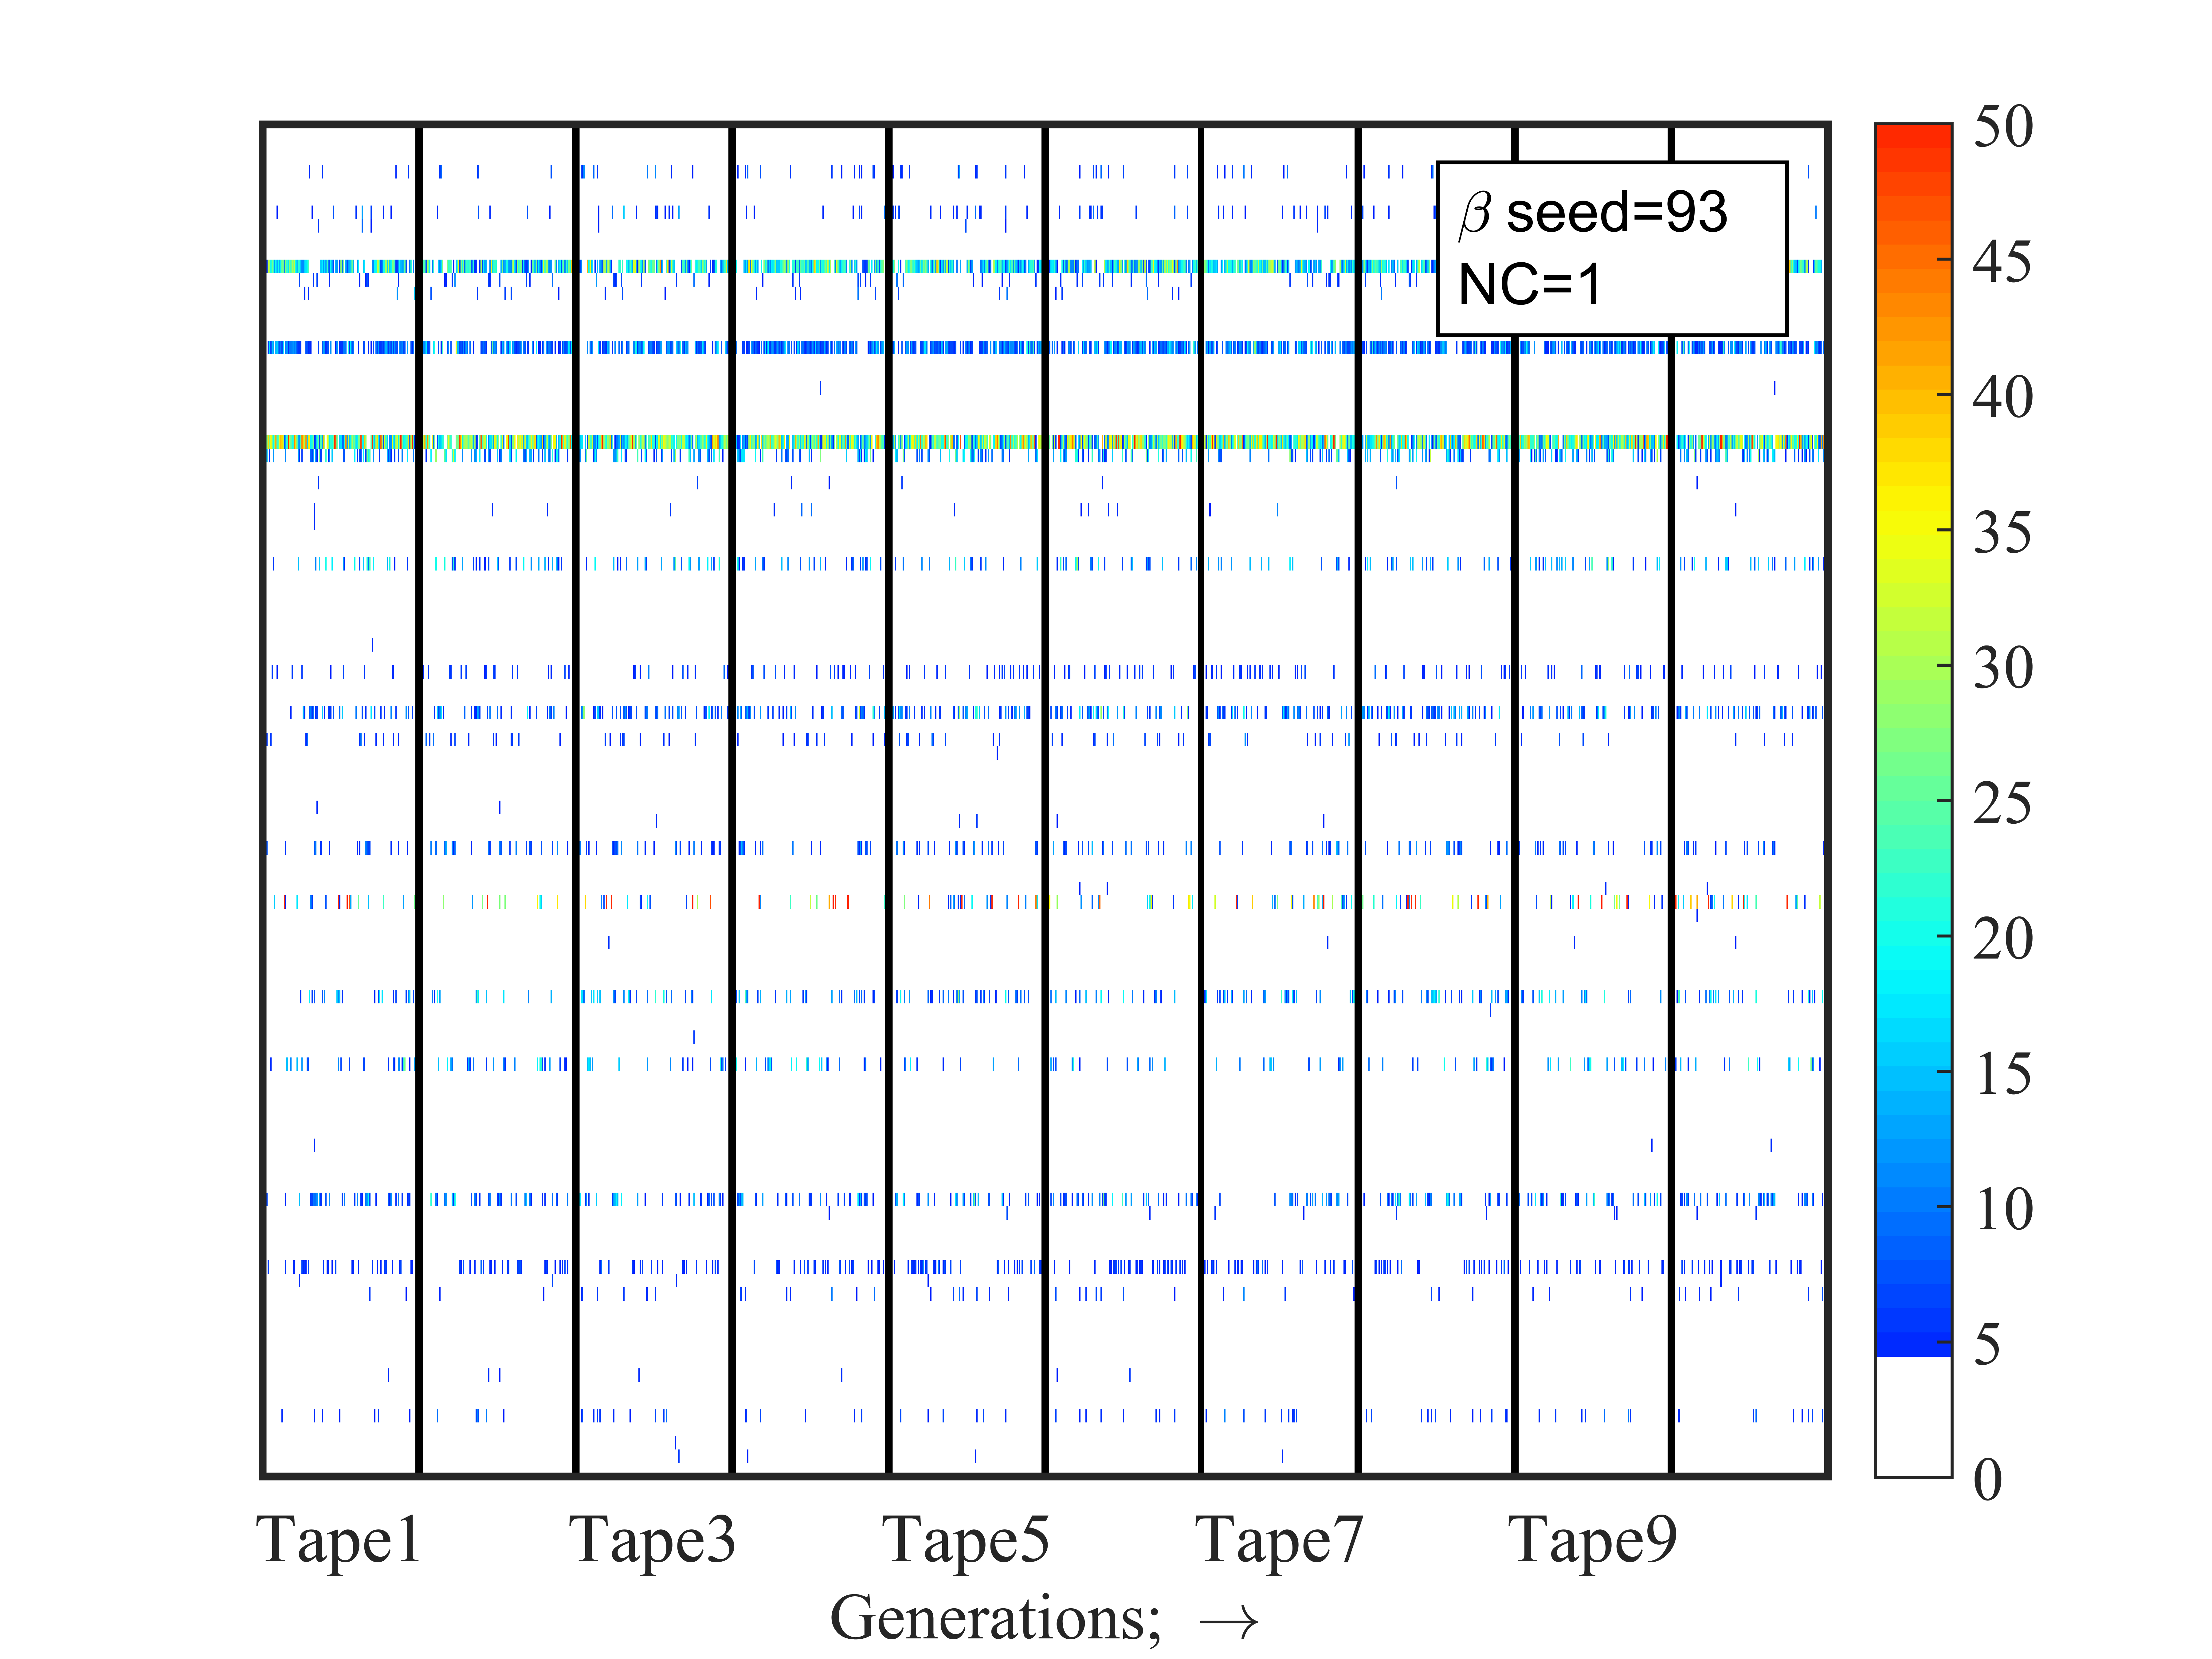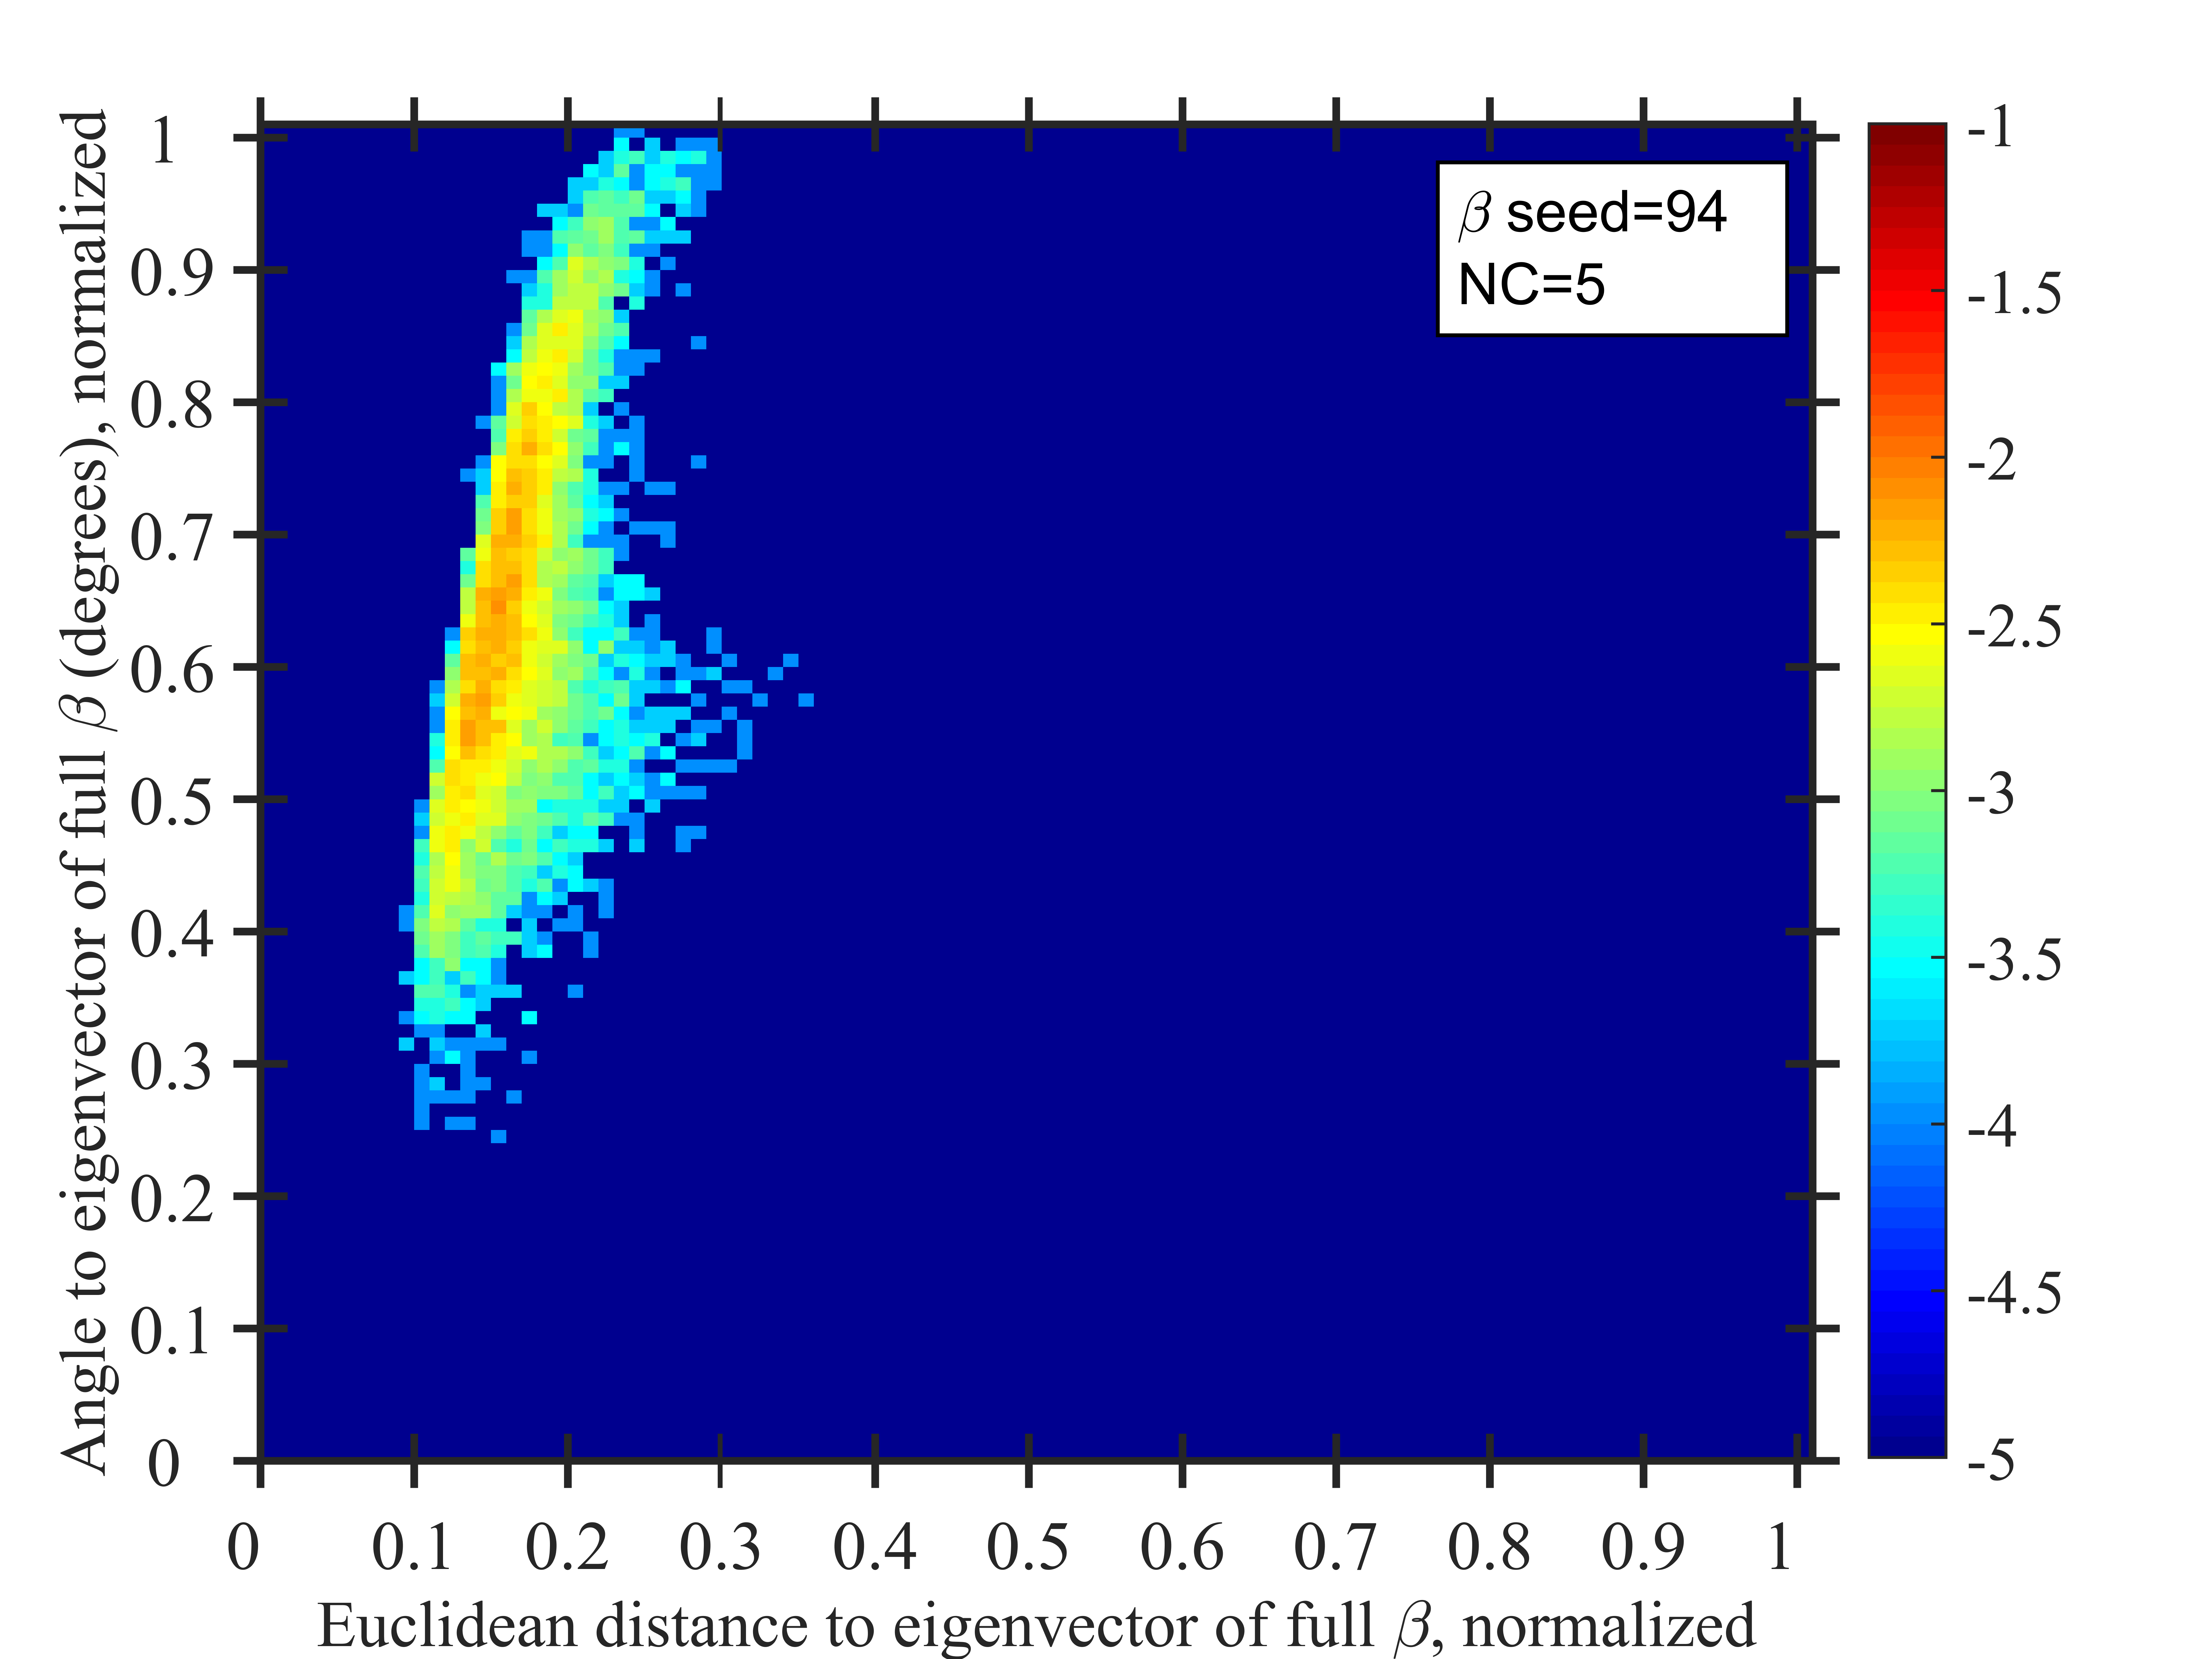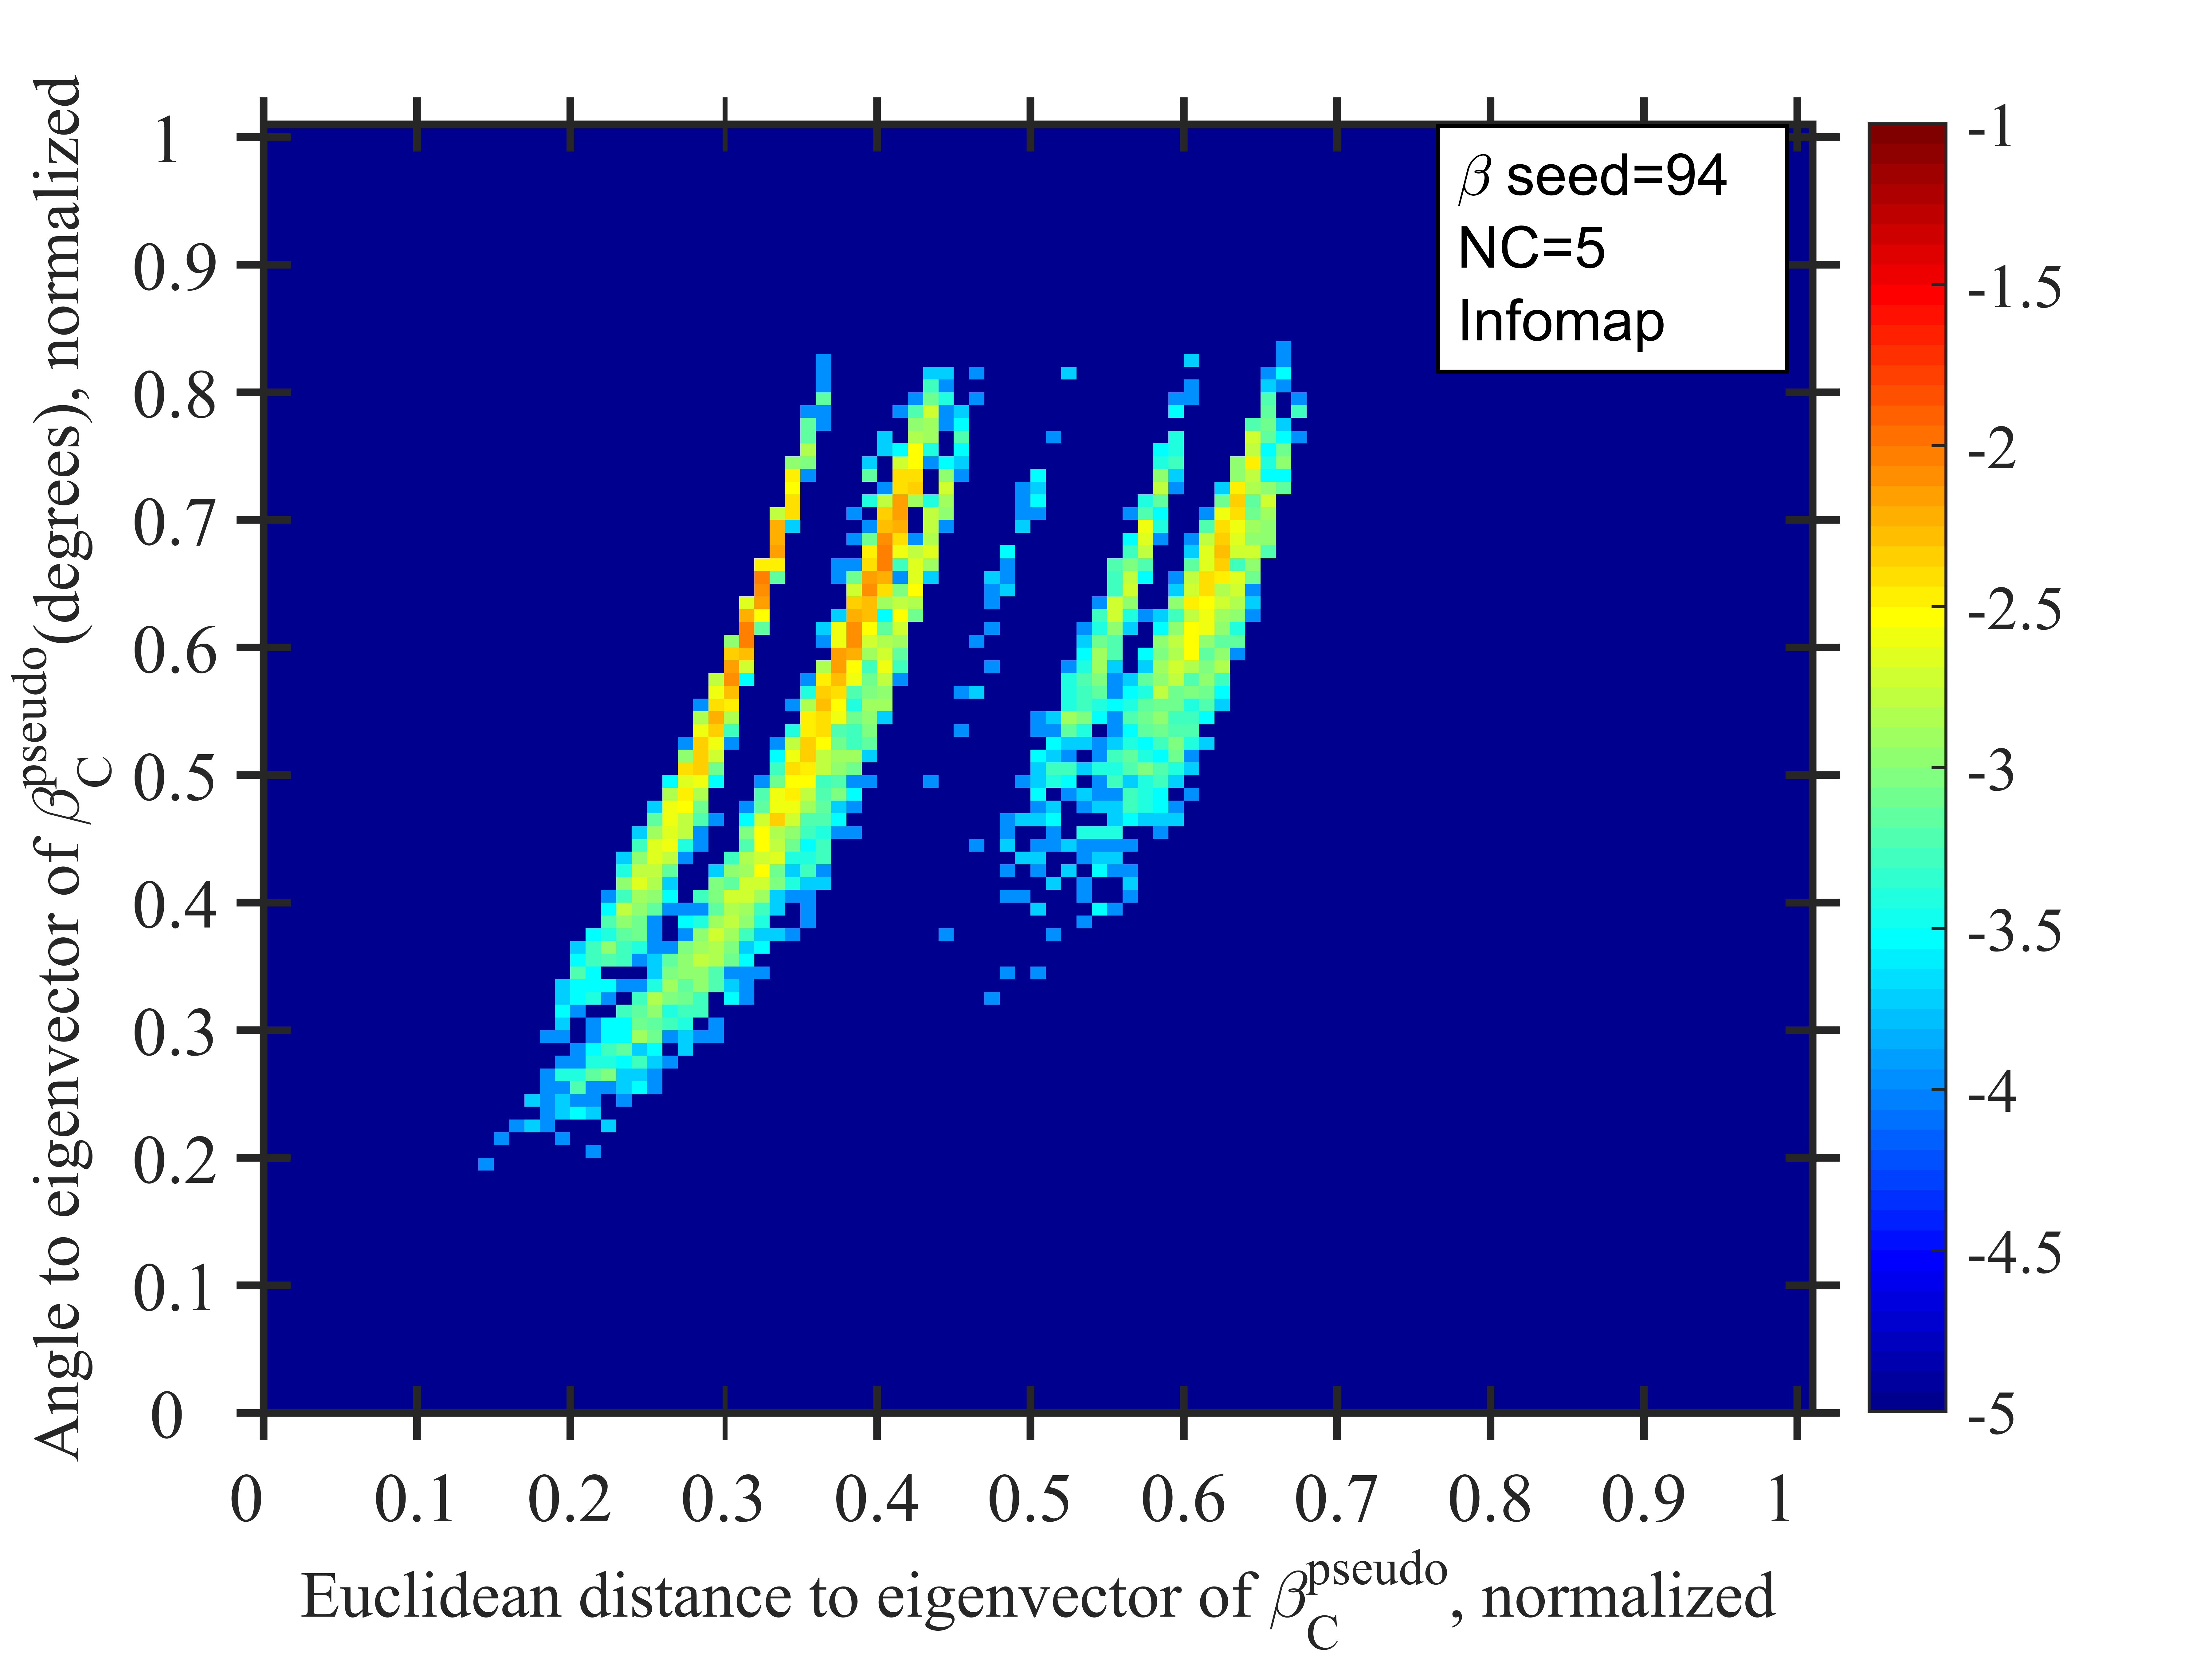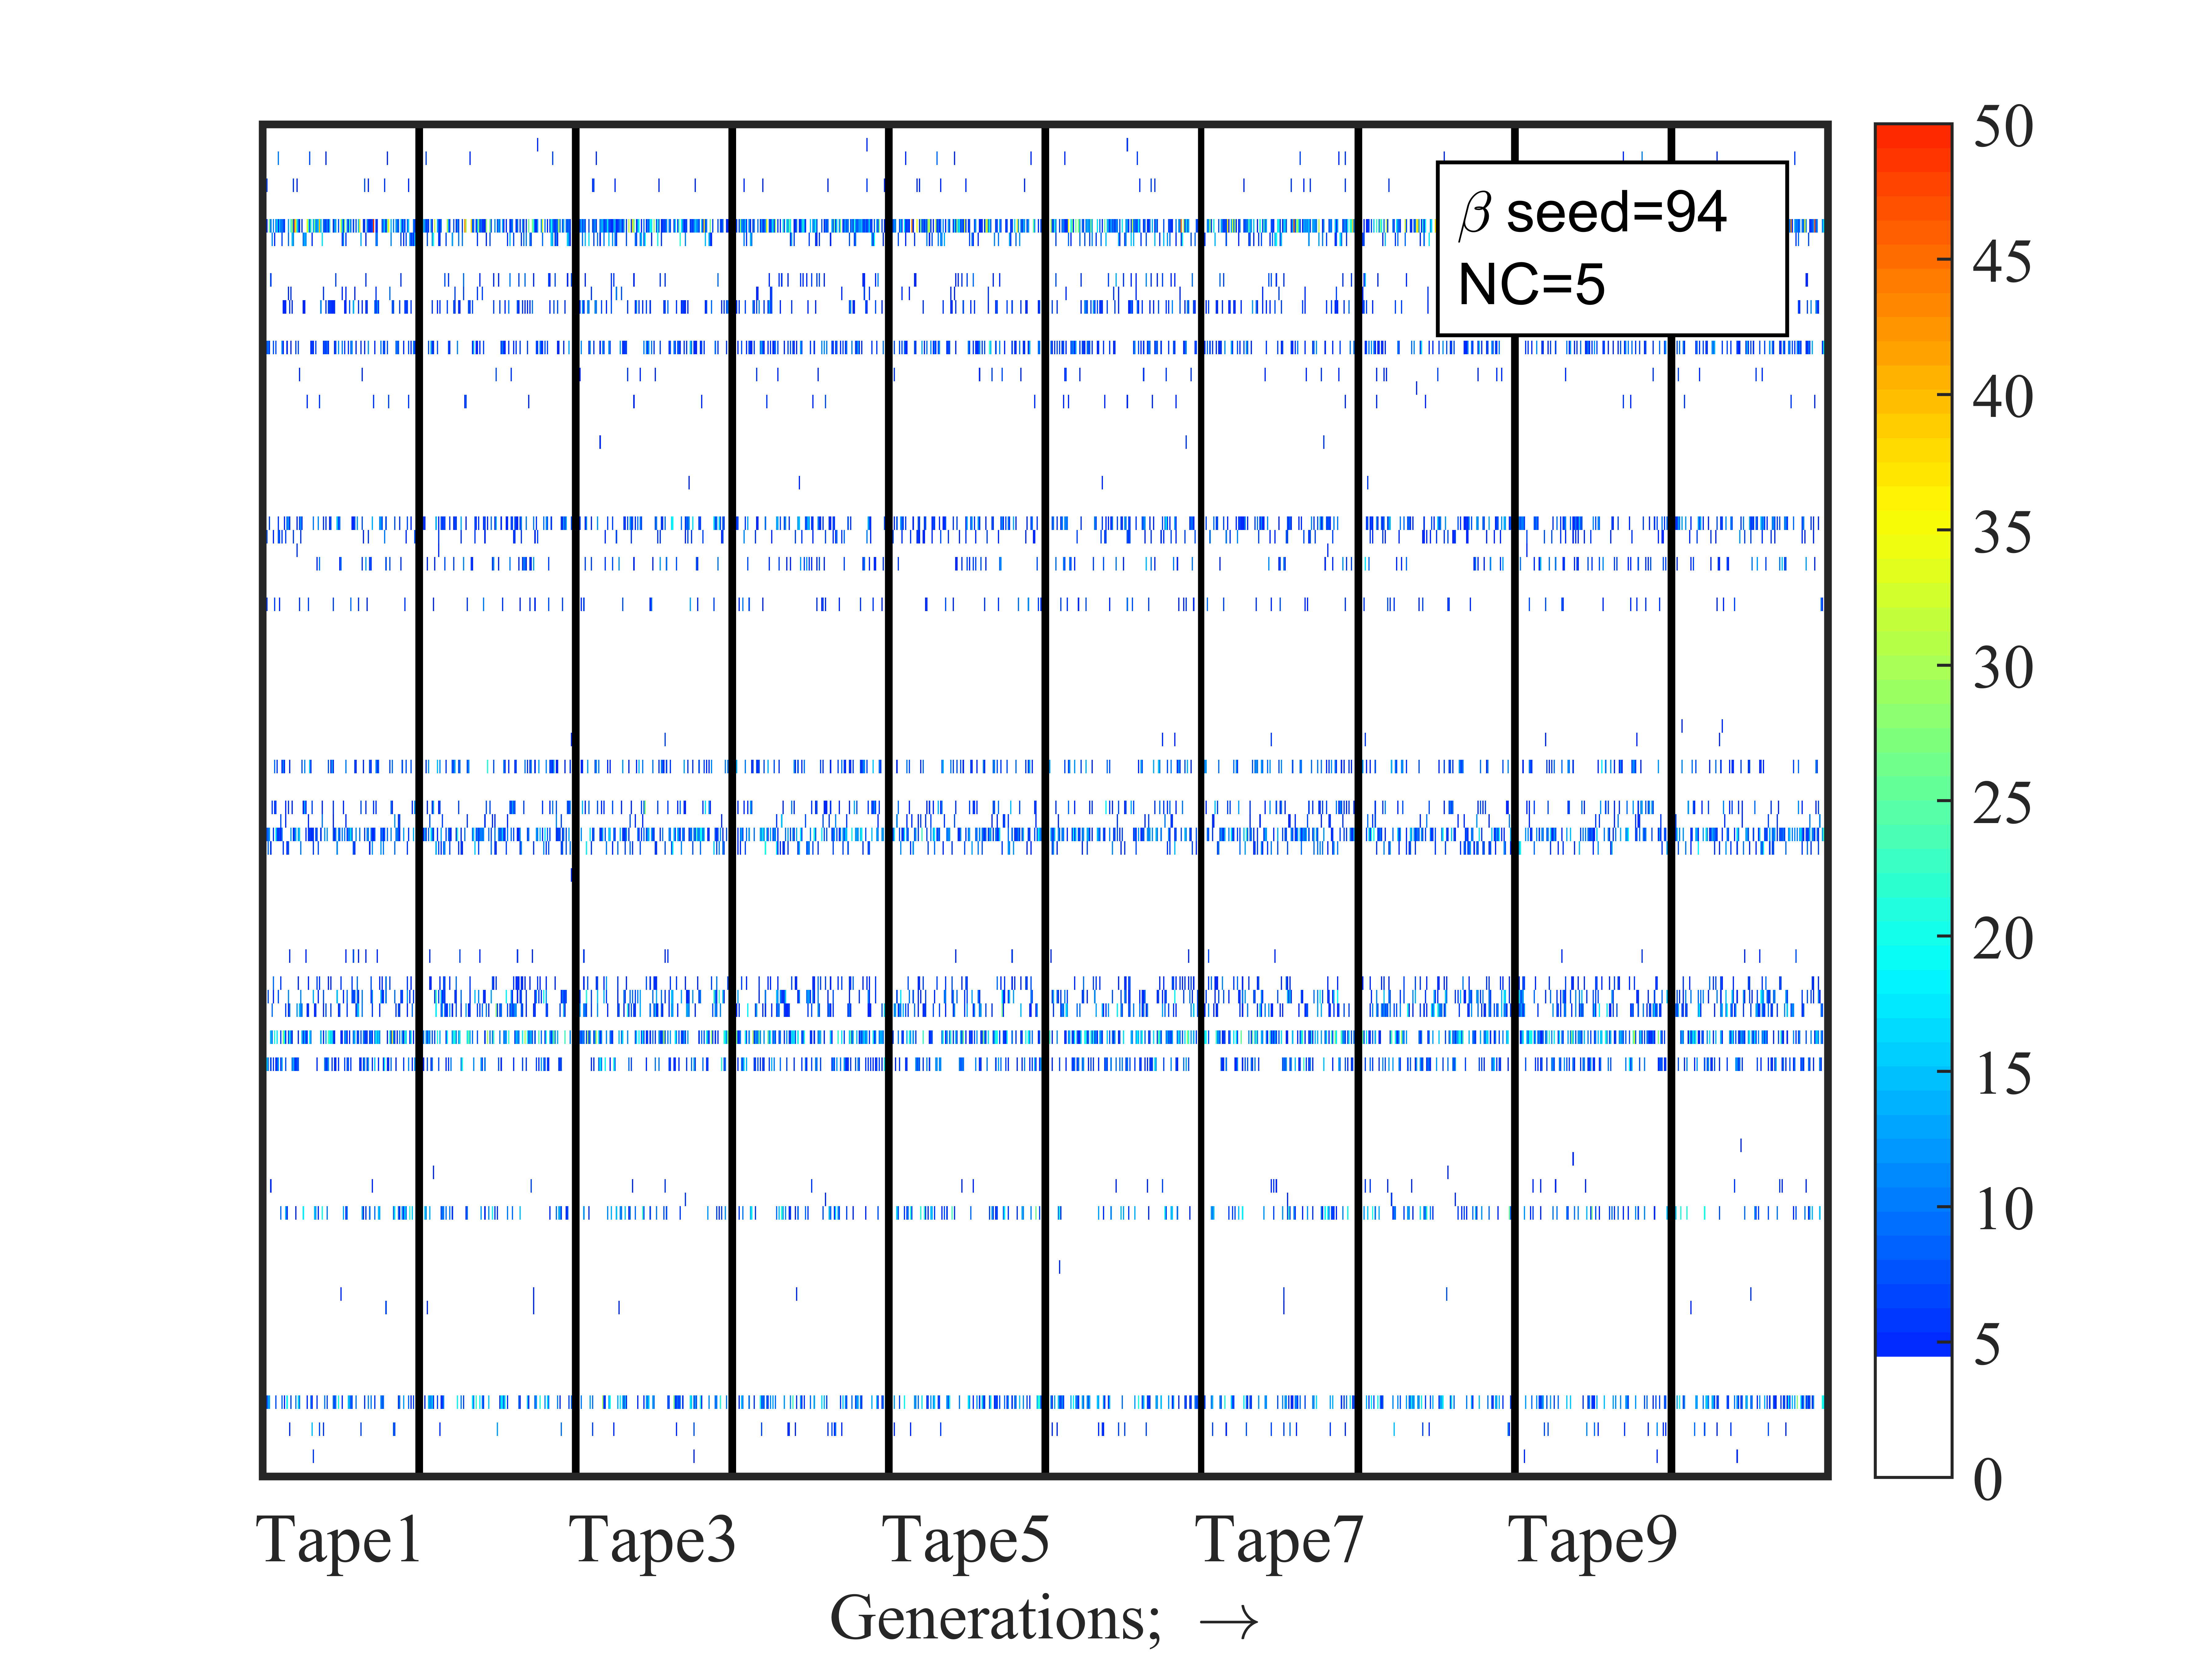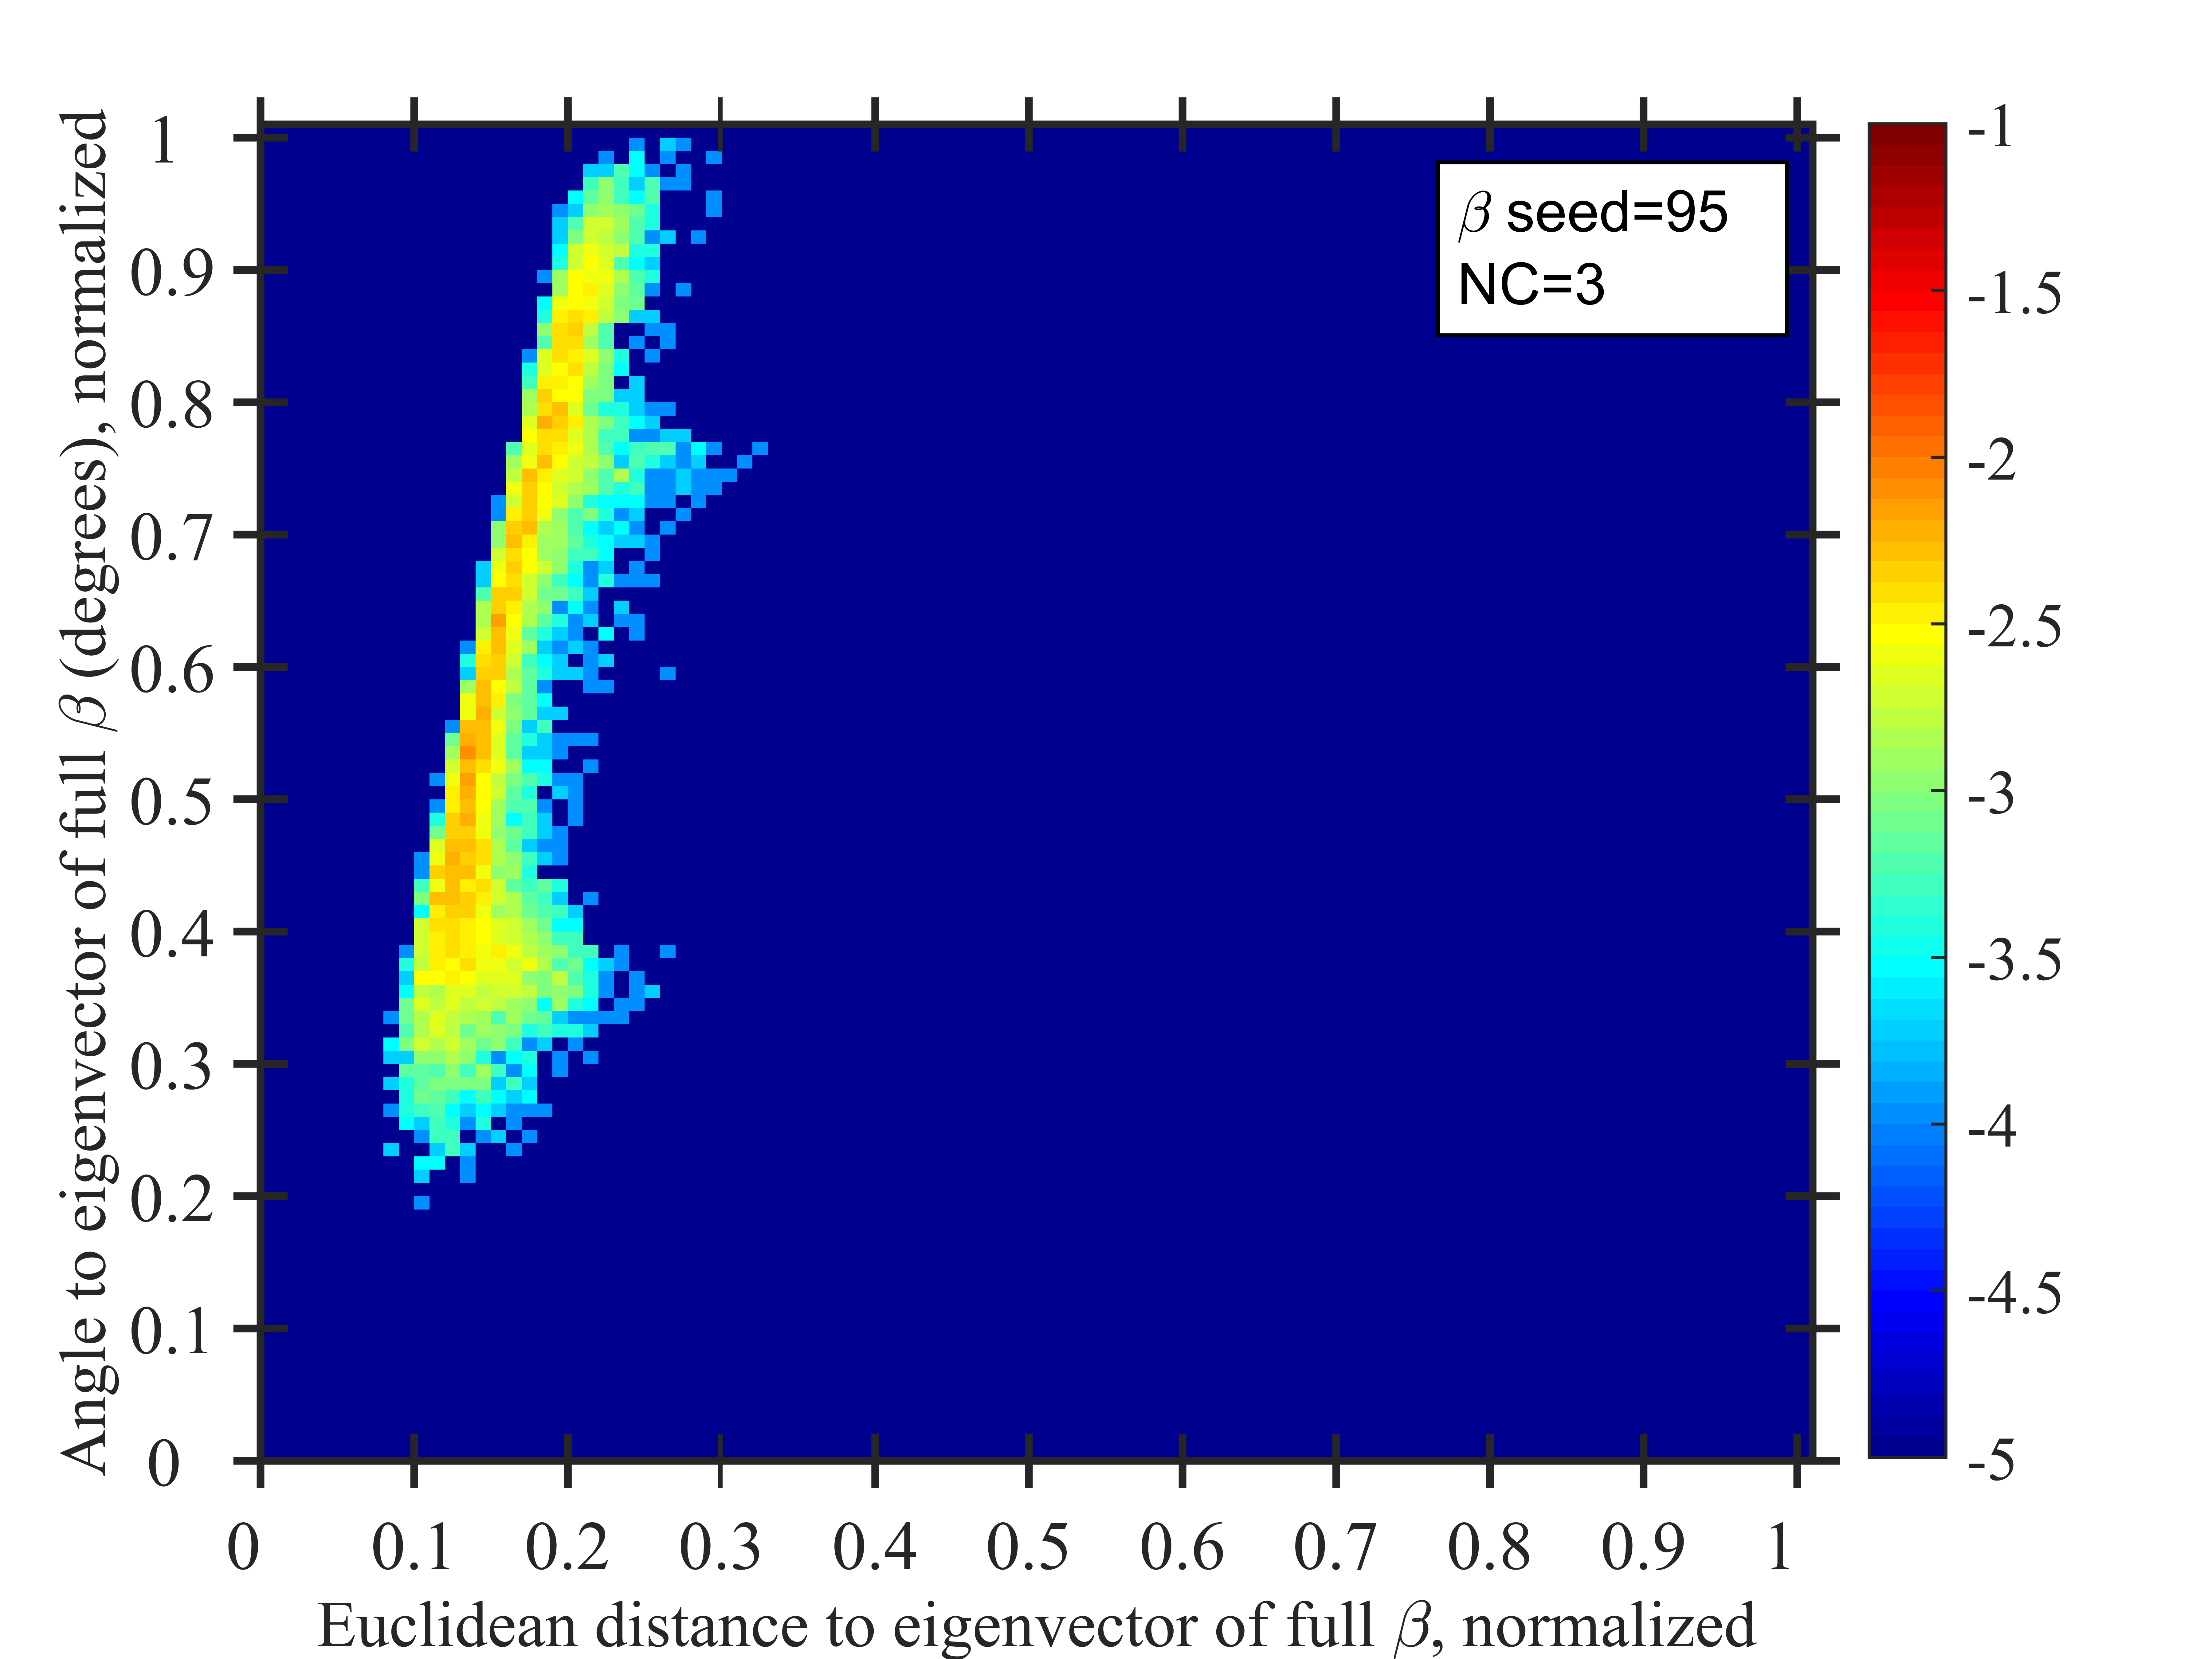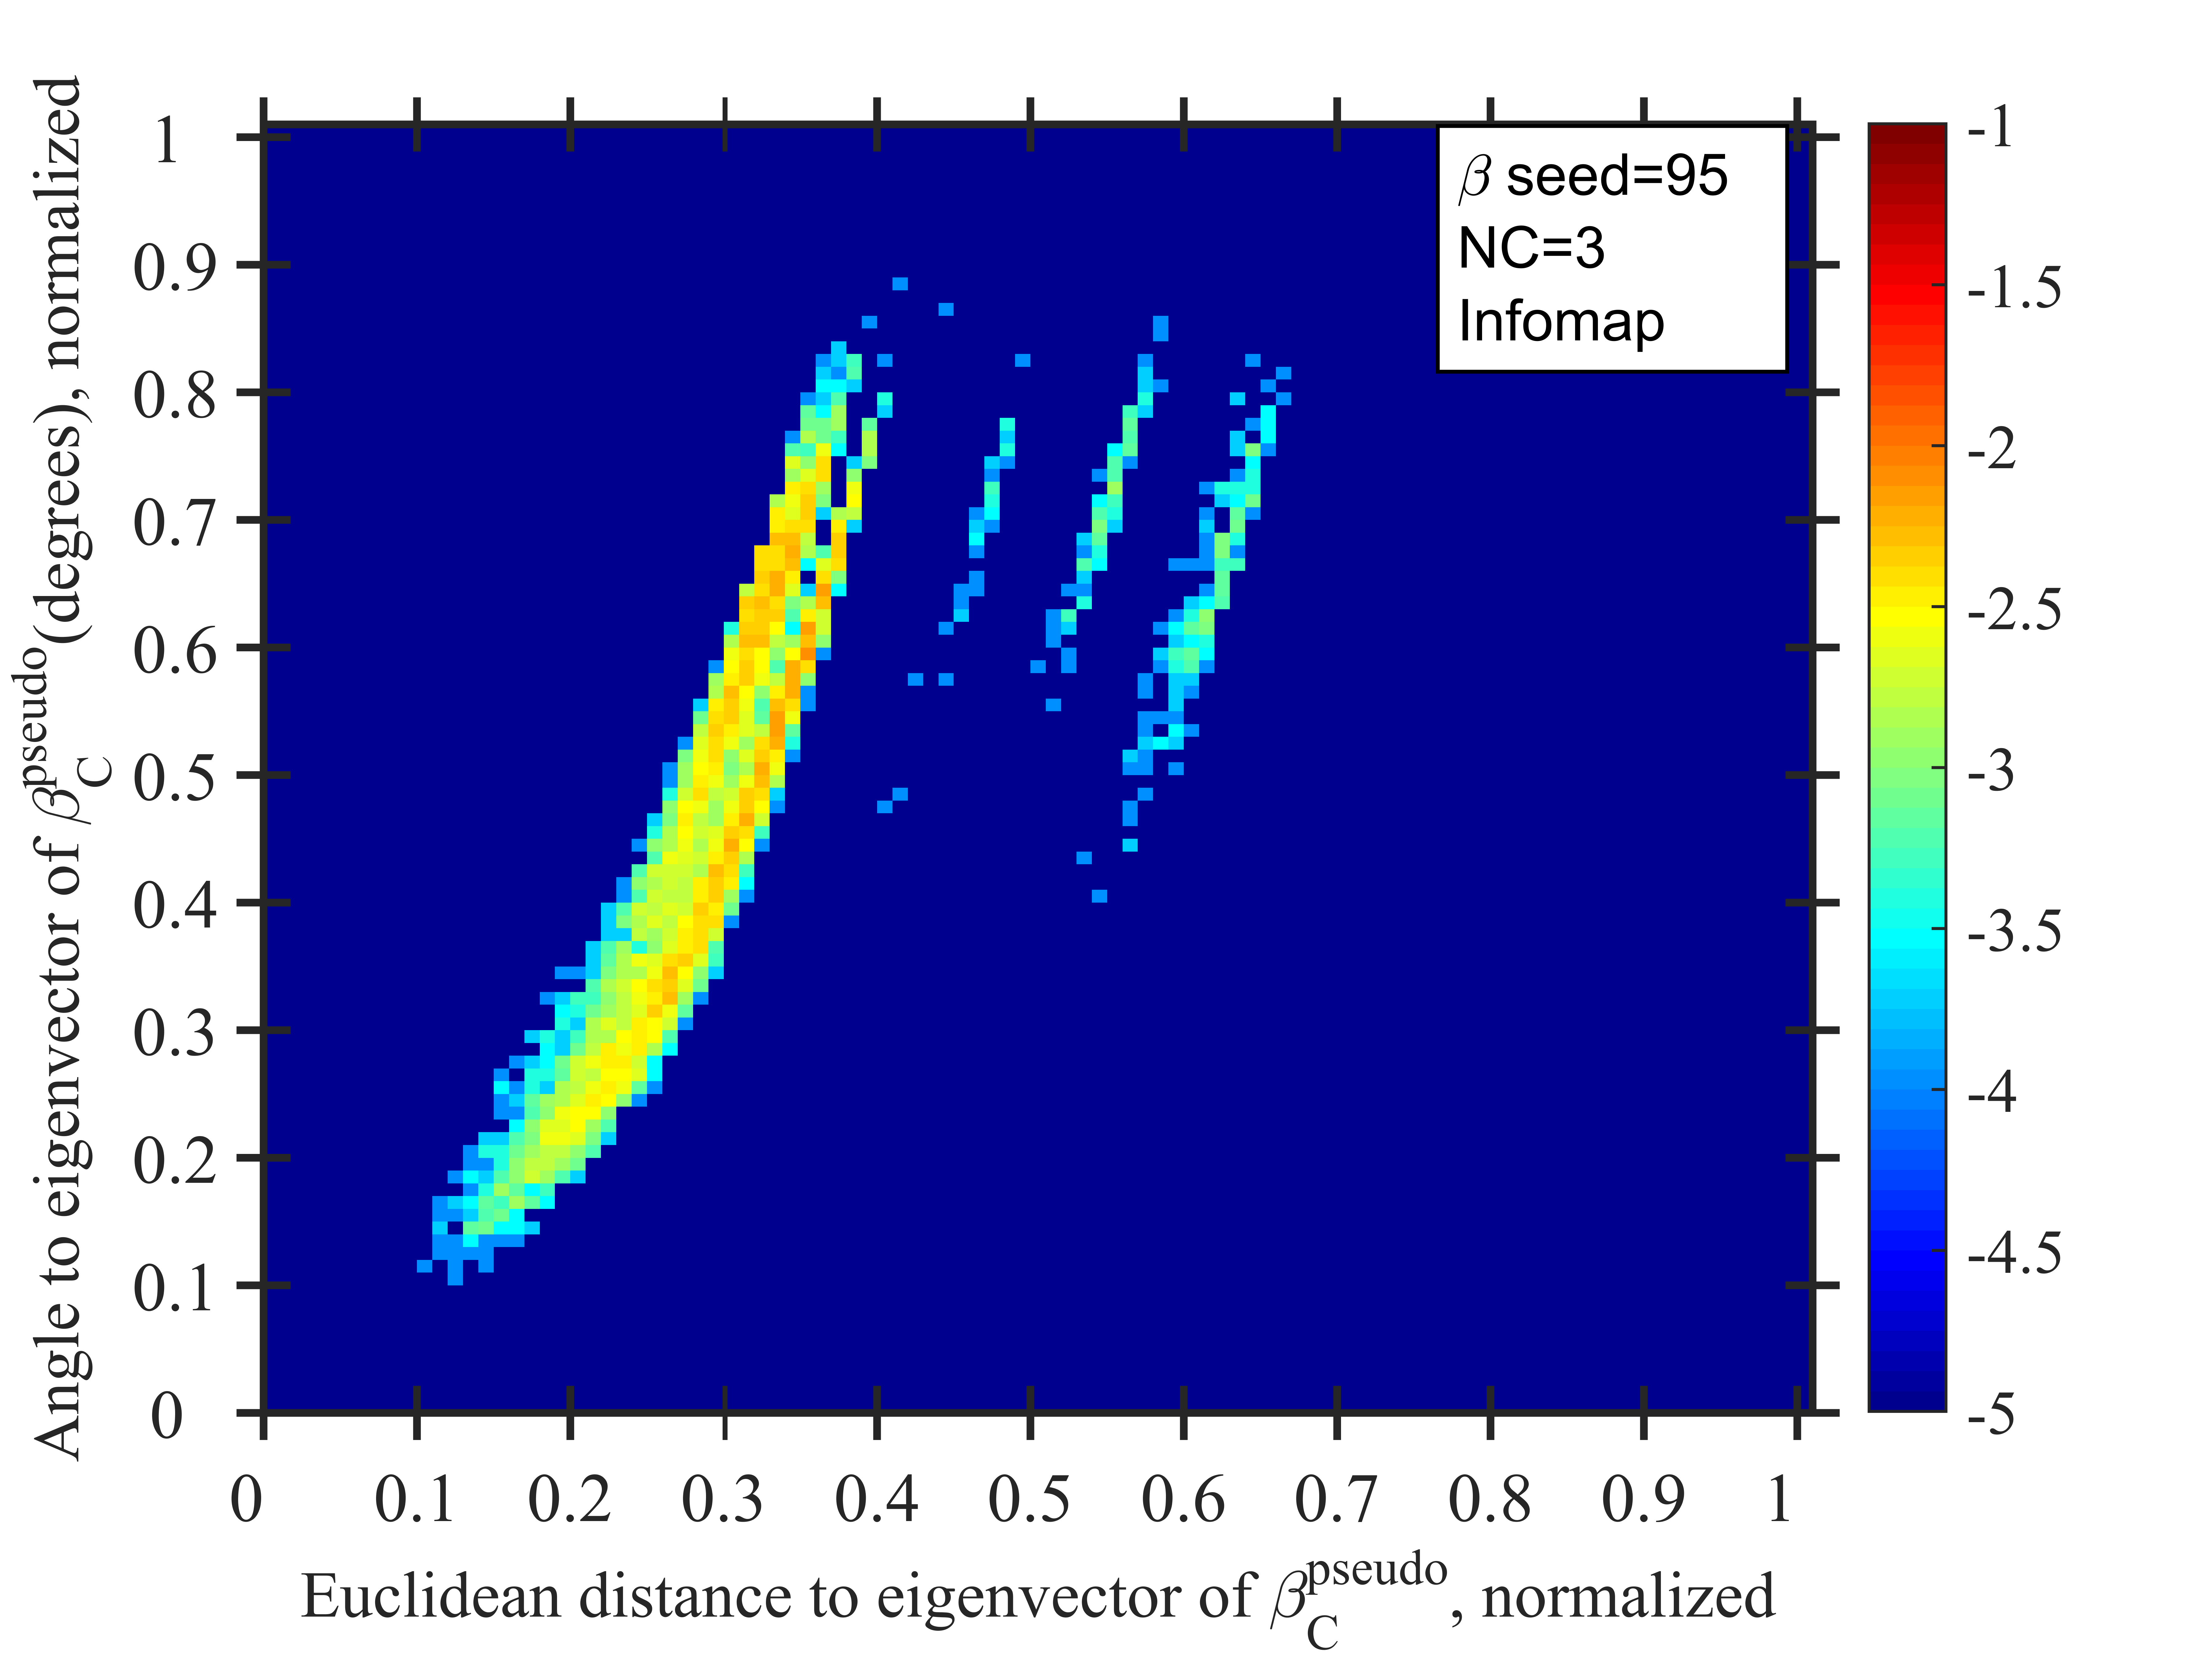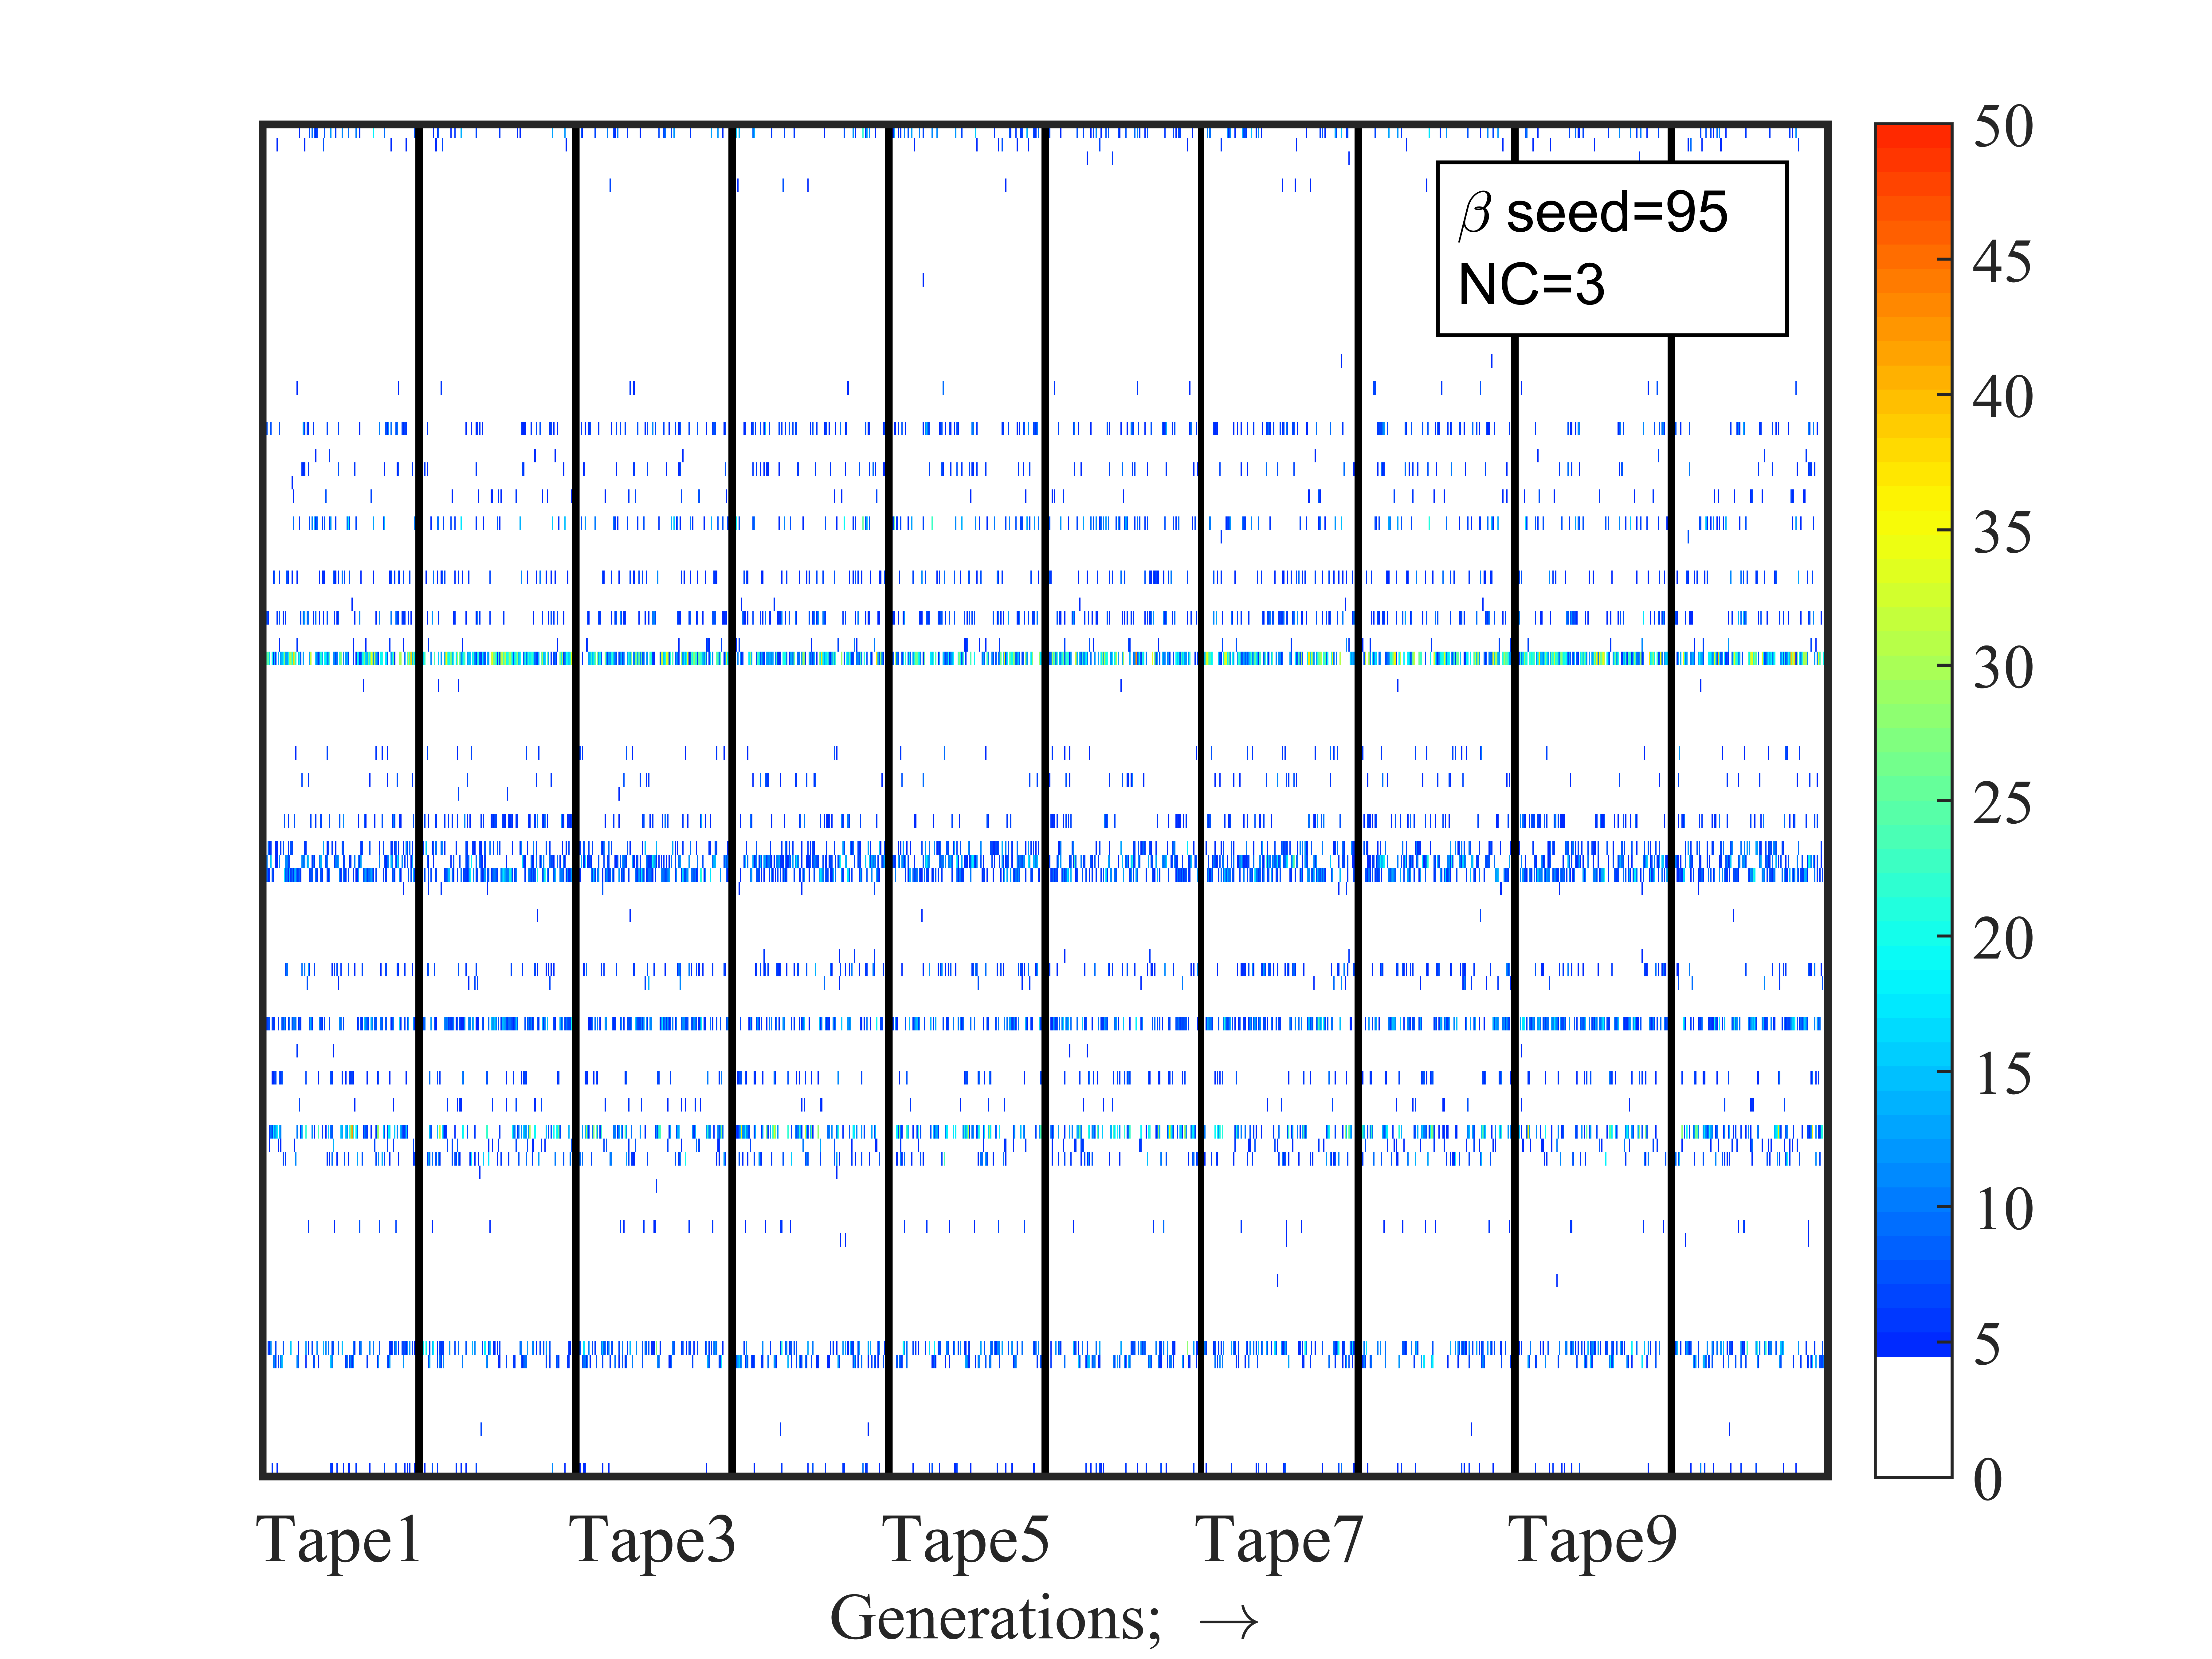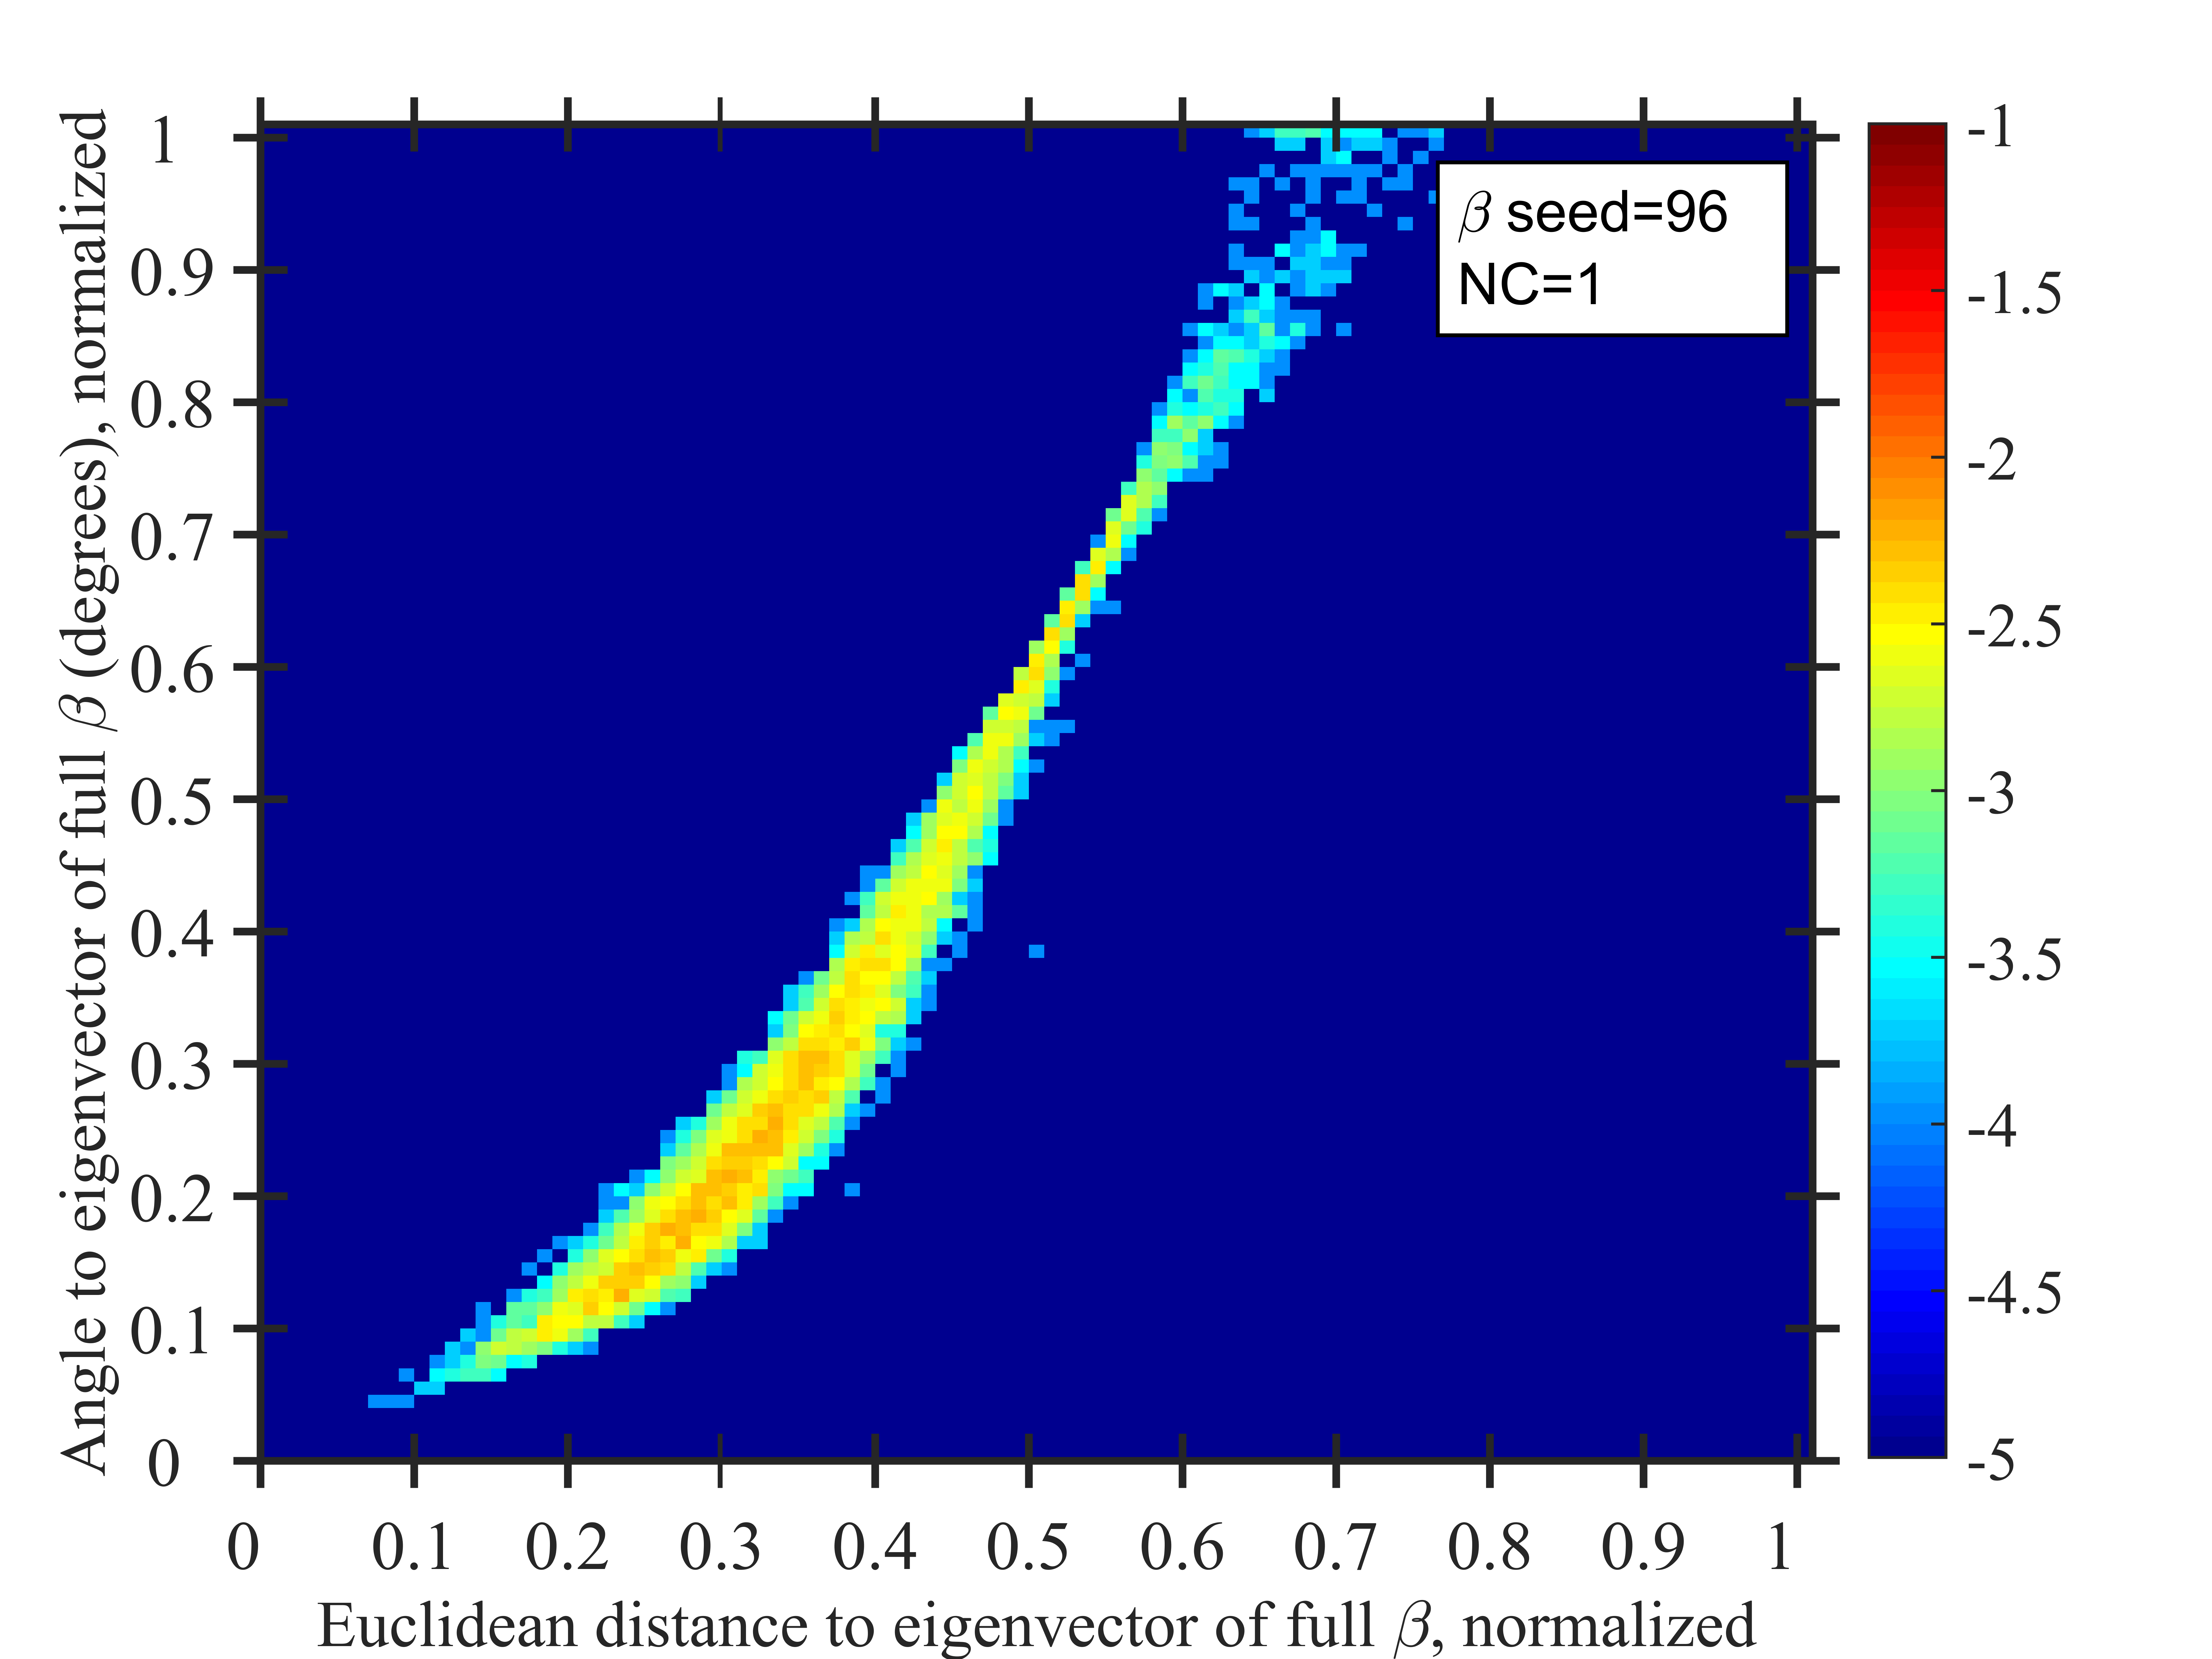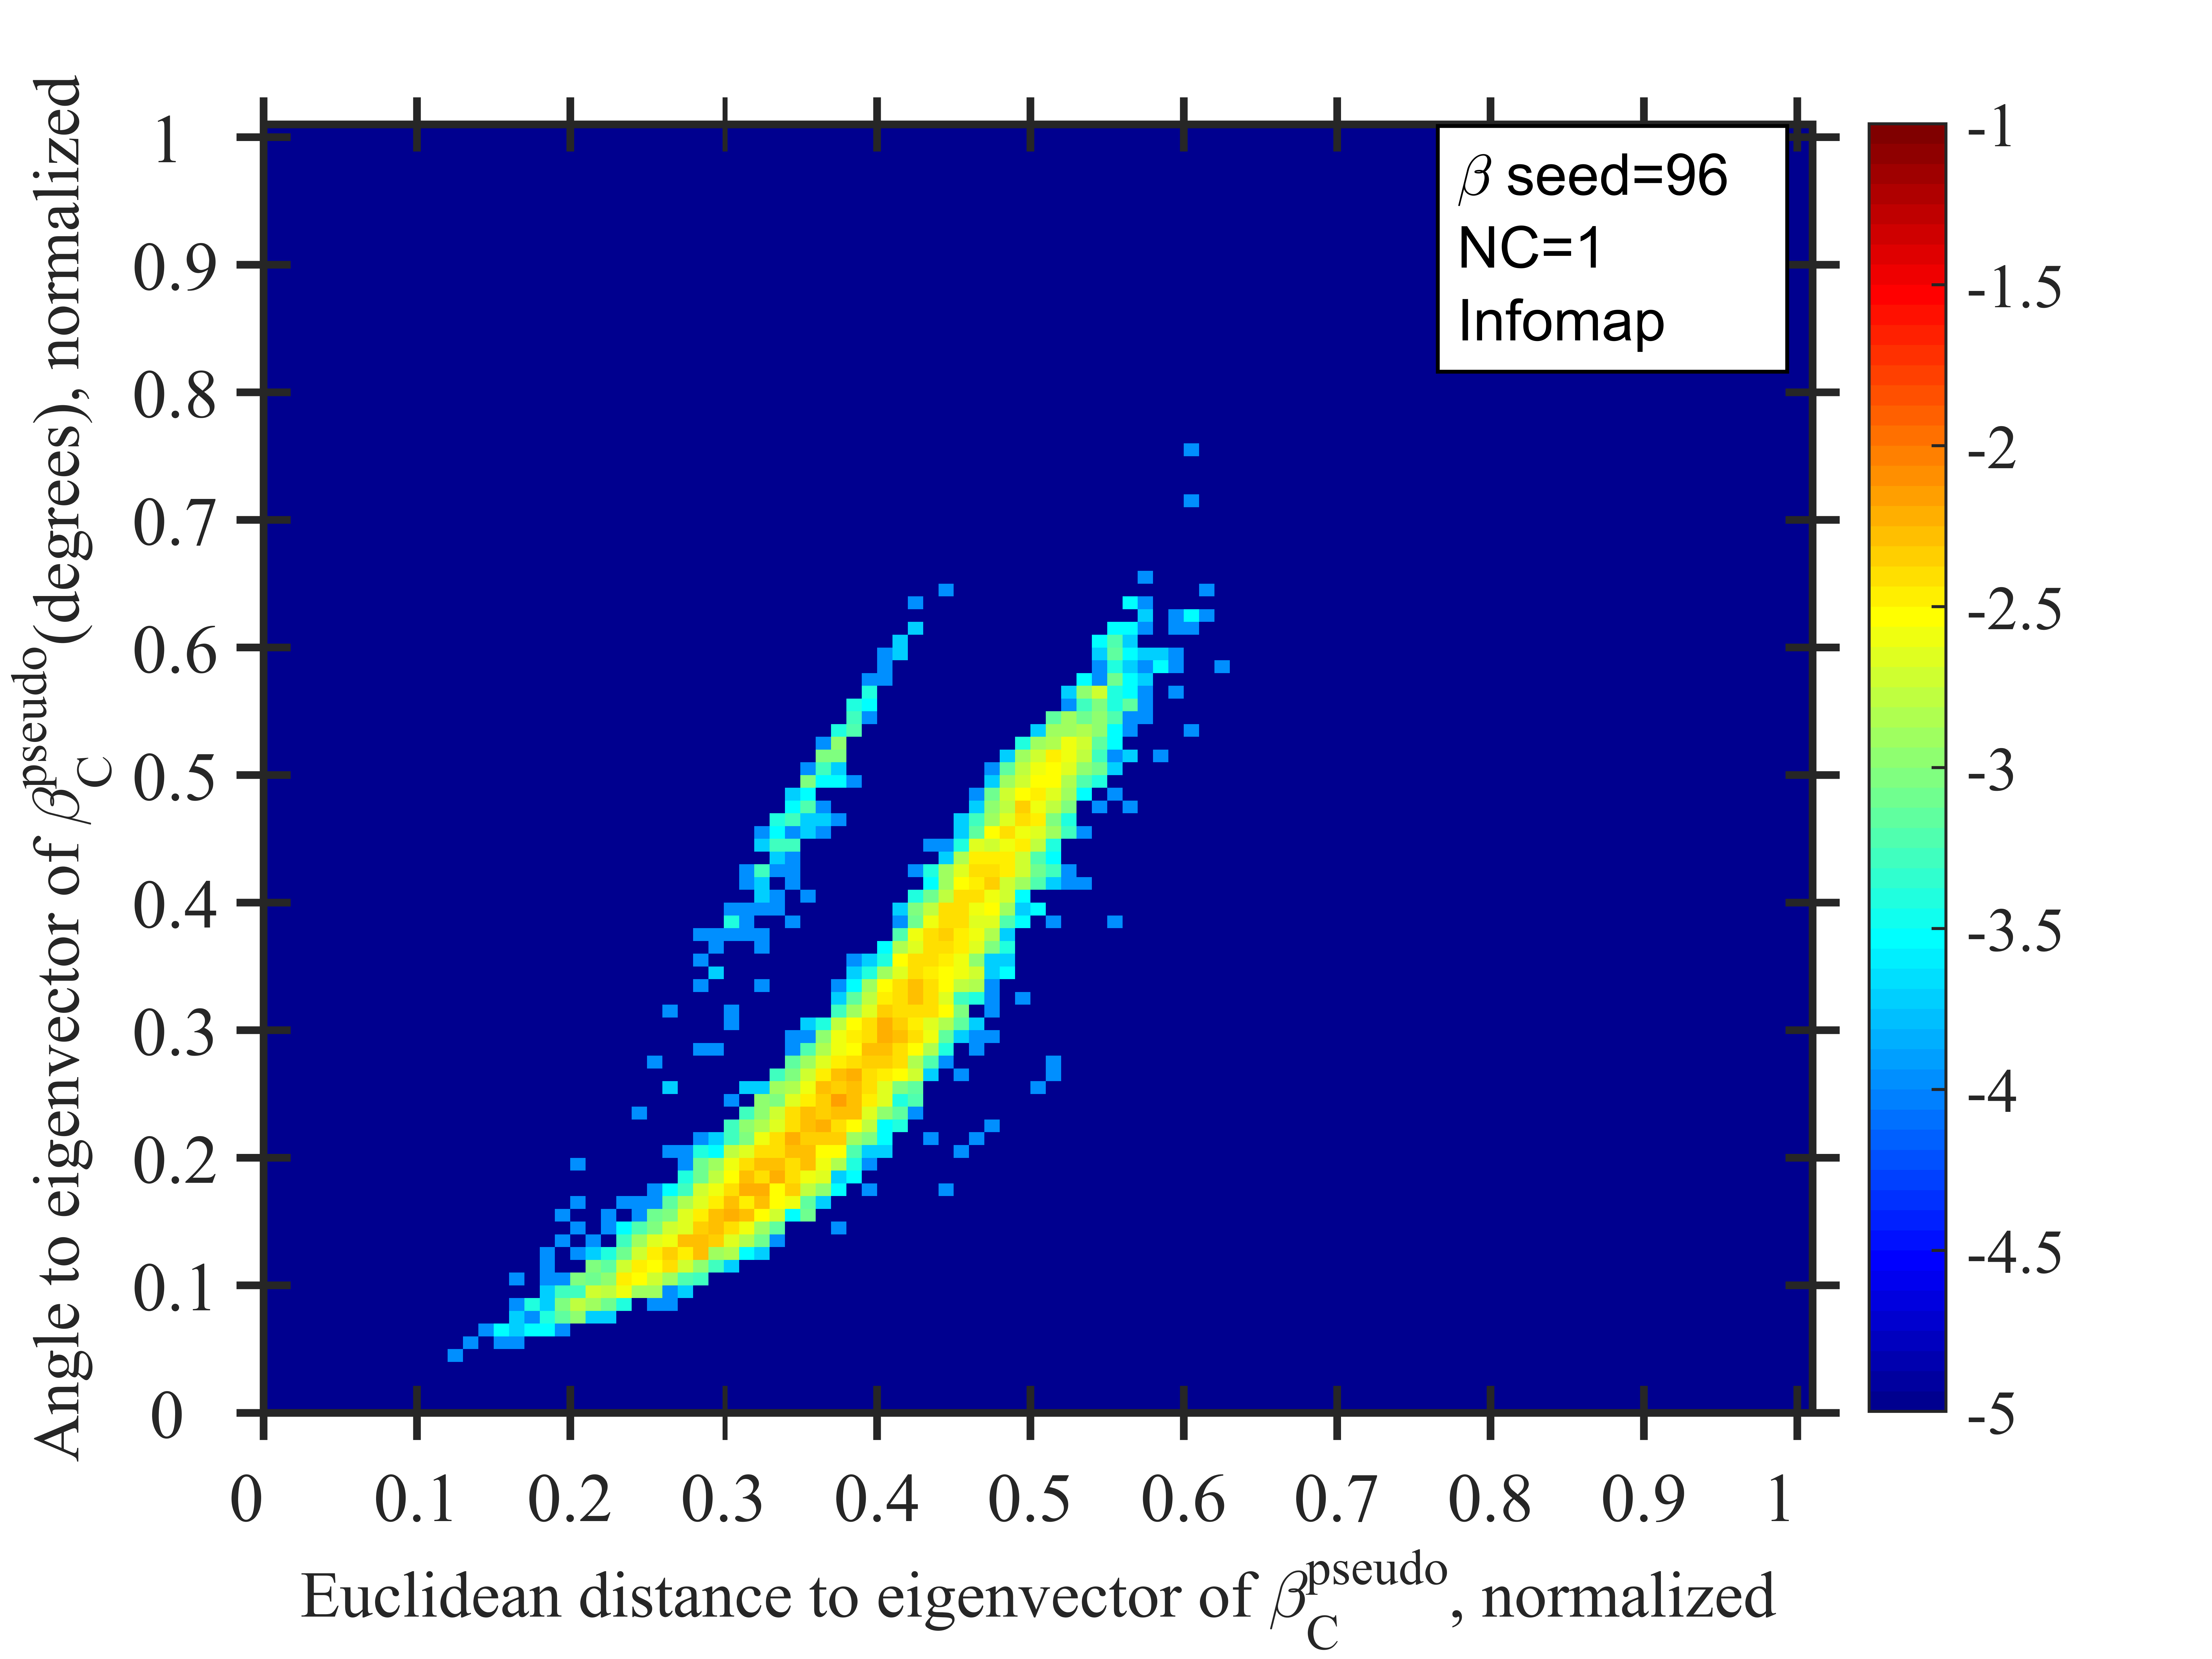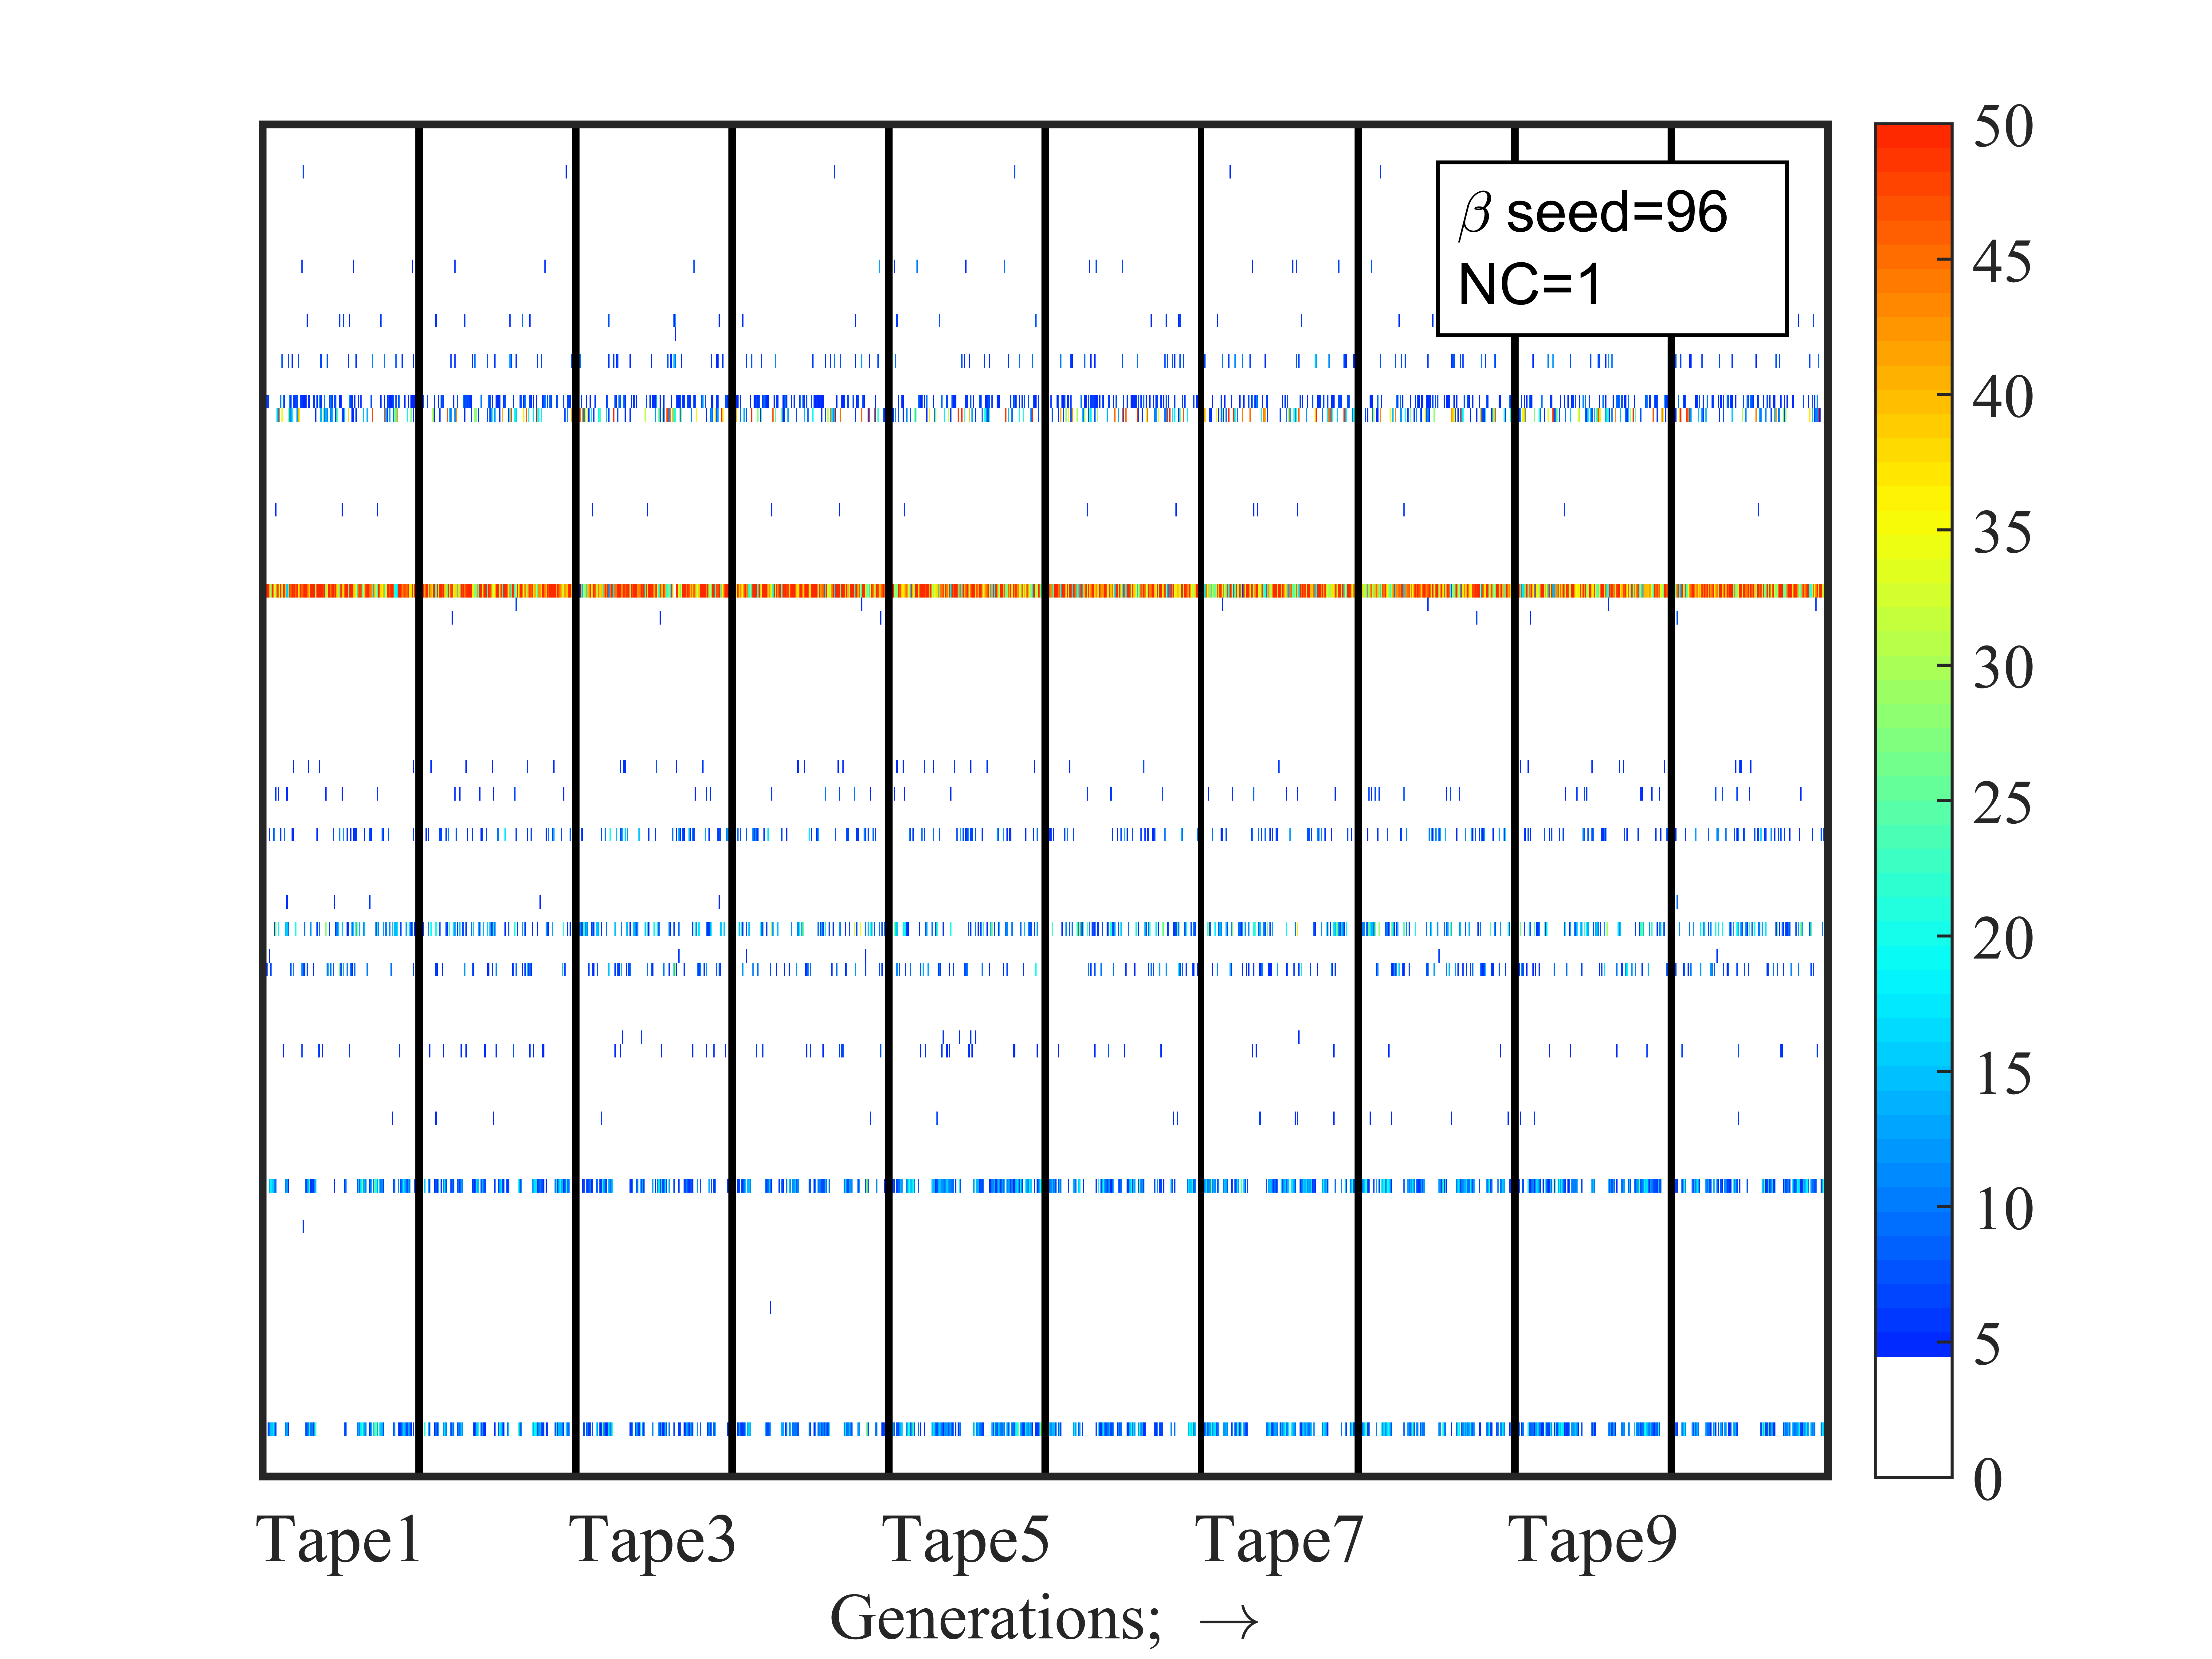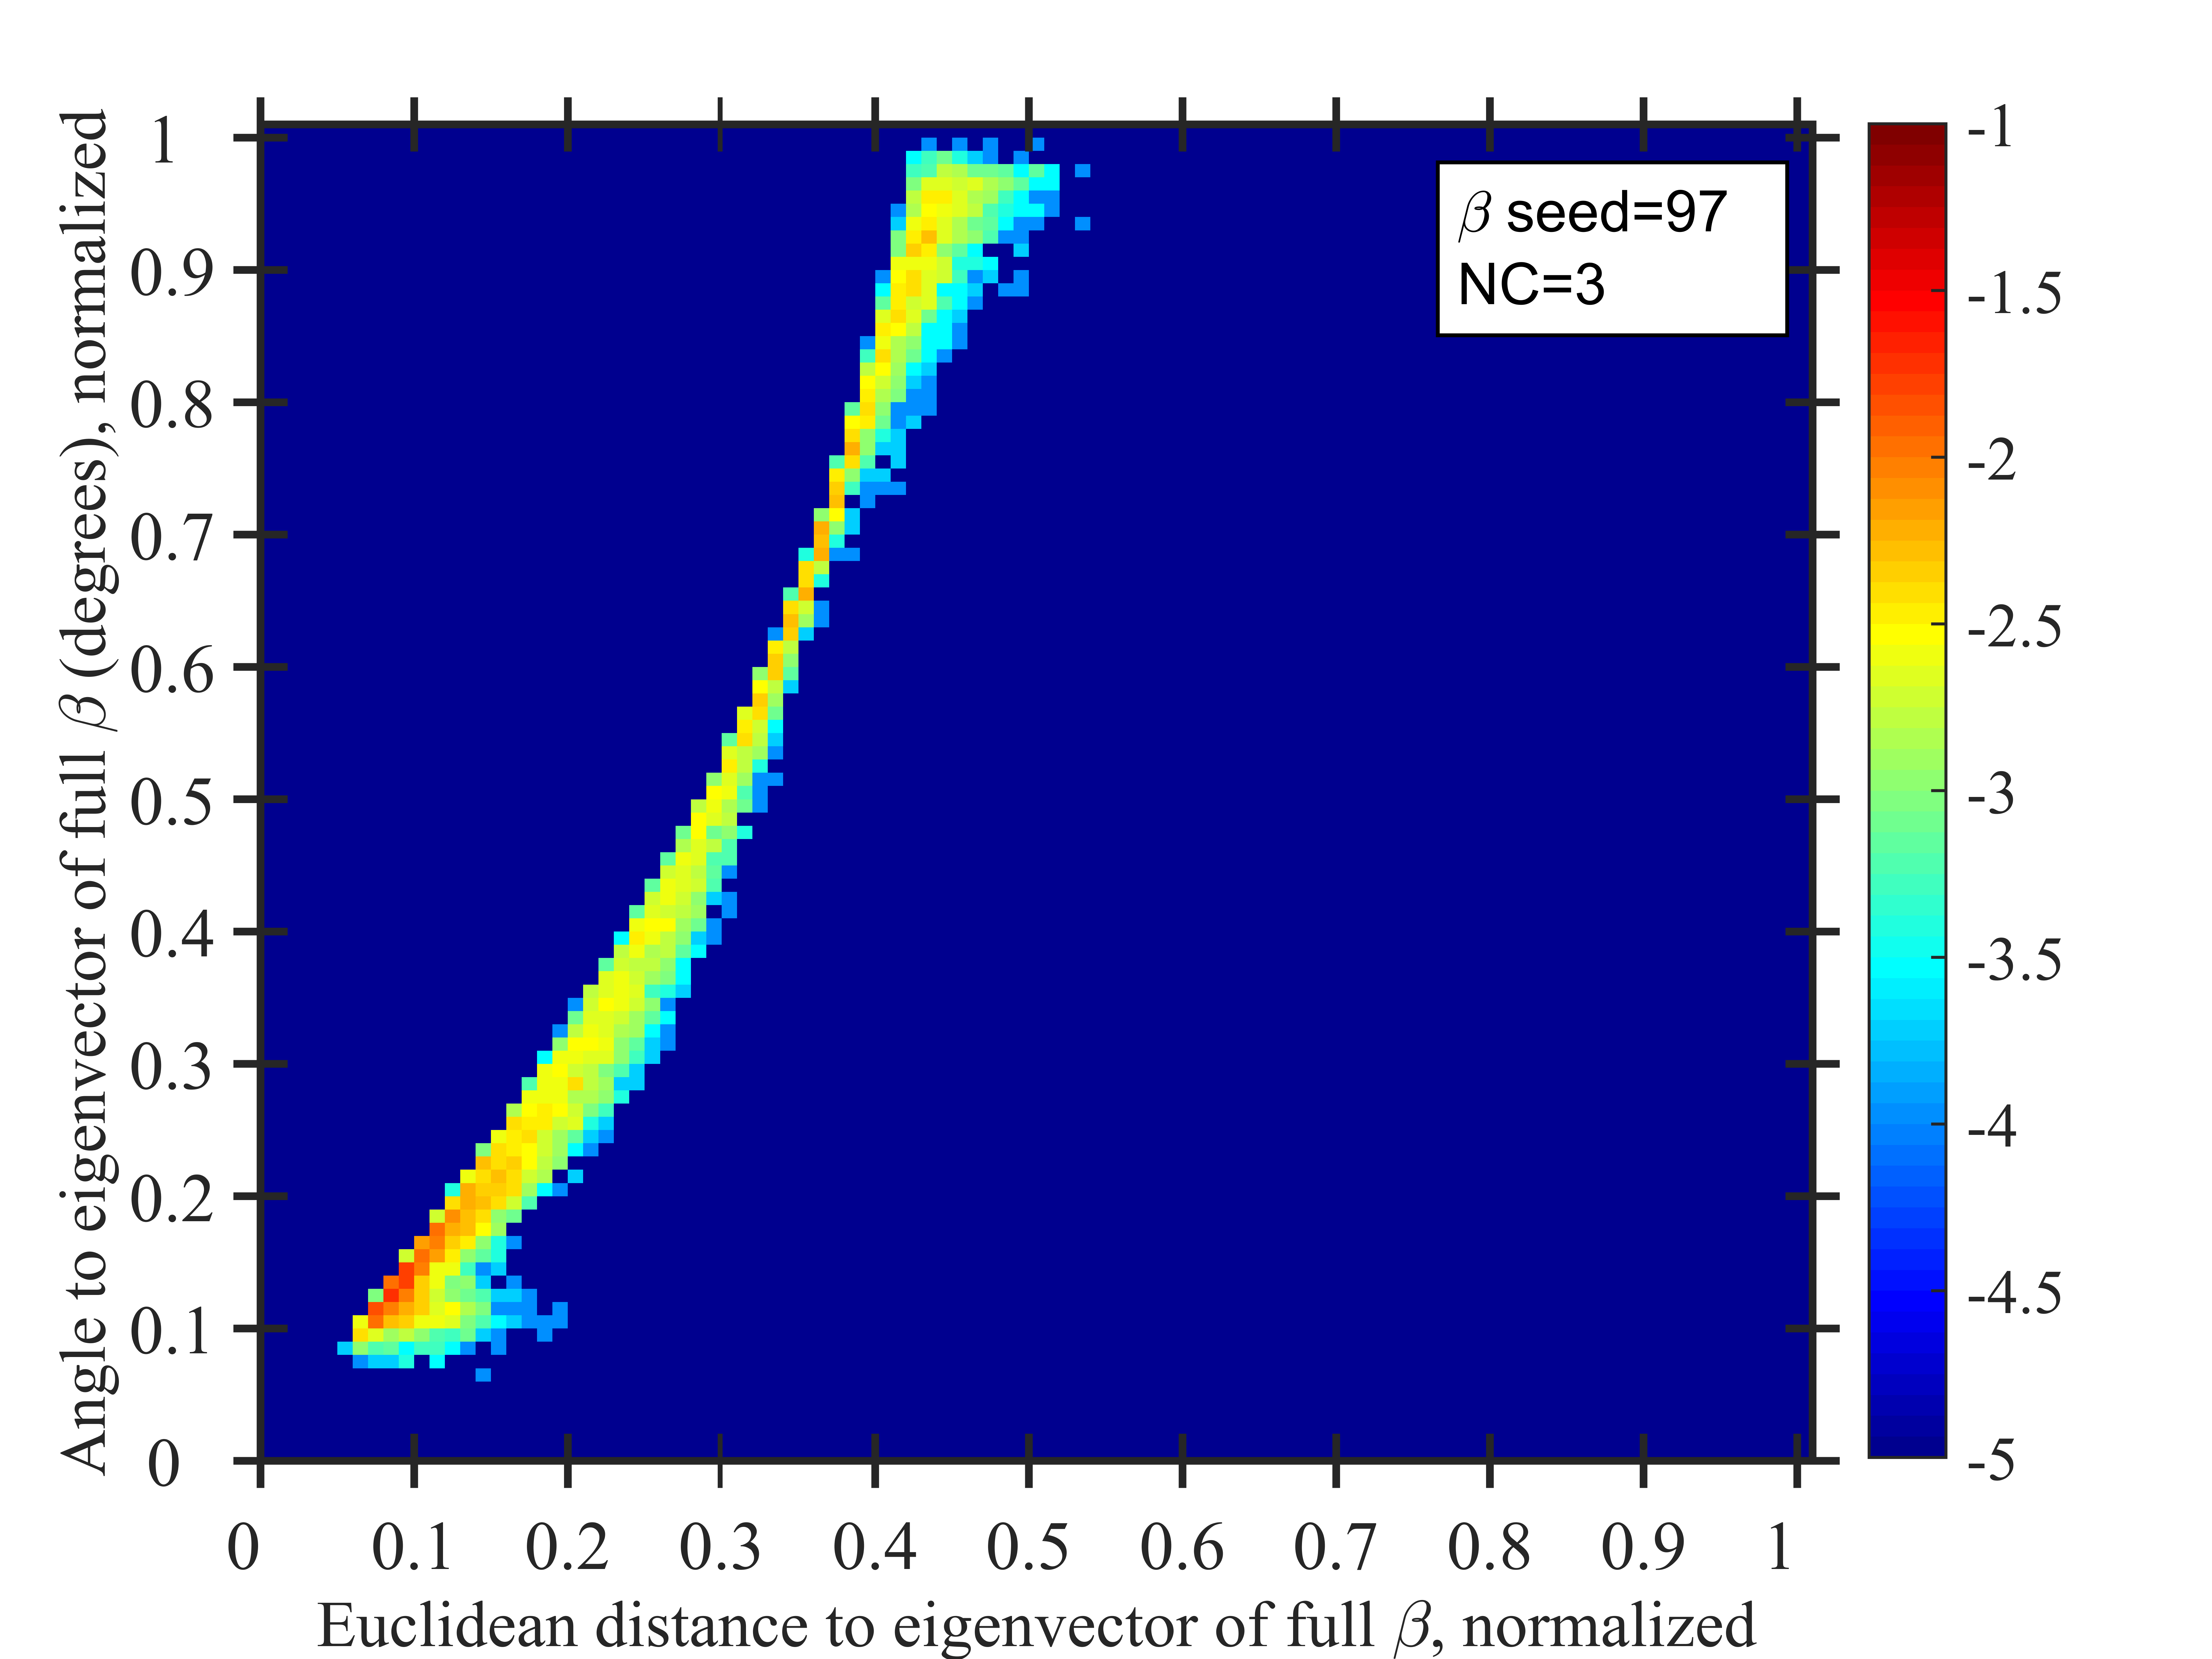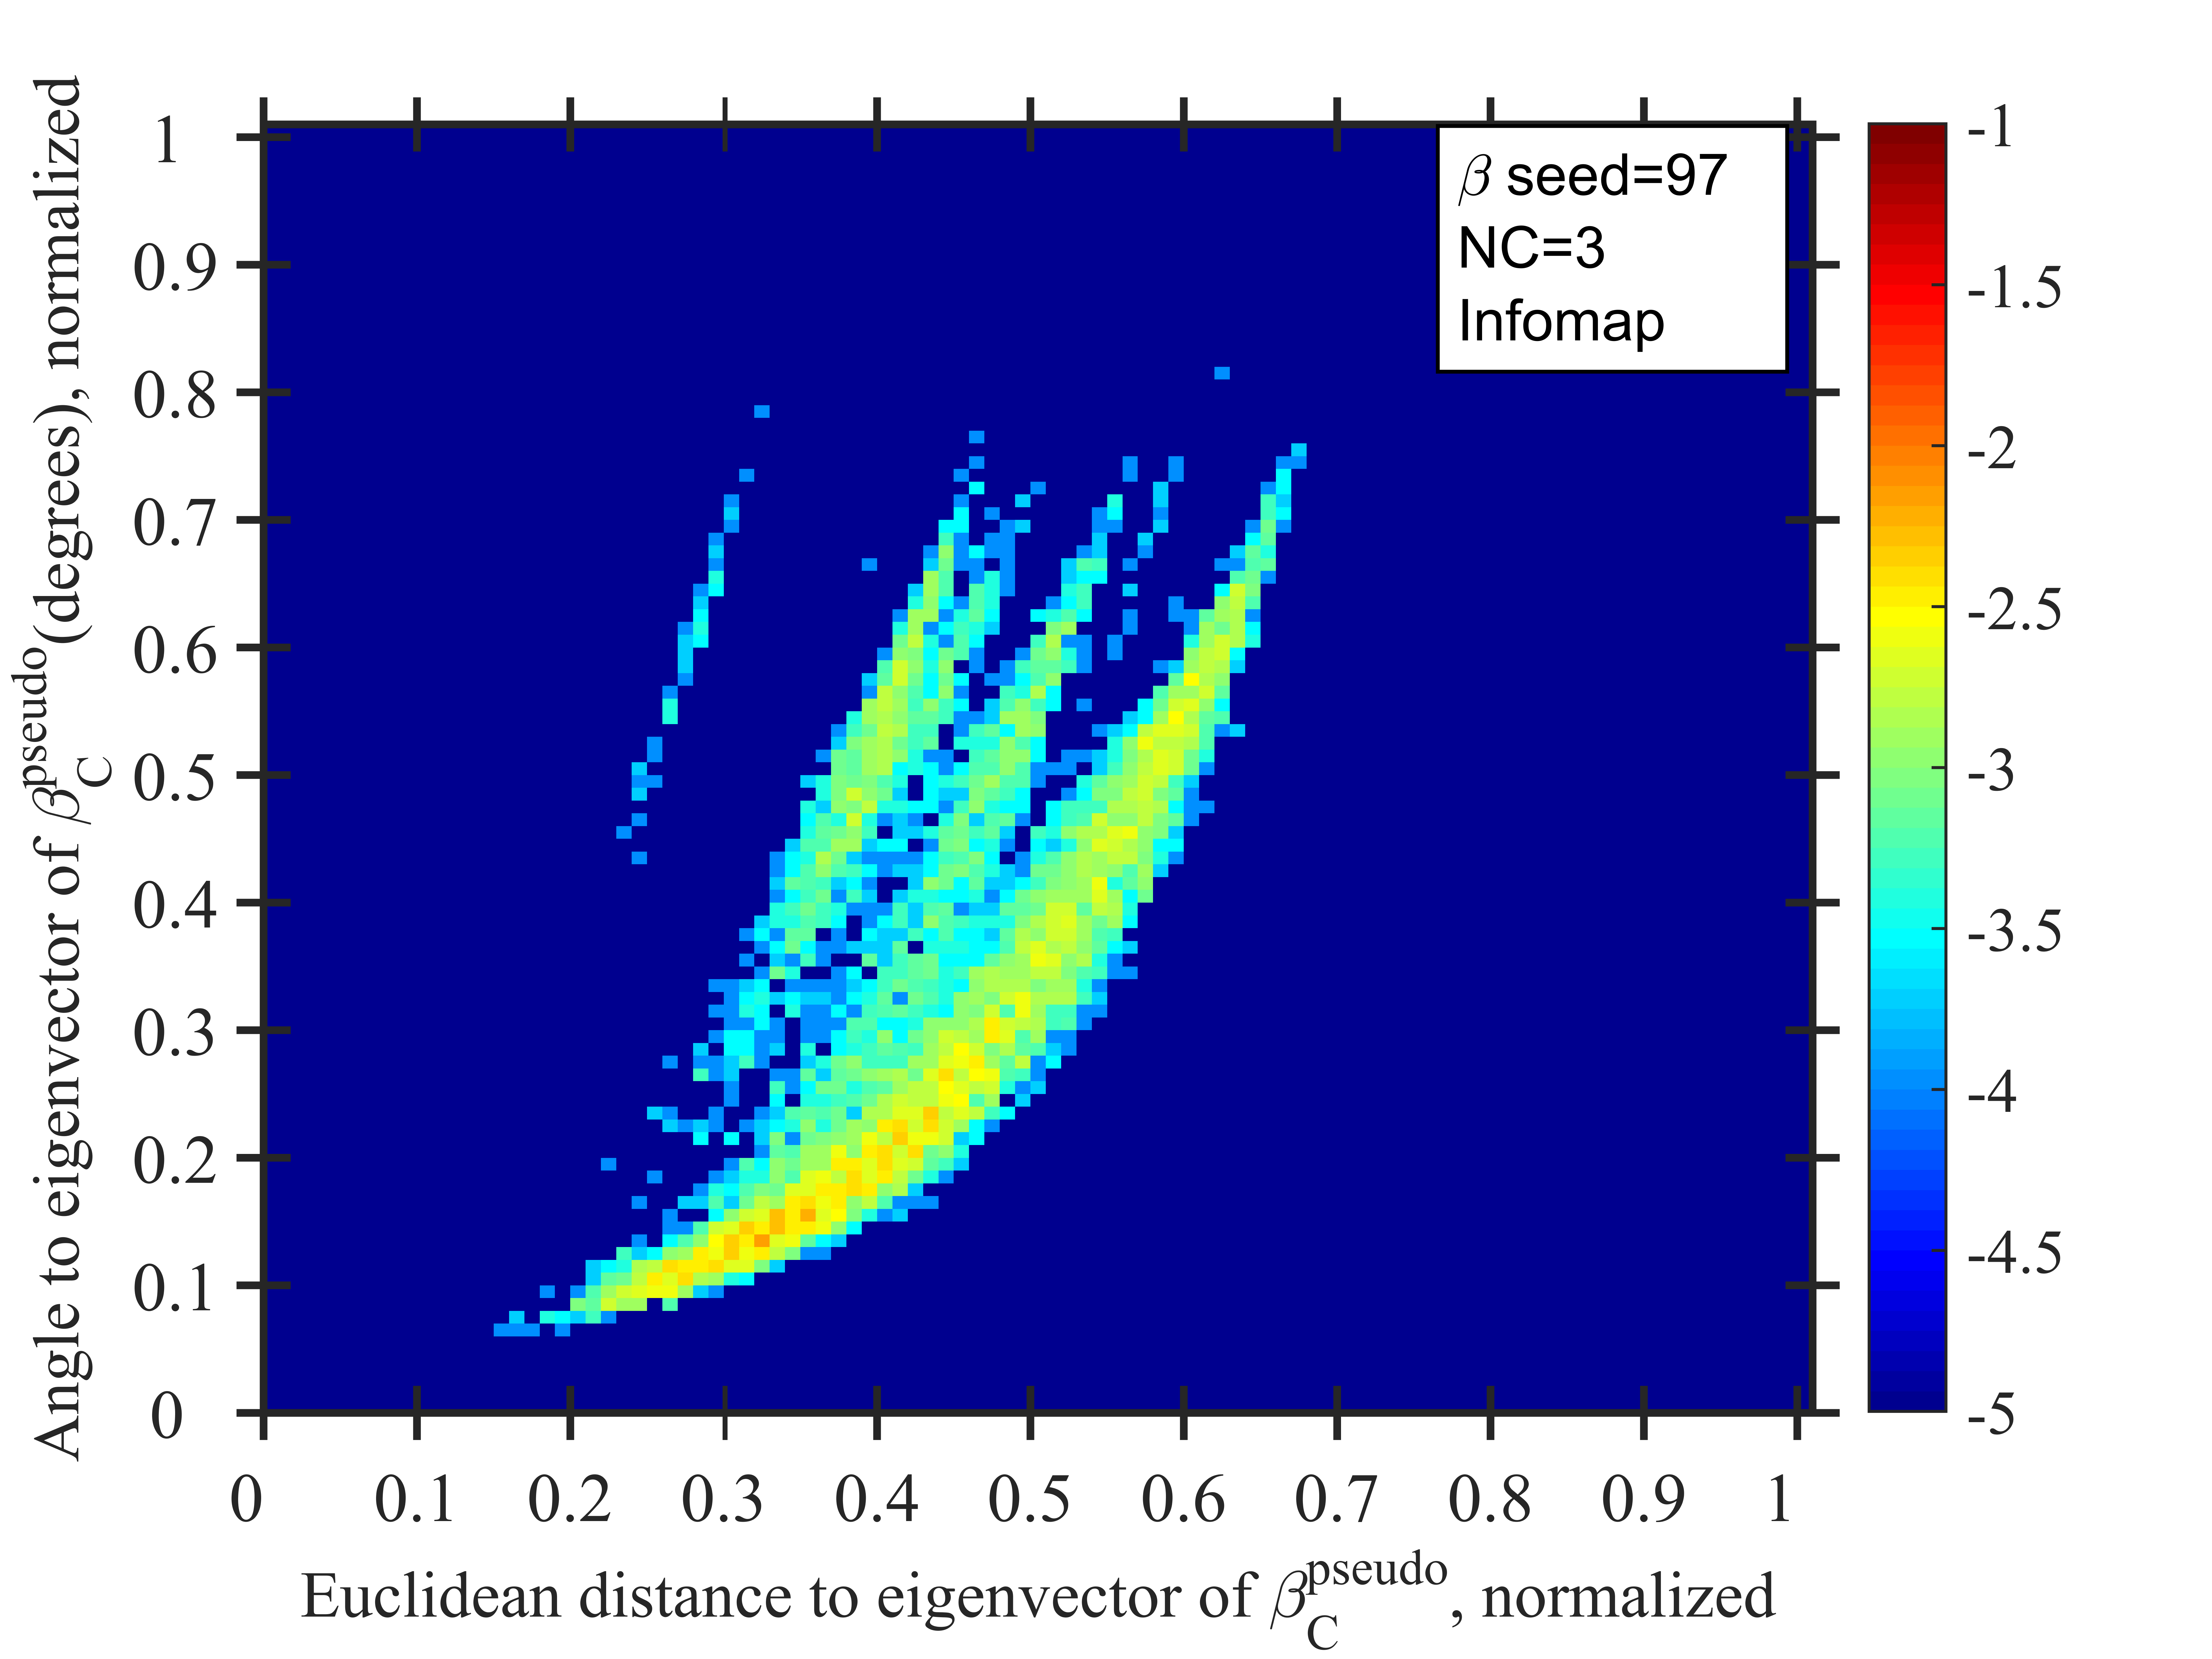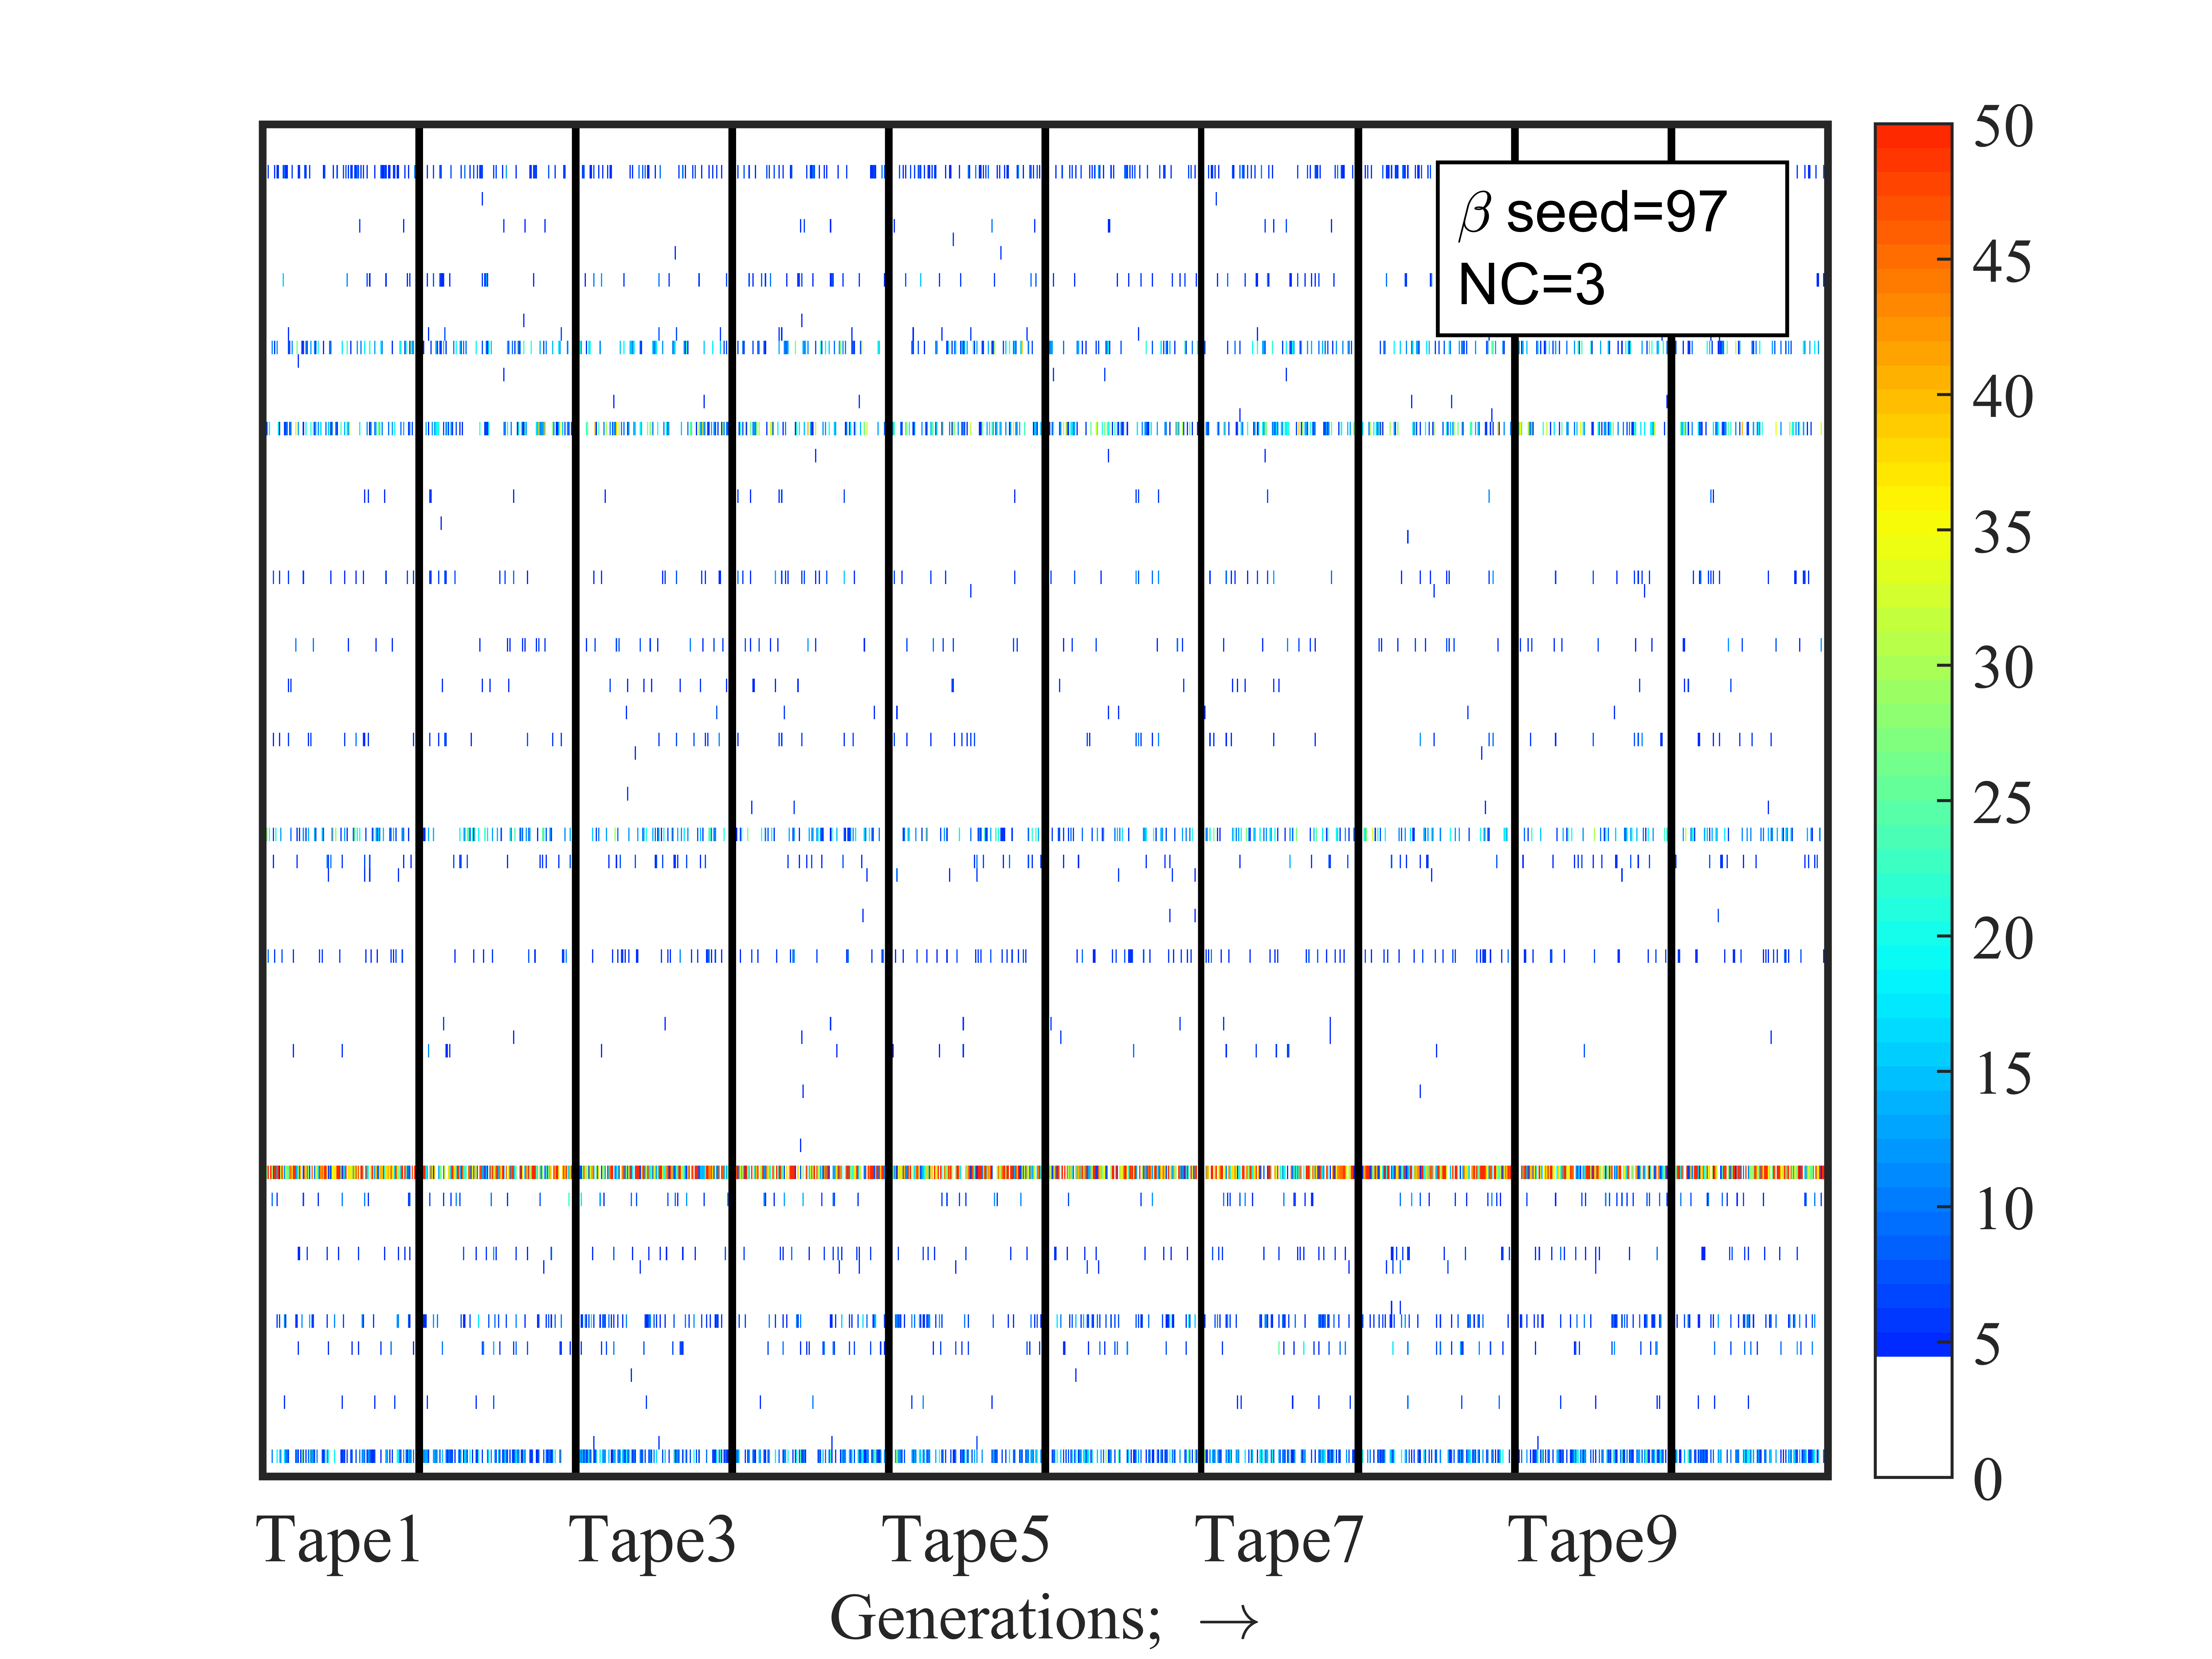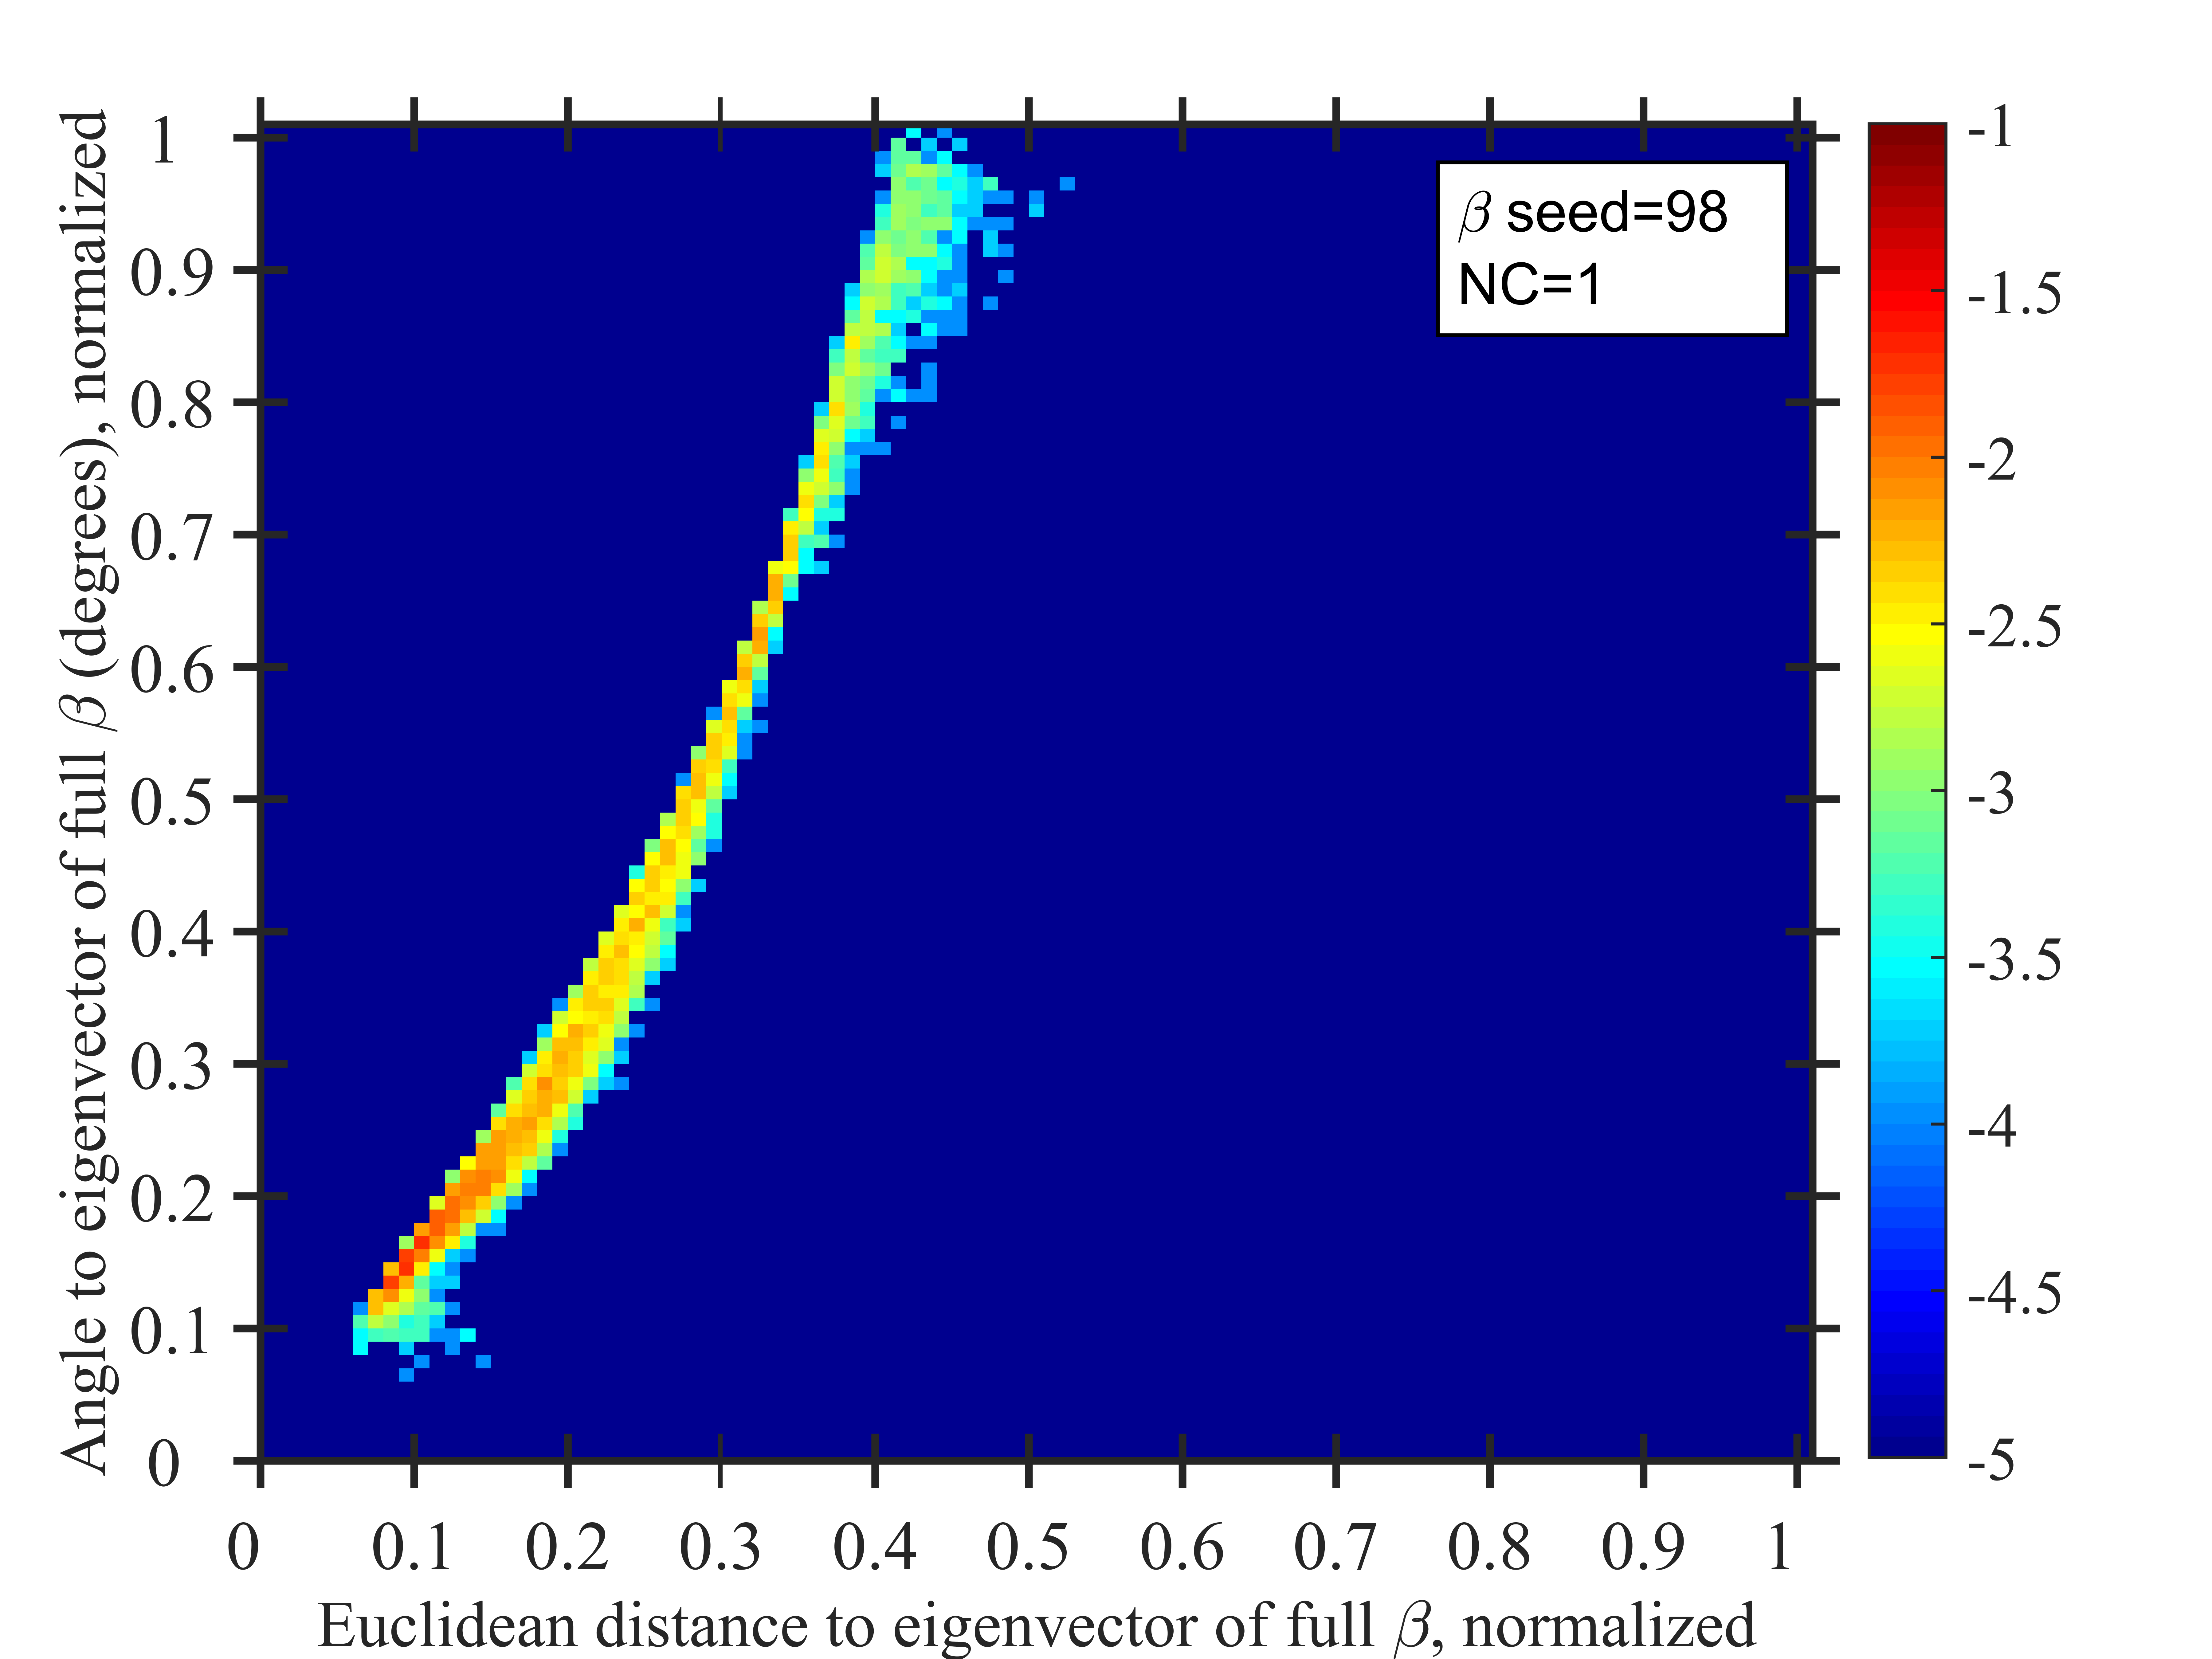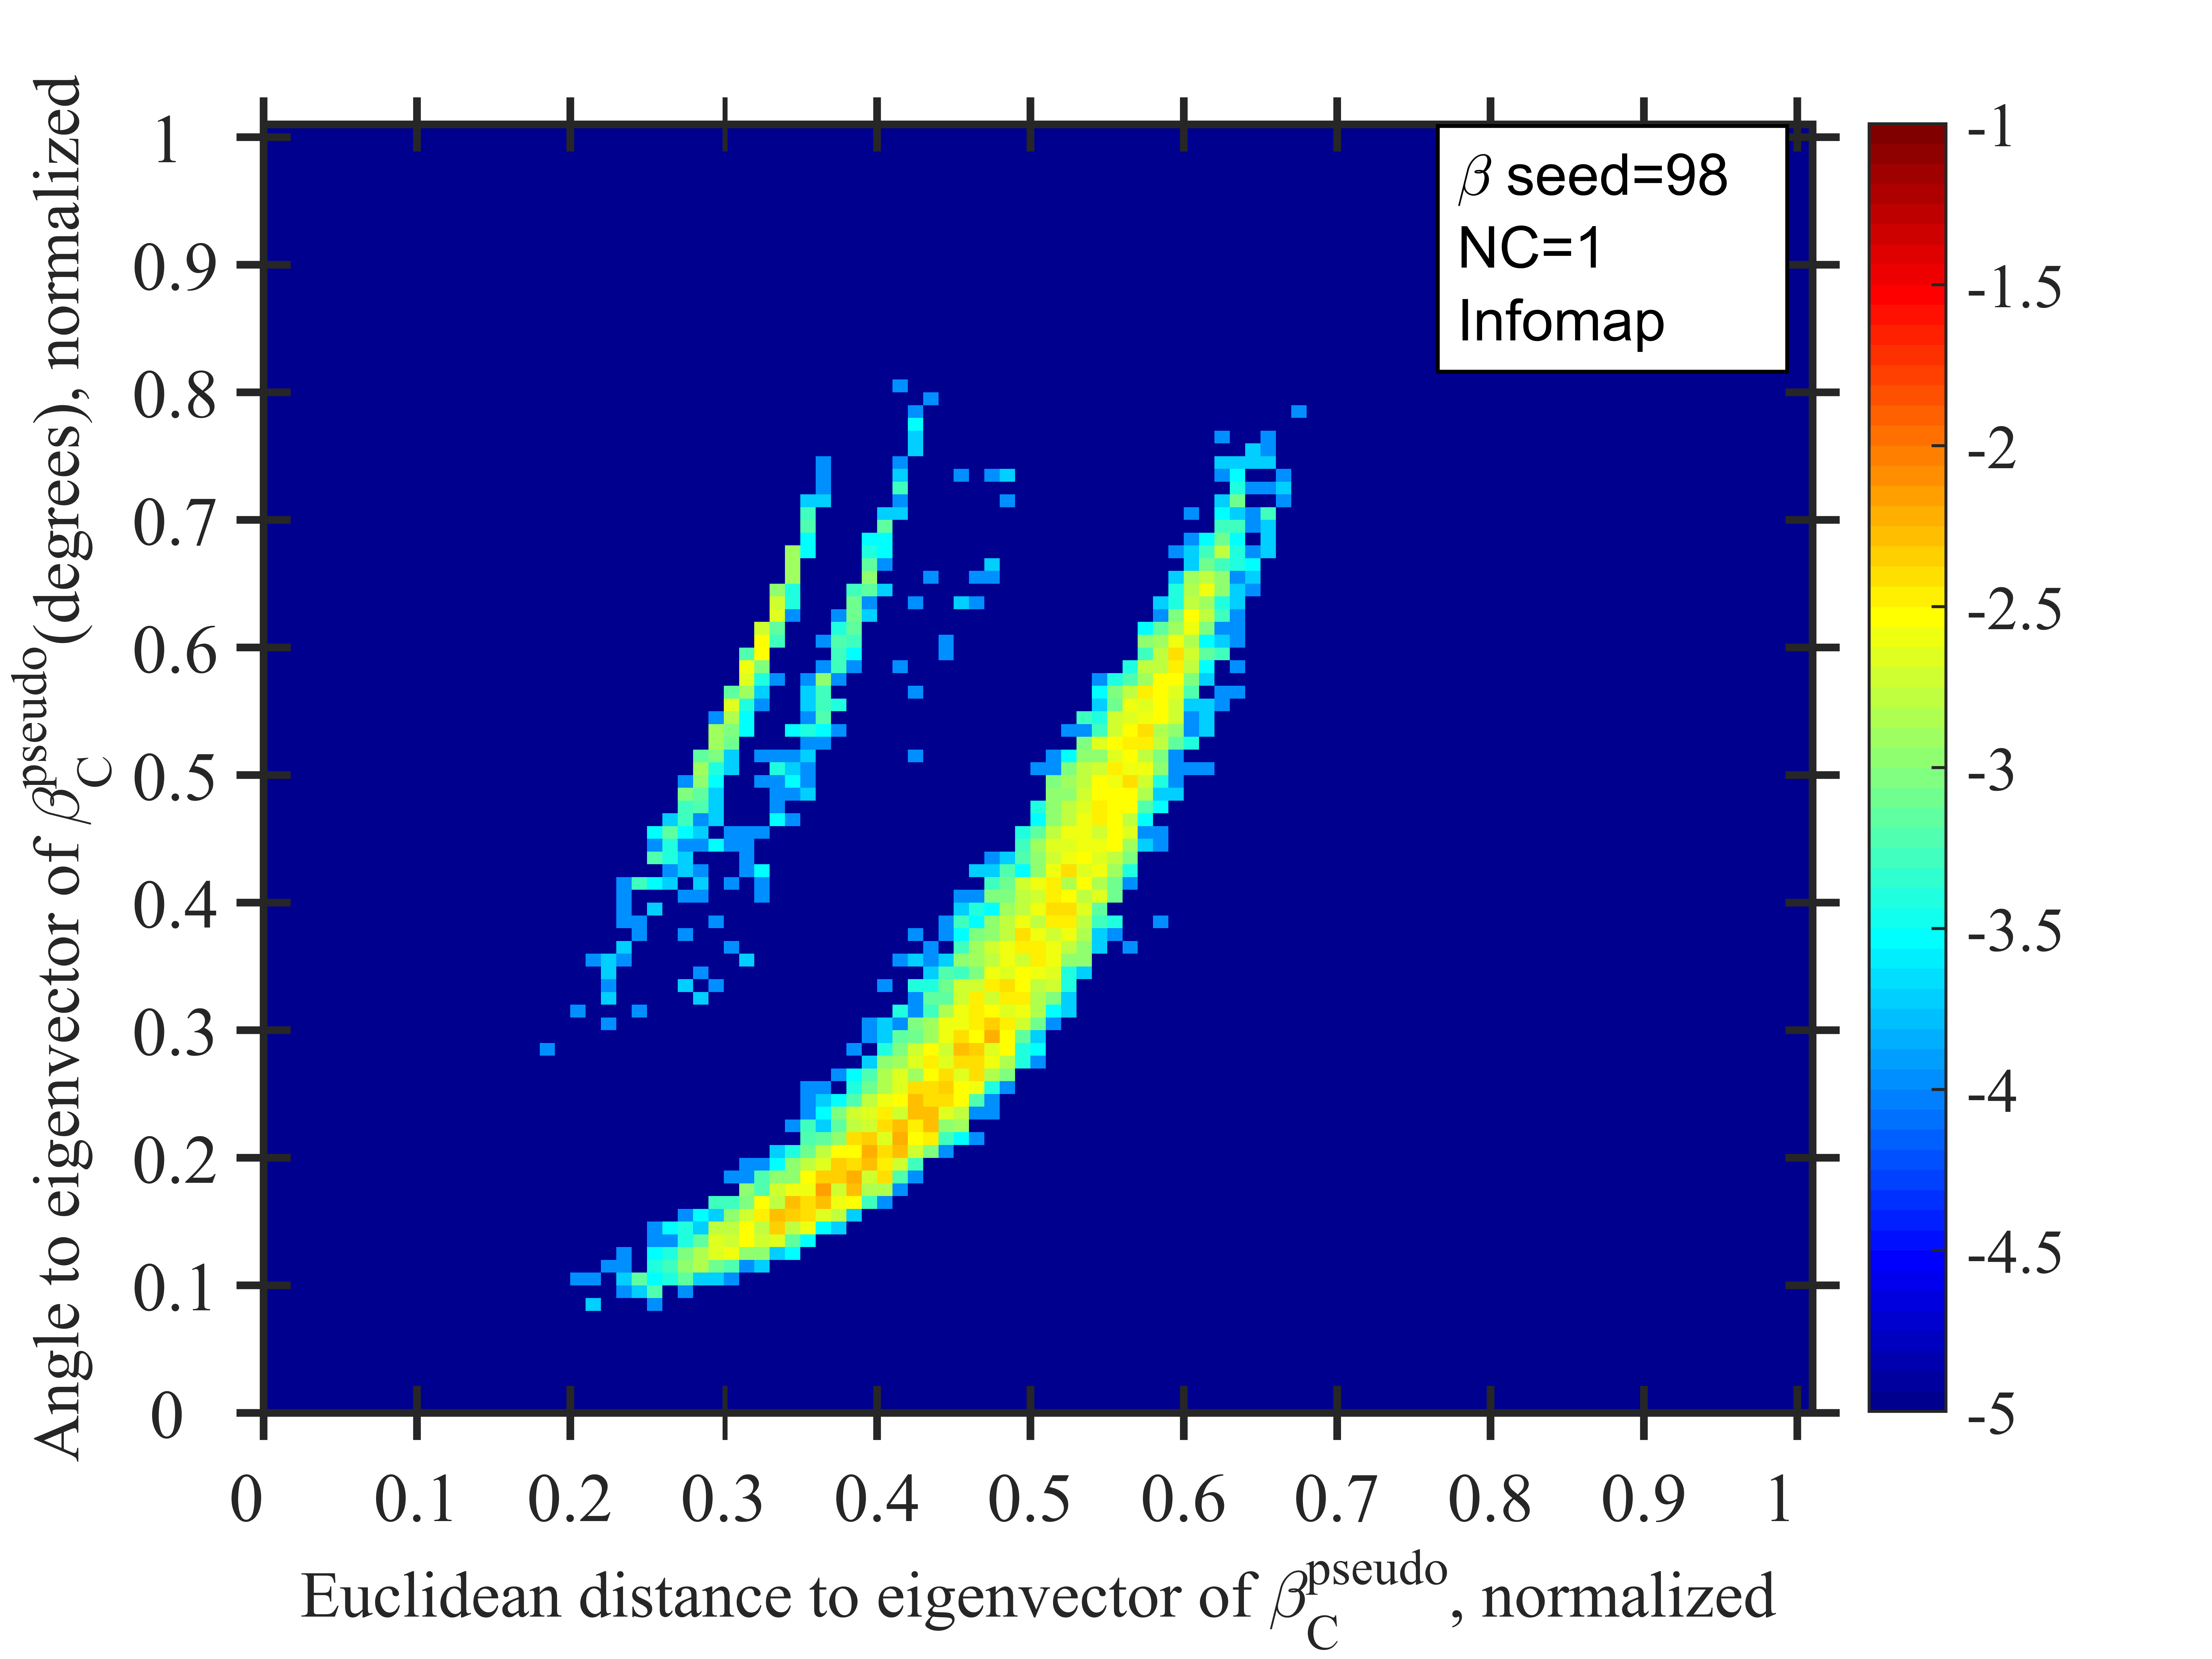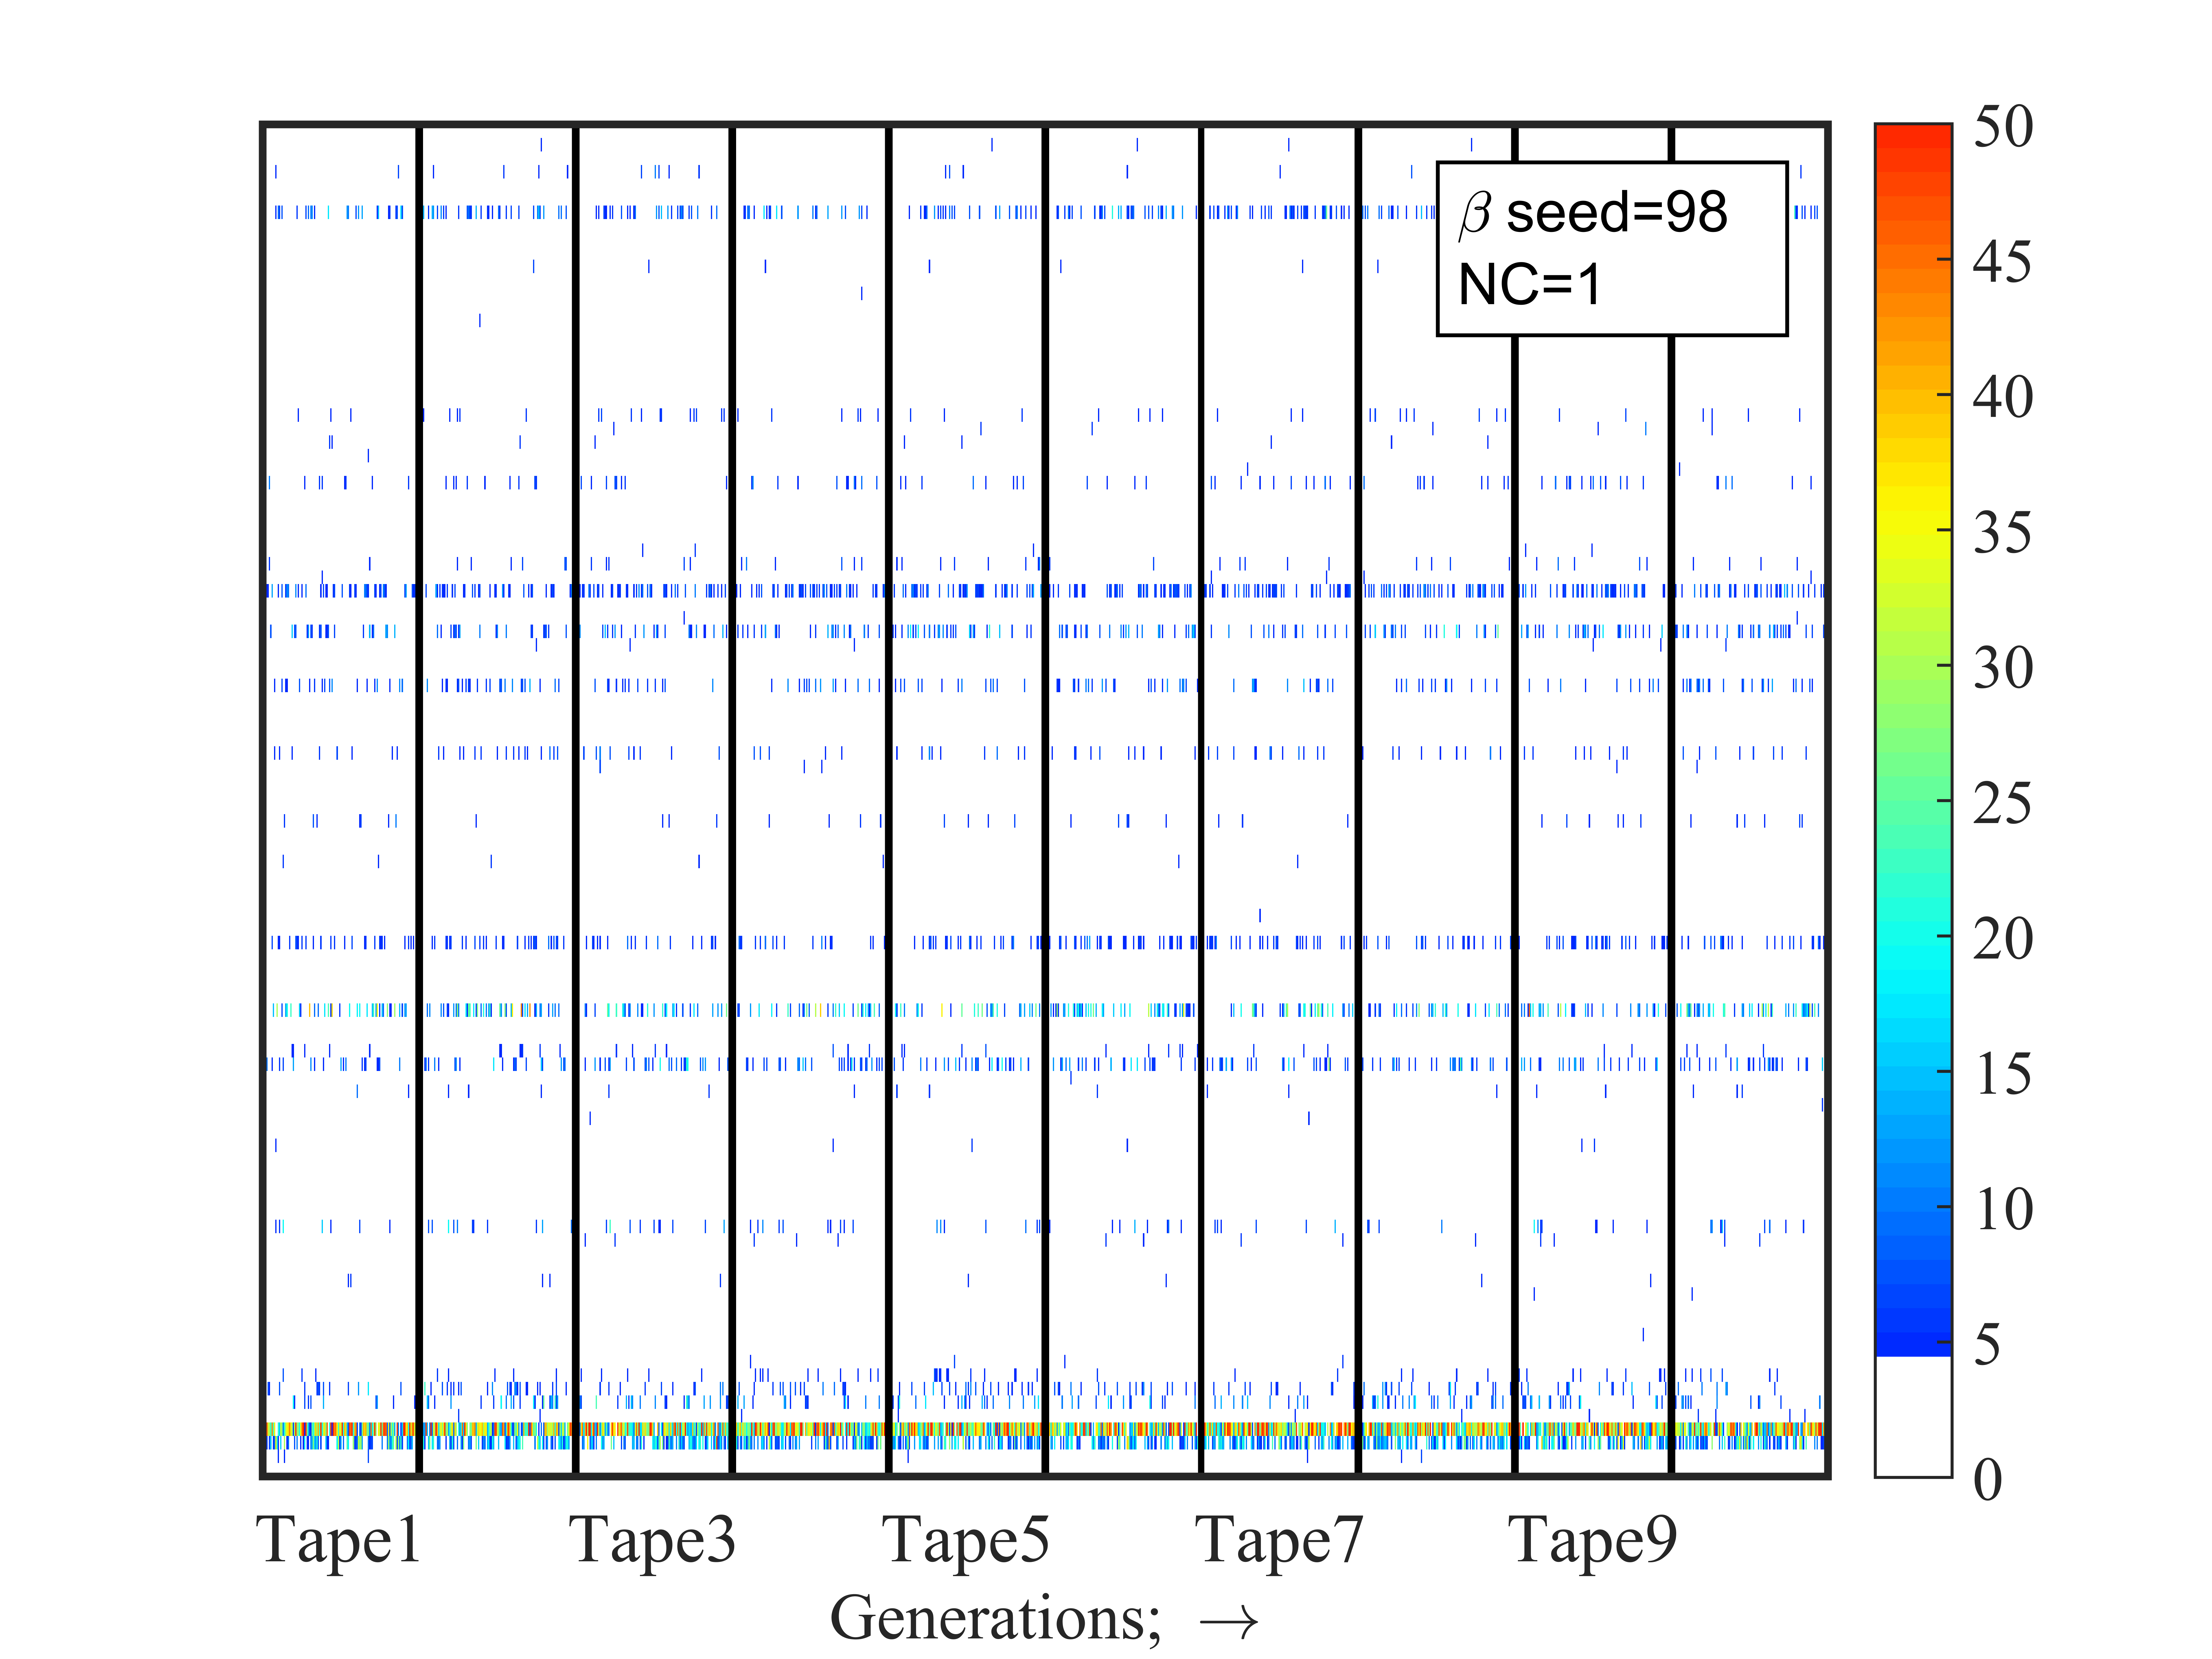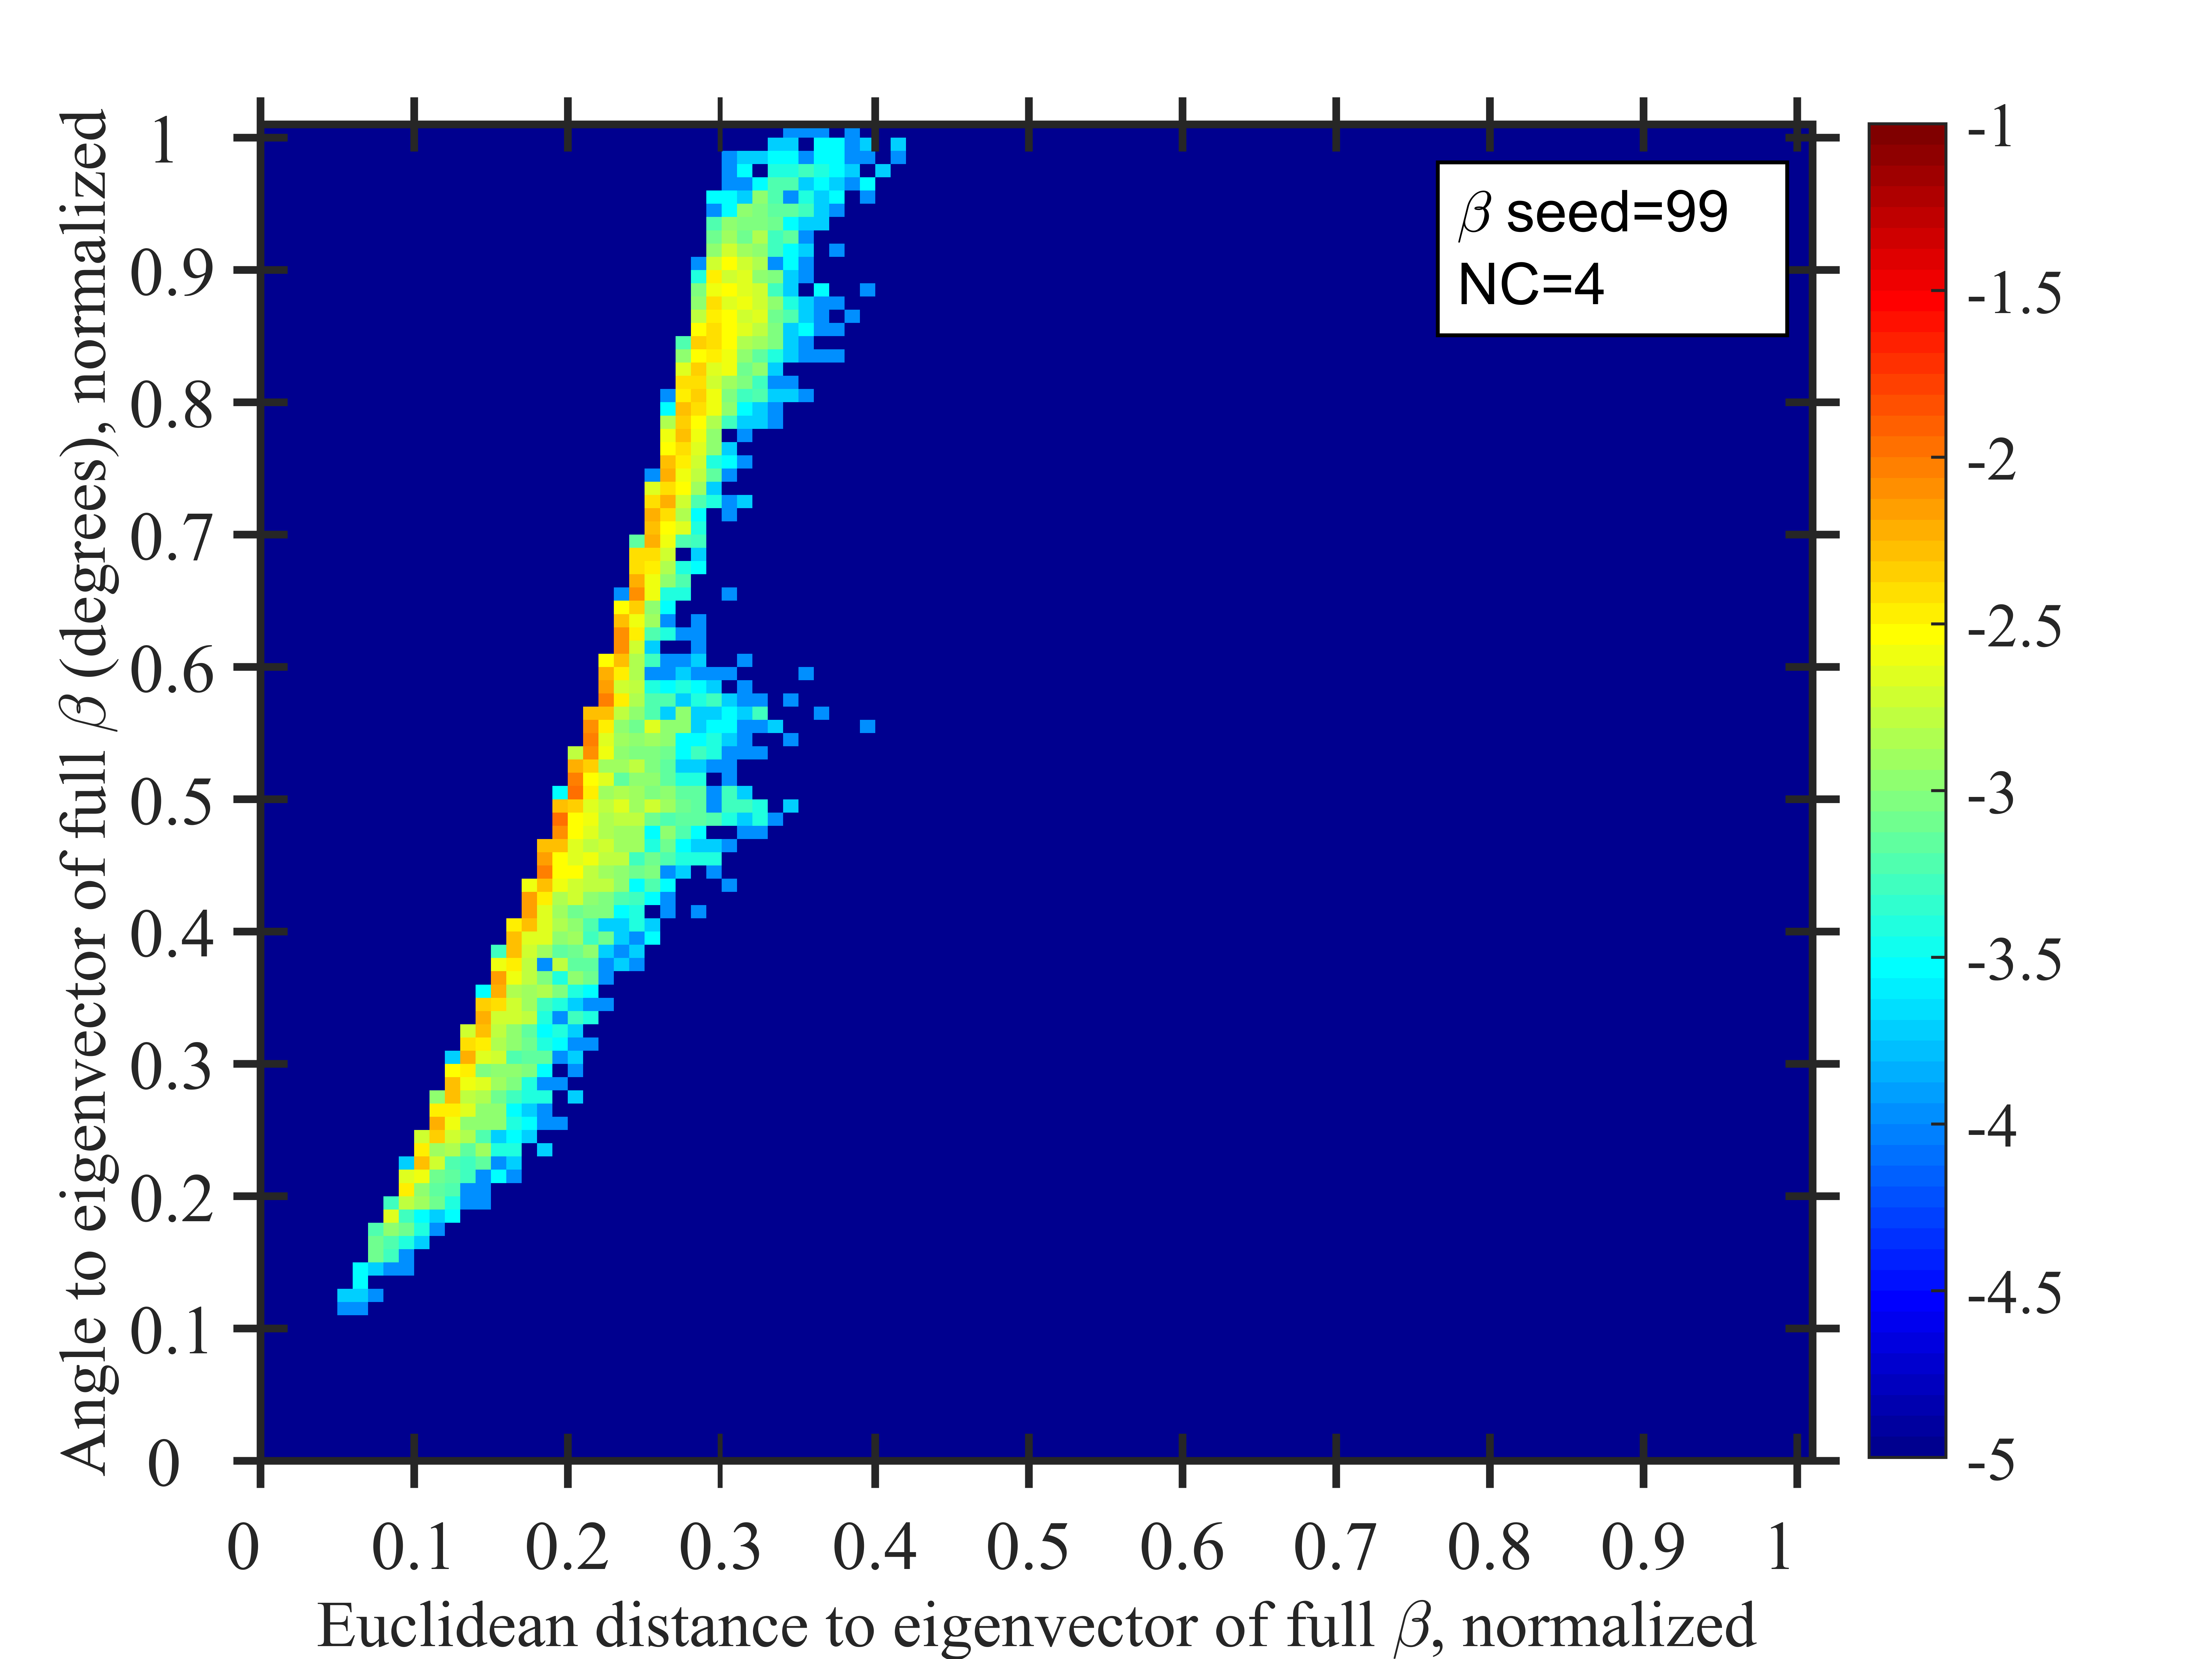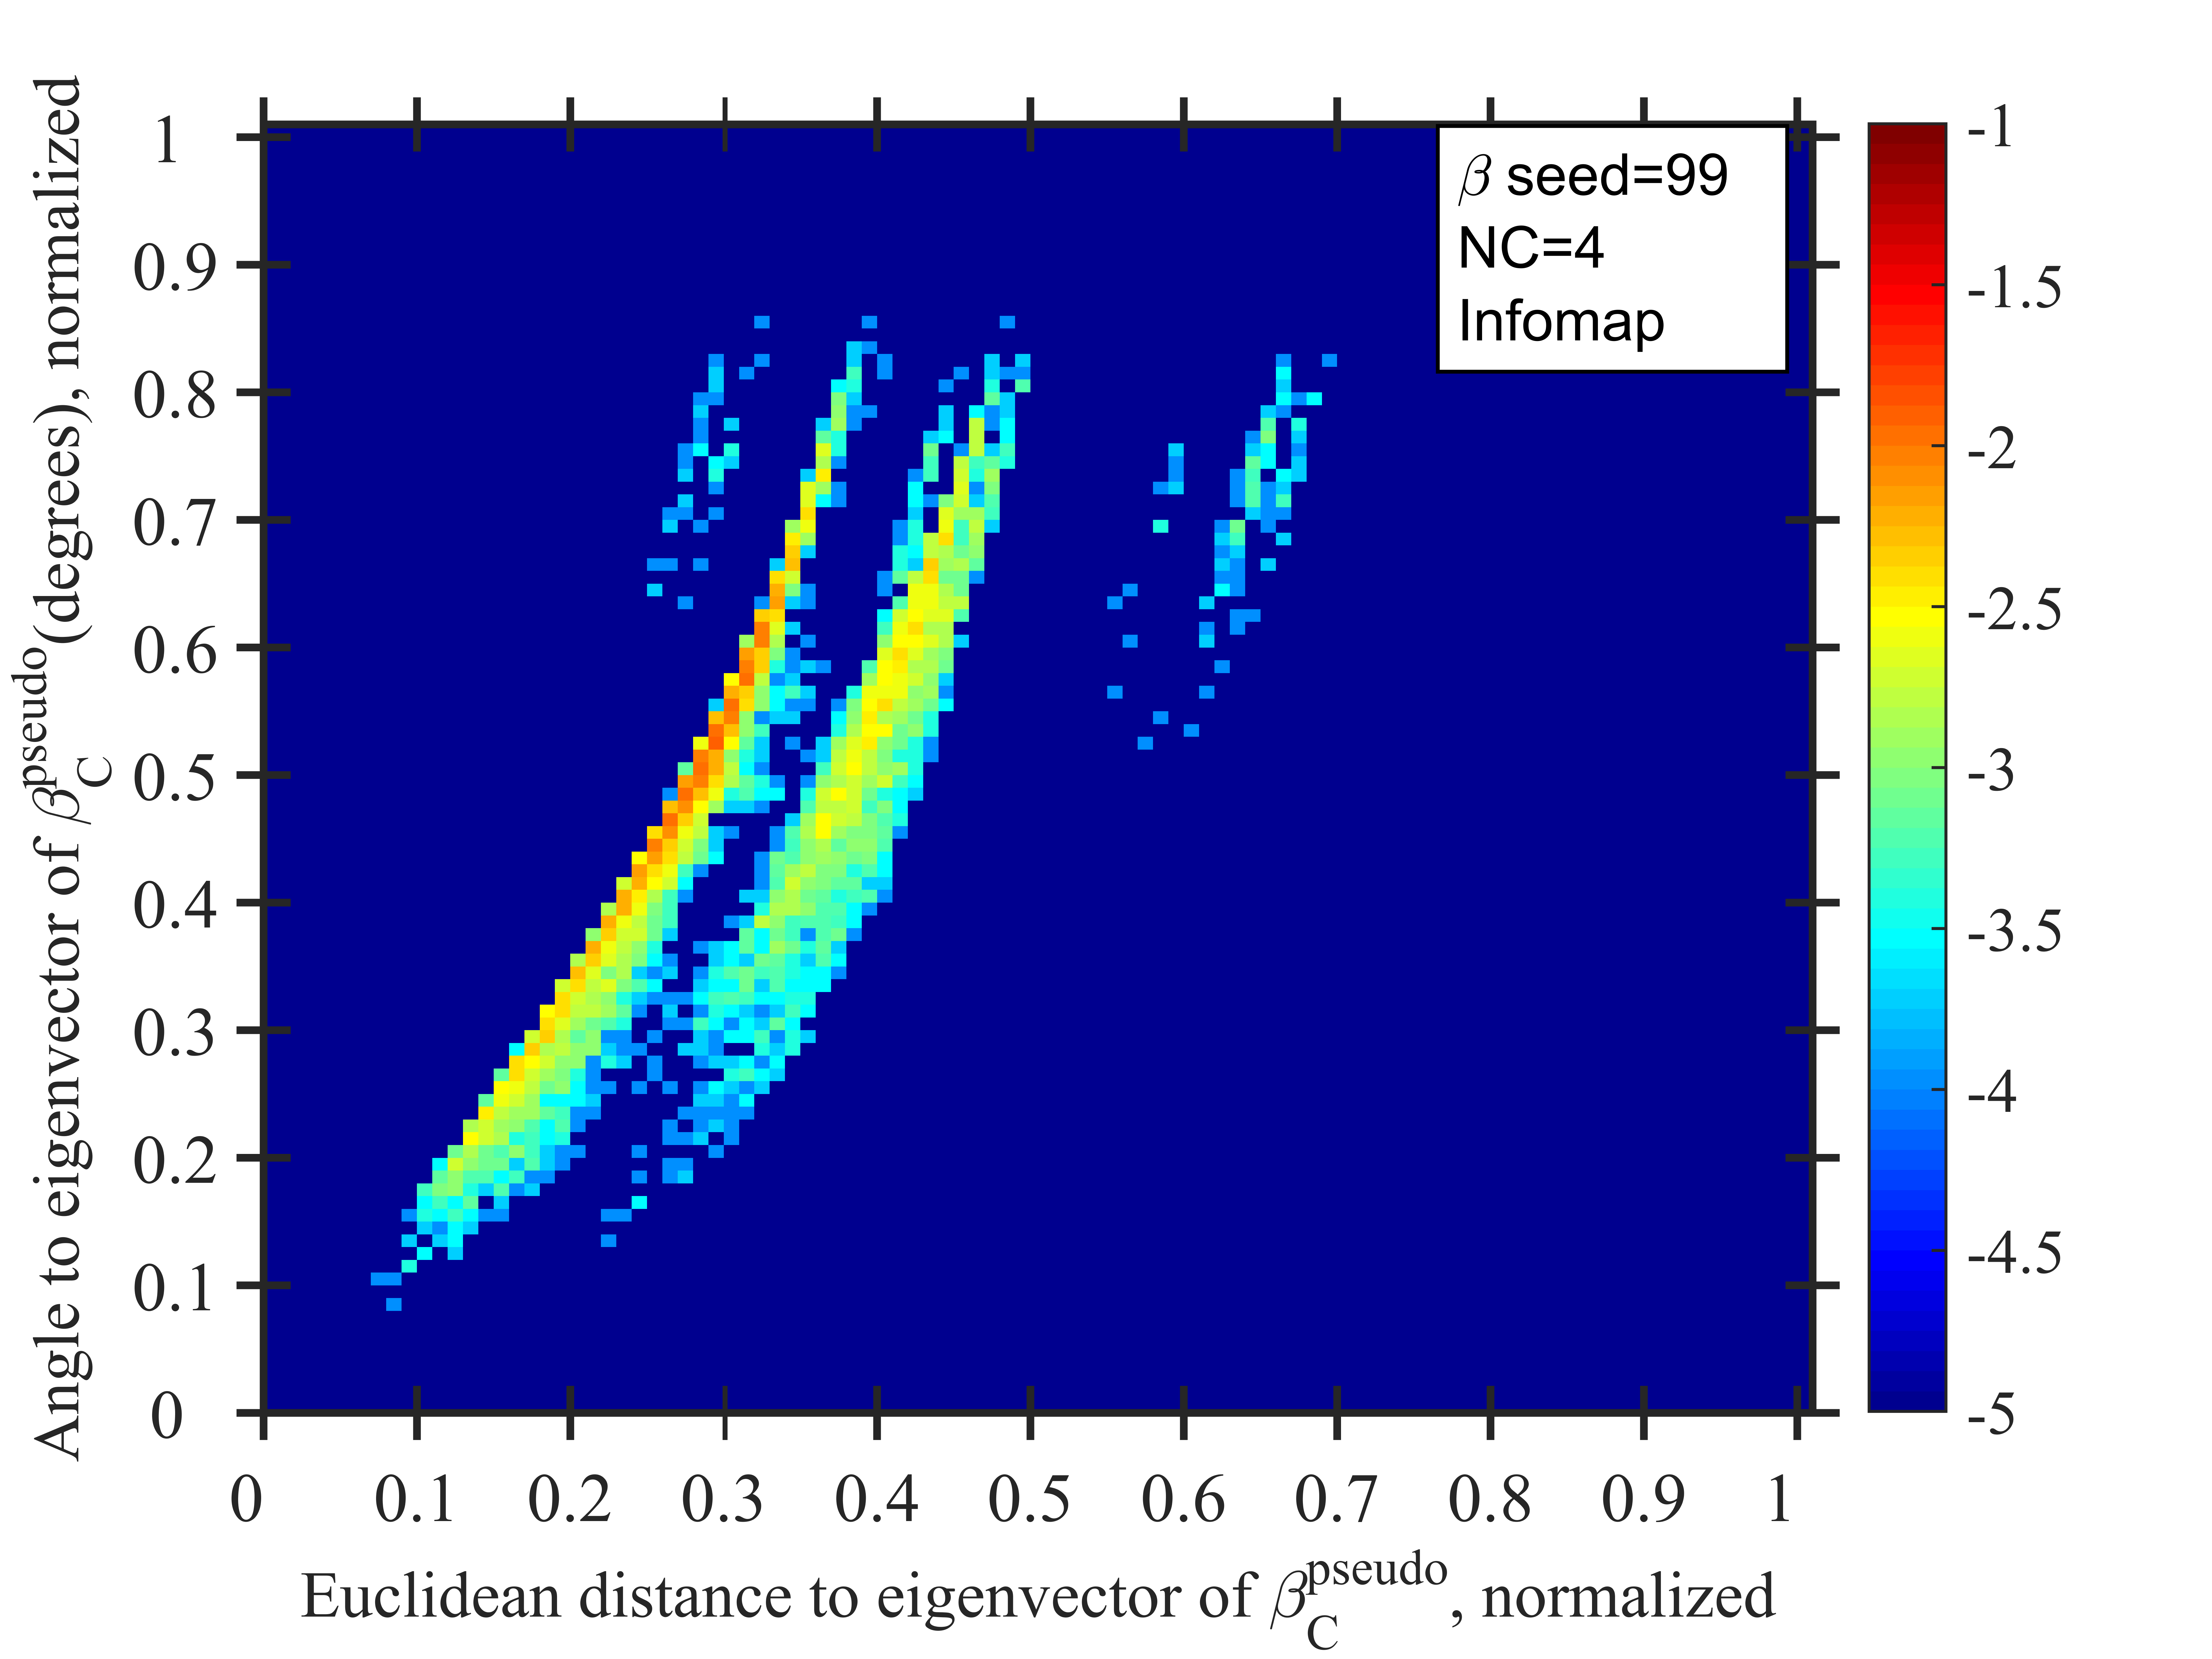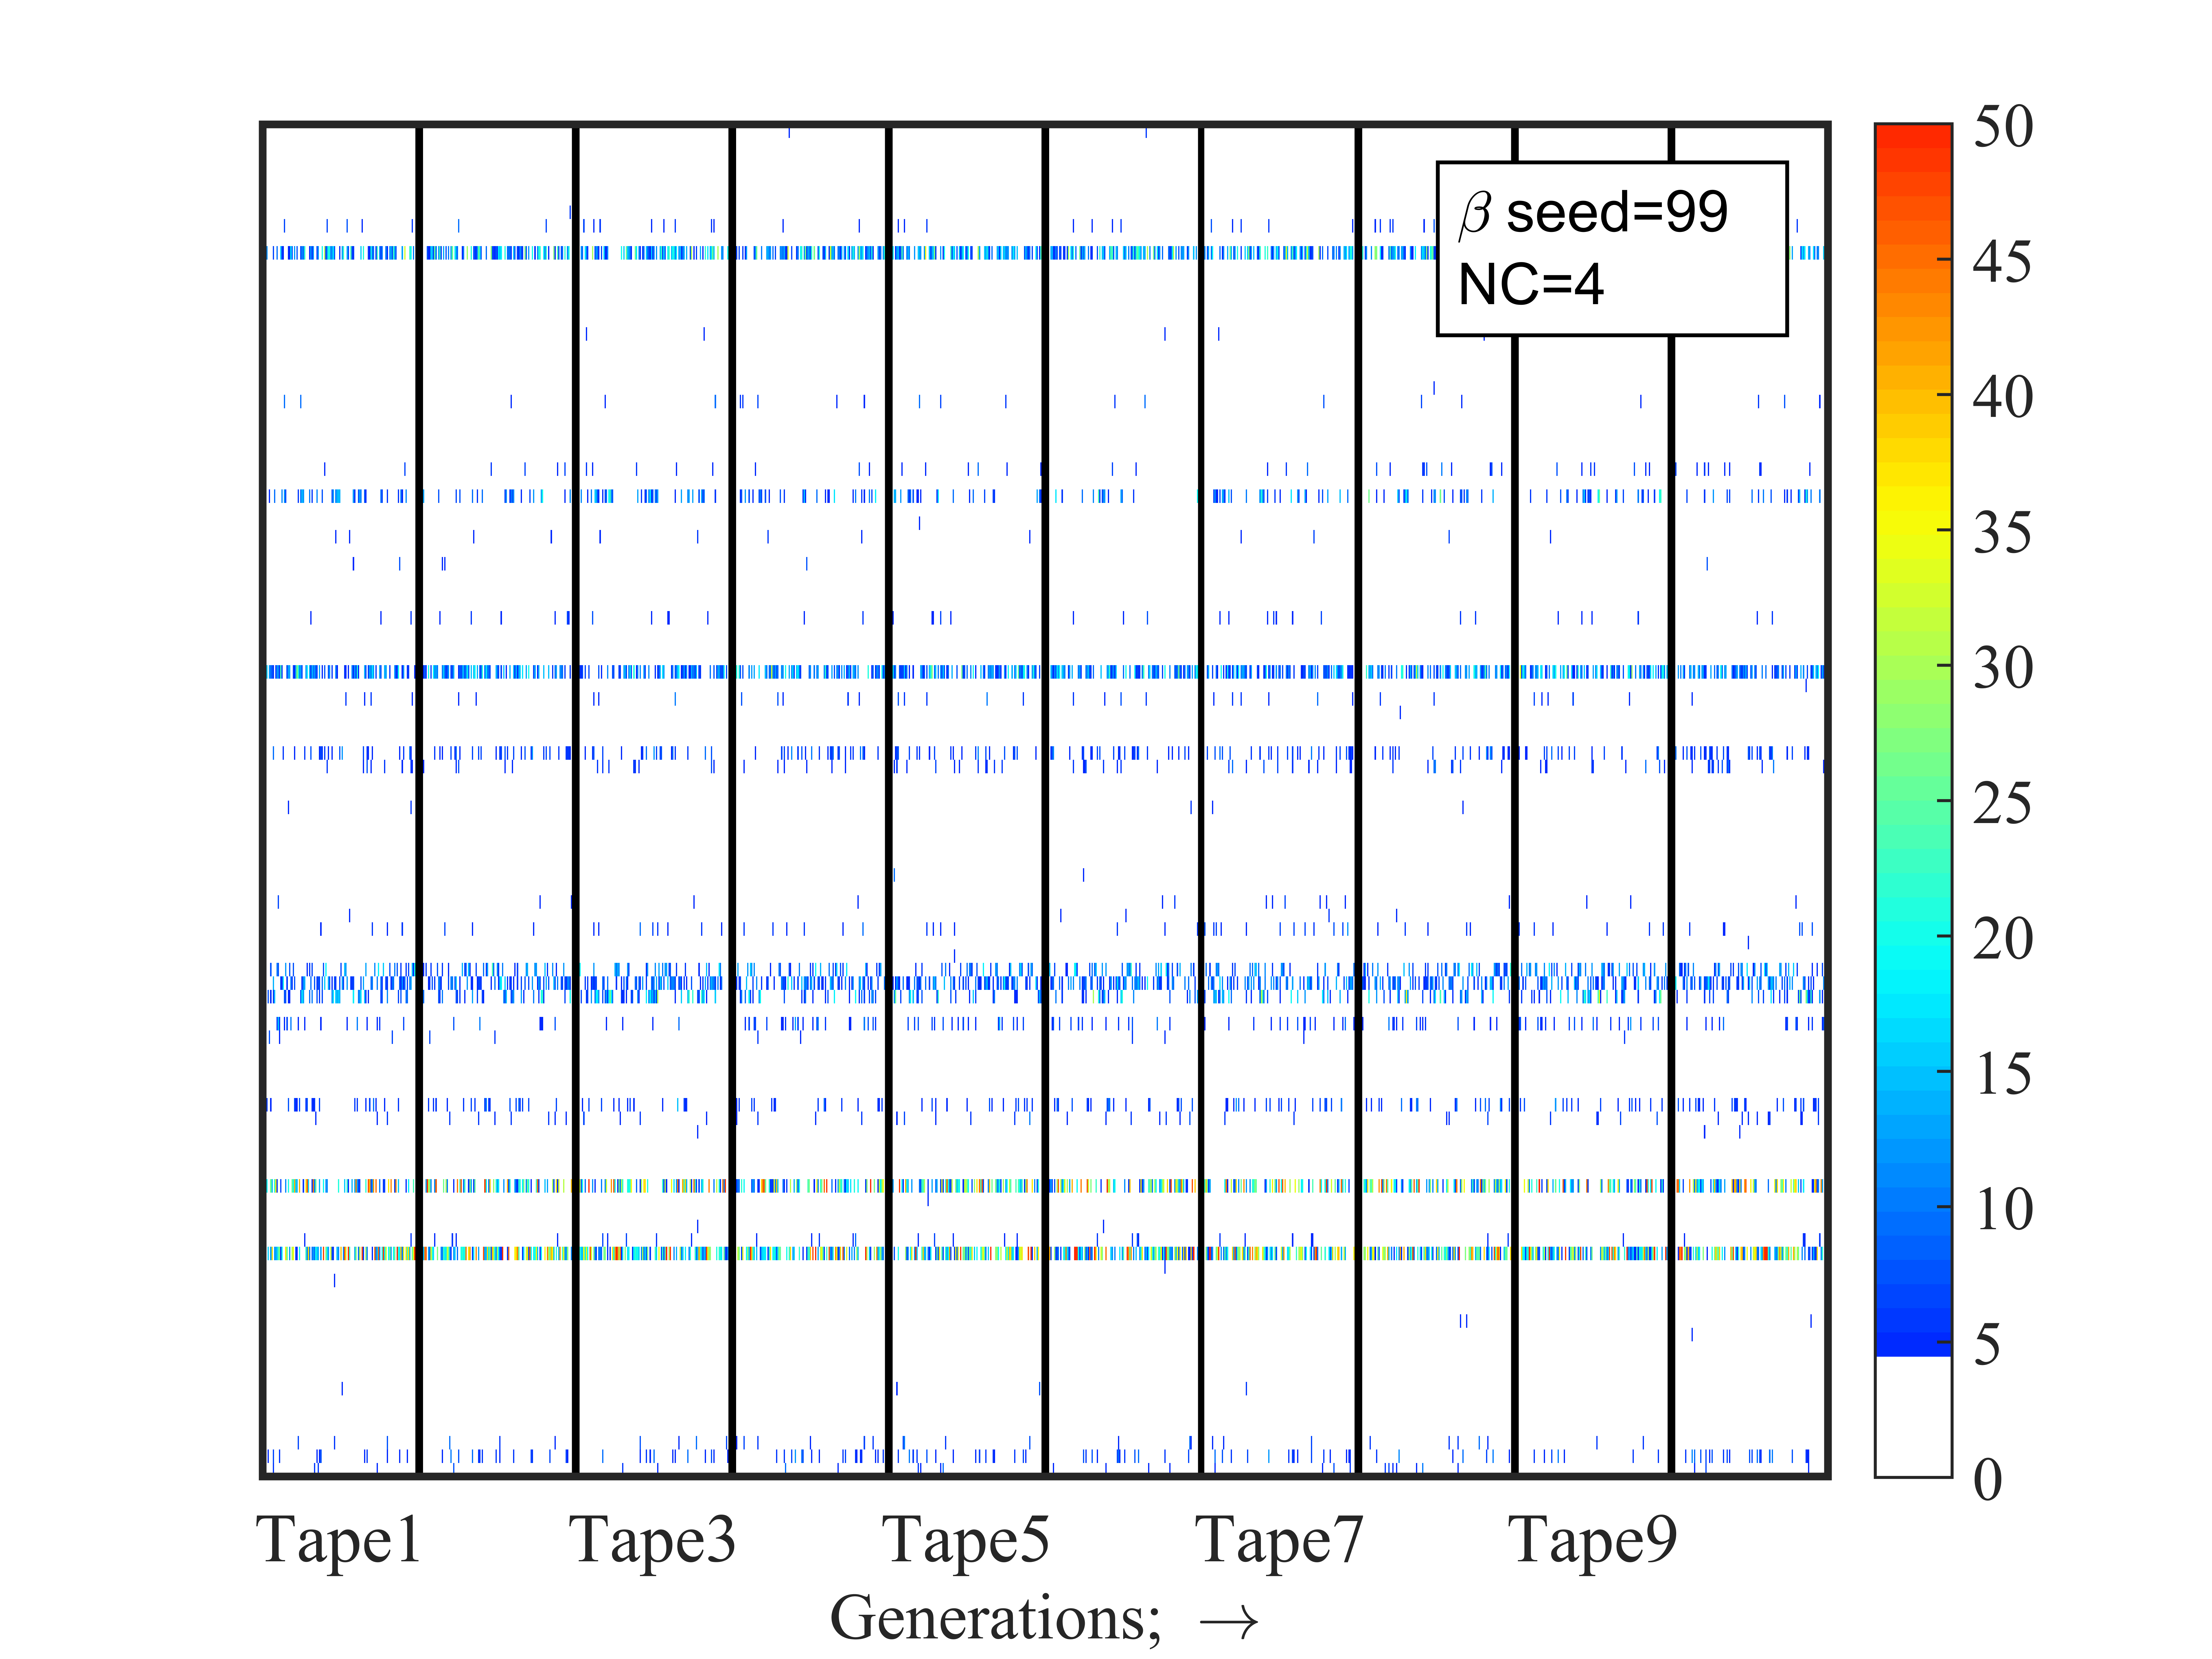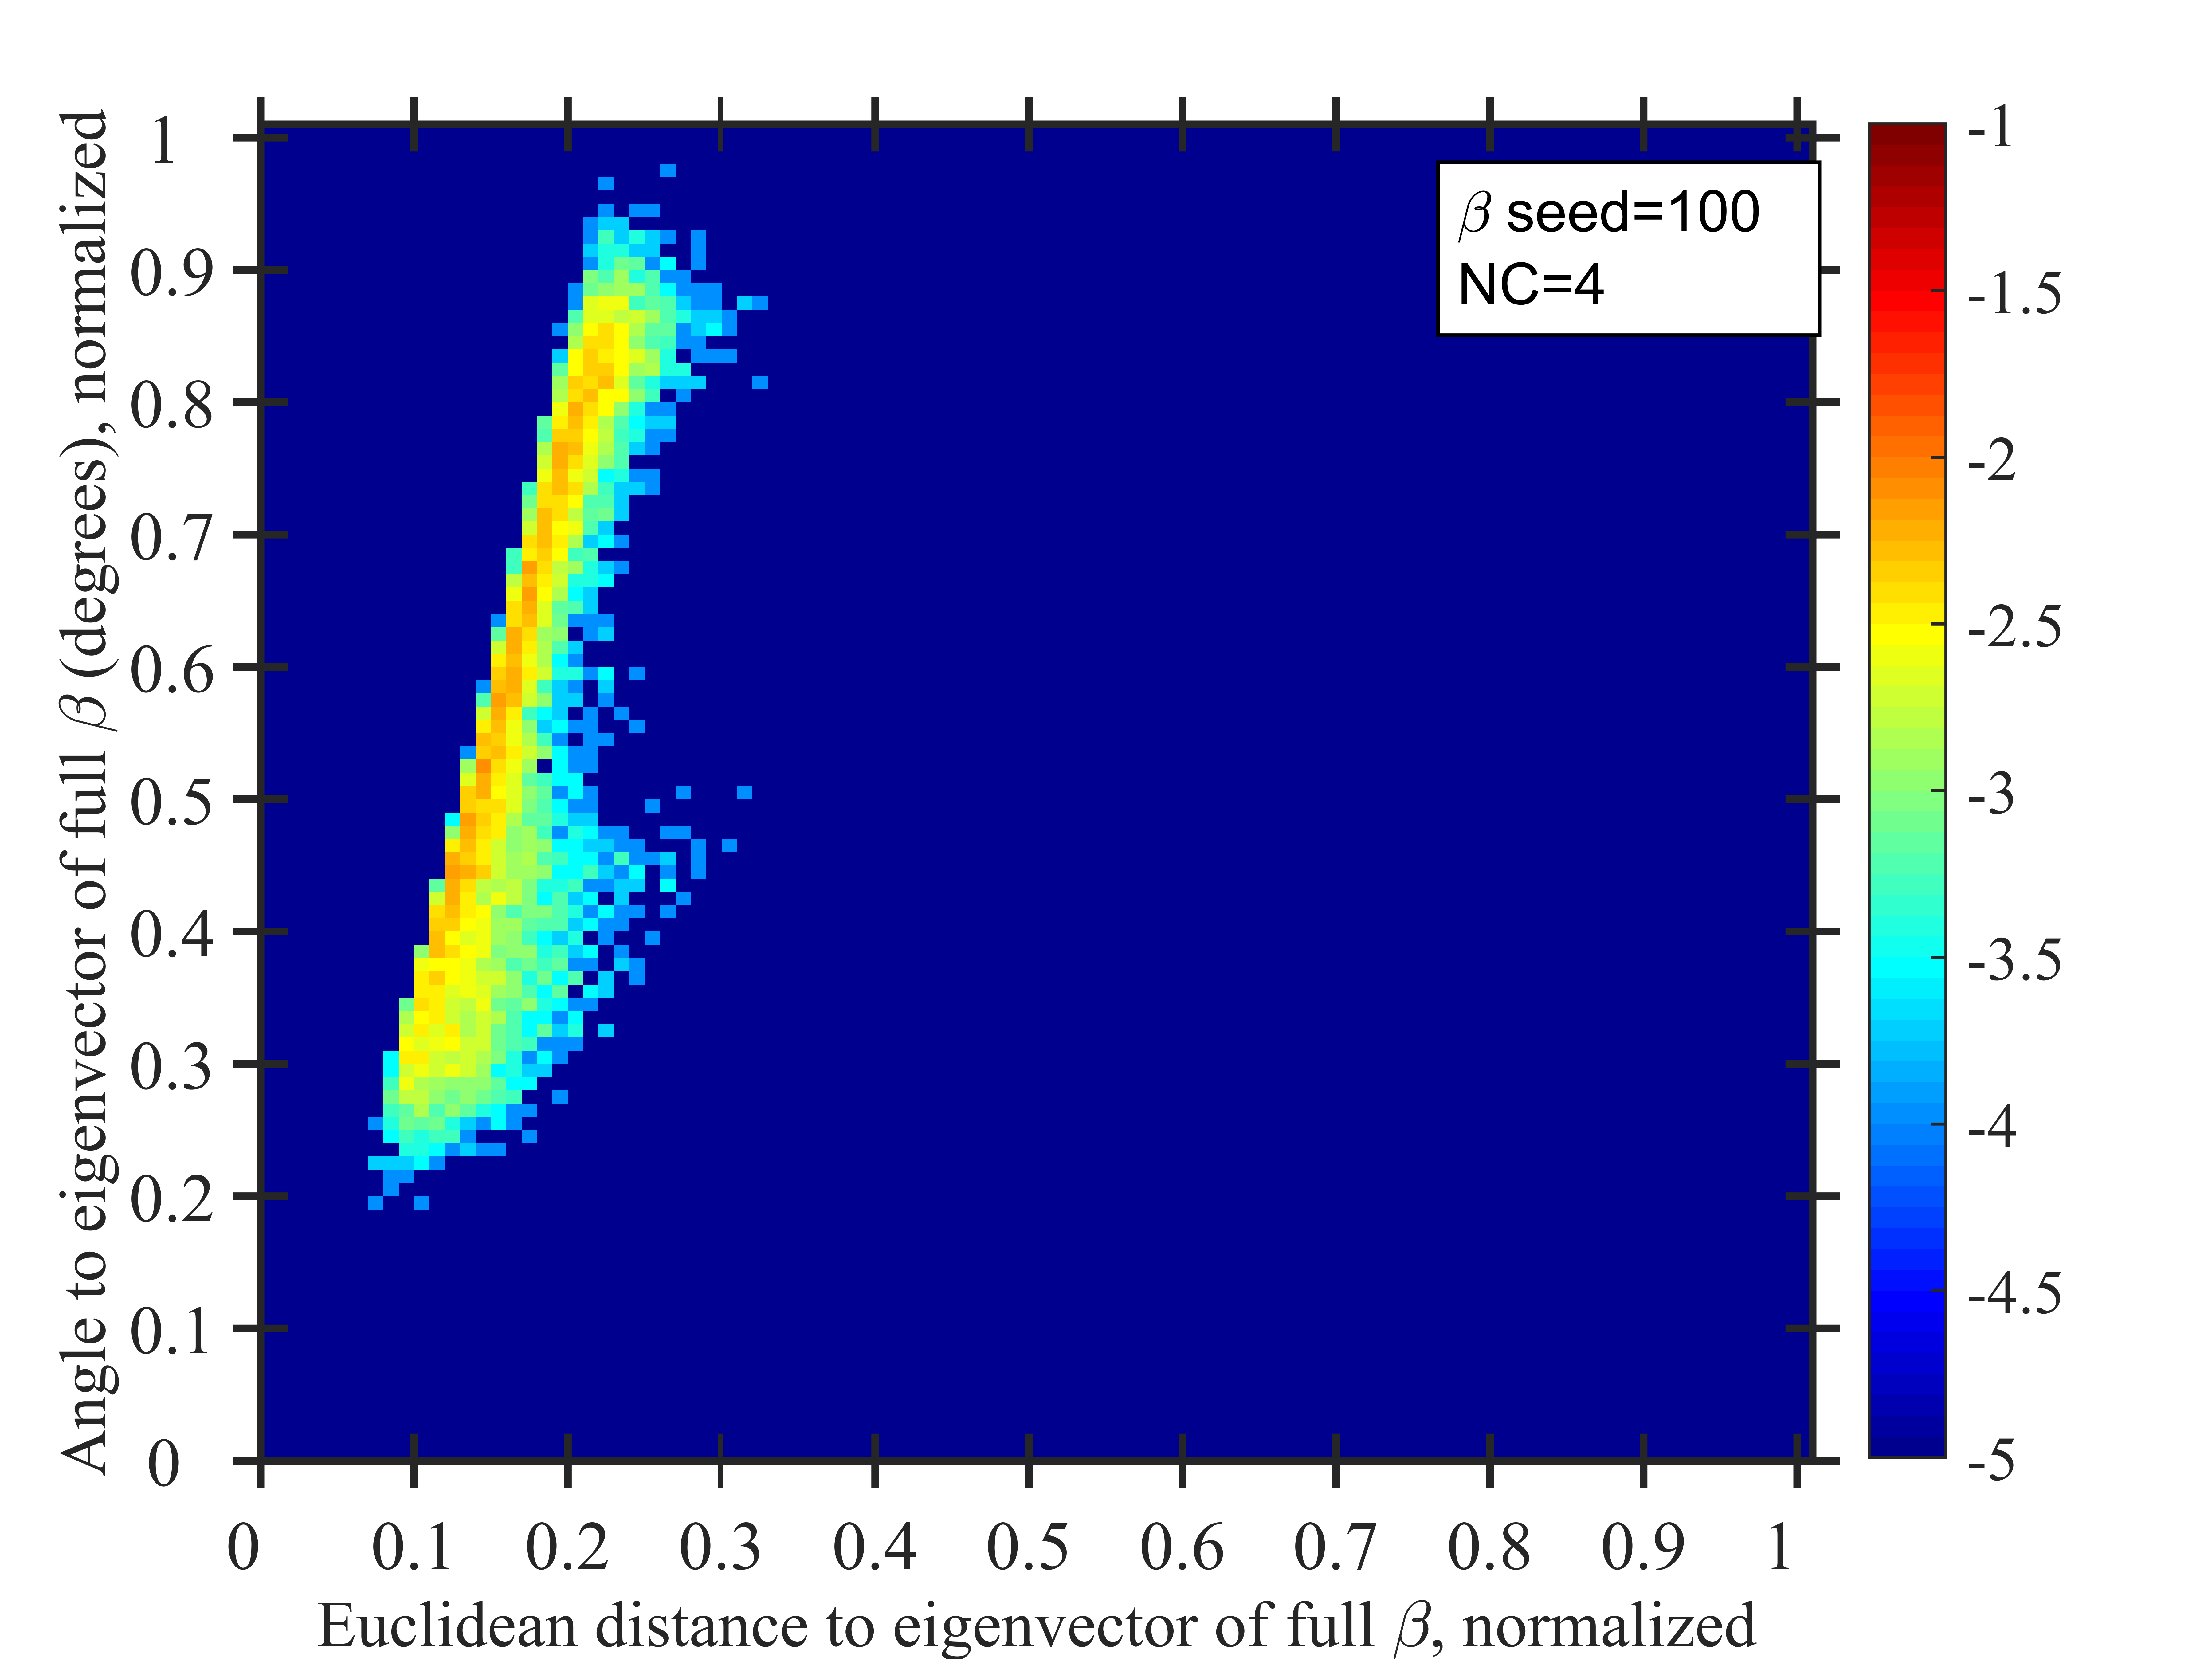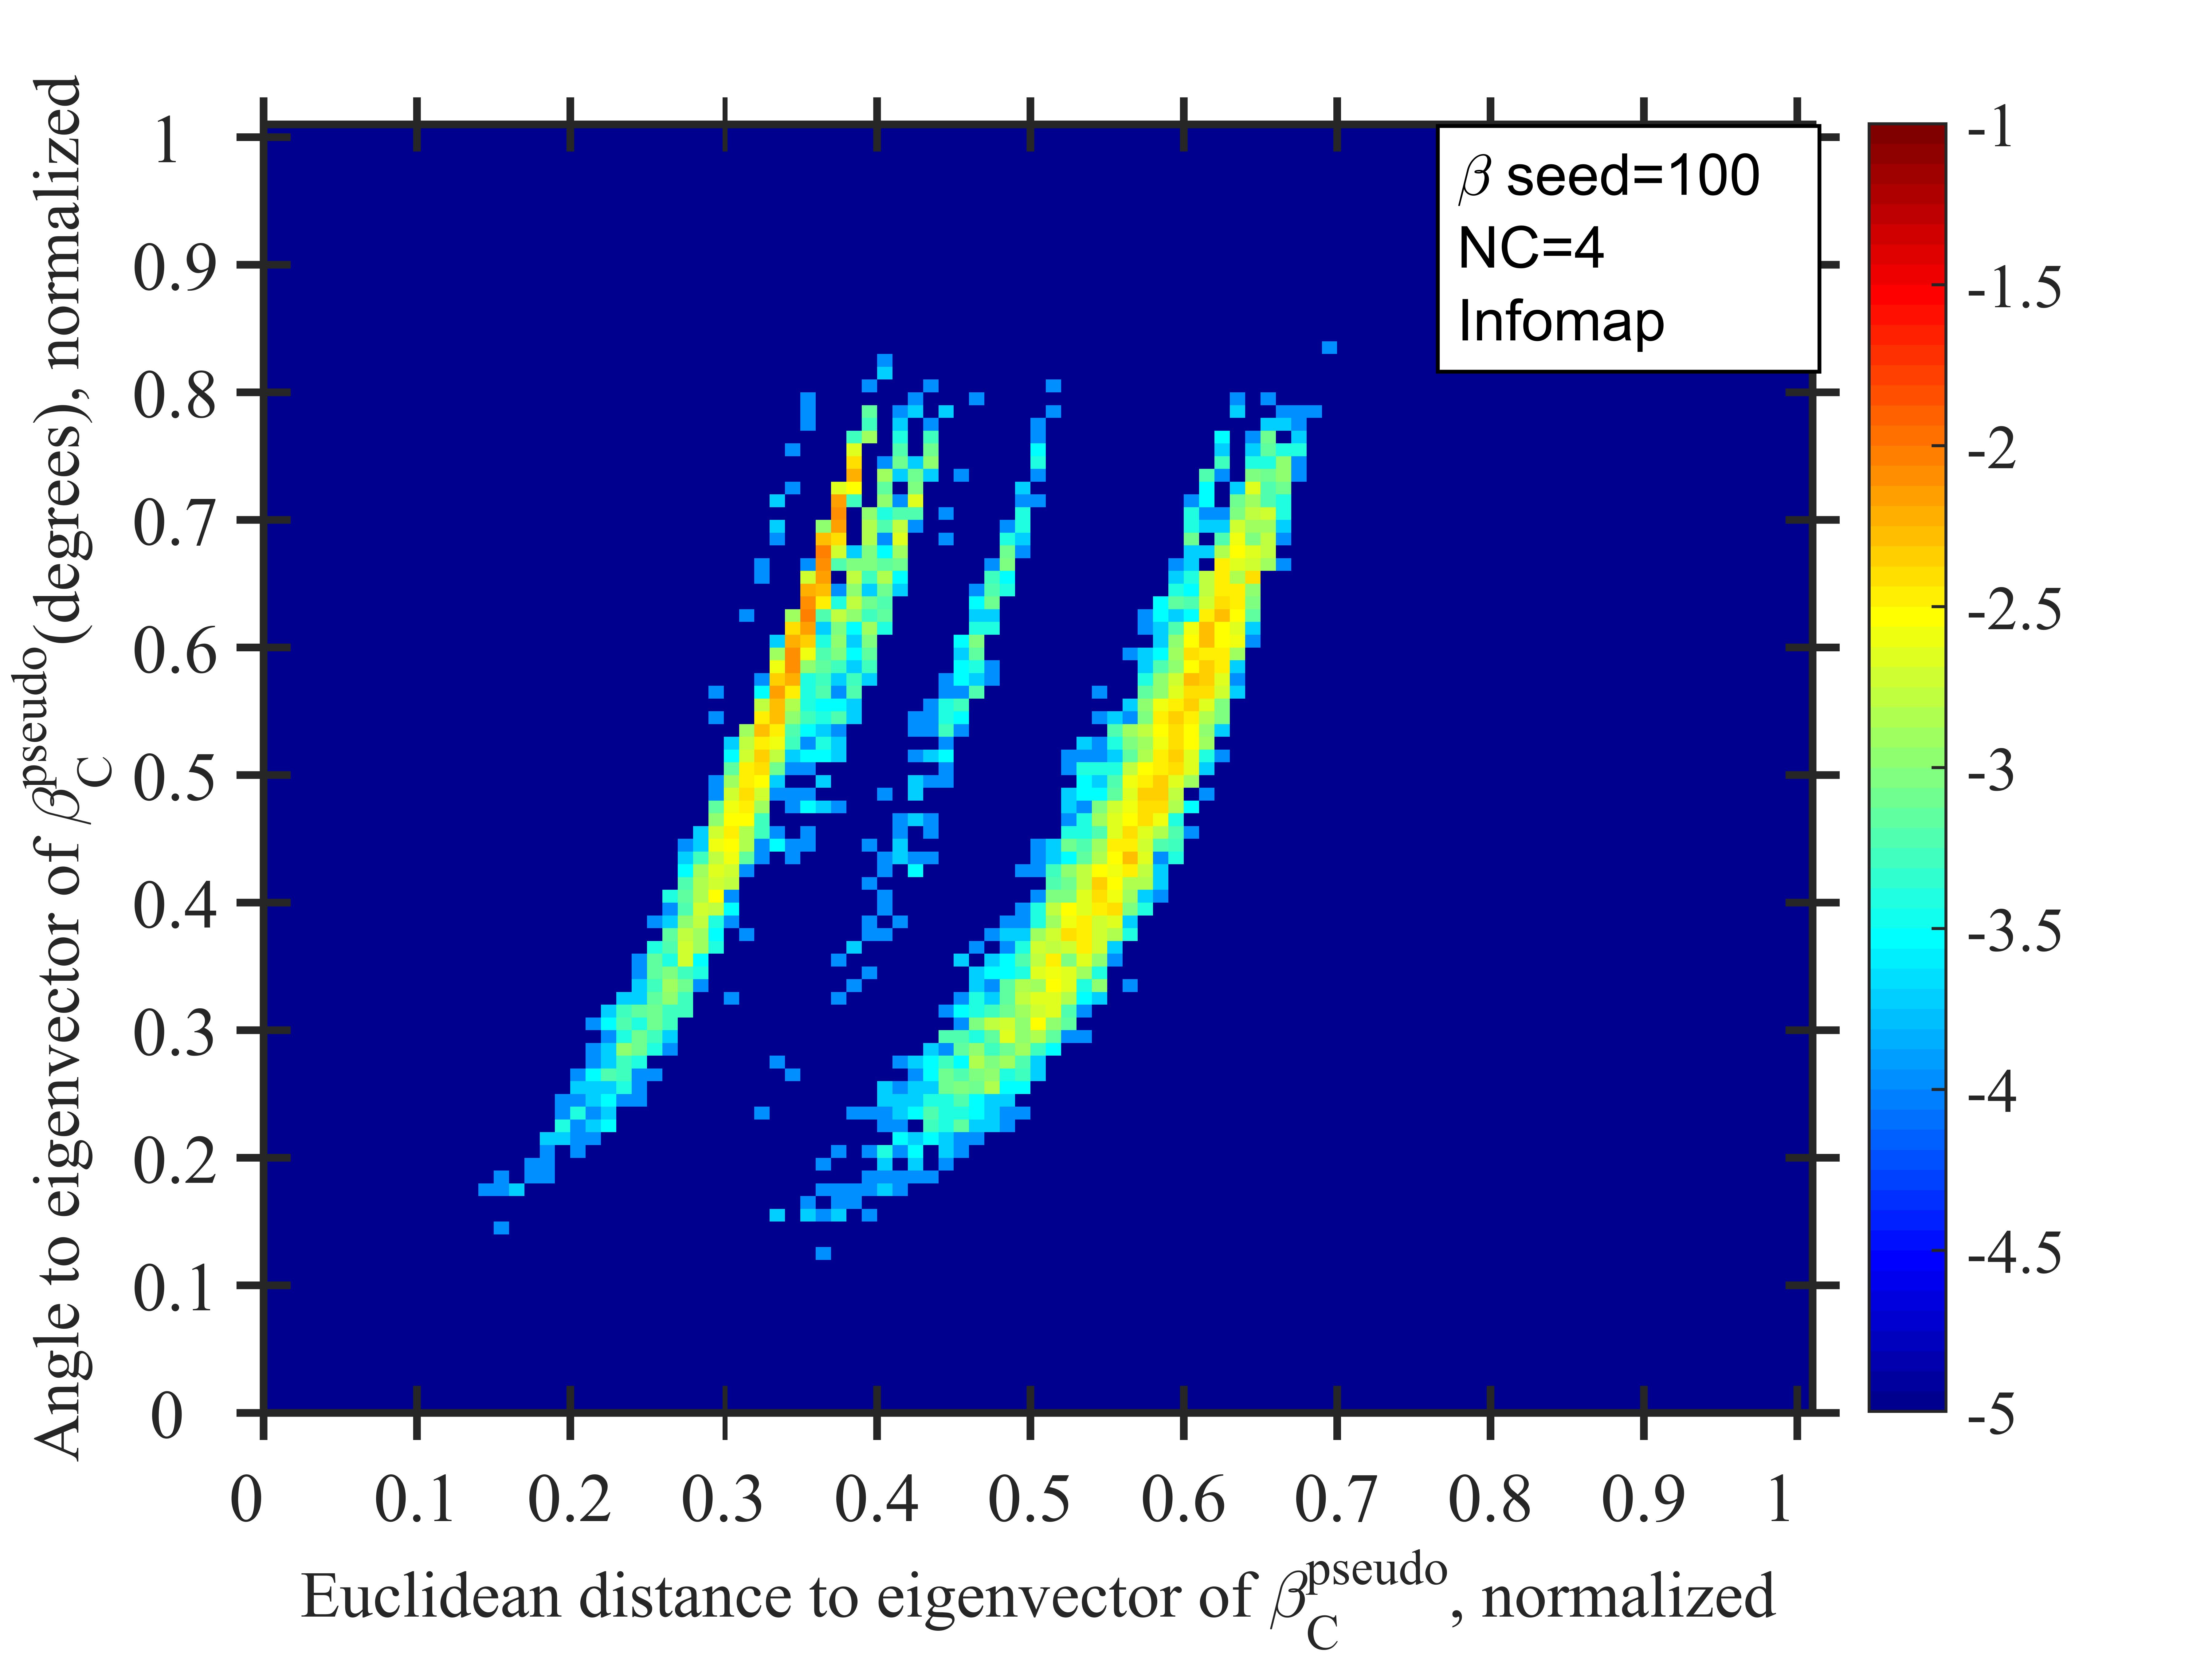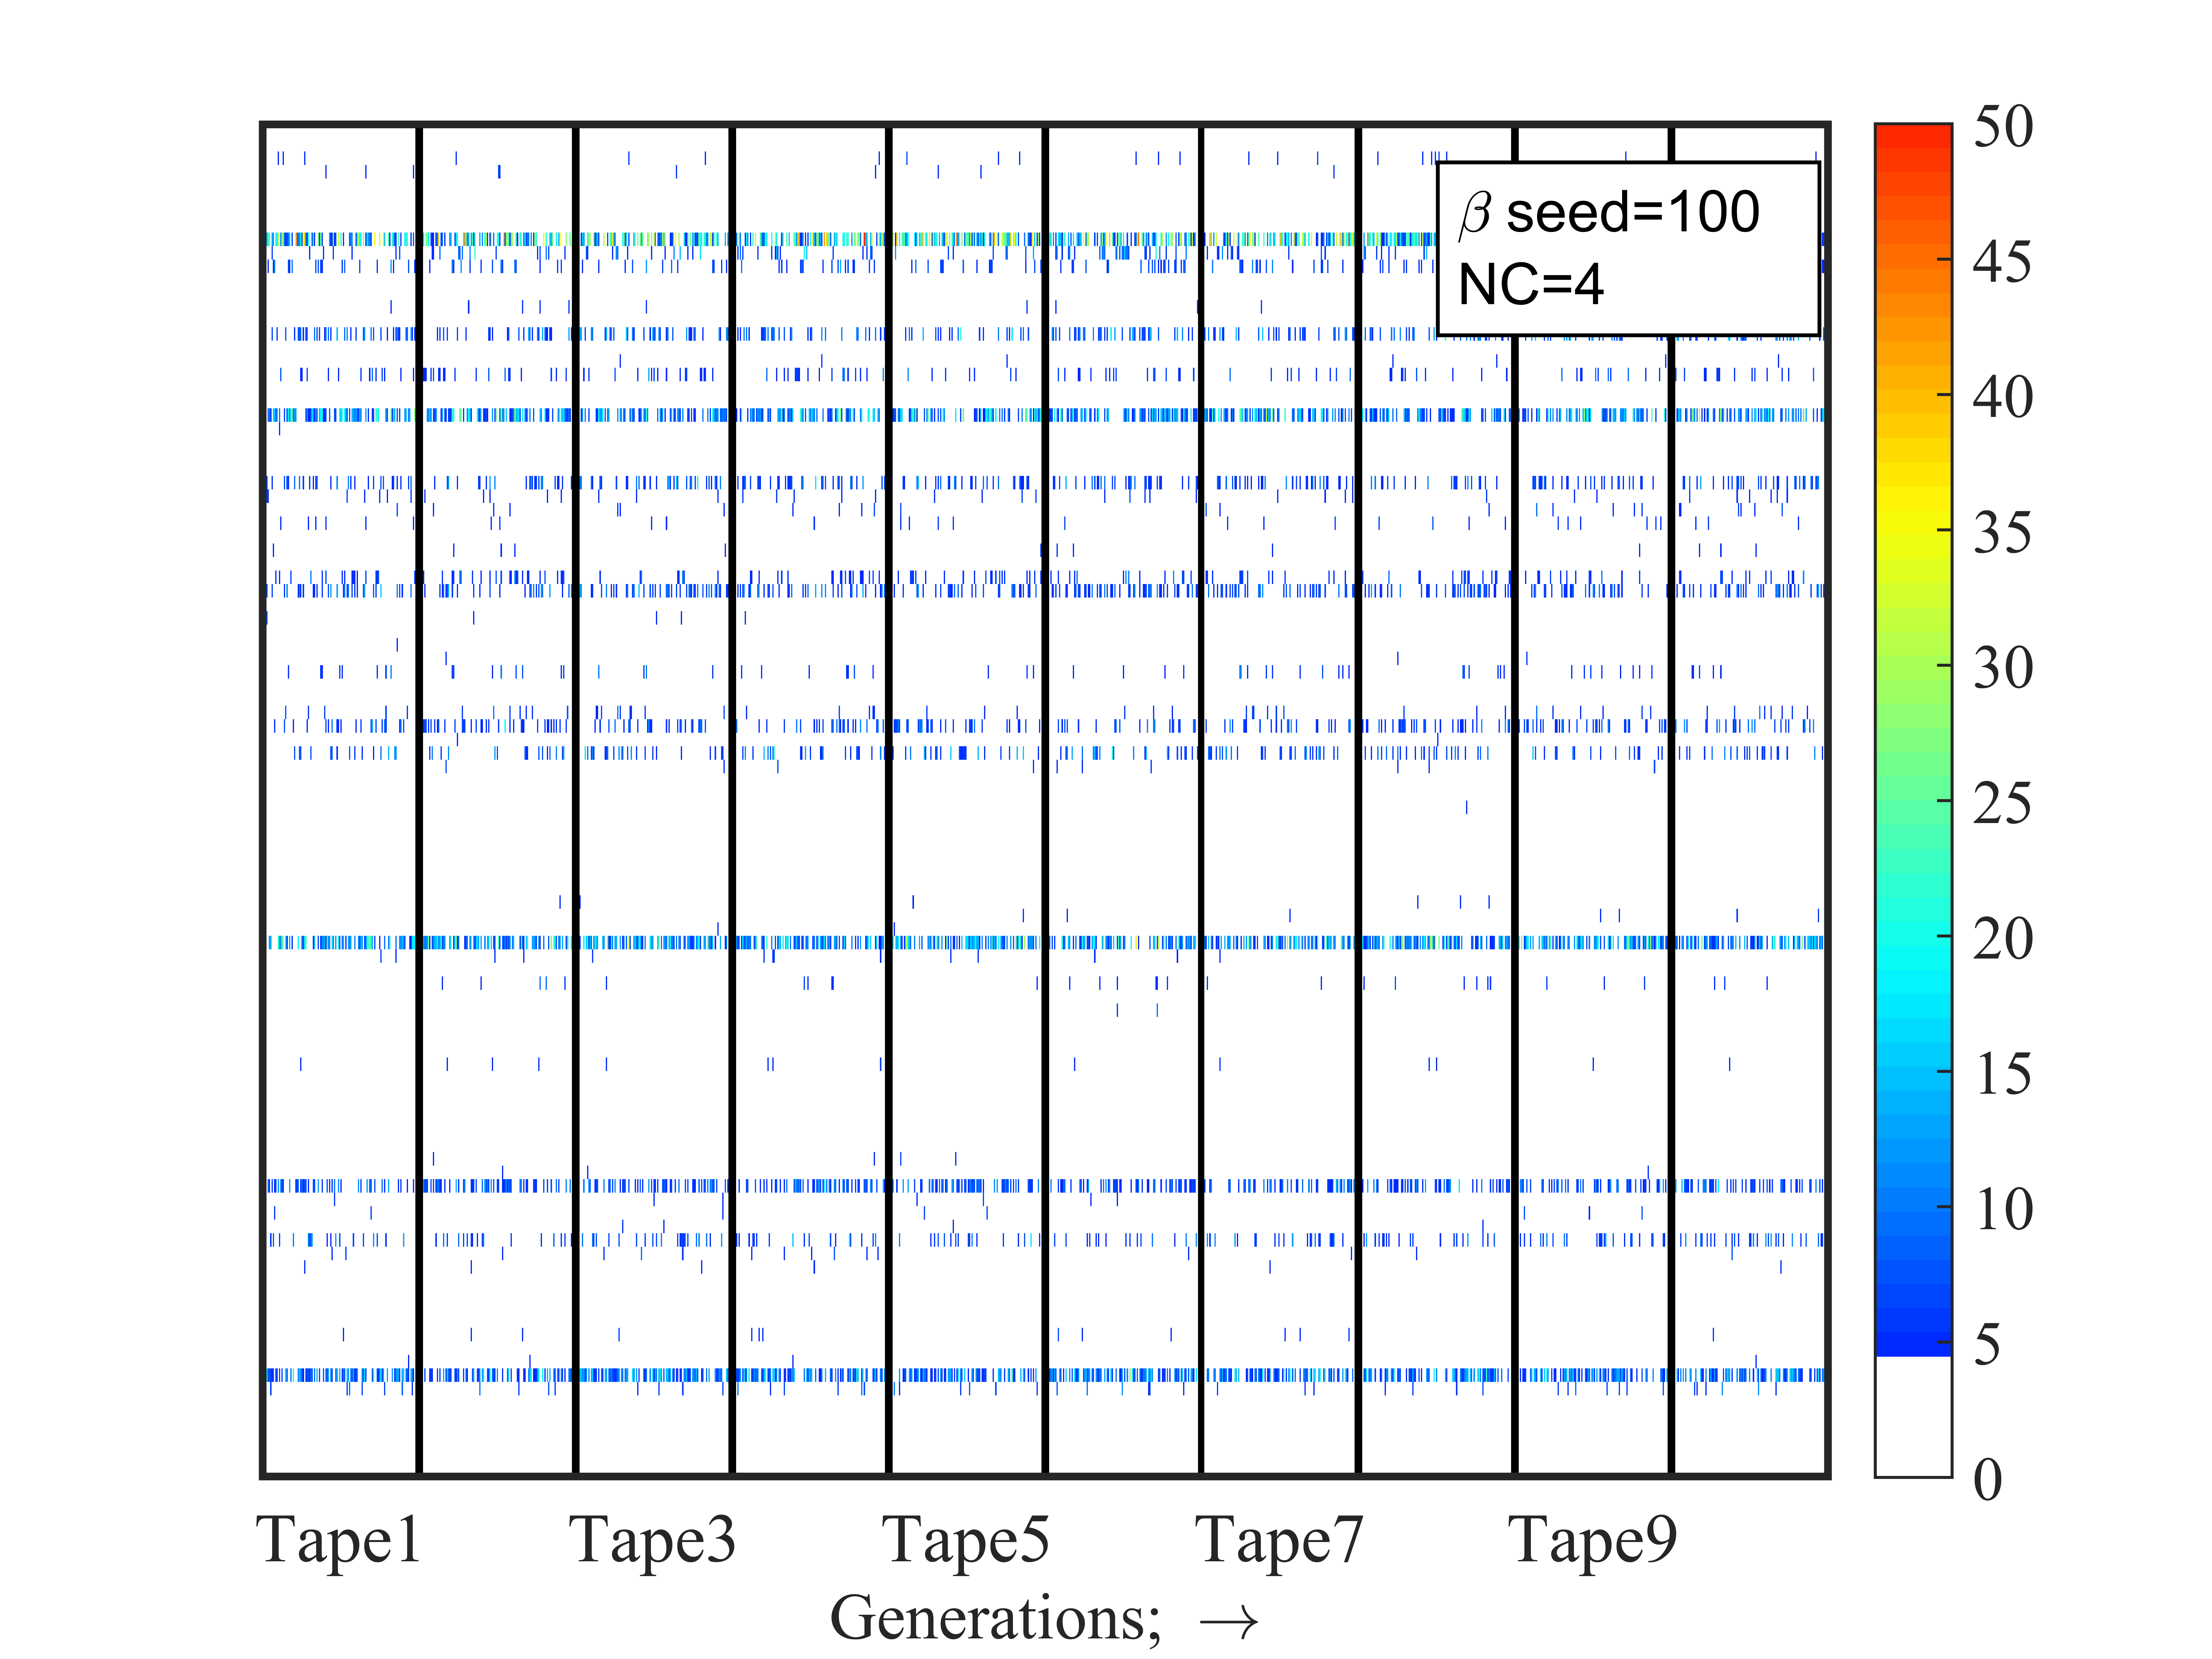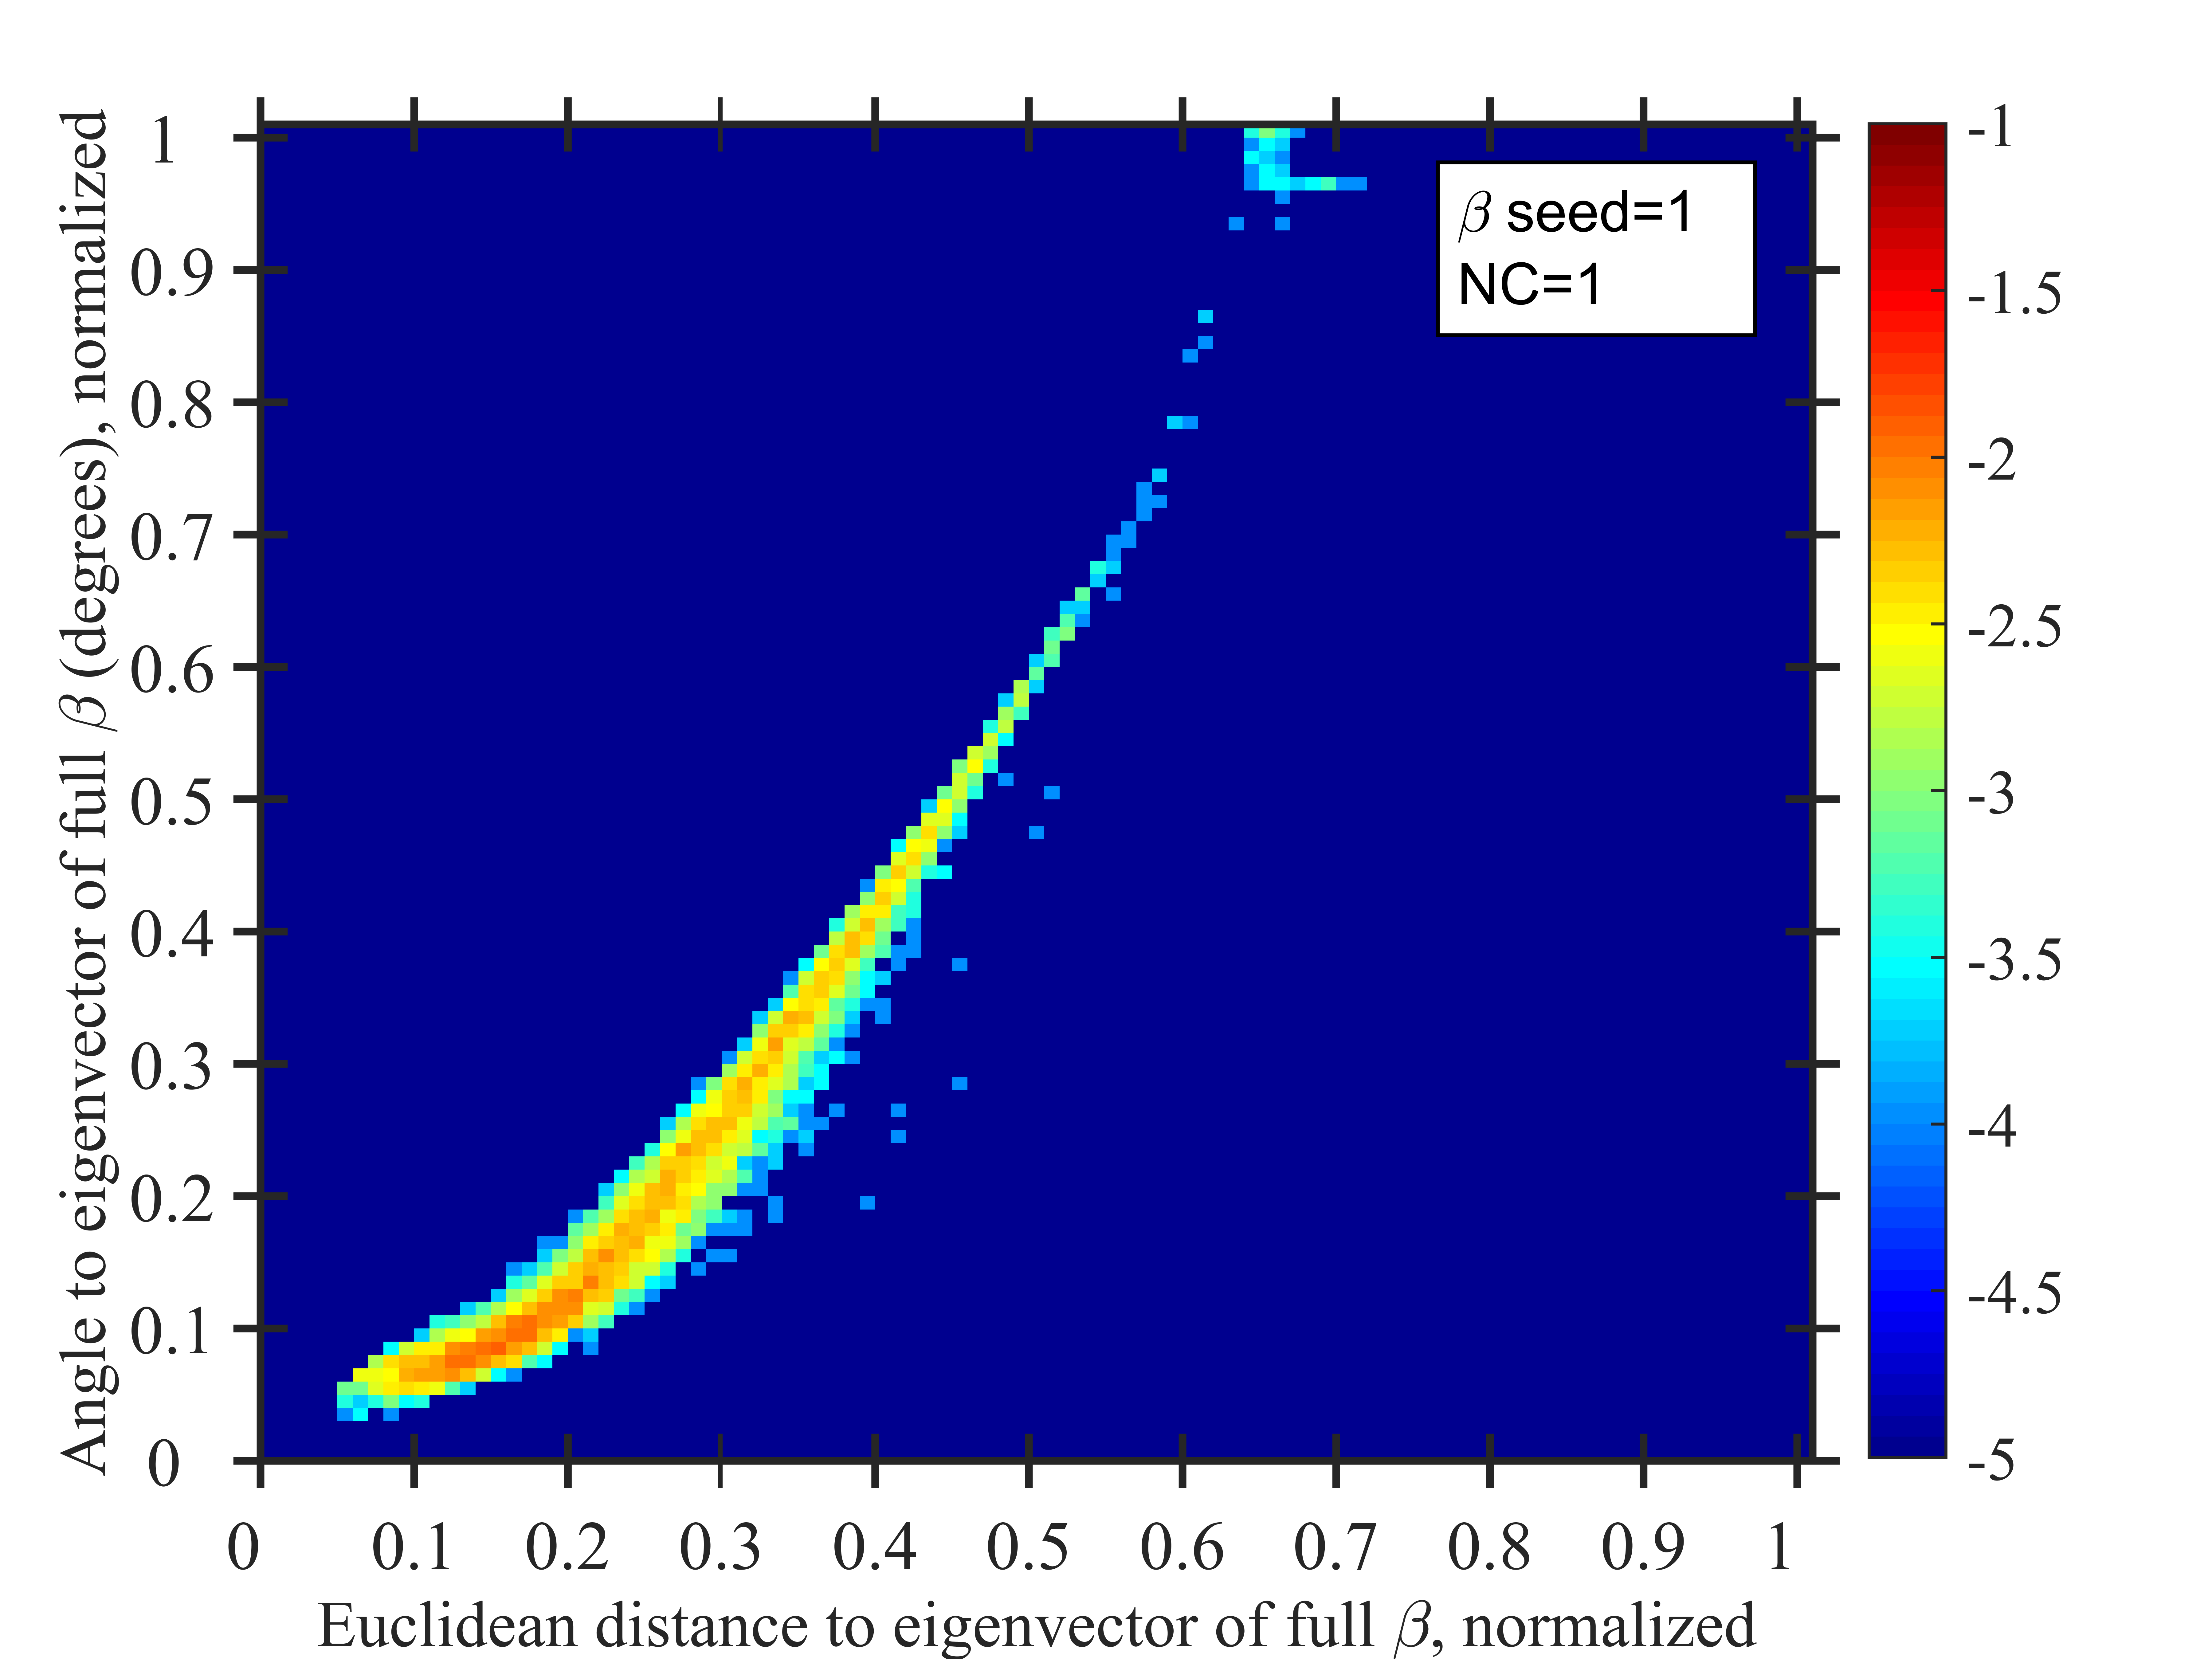

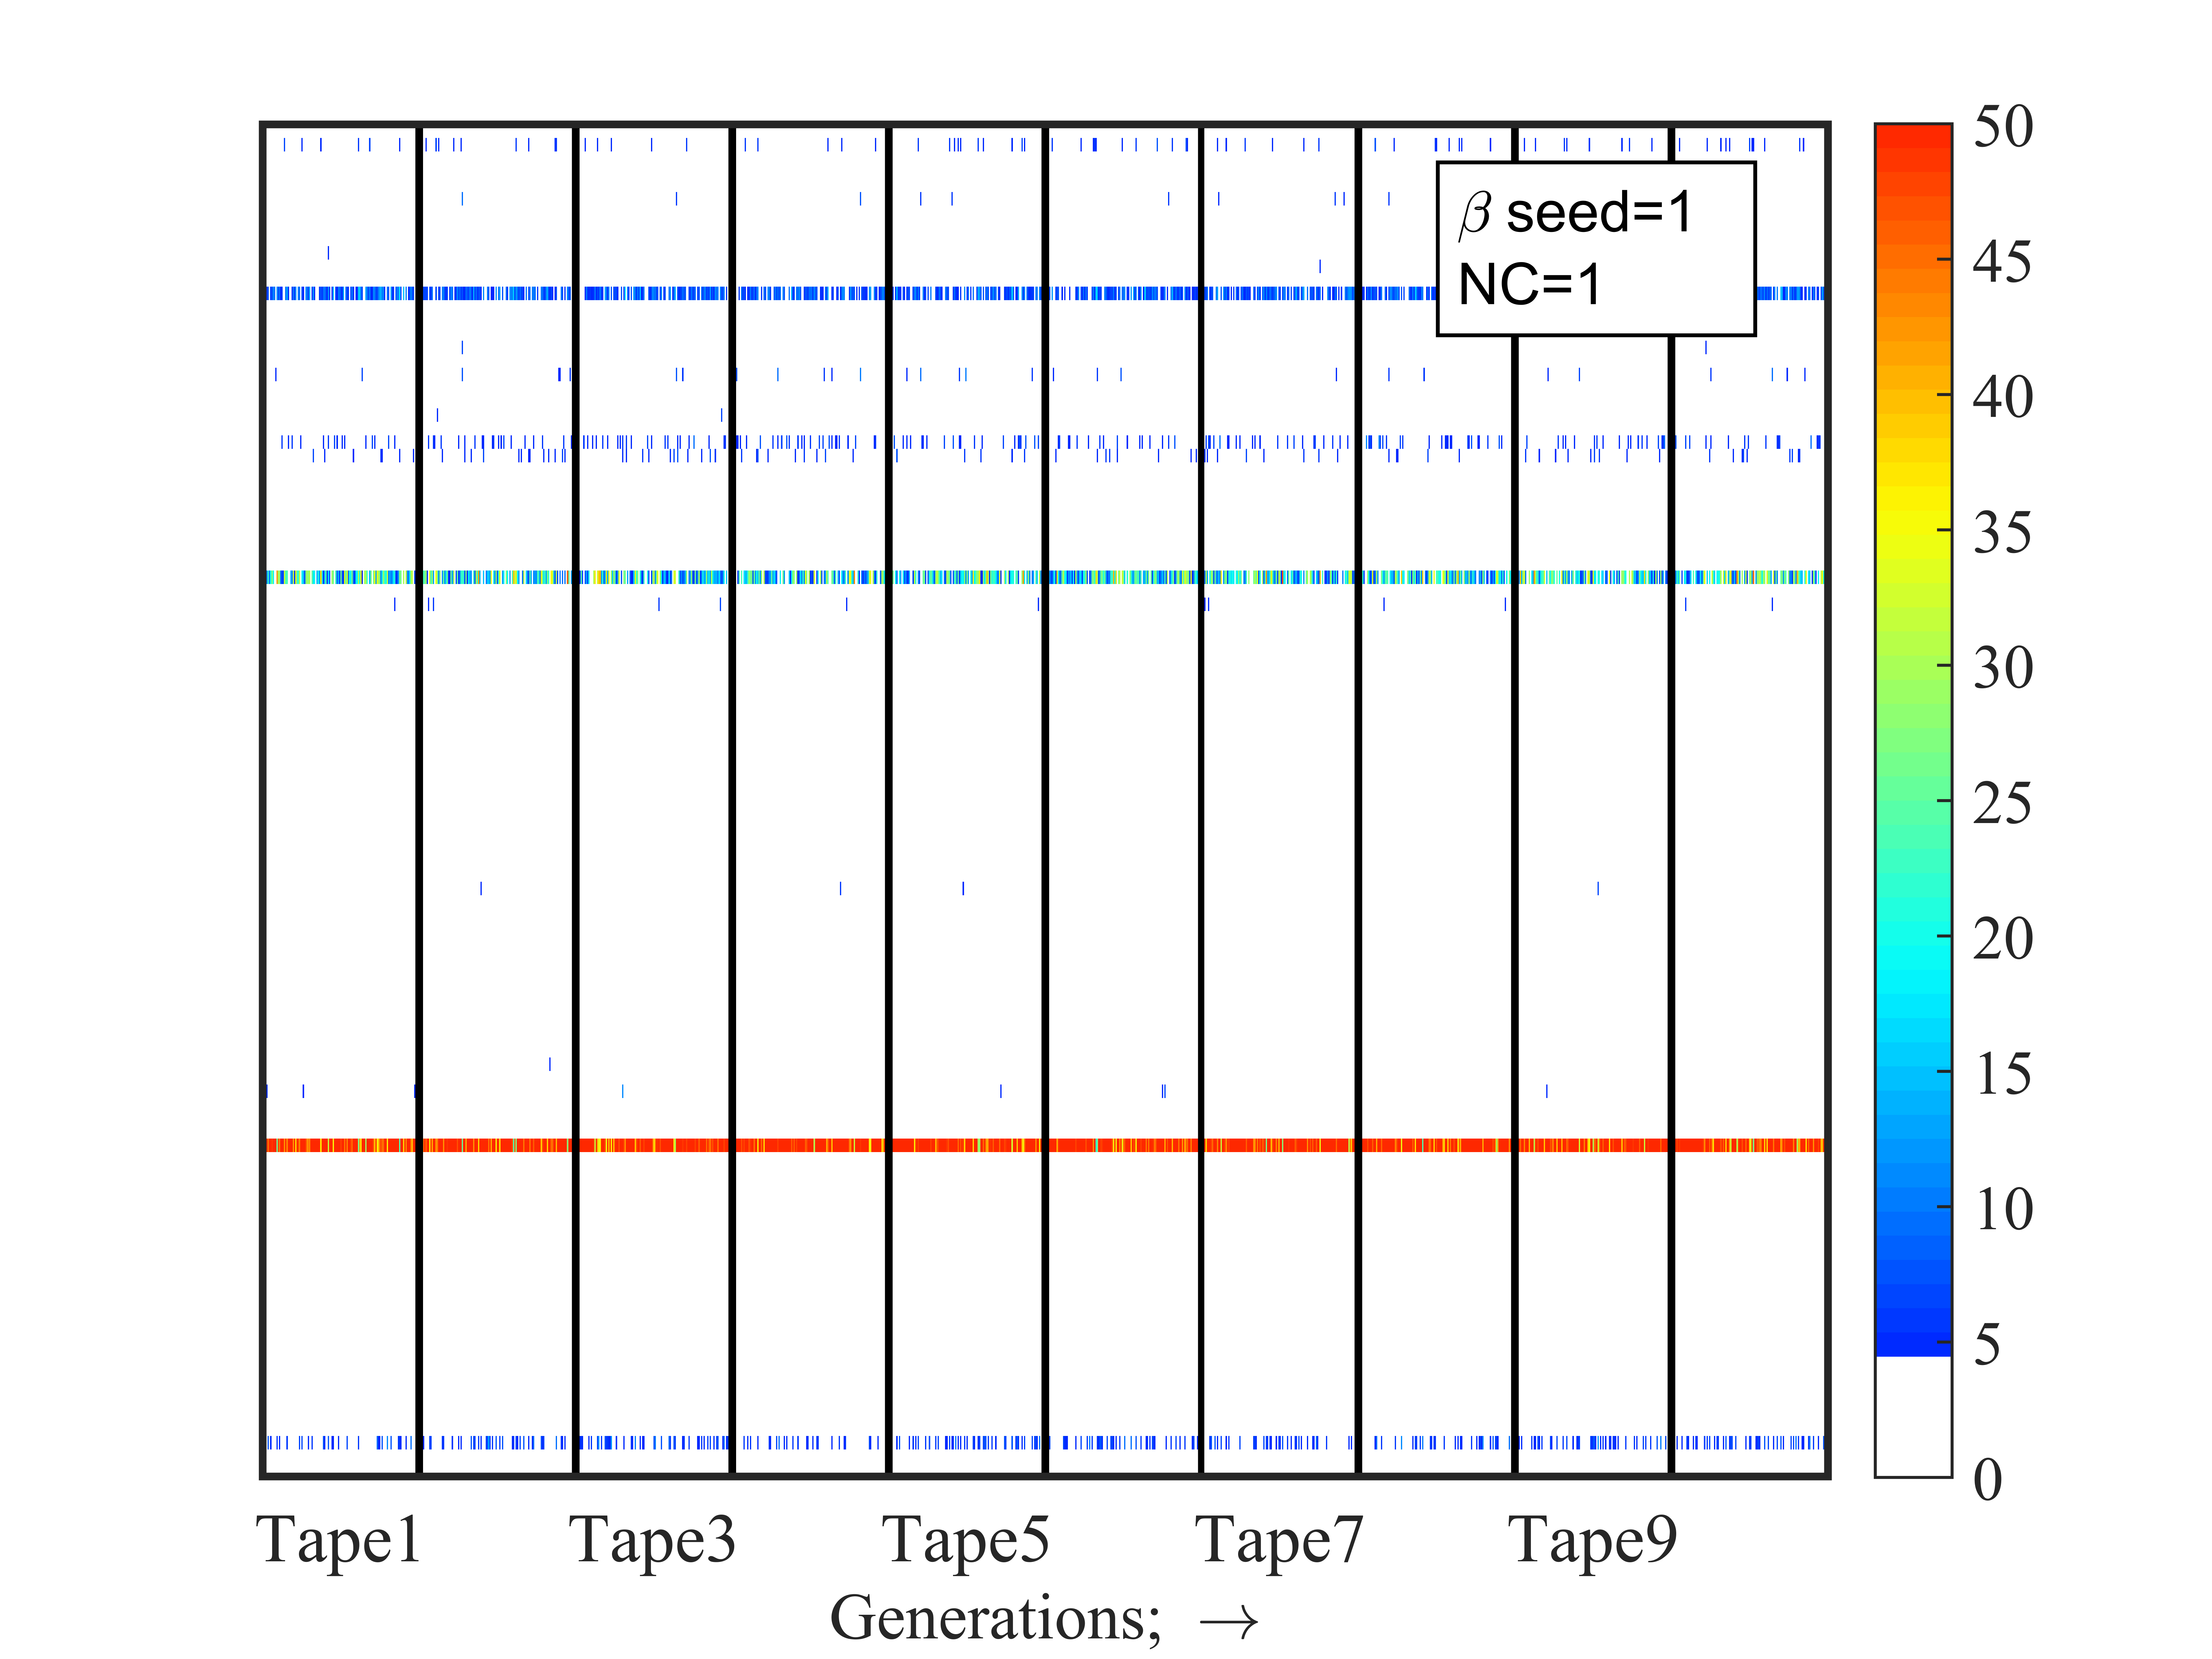
Examples of GARD simulations under different betas: (left) Density plot of distance and angle with respect to the eigenvector of the full-beta. Color is probability (log10 scale). (middle) Density plot of distance and angle with respect to the eigenvector of beta_C_pseudo. (right) Histories of different tapes. Color represents count within an assembly. {Details are as in Figure 3 in the main text}